

Highlights
-
•
Many movement behavior characteristics were associated with cardiometabolic risk.
-
•
Movement intensities were more consistently correlate with cardiometabolic risk.
-
•
Higher physical activity intensities were the strongest correlates of risk.
Keywords: Child, Physical activity, Risk factors, Sedentary behavior, Sleep
Abstract
Purpose
The purpose of this study was to determine which intensities, patterns, and types of 24-h movement behaviors are most strongly associated with cardiometabolic risk factors among children.
Methods
A total of 369 children aged 10–13 years were studied. Participants wore an Actical accelerometer and a Garmin Forerunner 220 Global Positioning System logger and completed an activity and sleep log for 7 days. Data from these instruments were combined to estimate average minute per day spent in 14 intensities, 11 types, and 14 patterns of movement. Body mass index, resting heart rate, and systolic blood pressure values were combined to create a cardiometabolic risk factor score. Partial least squares regression analysis was used to examine associations between the 39 movement behavior characteristics and the cardiometabolic risk factor score. The variable importance in projection (VIP) values were used to determine and rank important movement behavior characteristics. There was evidence of interaction by biological maturity, and the analyses were conducted separately in the 50% least mature and 50% most mature participants.
Results
For the least biologically mature participants, fifteen of the 39 movement behavior characteristics had important VIP value scores; eight of these reflected movement intensities (particularly moderate and vigorous intensities), six reflected movement patterns, and one reflected a movement type. For the most mature participants, thirteen of the 39 movement behavior characteristics had important VIP value scores, with five reflecting intensities (particularly moderate and vigorous intensities), five reflecting patterns, and three reflecting types of movement.
Conclusion
More than 12 movement behavior characteristics were associated with cardiometabolic risk factors within both the most and least mature participants. Movement intensities within the moderate and vigorous intensity ranges were the most consistent correlates of these risk factors.
Graphical abstract
1. Introduction
Sleep, sedentary behavior, and physical activity (PA) fall along a movement intensity continuum, and time spent in these movement behaviors comprise the full 24-h day.1, 2 These movement behaviors have important health implications for children. In fact, several intensities, types, and patterns of movement behaviors might influence the physical and mental health of young people.3, 4, 5
The intensity of movement is often categorized based on metabolic equivalents (METs), including sleep (1.0 MET), sedentary behavior (1.1–1.4 METs), light PA (LPA) (1.5–2.9 METs), moderate PA (3.0–5.9 METs), and vigorous PA (≥6.0 METs).6 Historically, research has focused on the health benefits of moderate-to-vigorous PA (MVPA), which for most children accounts for <5% of their time across the 24-h day.7 However, recent research has considered the movement behaviors that account for larger proportions of the day, including LPA (approximately 15% of the 24-h day), sedentary behavior (approximately 40% of the 24-h day), and sleep (approximately 40% of the 24-h day).1, 2, 7 When examined individually, sleep duration is favorably associated with adiposity4 and MVPA is associated with many health indicators.5 Conversely, the associations that LPA and sedentary behavior have with health indicators remain unclear because inconsistent findings have been reported.3, 5 Research that has used compositional analysis to collectively examine different movement intensities reports that, relative to the other movement intensities, time spent in MVPA and sleep are negatively associated with adiposity, whereas time spent in sedentary behavior and LPA are positively associated with adiposity.8, 9
Research has also considered whether different types of movement behaviors influence health. A large body of research on sedentary behavior suggests that excessive television (TV) viewing is detrimental to a child's cardiometabolic health and body composition; however, the effects of other screen-based behaviors (e.g., video games, computer use) and nonscreen sedentary behaviors (e.g., passive travel, sitting at school, and homework) are unclear.3 A recent study examining the independent associations between different types of PA and cardiometabolic risk factors found that only outdoor active play was associated with body fat and that only organized sport was associated with resting heart rate (HR).10
The patterns in which movement behaviors occur may also be important. Although several sleep patterns have been described in the literature, including sleep efficiency (e.g., percent of time in bed spent asleep),11 sleep chronology (e.g., timing of bedtime),12 and the day-to-day consistency of sleep duration12 and bedtime,13 it is unclear whether different sleep patterns influence a child's cardiometabolic health. Furthermore, it is unclear if sedentary behavior patterns, such as prolonged bouts of sedentary time, are associated with health indicators because previous studies have reported conflicting results.14, 15, 16 Conversely, studies have consistently found that PA accumulated in bouts (i.e., engaging in MVPA for ≥5 consecutive minutes) and PA accumulated in a sporadic or intermittent manner are similarly associated with cardiometabolic risk factors.16, 17
Although a vast literature has described the associations between movement behaviors and health indicators in children, it is difficult to disentangle the relative importance of different intensities, types, and patterns of movement behaviors because these characteristics have traditionally been studied in isolation and not collectively. For example, research has examined how PA intensity18 and PA patterns16, 17 are associated with cardiometabolic risk factors, but the influence of patterns has yet to be compared across the intensity spectrum. Therefore, it is difficult to determine which movement behavior characteristics have the greatest influence on children's health and which should be targeted in interventions aimed at optimizing health.
The purpose of this study was to collectively examine the associations between different intensities, patterns, and types of movement behaviors with cardiometabolic risk factors among children aged 10–13 years, and to rank the importance of these movement behavior characteristics based on the strength of the observed associations. We hypothesize that several movement behavior characteristics will be important correlates of cardiometabolic risk factors. The development of elevated cardiometabolic risk factors, such as high body fat, HR, and blood pressure, can occur in childhood19 and often track into adolescence20 and adulthood.21 Risk factors that are present during childhood also increase the probability of the child developing cardiovascular disease and diabetes later in life.22 Therefore, childhood is a critical time at which to study these risk factors.
2. Methods
2.1. Study design and population
Data are from the Active Play Study, a cross-sectional study of 459 children aged 10–13 years.9,23, 24, 25 Data were collected in Kingston, Ontario, Canada, between December 2015 and January 2016. To be eligible, children had to live and attend school in Kingston. Nonambulatory children were excluded. Participants were recruited through advertisements distributed in schools, community centers, and retail outlets, as well as through word of mouth and social media. Recruitment and participation in the study were balanced across age, sex, the 4 seasons, and Kingston's 12 electoral districts to ensure proportional representation across these strata. All participants, as well as a parent or guardian, provided written consent before participation. The study was approved by the General Research Ethics Board at Queen's University.
2.2. Movement behavior exposure measures
Movement behavior characteristics were assessed over 7 consecutive days using a combination of data from an Actical accelerometer (Philips Respironics, Murrysville, PA, USA), Garmin Forerunner 220 Global Positioning System (GPS) logger (Garmin Ltd., Schaffhausen, Switzerland), an activity and sleep log, and school calendars and schedules. Before the measurement period, participants were given verbal and written instructions on how to wear the accelerometer and GPS logger and how to complete the log. Participants wore the accelerometer on their right hip at all times except when engaged in water-based activities or bathing. The devices recorded data in 15-s epochs starting at midnight on the first measurement day. Participants wore the GPS logger, which was embedded in a wristwatch, during waking hours. It recorded their geographic location every 2 s to 2 min, depending on satellite signal availability. The device has a usual accuracy of 5–10 m for measuring geographic positions. Participants were asked to put the GPS logger on soon after waking and to wear it continuously until bedtime, when they removed it for charging overnight. Participants used a log to record the time at which they got out of bed in the morning and went to bed at night; the start times, end times, and types of organized sports activities they participated in; the time they spent completing outdoor work or chores; and the times when they removed the GPS logger or accelerometer. With the help of a parent, participants indicated on a questionnaire the start times and end times of their school day and the start times and end times of their recess periods. School websites were checked to determine school and nonschool days.
Table 1 lists all of the movement behavior characteristics that were measured in this study and the data sources that were used to assess each characteristic. More detail on the measurement approaches is provided in Sections 2.3, 2.4, and 2.5.
Table 1.
The 39 movement behavior characteristics and the data sources used to measure them.
| Movement behavior characteristic | Data source |
|---|---|
| Intensities of movement behaviors | |
| Sleep | Activity log |
| Sedentary 1 (<1.25 METs) | Accelerometer |
| Sedentary 2 (1.25–1.49 METs) | Accelerometer |
| Light 1 (1.50–1.99 METs) | Accelerometer |
| Light 2 (2.00–2.49 METs) | Accelerometer |
| Light 3 (2.50–2.99 METs) | Accelerometer |
| Moderate 1 (3.00–3.49 METs) | Accelerometer |
| Moderate 2 (3.50–3.99 METs) | Accelerometer |
| Moderate 3 (4.00–4.49 METs) | Accelerometer |
| Moderate 4 (4.50–4.99 METs) | Accelerometer |
| Moderate 5 (5.00–5.49 METs) | Accelerometer |
| Moderate 6 (5.50–5.99 METs) | Accelerometer |
| Vigorous 1 (6.00–6.49 METs) | Accelerometer |
| Vigorous 2 (≥6.50 METs) | Accelerometer |
| Types of sedentary behavior | |
| Homework | Child questionnaire |
| Passive travel | GPS logger |
| Passive curriculum time | Accelerometer, school schedules |
| TV, videos, movies | Child questionnaire |
| Sedentary video games | Child questionnaire |
| Using Internet for other purposes | Child questionnaire |
| Types of PA | |
| Organized sport | Activity log |
| Active travel | GPS logger |
| Curriculum-based PA | Accelerometer, school schedules |
| Outdoor active play | Accelerometer, GPS logger, school schedules, activity log |
| Work and chores | Activity log |
| Patterns of sleep | |
| Sleep efficiency | Accelerometer, activity log |
| Sleep midpoint | Activity log |
| Bedtime consistency | Activity log |
| Sleep duration consistency | Activity log |
| Patterns of sedentary behavior | |
| Nonbouted sedentary behavior | Accelerometer |
| 5–9-min sedentary bouts | Accelerometer |
| 10–19-min sedentary bouts | Accelerometer |
| 20–29-min sedentary bouts | Accelerometer |
| ≥30-min sedentary bouts | Accelerometer |
| Patterns of PA | |
| Bouted MVPA | Accelerometer |
| Embedded MVPA | Accelerometer |
| Sporadic MVPA | Accelerometer |
| Bouted LPA | Accelerometer |
| Sporadic LPA | Accelerometer |
Abbreviations: GPS = global positioning system; LPA = light physical activity; METs = metabolic equivalents; MVPA = moderate-to-vigorous physical activity; PA = physical activity.
2.3. Determining time spent in different intensities of movement
Sleep duration (average minute per day) was determined as the difference between the bedtimes and wake times recorded on the log. The recorded times were verified manually, and corrected as necessary, by visually inspecting the recorded log times against the accelerometer data. This verification/correction process has high reliability in our laboratory; 90% of repeated assessments were within 10 min of each other.25
Times spent in sedentary behavior and different intensities of PA during nonsleep periods were determined using accelerometer data. Accelerometer epoch data were imported into SAS software (Version 9.4; SAS Inc., Cary, NC, USA) and merged with the wake times and bedtimes. All epochs that occurred during periods of sleep were flagged and removed. Nonwear time, defined as ≥60 consecutive min of 0 epoch counts, with an allowance of 2-min of counts between 0 and 100, was identified and removed, as was nonwear time recorded on the log.26 Days with <10 h of wear time during waking hours were removed, and all accelerometer data from participants with <4 valid days were removed.26
Each of the remaining epochs was then categorized into 1 of 11 narrow intensity intervals. We chose to use these narrow intensity intervals rather than the 4 much wider intensity intervals that are traditionally considered (i.e., sedentary behavior, LPA, moderate PA, and vigorous PA) because we wanted to ensure that the specific effects of different intensities would not be masked by grouping the intensities into larger ranges. Additionally, the comparison of findings across studies regarding the specific effects of movement intensity is hindered by the variability of cut-points used to define these 3 traditional intensity categories, and this can be overcome by analyzing the intensity spectrum as a whole. The cut-points we used to classify the epochs into the 13 intensity intervals were determined using an equation developed by Payau et al.,27 who compared accelerometer counts with energy expenditure determined using indirect calorimetry. We used this equation to develop 13 categories with a small range corresponding to the following MET values: <1.25 (0–4 counts/min), 1.25–1.49 (5–88 counts/min), 1.50–1.99 (89–412 counts/min), 2.00–2.49 (413–875 counts/min), 2.50–2.99 (876–1447 counts/min), 3.00–3.49 (1448–2111 counts/min), 3.50–3.99 (2112–2857 counts/min), 4.00–4.49 (2858–3677 counts/min), 4.50–4.99 (3678–4567 counts/min), 5.00–5.49 (4568–5521 counts/min), 5.50–5.99 (5522–6535 counts/min), 6.00–6.49 (6536–7608 counts/min), and ≥6.50 (≥7609 counts/min). The average daily total time (min/day) spent in each intensity was calculated by summing the epochs for that range and averaging across all valid measurement days.
2.4. Determining time spent in different types of movement
2.4.1. Types of sedentary behavior
The following types of sedentary behavior were considered: passive curriculum time; passive (vehicle) travel; homework; watching programs, videos, or movies; playing sedentary video games; and using electronic devices for other purposes (e.g., Facebook, browsing the web).
Curriculum time spent in predominately sedentary subject areas (e.g., math, science, and reading) was determined by subtracting curriculum-based PA time and recess time from the total time at school. Passive travel time was determined using the GPS logger data in Personal Activity and Location Measurement System (PALMS) software (Centre for Wireless and Population Health Systems, University of California, San Diego, CA, USA) and the vehicle trips identified in the software.28 Time spent in the remaining types of sedentary behavior was determined by questionnaire. Time spent doing homework was assessed with the following item: “How much time do you usually spend doing your homework after each day of school?” Recreational screen time was assessed with the following 3 items: “How many hours a day, in your free time, do you usually spend watching TV, videos (including YouTube or similar services), DVDs, and other entertainment on a screen?”, “How many hours a day, in your free time, do you usually spend playing games on a computer, games console, tablet (like iPad), smartphone, or other electronic device (not including moving or fitness games)?”, and “How many hours a day, in your free time, do you usually spend using electronic devices such as computers, tablets (like iPad), or smartphones for other purposes (e.g., emailing, tweeting, Facebook, chatting, surfing the Internet)?” For the screen-time items, separate response options were provided for weekdays and the weekend, and a daily average was calculated. The test–retest reliability of these items was determined in a sample of 52 participants who completed the questionnaire twice separated by 8–10 days. The intra-class correlation between the repeated responses indicated good to excellent agreement, with values of 0.89 for homework and 0.81 for TV on weekdays, 0.64 for TV on weekends, 0.86 for video games on weekdays, 0.82 for video games on weekends, 0.84 for Internet use on weekdays, and 0.78 for Internet use on weekends.
2.4.2. Types of PA
Time spent in the following types of PA were considered: organized sport, active transportation, outdoor active play, curriculum-based PA at school (e.g., physical education class, daily PA class), and work or chores. The methodological approach used to determine average minutes per day in these different types of PA is explained in detail elsewhere.24 Briefly, the approach uses a combination of data from the accelerometer, GPS logger mapped onto geospatial data, activity log, and school schedules, all of which were merged and processed using several manual checks and automated (e.g., algorithms) procedures. Several software packages were used, including Actical accelerometer (Version 3.10; Philips Respironics), PALMS software (Center for Wireless and Population Health Systems), Google Maps (Google, Mountain View, CA, USA), ArcMap (Version 10.4; Esri, Redlands, CA, USA), and SAS Version 9.4 (SAS Inc.).
Time spent in organized sport was determined by flagging all the 15-s accelerometer epochs that occurred during the times on the activity log where the children recorded that they were participating in an organized sport. Time spent completing work and chores were also determined from the times on the activity log where the children recorded that they were completing chores. Time spent in active travel was identified using the PALMS software, which merged the data from the accelerometer and GPS logger and used a validated algorithm to identify the starting and end point of trips that covered ≥100 m with a speed of ≥1 km/h of ≥3 min in duration, and then distinguished active trips (e.g., walking, bicycling) from passive trips (e.g., vehicle) based on the speed of the trip.23, 28 Time spent in curriculum-based PA was determined using school schedules and the accelerometer data. Initially, accelerometer epochs that occurred during school curriculum time on school days, but not during scheduled recess time, were flagged. We then used an algorithm to determine which of these flagged epochs occurred during a PA session, such as during a physical education class or daily PA session. This algorithm has a sensitivity of 78% and a specificity of 92%.24 Finally, to identify outdoor active play we started by identifying all epochs where ≥1 of the following conditions was met: (1) sleep, (2) indoors (based on geographic information system (GIS) data linked with GPS data), (3) school curriculum (but not recess time) or day camp, (4) active or passive travel, (5) organized sport, or (6) work/chores. The remaining epochs were then classified as either outdoor active play or outdoor sedentary time using an algorithm that has a specificity of 85%, a sensitivity of 85%, and a positive predictive value of 99%.24
2.5. Determining time spent in different patterns of movement
Movement patterns for sleep, sedentary behavior, and PA were determined using data from the accelerometer. The first step of this process was to categorize epochs that occurred during waking hours into 3 intensities using established cut-points: sedentary behavior (<100 counts/min), LPA (100–1499 counts/min), and MVPA (>1499 counts/min).29 The 14 patterns we chose to examine were selected based on what has previously been examined in the literature.
2.5.1. Patterns of sleep
Sleep efficiency (%) was used as a measure of sleep quality and was calculated as the ratio of total sleep time to time in bed.30, 31 Time in bed (h/day) was calculated using the bedtimes and wake times recorded on the log. To determine the time spent sleeping, each of the 15-s epochs was defined as either sleeping or awake based on a sleep likelihood score, which was determined from a weighted rolling average count value for the epoch in question and the 8 epochs that proceeded it and followed it.32 The sleeping epochs were summed to determine the total sleep time.
Sleep chronology was determined using the sleep midpoint, which was calculated as the midpoint between the average bedtimes and wake times.33 Two measures of sleep consistency were determined, namely, sleep duration consistency and bedtime consistency. Sleep duration consistency was calculated as the average difference in sleep duration each night from the mean sleep duration over the 7 nights. Bedtime consistency was calculated as the average difference in bedtime each night from the mean bedtime over the 7 nights.
2.5.2. Patterns of sedentary behavior
Sedentary bouts lasting ≥5 min, 10 min, 20 min, or 30 min were identified, along with nonbouted sedentary behavior (i.e., sedentary behavior that does not meet the criteria for a 5-min bout). A sedentary bout was defined as a period of consecutive minutes of <100 accelerometer counts per minute, with no tolerance for epochs exceeding the sedentary threshold within a bout.34 Time spent in the 4 lengths of sedentary bouts were calculated as sedentary time (min/day) accumulated in bouts lasting 5.00–9.99 min, 10.00–19.99 min, 20.00–29.99 min, or ≥30.00 min. All sedentary behavior that was not classified within these bout lengths was summed to determine the time spent in nonbouted sedentary behavior.
2.5.3. Patterns of PA
Bouts of MVPA and then bouts of LPA were identified in the nonsleep accelerometer data as periods of ≥10.0 consecutive minutes, where the accelerometer counts exceed the threshold for MVPA and LPA, respectively, with an allowance of 20% of the counts (e.g., 2 min for a 10-min bout) being below the threshold.35 Next, embedded MVPA was identified as MVPA within bouts of primarily LPA.36 After the bouted and embedded PA patterns were identified, within the remaining accelerometer data sporadic LPA and sporadic MVPA were identified as time spent above the respective movement intensity cut-points.
2.6. Cardiometabolic risk factors
Noninvasive cardiometabolic risk factors were measured, including the body mass index (BMI), systolic blood pressure, and resting HR. Height was measured to the nearest 0.1 cm using a portable stadiometer (Seca model 213, Seca GmbH & Co., Hamburg, Germany), and weight was measured to the nearest 0.1 kg using an electronic scale (Tanita BF-689; Tanita Inc., Tokyo, Japan). BMI was calculated as weight in kilograms divided by height in meters squared. The BPTrue BPM-200 automated blood pressure monitor (Bayside Medical Supplies, Hawkestone, Ontario, Canada) was used to measure systolic blood pressure and resting HR. A total of 6 readings were obtained after a 5-min rest, and the average of the last 5 readings was used. Internalized age and sex-specific z-scores were determined for each of the 3 risk factors. A composite cardiometabolic risk factor score was then calculated as the mean of the 3 z-scores.
2.7. Covariates
Covariates considered in the analyses included chronological age, biological maturation based on difference from peak height velocity,37 biological sex, race (white or other, including mixed race), annual family income (CAD ≤50,000, 50,001–100,000, or ≥100,001), frequency of fast food consumption (rarely, 2–3 times/month, or ≥1 time/week), frequency of snacking while engaging in screen-based activities (continuous), and season of data collection.
2.8. Statistical analysis
Statistical analyses were conducted using XLSTAT (Addinsoft, Long Island City, NY, USA). Conventional descriptive statistics were used to describe the sample. Preliminary analyses revealed that the main results were similar in boys and girls but differed based on biological maturation. Therefore, analyses were stratified into the least and most biologically mature groups; group assignment was based on the median peak height velocity value to create 2 equally sized groups. χ2 tests were used to compare the demographic statistics between the least 50% and most 50% biologically mature participants and t tests were used to compare the cardiometabolic risk factors between these 2 groups.
Partial least squares (PLS) regression was used to examine the relationships between movement behavior characteristics and the cardiometabolic risk factor score.38 PLS was designed to be used with multiple predictor variables that are highly correlated. It was the appropriate choice for this study given the number and dependency of the 39 movement behavior characteristics. All of the variables were centered and standardized to unit variance before PLS. PLS transforms predictors into a set of k (k < n) uncorrelated predictors using principal components analysis, and decomposes the exposure variables into orthogonal linear components while simultaneously maximizing the covariance with the outcome variable.39 Cross-validation was used for optimizing the predictive performance of the model using jackknifing.40 The predictive performance was then used as a criterion to determine the number of factors to extract. The variable of importance in the projection (VIP) statistic was calculated and then used to determine the relative contribution of predictors within the components. Because there is no statistical test that directly compares the VIP scores for different variables, our assessments were based on which movement behavior variables had VIP scores ≥1 because these scores are considered important in the projection41 and by a simple ranking of variables based on their VIP scores.
3. Results
A total of 369 participants had complete data for all study variables and were included in the analysis. A total of 89 participants were excluded from the original sample of 458 owing to insufficient accelerometer and/or GPS data needed to measure some of the movement behavior characteristics. The participants included in the final analysis were not significantly different from the excluded participants for any of the sociodemographic characteristics or cardiometabolic risk factors measured.
Descriptive characteristics of the 369 participants included in the final analyses are provided in Table 2. Approximately one-half of the participants were boys, and participants were evenly distributed across ages 10–13 years. The majority were of white race and were in a family whose income was more than CAD 50,000 per year. A greater proportion of the most biologically mature participants were girls. Table 3 provides descriptive information on the movement behavior characteristics. Because many of these variables had a skewed distribution, they are presented as medians and interquartile ranges.
Table 2.
Descriptive characteristics of participants.
| Variable | Total (n = 369) |
Least maturea (n = 184) |
Most mature (n = 185) |
p for maturation comparison |
|---|---|---|---|---|
| Age (year) | <0.01 | |||
| 10 | 89 (24) | 80 (43) | 9 (5) | |
| 11 | 92 (25) | 57 (31) | 35 (19) | |
| 12 | 100 (27) | 37 (20) | 63 (34) | |
| 13 | 88 (24) | 10 (5) | 78 (42) | |
| Sex | <0.01 | |||
| Boys | 186 (50) | 143 (78) | 43 (23) | |
| Girls | 183 (50) | 41 (22) | 142 (77) | |
| Race | 0.07 | |||
| White | 321 (87) | 166 (90) | 155 (84) | |
| Non-white | 48 (13) | 18 (10) | 30 (16) | |
| Family income (CAD/year) | 0.50 | |||
| ≤50,000 | 50 (14) | 25 (14) | 25 (13) | |
| 50,001–100,000 | 105 (28) | 46 (25) | 59 (32) | |
| ≥100,001 | 170 (46) | 89 (48) | 81 (44) | |
| Prefer not to say | 44 (12) | 24 (13) | 20 (11) | |
| Cardiometabolic risk factors | ||||
| Body mass index (kg/m2) | 19.1 ± 3.4 | 17.8 ± 2.8 | 20.4 ± 3.5 | <0.01 |
| Systolic blood pressure (mmHg) | 96.1 ± 8.0 | 93.7 ± 7.1 | 98.6 ± 8.1 | <0.01 |
| Resting heart rate (bmp) | 80.3 ± 11.2 | 80.1 ± 10.4 | 80.5 ± 11.9 | 0.74 |
| Cardiometabolic risk factor z-score | 0.0 ± 0.7 | −0.1 ± 0.6 | 0.1 ± 0.8 | <0.01 |
Note: Categorical variables are presented as n (%) and continuous variables are presented as mean ± SD.
Percentages for age variable may not add up to 100% due to rounding. Abbreviation: bmp = beat per minute.
Table 3.
Descriptive data on the movement behavior characteristics (min/day)
| Movement behavior characteristic | Total (n = 369) |
Least mature (n = 184) |
Most mature (n = 185) |
p for maturation comparison |
|---|---|---|---|---|
| Intensities of movement behaviors | ||||
| Sleep | 568 (541, 594) | 580 (549, 603) | 556 (535, 585) | <0.01 |
| Sedentary behavior | 572 (533, 611) | 552 (516, 596) | 589 (552, 627) | <0.01 |
| LPA | 159 (141, 182) | 164 (147, 186) | 154 (133, 176) | <0.01 |
| MPA | 48 (38, 62) | 54 (42, 70) | 45 (36, 56) | <0.01 |
| VPA | 3 (1, 6) | 4 (2, 7) | 2 (1, 4) | <0.01 |
| Types of sedentary behavior | ||||
| Homework | 21 (0, 43) | 11 (0, 21) | 21 (11, 43) | <0.01 |
| Passive travel | 39 (22, 60) | 39 (22, 62) | 39 (22, 59) | 0.10 |
| Passive curriculum time | 198 (168, 223) | 198 (170, 222) | 197 (166, 223) | 0.84 |
| TV, videos, movies | 94 (39, 154) | 77 (39, 154) | 94 (56, 171) | 0.19 |
| Sedentary video games | 60 (34, 129) | 58 (32, 116) | 60 (34, 137) | 0.45 |
| Using Internet for other purposes | 39 (30, 103) | 39 (17, 94) | 60 (30, 120) | <0.01 |
| Types of PA | ||||
| Organized sport | 17 (0, 41) | 15 (0, 34) | 20 (0, 45) | 0.16 |
| Active travel | 9 (3, 17) | 8 (3, 17) | 10 (4, 18) | 0.37 |
| Curriculum-based PA | 18 (8, 31) | 18 (9, 33) | 19 (6, 28) | 0.27 |
| Outdoor active play | 31 (16, 53) | 43 (23, 63) | 22 (13, 38) | <0.01 |
| Work and chores | 0 (0, 3) | 0 (0, 3) | 0 (0, 2) | 0.78 |
| Patterns of sleep | ||||
| Sleep efficiencya | 90 (85, 93) | 90 (86, 93) | 89 (85, 93) | 0.06 |
| Sleep midpointb | 02:46 (02:24, 03:13) | 02:33 (02:16, 03:00) | 03:00 (02:35, 03:29) | <0.01 |
| Bedtime consistency | 31 (22, 43) | 28 (21, 39) | 35 (23, 45) | <0.01 |
| Sleep duration consistency | 35 (25, 48) | 34 (24, 45) | 37 (28, 51) | 0.01 |
| Patterns of sedentary behavior | ||||
| Nonbouted sedentary behavior | 202 (179, 225) | 202 (180, 224) | 203 (176, 226) | 0.76 |
| 5–9-min sedentary bouts | 106 (95, 121) | 105 (95, 120) | 107 (96, 122) | 0.30 |
| 10–19-min sedentary bouts | 127 (111, 144) | 123 (106, 140) | 129 (116, 151) | <0.01 |
| 20–29-min sedentary bouts | 63 (48, 80) | 56 (45, 78) | 66 (52, 82) | <0.01 |
| ≥30-min sedentary bouts | 60 (40, 91) | 52 (33, 76) | 72 (46, 105) | <0.01 |
| Patterns of PA | ||||
| Bouted MVPA | 9 (3, 18) | 12 (4, 23) | 8 (3, 14) | <0.01 |
| Embedded MVPA | 25 (17, 35) | 30 (20, 38) | 23 (15, 30) | <0.01 |
| Sporadic MVPA | 15 (12, 19) | 15 (12, 18) | 16 (13, 20) | 0.14 |
| Bouted LPA | 53 (37, 72) | 61 (44, 76) | 45 (31, 62) | <0.01 |
| Sporadic LPA | 106 (94, 118) | 105 (93, 118) | 106 (94, 119) | 0.38 |
Note: Data are presented as median (25th percentile, 75th percentile).
sleep efficiency is presented as %.
sleep midpoint is presented as h:min. Abbreviations: LPA = light physical activity; MPA = moderate physical activity; PA = physical activity; MVPA = moderate-to-vigorous physical activity; TV = television; VPA = vigorous physical activity.
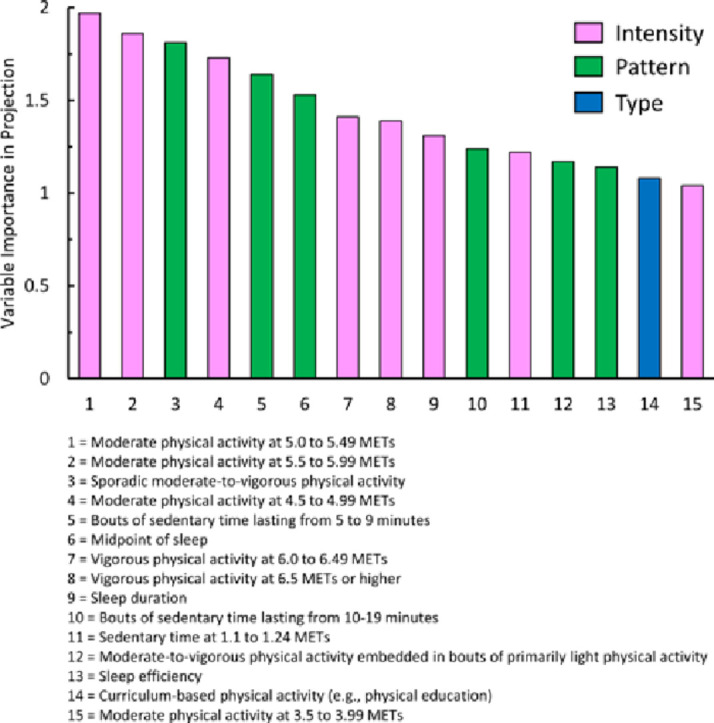
Initially, PLS analyses were conducted using the 39 movement behavior characteristics but excluding the 7 covariates. These analyses revealed that there was a single major component in both maturation groups. This component explained 6% of the variance in the cardiometabolic risk factor score among the least mature group and 12% among the most mature group. The VIP scores for the movement behavior characteristics with important VIP values (i.e., values ≥1) are shown in Fig. 1 (least mature) and Fig. 2 (most mature). The “+” and “–” signs in the figures indicate the direction of the associations. The VIP scores for all 39 movement behavior characteristics are provided in Table 4; the variables with important VIP values are highlighted in bold.
Fig. 1.

Fifteen movement behavior characteristics with important VIP values for the least mature participants. The 15 characteristics are presented from left to right in order of importance based on a ranking of the VIP values. The “+” and “–” signs on top of each bar indicate the direction of the association. MVPA = moderate-to-vigorous physical activity; PA = physical activity; SED = sedentary; VIP = variables of importance in projection.
Fig. 2.

Thirteen movement behavior characteristics with important VIP values for the most mature participants. The 13 characteristics are presented from left to right in order of importance based on a ranking of the VIP values. The “+” and “–” signs on top of each bar indicate the direction of the association. MVPA = moderate-to-vigorous physical activity; PA = physical activity; SED = sedentary; TV = television; VIP = variables of importance in projection.
Table 4.
VIP for the least and most mature participants for all 39 intensities, types, and patterns of movement.
| Movement behavior characteristic | Least mature participants |
Most mature participants |
||
|---|---|---|---|---|
| VIP score (95%CI) | Direction of association | VIP score (95%CI) | Direction of association | |
| Intensities of movement behaviors | ||||
| Sleep | 1.31 (–0.30 to 2.91) | − | 0.41 (–0.49 to 1.31) | − |
| Sedentary 1 (<1.25 METs) | 1.22 (0.23 to 2.21) | + | 1.16 (0.44 to 1.88) | + |
| Sedentary 2 (1.25–1.49 METs) | 0.89 (–0.66 to 2.44) | − | 0.81 (–0.04 to 1.65) | − |
| Light 1 (1.50–1.99 METs) | 0.21 (–0.90 to 1.31) | − | 0.87 (–0.22 to 1.97) | − |
| Light 2 (2.00–2.49 METs) | 0.49 (–1.26 to 2.24) | + | 0.43 (–0.95 to 1.81) | − |
| Light 3 (2.50–2.99 METs) | 0.10 (–1.14 to 1.33) | + | 0.95 (–0.10 to 2.00) | − |
| Moderate 1 (3.00–3.49 METs) | 0.85 (–0.56 to 2.25) | − | 1.20 (0.49 to 1.92) | − |
| Moderate 2 (3.50–3.99 METs) | 1.04 (−0.26 to 2.33) | − | 0.92 (–0.06 to 1.90) | − |
| Moderate 3 (4.00–4.49 METs) | 0.90 (–0.53 to 2.33) | − | 0.76 (–0.14 to 1.66) | − |
| Moderate 4 (4.50–4.99 METs) | 1.73 (0.87 to 2.60) | − | 0.97 (0.16 to 1.79) | − |
| Moderate 5 (5.00–5.49 METs) | 1.97 (1.35 to 2.58) | − | 1.40 (0.83 to 1.96) | − |
| Moderate 6 (5.50–5.99 METs) | 1.86 (1.45 to 2.27) | − | 1.78 (1.10 to 2.46) | − |
| Vigorous 1 (6.00–6.49 METs) | 1.41 (0.70 to 2.12) | − | 1.39 (0.88 to 1.90) | − |
| Vigorous 2 (≥6.50 METs) | 1.39 (0.08 to 2.70) | − | 0.81 (0.13 to 1.48) | − |
| Types of sedentary behavior | ||||
| Homework | 0.08 (–1.32 to 1.48) | − | 0.02 (–0.42 to 0.46) | − |
| Passive travel | 0.66 (–1.37 to 2.69) | − | 1.77 (1.34 to 2.21) | − |
| Passive curriculum time | 0.36 (–1.11 to 1.83) | − | 0.16 (–0.65 to 0.98) | − |
| TV, videos, movies | 0.14 (–1.24 to 1.51) | + | 1.65 (–0.18 to 3.47) | + |
| Sedentary video games | 0.99 (–1.18 to 3.17) | + | 0.80 (–0.92 to 2.52) | + |
| Using Internet for other purposes | 0.46 (–2.70 to 3.61) | − | 0.95 (–0.50 to 2.39) | + |
| Types of PA | ||||
| Organized sports | 0.83 (–0.05 to 1.71) | − | 1.51 (0.22 to 2.81) | − |
| Active travel | 0.02 (–0.98 to 1.02) | + | 0.03 (–0.65 to 0.71) | + |
| Curriculum-based PA | 1.08 (–0.09 to 2.25) | − | 0.03 (–0.56 to 0.62) | + |
| Outdoor active play | 0.01 (–1.19 to 1.22) | + | 0.82 (–0.13 to 1.77) | − |
| Work and chores | 0.61 (–0.50 to 1.71) | + | 0.42 (–0.69 to 1.52) | + |
| Patterns of sleep | ||||
| Sleep efficiency | 1.14 (–0.30 to 2.58) | − | 0.79 (0.05 to 1.53) | − |
| Sleep midpoint | 1.53 (–0.77 to 3.84) | + | 1.55 (0.50 to 2.59) | + |
| Bedtime consistency | 0.13 (–0.98 to 1.25) | + | 0.34 (–0.51 to 1.19) | + |
| Sleep duration consistency | 0.34 (–1.56 to 2.24) | − | 0.59 (–0.55 to 1.72) | + |
| Patterns of sedentary behavior | ||||
| Nonbouted sedentary behavior | 0.47 (–0.97 to 1.92) | − | 0.72 (–0.65 to 2.10) | − |
| 5–9-min sedentary bouts | 1.64 (–0.06 to 3.35) | + | 0.41 (–0.83 to 1.65) | + |
| 10–19-min sedentary bouts | 1.24 (–0.08 to 2.56) | + | 1.31 (0.25 to 2.38) | + |
| 20–29-min sedentary bouts | 0.08 (–0.71 to 0.87) | + | 0.72 (–0.61 to 2.05) | + |
| ≥30-min sedentary bouts | 0.51 (–0.74 to 1.76) | + | 0.56 (–0.45 to 1.56) | + |
| Patterns of PA | ||||
| Bouted MVPA | 0.73 (–0.42 to 1.88) | − | 0.27 (–0.62 to 1.16) | − |
| Embedded MVPA | 1.17 (–0.53 to 2.87) | − | 1.17 (0.70 to 1.65) | − |
| Sporadic MVPA | 1.81 (–0.51 to 4.13) | − | 1.78 (0.92 to 2.64) | − |
| Bouted LPA | 0.22 (–0.60 to 1.03) | − | 1.24 (0.64 to 1.84) | − |
| Sporadic LPA | 0.33 (–0.96 to 1.62) | + | 0.11 (–1.08 to 1.31) | + |
Note: The variable with important VIP values is highlighted in bold.
Abbreviations: 95%CI = 95% confidence interval; LPA = light physical activity; MPA = moderate physical activity; PA = physical activity; METs = metabolic equivalents; MVPA = moderate-to-vigorous physical activity; TV = television; VIP = variables of importance in projection.
For the least mature group, fifteen of the 39 movement behavior characteristics had important VIP scores (Fig. 1). Of these 15 characteristics, eight reflected intensities of movement, six reflected patterns of movement, and one reflected a type of movement. Of the 8 important intensities of movement, including the two with the highest rankings, six reflected intensities in the moderate or vigorous intensity range. Of the 6 important patterns of movement, two reflected patterns of sleep, two reflected patterns of sedentary behavior, and two reflected patterns of PA. Curriculum-based PA was the only type of movement with an important VIP value.
For the most mature group, thirteen of the 39 movement behavior characteristics had important VIP scores (Fig. 2). Of these 13 characteristics, five reflected intensities of movement, five reflected patterns of movement, and three reflected types of movement. Of the five important intensities, four reflected intensities in the moderate or vigorous range, and the fifth reflected the most sedentary intensity range. Of the 5 important patterns of movement, one reflected a pattern of sleep, one reflected a pattern of sedentary behavior, and three reflected patterns of PA. Of the 3 important types of movement, two reflected types of sedentary behavior (passive travel; watching TV, videos, or movies) and one reflected a type of PA (organized sport).
Additional PLS analyses indicated that inclusion of the covariates in addition to the 39 movement behavior characteristics did not change either the movement behavior characteristics had important VIP values or the ranking of the VIP values for the movement behavior characteristic.
4. Discussion
This study examined associations between various intensities, patterns, and types of movement behaviors with cardiometabolic risk factors among children. One of the key findings was that several movement behavior characteristics were important correlates of the cardiometabolic risk score. Collectively, characteristics that reflect intensities of movement had higher rankings, especially within the least mature group. The majority of the intensity characteristics with important rankings reflected intensities in the moderate or vigorous intensity range.
We are unaware of prior studies that collectively examined which of these many different intensities, types, and patterns of movement most strongly relate to cardiometabolic risk factors or other health indicators in children. Thus, our study provides novel findings that cannot be directly compared with the findings in the previous literature. The discussion of how our findings relate to the existing literature is therefore limited to the findings of studies that have considered the importance of individual movement behavior characteristics.
In our study, the relationship between the intensity of movement and the cardiometabolic risk factor score followed a J-shaped pattern. Specifically, intensities at the lowest end of the intensity spectrum (i.e., sleep and the lowest intensity of sedentary behavior) and the highest end of the intensity spectrum (i.e., intensities in the moderate and vigorous intensity ranges) were important correlates while intensities in the middle of the spectrum (i.e., higher intensities of sedentary behavior and LPA) were not. This finding is consistent with systematic reviews that report that MVPA5 and sleep duration4 are negatively associated with cardiometabolic risk, while sedentary behavior3 and LPA5 have weak or null associations with cardiometabolic risk.
Only four of the 28 movement behavior characteristics that were important correlates of the cardiometabolic risk score across the 2 maturation groups reflected specific types of movement, and one of these 4 correlations (i.e., passive travel in the most mature group) was in the opposite direction to what was expected. Because the statistical models simultaneously included the intensities, patterns, and types of movement, it is likely that the health benefits of the specific types of movement were due to the intensity and patterns of movement. For example, the health benefits of outdoor active play were likely due to the intensity and patterns of movement accumulated while participating in outdoor active play, and these health benefits would not be any different than the health benefits of accumulating similar intensities and patterns of movement through active travel, organized sport, or curriculum-based PA.
The sedentary behavior and PA movement patterns that were important correlates of the cardiometabolic risk score, such as shorter bouts of sedentary behavior and sporadic MVPA, were also the patterns with the highest median values. For instance, among the least mature group, the 5–9-min and 10–19-min bouts of sedentary behavior, both of which had important VIP values, had median values in excess of 100 min/day. Conversely, the 20–29-min and ≥30-min bouts of sedentary behavior, neither of which had important VIP values, had median values that were approximately 55 min/day. It is possible that a large proportion of the children in our study did not spend enough time in many of the sedentary behavior and PA movement behavior patterns for these patterns to have a meaningful influence on the cardiometabolic risk factors. The pattern of sleep that ranked as important was the sleep midpoint, which is concordant with other research that has found that later bedtimes are associated with an unfavorable weight status profile, independent of sleep duration.42 This could reflect that metabolism is more influenced by the timing of sleep (in relation to one's natural point in the circadian rhythm) than the duration of sleep.43
Some of the findings from our research have important public health implications. Collectively, movements at the highest end of the intensity spectrum (i.e., in the moderate and vigorous intensity ranges) had the highest rankings in relation to cardiometabolic risk; therefore, promoting time spent in MVPA should be a priority irrespective of the type of PA or movement pattern used to accumulate that MVPA. In fact, previous interventions that have targeted increasing MVPA in children have been successful in reducing cardiometabolic risk factors.44, 45 Research has shown that PA is 2.2–3.3 times higher when children are outdoors compared with indoors.46 Therefore, encouraging children to be physically active outdoors may be a promising strategy for increasing the amount of time they engage in MVPA.
There are a few notable limitations to this research. First, the cross-sectional design does not allow for the establishment of causality. The age range was narrow and the results may not be generalizable to children outside the 10–13-year-old age group studied. This research focused solely on noninvasive cardiometabolic health indicators and did not include indicators that could be measured from a blood sample (e.g., insulin, high-density lipoprotein-cholesterol, and triglycerides). In addition, future studies should use similar analytic techniques to examine indicators of mental health (e.g., symptoms of anxiety and depression) and social health (e.g., prosocial and antisocial behaviors). Future studies may also wish to use GPS wristwatches that are capable of measuring HR because HR measures could supplement the accelerometer data when assessing movement intensity. Finally, the sample was categorized into the least and most mature groups based on the 50th percentile of the difference from peak height velocity. This cut-point was chosen to maintain an adequate sample size in the 2 maturation groups and was not based on a specific developmental stage.
5. Conclusion
This study aimed to understand the relative importance of different intensities, patterns, and types of movement behaviors in relation to cardiometabolic risk factors in children. Many different movement behavior characteristics were important correlates of cardiometabolic health. Collectively, variables that reflect intensities of movement ranked higher than variables that reflect types and patterns of movement, and the majority of the variables that reflect intensities of movement that ranked as important were intensities in the moderate or vigorous intensity range. Future research should employ similar multivariate analytic approaches in longitudinal studies to confirm these findings.
Acknowledgments
Acknowledgments
This research was funded by a grant-in-aid from the Heart and Stroke Foundation of Canada (Grant number: G-14-0005947). IJ was supported by a Canada Research Chair award.
Authors’ contributions
LKC designed the study that formed this manuscript, participated in data collection and processing, conducted the statistical analyses, and drafted the manuscript; MMB participated in data collection and processing and provided critical input on the draft of the manuscript; IJ designed the Active Play Study, obtained funding, oversaw data collection, provided input on the statistical analysis, and provided critical feedback on the draft of the manuscript. All authors have read and approved the final version of the manuscript, and agree with the order of presentation of the authors.
Competing interests
The authors declare that they have no competing interests.
Footnotes
Peer review under responsibility of Shanghai University of Sport.
References
- 1.Chastin S.F., Palarea-Albaladejo J., Dontje M.L., Skelton D.A. Combined effects of time spent in physical activity, sedentary behaviors and sleep on obesity and cardio-metabolic health markers: A novel compositional data analysis approach. PLoS One. 2015;10 doi: 10.1371/journal.pone.0139984. [DOI] [PMC free article] [PubMed] [Google Scholar]
- 2.Pedišić Z., Dumuid D., Olds T.S. Integrating sleep, sedentary behaviour, and physical activity research in the emerging field of time-use epidemiology: Definitions, concepts, statistical methods, theoretical frameworks, and future directions. Kinesiology. 2017;49:1–18. [Google Scholar]
- 3.Carson V., Hunter S., Kuzik N. Systematic review of sedentary behaviour and health indicators in school-aged children and youth: An update. Appl Physiol Nutr Metab. 2016;41(Suppl. 3):S240–S265. doi: 10.1139/apnm-2015-0630. [DOI] [PubMed] [Google Scholar]
- 4.Chaput J.P., Gray C., Poitras V. Systematic review of the relationships between sleep duration and health indicators in school-aged children and youth. Appl Physiol Nutr Metab. 2016;41(Suppl. 3):S266–S282. doi: 10.1139/apnm-2015-0627. [DOI] [PubMed] [Google Scholar]
- 5.Poitras V.J., Gray C.E., Borghese M.M. Systematic review of the relationships between objectively measured physical activity and health indicators in school-aged children and youth. Appl Physiol Nutr Metab. 2016;41(Suppl. 3):S197–S239. doi: 10.1139/apnm-2015-0663. [DOI] [PubMed] [Google Scholar]
- 6.Ainsworth B.E., Haskell W.L., Herrmann S.D. 2011 Compendium of physical Activities: A second update of codes and MET values. Med Sci Sports Exerc. 2011;43:1575–1581. doi: 10.1249/MSS.0b013e31821ece12. [DOI] [PubMed] [Google Scholar]
- 7.Chaput J.P., Carson V., Gray C.E., Tremblay M.S. Importance of all movement behaviors in a 24 h period for overall health. Int J Environ Res Public Health. 2014;11:12575–12581. doi: 10.3390/ijerph111212575. [DOI] [PMC free article] [PubMed] [Google Scholar]
- 8.Dumuid D., Stanford T.E., Martin-Fernandez J.A. Compositional data analysis for physical activity, sedentary time and sleep research. Stat Methods Med Res. 2018;27:3726–3738. doi: 10.1177/0962280217710835. [DOI] [PubMed] [Google Scholar]
- 9.Talarico R., Janssen I. Compositional associations of time spent in sleep, sedentary behavior and physical activity with obesity measures in children. Int J Obes. 2018;42:1508–1514. doi: 10.1038/s41366-018-0053-x. [DOI] [PubMed] [Google Scholar]
- 10.Macgregor A.P., Borghese M.M., Janssen I. Is replacing time in one type of physical activity with another associated with health in children? Appl Physiol Nutr Metab. 2019 doi: 10.1139/apnm-2018-0323. In press. [DOI] [PubMed] [Google Scholar]
- 11.Michels N., Clays E., De Buyzere M., Vanaelst B., De Henauw S., Sioen I. Children's sleep and autonomic function: Low sleep quality has an impact on heart rate variability. Sleep. 2013;36:1939–1946. doi: 10.5665/sleep.3234. [DOI] [PMC free article] [PubMed] [Google Scholar]
- 12.Spruyt K., Molfese D.L., Gozal D. Sleep duration, sleep regularity, body weight, and metabolic homeostasis in school-aged children. Pediatrics. 2011;127:e345–e352. doi: 10.1542/peds.2010-0497. [DOI] [PMC free article] [PubMed] [Google Scholar]
- 13.Biggs S.N., Lushington K., van den Heuvel C.J., Martin A.J., Kennedy J.D. Inconsistent sleep schedules and daytime behavioral difficulties in school-aged children. Sleep Med. 2011;12:780–786. doi: 10.1016/j.sleep.2011.03.017. [DOI] [PubMed] [Google Scholar]
- 14.Colley R.C., Garriguet D., Janssen I. The association between accelerometer-measured patterns of sedentary time and health risk in children and youth: Results from the Canadian Health Measures survey. BMC Public Health. 2013;13:200. doi: 10.1186/1471-2458-13-200. [DOI] [PMC free article] [PubMed] [Google Scholar]
- 15.Saunders T.J., Tremblay M.S., Mathieu M.E. Associations of sedentary behavior, sedentary bouts and breaks in sedentary time with cardiometabolic risk in children with a family history of obesity. PLoS One. 2013;8:e79143. doi: 10.1371/journal.pone.0079143. [DOI] [PMC free article] [PubMed] [Google Scholar]
- 16.Holman R.M., Carson V., Janssen I. Does the fractionalization of daily physical activity (sporadic vs. bouts) impact cardiometabolic risk factors in children and youth. PLoS One. 2011;6:e25733. doi: 10.1371/journal.pone.0025733. [DOI] [PMC free article] [PubMed] [Google Scholar]
- 17.Mark A.E., Janssen I. Does physical activity accrued in bouts predict overweight and obesity beyond the total volume of physical activity in youth? Am J Prev Med. 2009;36:416–421. doi: 10.1016/j.amepre.2009.01.027. [DOI] [PubMed] [Google Scholar]
- 18.Ruiz J.R., Rizzo N.S., Hurtig-Wennlof A., Ortega F.B., Warnberg J., Sjostrom M. Relations of total physical activity and intensity to fitness and fatness in children: The European Youth Heart Study. Am J Clin Nutr. 2006;84:299–303. doi: 10.1093/ajcn/84.1.299. [DOI] [PubMed] [Google Scholar]
- 19.Rodrigues A.N., Abreu G.R., Resende R.S., Goncalves W.L., Gouvea S.A. Cardiovascular risk factor investigation: A pediatric issue. Int J Gen Med. 2013;6:57–66. doi: 10.2147/IJGM.S41480. [DOI] [PMC free article] [PubMed] [Google Scholar]
- 20.Bugge A., El-Naaman B., McMurray R.G., Froberg K., Andersen L.B. Tracking of clustered cardiovascular disease risk factors from childhood to adolescence. Pediatr Res. 2013;73:245–249. doi: 10.1038/pr.2012.158. [DOI] [PubMed] [Google Scholar]
- 21.Andersen L.B., Hasselstrøm H., Grønfeldt V., Hansen S.E., Karsten F. The relationship between physical fitness and clustered risk, and tracking of clustered risk from adolescence to young adulthood: Eight years follow-up in the Danish Youth and Sport Study. Int J Behav Nutr Phys Act. 2004;1:6. doi: 10.1186/1479-5868-1-6. [DOI] [PMC free article] [PubMed] [Google Scholar]
- 22.Reilly J.J., Kelly J. Long-term impact of overweight and obesity in childhood and adolescence on morbidity and premature mortality in adulthood: systematic review. Int J Obes (Lond) 2011;35:891–898. doi: 10.1038/ijo.2010.222. [DOI] [PubMed] [Google Scholar]
- 23.Williams G.C., Borghese M.M., Janssen I. Neighborhood walkability and objectively measured active transportation among 10–13 year olds. J Transp Health. 2018;8:202–209. [Google Scholar]
- 24.Borghese M.M., Janssen I. Development of a measurement approach to assess time children participate in organized sport, active travel, outdoor active play, and curriculum-based physical activity. BMC Public Health. 2018;18:396. doi: 10.1186/s12889-018-5268-1. [DOI] [PMC free article] [PubMed] [Google Scholar]
- 25.Lin Y., Borghese M.M., Janssen I. Bi-directional association between sleep and outdoor active play among 10–13 year olds. BMC Public Health. 2018;18:224. doi: 10.1186/s12889-018-5122-5. [DOI] [PMC free article] [PubMed] [Google Scholar]
- 26.Colley R.C., Carson V., Garriguet D., Janssen I., Roberts K.C., Tremblay M.S. Physical activity of Canadian children and youth, 2007 to 2015. Health Rep. 2017;28:8–16. [PubMed] [Google Scholar]
- 27.Payau M.R., Adolph A.L., Vohra R.A., Butte N.F. Validation and calibration of physical activity monitors in children. Obes Res. 2002;10:150–157. doi: 10.1038/oby.2002.24. [DOI] [PubMed] [Google Scholar]
- 28.Carlson J.A., Jankowska M.M., Meseck K. Validity of PALMS GPS scoring of active and passive travel compared with sensecam. Med Sci Sports Exerc. 2015;47:662–667. doi: 10.1249/MSS.0000000000000446. [DOI] [PMC free article] [PubMed] [Google Scholar]
- 29.Puyau M.R., Adolph A.L., Vohra F.A., Zakeri I., Butte N.F. Prediction of activity energy expenditure using accelerometers in children. Med Sci Sports Exerc. 2004;36:1625–1631. [PubMed] [Google Scholar]
- 30.Pilcher J.J., Ginter D.R., Sadowsky B. Sleep quality versus sleep quantity: Relationships between sleep and measures of health, well-being and sleepiness in college students. J Psychosom Res. 1997;42:583–596. doi: 10.1016/s0022-3999(97)00004-4. [DOI] [PubMed] [Google Scholar]
- 31.Mitru G., Millrood D.L., Mateika J.H. The impact of sleep on learning and behavior in adolescents. Teach Coll Rec. 2002;104:704–726. [Google Scholar]
- 32.Borghese M.M., Lin Y., Janssen I. Estimating sleep efficiency in 10- to- 13-year-olds using a waist-worn accelerometer. Sleep Health. 2018;4:110–115. doi: 10.1016/j.sleh.2017.09.006. [DOI] [PubMed] [Google Scholar]
- 33.Sato-Mito N., Sasaki S., Murakami K. The midpoint of sleep is associated with dietary intake and dietary behavior among young Japanese women. Sleep Med. 2011;12:289–294. doi: 10.1016/j.sleep.2010.09.012. [DOI] [PubMed] [Google Scholar]
- 34.Altenburg T.M., Chinapaw M.J. Bouts and breaks in children's sedentary time: currently used operational definitions and recommendations for future research. Prev Med. 2015;77:1–3. doi: 10.1016/j.ypmed.2015.04.019. [DOI] [PubMed] [Google Scholar]
- 35.Clarke J., Janssen I. Sporadic and bouted physical activity and the metabolic syndrome in adults. Med Sci Sports Exerc. 2014;46:76–83. doi: 10.1249/MSS.0b013e31829f83a0. [DOI] [PubMed] [Google Scholar]
- 36.Robson J., Janssen I. A description of the volume and intensity of sporadic physical activity among adults. BMC Sports Sci Med Rehabil. 2015;7:2. doi: 10.1186/2052-1847-7-2. [DOI] [PMC free article] [PubMed] [Google Scholar]
- 37.Mirwald R.L., Baxter-Jones A.D., Bailey D.A., Beunen G.P. An assessment of maturity from anthropometric measurements. Med Sci Sports Exerc. 2002;34:689–694. doi: 10.1097/00005768-200204000-00020. [DOI] [PubMed] [Google Scholar]
- 38.Rajalahti T., Kvalheim O.M. Multivariate data analysis in pharmaceutics: A tutorial review. Int J Pharm. 2011;417:280–290. doi: 10.1016/j.ijpharm.2011.02.019. [DOI] [PubMed] [Google Scholar]
- 39.Wold S., Ruhe A., Wold H., Dunn W.J. The collinearity problem in linear Regression. The partial least squares (PLS) approach to generalized inverses. SIAM J Sci and Stat Comput. 1984;5:735–743. [Google Scholar]
- 40.Lê Cao K.A., Rossouw D., Robert-Granié C., Besse P. A sparse PLS for variable selection when integrating omics data. Stat Appl Genet Mol Biol. 2008;7 doi: 10.2202/1544-6115.1390. [DOI] [PubMed] [Google Scholar]
- 41.Mehmood T., Liland K.H., Snipen L., Sæbø S. A review of variable selection methods in partial least squares regression. Chemometr Intell Lab Syst. 2012;118:62–69. [Google Scholar]
- 42.Olds T.S., Maher C.A., Matricciani L. Sleep duration or bedtime? Exploring the relationship between sleep habits and weight status and activity patterns. Sleep. 2011;34:1299–1307. doi: 10.5665/SLEEP.1266. [DOI] [PMC free article] [PubMed] [Google Scholar]
- 43.Scheer F.A., Hilton M.F., Mantzoros C.S., Shea S.A. Adverse metabolic and cardiovascular consequences of circadian misalignment. Proc Natl Acad Sci U S A. 2009;106:4453–4458. doi: 10.1073/pnas.0808180106. [DOI] [PMC free article] [PubMed] [Google Scholar]
- 44.Kriemler S., Zahner L., Schindler C. Effect of school based physical activity programme (KISS) on fitness and adiposity in primary schoolchildren: cluster randomised controlled trial. BMJ. 2010;340:c785. doi: 10.1136/bmj.c785. [DOI] [PMC free article] [PubMed] [Google Scholar]
- 45.Ford P.A., Perkins G., Swaine I. Effects of a 15-week accumulated brisk walking programme on the body composition of primary school children. J Sports Sci. 2013;31:114–122. doi: 10.1080/02640414.2012.723816. [DOI] [PubMed] [Google Scholar]
- 46.Gray C., Gibbons R., Larouche R. What is the relationship between outdoor time and physical activity, sedentary behaviour, and physical fitness in children? A systematic review. Int J Environ Res Public Health. 2015;12:6455–6474. doi: 10.3390/ijerph120606455. [DOI] [PMC free article] [PubMed] [Google Scholar]