

Abstract
Publication and authorship are important in academia for career advancement, obtaining grants, and improved patient care. There has been a recent interest in bibliometric changes over time, especially regarding the gender gap. The purpose of this study was to explore bibliometric changes in the musculoskeletal literature. Bibliometric variables (number of authors, institutions, countries, pages, references, corresponding author position, author gender, geographic region of origin, and editorial board makeup) were analyzed for 5 basic science and 12 clinically oriented musculoskeletal journals from 1985 through 2016. Statistical analyses comprised bivariate analyses, multifactorial ANOVAs, and logistic regression analyses. A p < 0.005 was considered significant. Nearly, all variables increased over time. Asia had the highest number of authors and corresponding author positions, Australia/New Zealand the highest number of institutions and references, North America the highest number of pages, and Europe the highest number of countries. Those with a female first author had more authors, institutions, countries, references, and pages. Likewise, those with a female corresponding author had more authors, institutions, countries, references, and pages. Single-authored manuscripts decreased over time. The percentage of female first authors rose from 10.8% in 1985–1987 to 23.7% in 2015–2016. There were more female 1st authors in the basic science journals compared to the clinical journals (33.2% vs. 12.7%). Single-authored manuscripts were more likely to be written by males (5.1 vs. 2.4%) and decreased over time. The many differences by geographic region of origin likely reflect different socio/cultural attitudes regarding academia and research, as well as the gender composition of the disciplines by geographic region. Overall, there has been an increase in the number of female 1st and corresponding authors, editorial board members, and chief editors, indicating a slow but progressive narrowing of the gender gap.
1. Introduction
There has been a recent interest in studying bibliometric changes overtime for (1) the scientific literature in general [1, 2], (2) the medical literature more specifically [3–8], and (3) to a certain extent the musculoskeletal literature [7–12]. These studies have noted changes in the geographic origin of the manuscript, author gender, and an increasing number of authors. The reasons behind these changes are many and cannot be completely explained.
Efforts are being made to promote collaboration within the scientific community [13]. The scientific community has traditionally been guarded [14, 15] due to the competition between institutions for publications, funding, and scientific discovery. The advent of technology and the Internet has made it easier for researchers to collaborate with others from different institutions and countries to produce work that is mutually beneficial for all [16–20]. Utilizing the strengths of each participating institution or department can result in a product far superior than what would be achieved individually.
Publications are becoming increasingly important at all stages of academic careers from residency and postgraduate/postdoctoral applications to obtaining grants and tenure [2–36]. Manuscript publication is useful to obtain competitive residency and fellowship programs [36–38]. In the 2018 Residency Match [39], successful orthopaedic surgery applicants had an average of 11.5 unique research experiences (abstracts, presentations, and publications), compared to 6.7 for those who did not match.
Many efforts are being made to close the gender gap in all of society, including science and medicine. Women comprise approximately 50% of the world population [40, 41] but account for only 8% of top earners in professional fields [42, 43]. There has been significant discussion regarding women overcoming barriers that hinder career development. In 2014, women received a majority of doctoral degrees, yet there are far fewer women at the professor level in academia [44]. Since 1980, the fraction of women gaining doctorates in science has more than doubled in the United States and is nearing equity [45], yet representation of women among science and engineering faculty in the US lags behind the gains in graduate education. Their progression to higher faculty ranks is diminished behind that of their male counterparts, in part because many women do not apply for tenure-track jobs, even though a study of US science departments showed that women were more successful than men in gaining tenure between 2002 and 2004 [46]. Some of the gender inequalities that exist in the scientific fields include compensation and hiring differences [45], NIH grant funding rates [47], and patenting activity in the biotechnology industry [48, 49]. This is in spite of a recent study noting that University academic departments wishing to hire a new STEM (science, technology, engineering, mathematics) tenure-track faculty at the assistant professor level [50] demonstrated a 2 : 1 preference for female applicants. However, this aspiration does not currently match the reality. Within engineering, for example, in 2016, 20.9% of bachelor's degrees (BS) and 23.3% of doctoral degrees were awarded to women [51]; 16.0% of academic faculty positions were occupied by women.
Medicine has traditionally been a male-dominated field, although women have made significant gains. Women accounted for 34% of active physicians in the US in 2015 [52]; however, there is a wide range between specialties [52]. The percentage of women physicians in the US is highest in pediatrics (61.9%) and lowest in orthopaedic surgery (5.0%). In 2018–2019, women represented 49.5% of US medical school matriculates [53]. Despite this near equal representation of women graduating from medical school, the representation of women in the field of surgery is low [54], being 19.2% in general surgery, 15.0% in plastic surgery, 11.3% in vascular surgery, 8.0% in urology, 7.8% in neurosurgery, 6.0% in thoracic surgery, and 5.0% in orthopaedic surgery [55]. Using 2016-2017 data, obstetrics-gynecology, dermatology, and pediatrics had the highest percentage of women residents at 75.1%, 62.1%, and 60.4%, respectively [56], and the lowest percentages in orthopaedic surgery and nuclear medicine at 14.7% and 5.8%, respectively. Within US orthopaedic surgery subspecialty fellowships, pediatric orthopaedics [57], and hand surgery [58] had the highest percentage of women at 23% and 25% respectively, and spine the lowest at 3% [57].
In medicine, even after residency training, women have a more difficult time advancing compared to men in the same field [59–63]. Currently ∼50% of medical school graduates are women [64], yet only 21% of full-time professor positions within medicine are held by women [65]. Women comprise less than 30% of all clinical faculty, and only 15% of clinical faculty in surgical specialties [65]. Women account for only 14.7% of orthopaedic surgery residency positions in the US and 4.3% of orthopaedic surgeons at academic medical schools [56, 66].
The gender discrepancy is significant in several areas of academic medicine, including the issue of publications. The seminal study of Jagsi et al. [67] reported on authorship gender disparity in leading medical journals (New England Journal of Medicine, Journal of American Medical Association, Annals of Internal Medicine, Annals of Surgery, Obstetrics & Gynecology, and Journal of Pediatrics). Female authors increased from 5.9% in 1970 to 29.3% in 2004, and senior female authors increased from 3.7% in 1970 to 19.3% in 2004. In the 2004 Annals of Surgery, these same numbers were only 16.7% and 6.7%, respectively, confirming the fact that surgery is still a male-dominated field. Other studies [3, 68] reviewing authorship gender in their respective specialties noted underrepresentation of women as both first and principal author in ophthalmology [68] and radiology journals [3].
The musculoskeletal literature is deficient on general bibliometric and authorship gender studies, although there has been recent interest [7–11, 69–73]. With this deficiency in mind, the purpose of this study was to analyze bibliometric changes of the musculoskeletal literature (basic science, translational, and clinical) over the last 30 years. This literature is wide in scope, spanning both orthopaedic surgery and STEM disciplines. It provides an avenue to compare and contrast these two very important fields in academia within the same general topic (musculoskeletal). Bibliometric studies provide valuable information regarding past, current, and future directions in the field and are one way of understanding the impact of gender on research and how to overcome gender bias [74]. Such data are helpful for mentors in counseling trainees and junior faculty. It may also assist policy development for governing higher education and research grant awards.
2. Materials and Methods
2.1. Data Collection
During 2017 and 2018, our group performed bibliometric analyses spanning the last 30 years for select musculoskeletal journals (both basic science and clinically oriented journals, including subspecialty orthopaedic journals). Many of the results have been published for each or pairs of the journals [75–84], but not all results for all journals in a detailed manner. This study reports our comprehensive results, with comparisons between journals and journal types. The journals selected for study were the Annals of Biomedical Engineering (ABME), Bone, Calcified Tissue International (CTI), Journal of Bone and Mineral Research (JBMR), Journal of Orthopaedic Research (JOR), American Journal of Sports Medicine (AJSM), Arthroscopy (ARTHRO), Bone and Joint Journal (BJJ) (formerly known as the British Journal of Bone and Joint Surgery), Foot and Ankle International (FAI), Injury, Journal of Arthroplasty (JAR), Journal of Bone and Joint Surgery (JBJS), Journal of Hand Surgery-American (JHSA), Journal of Hand Surgery-European (JHSE), Journal of Orthopaedic Trauma (JOT), Journal of Pediatric Orthopaedics (JPO), and Spine. These journals are a representative sample, but clearly not exhaustive, of both the basic science and clinical orthopaedic musculoskeletal research literature. We made a conscious decision to not include physical medicine or rheumatology journals as our research group is within the department of orthopaedic surgery, with both clinical and basic science sections. The journals were grouped into two major types: primarily basic science or clinical, acknowledging that there are often overlaps between these areas for all journals. The basic science group consisted of ABME, Bone, CTI, JBMR, and JOR; the remainder comprised the clinical group.
One year from each decade was selected. For those studied in 2017, the decades were 1985, 1995, 2005, and 2015; for those studied in 2018, the decades were 1986, 1996, 2006, and 2016 (For JOT, 1987, its inaugural year, was used; and for Arthroscopy, the first two years of 1985/1986 were used in order to obtain adequate numbers). Such methodology using years separated by a decade has been previously validated [3, 4, 7. 10, 26, 30, 67, 75, 76, 85]. A PubMed search was performed for each year. Editorials, letters, and commentaries were excluded from the search, and the citations for the remaining entries were downloaded into EndNote X7 (Thomson Reuters, New York, NY, USA, 2013). The entries were viewed manually to eliminate those published electronically in the desired year but not published in hard print until the following year. All entries without authors were excluded, as well as memorandums and meeting notes. These data were extracted and placed into an Excel file in preparation for further tabulation of demographic data. The data collected were the names of the first and corresponding authors, corresponding author position (e.g. 1st, 2nd, 3rd,…, or last in the byline position), manuscript length (number of pages), number of references, number of times the manuscript was cited, and country of origin for the corresponding author. Citation data were obtained from a Scopus search during the month of December 2016 for the 2015 journals and December 2017 for the 2016 journals. An annualized (normalized) citation was created by dividing the citation number by the age of the manuscript in years. This corrects for the odds of a manuscript being cited the longer it has been published. For example, a manuscript published 30 years ago has a higher potential of being cited compared to one 5 years ago. This normalized citation adjusts for the odds of a manuscript being cited the longer it has been published.
Author gender was determined for the first and corresponding authors using the method described by Mimouni et al. [68]. Each author's first name was entered into “Baby Name Guesser” at http://www.gpeters.com/names/baby-names.php. This gives the most likely gender with a gender ratio. A ratio ≥3.0 is considered as a correct gender assignment. For those <3.0, a Google search was performed to determine the gender. If that was unsuccessful, the entry was excluded for gender analyses. The gender of the editors and editorial board members was also determined for each journal for each of the respective years. When the manuscript had more than one author and when the first author was not the corresponding author, a gender combination between the first and corresponding author was tabulated (MM–both authors male, FF–both authors female, MF–1st author male and corresponding author female, FM–1st author female and corresponding author male). This was used as an indirect method to study mentoring between/within genders.
The country of manuscript origin was grouped into regions. North America was the United States and Canada. Europe was grouped as the European continent, including Russia and Turkey. Asia was defined as all countries east of Turkey, including the Middle East and Israel. Latin America was defined as Mexico, Central America, and South America. Africa and Australia/New Zealand were the other regions. The state/province was obtained for those institutions located in the United States or Canada.
Regions within the United States were categorized as Northeast, West, South, and Midwest as determined by the US Census Bureau (https://www.census.gov/geo/reference/webatlas/regions.html). We arbitrarily categorized the regions within Canada as West (British Columbia and Alberta), Midwest (Ontario, Manitoba, Saskatchewan), and East (Quebec and those farther east). Europe was divided into regions using two different schemes. The first scheme was geographical—the British Isles (The United Kingdom, Northern Ireland), Nordic (Sweden, Denmark, Norway, Finland), and Continental (all others). The second scheme was historical—was the country a former Eastern Bloc member or similarly politically aligned (USSR, Russia, Poland, Czech Republic, Slovak Republic, Hungary, Romania, Bulgaria, Albania, and Yugoslavia with its subsequent divisions (Slovenia, Croatia, Macedonia, Serbia)). Although not technically correct, all the manuscripts from Germany were considered to be Western Bloc. Of the 379 manuscripts from Germany, 15 were in the 1985–1987 group; some of those could have originated from East Germany rather than West Germany, as the Iron Curtain fell between the years of 1985–1987 and 1995–1996. However, these small numbers would have minimal impact on the results of the Eastern Bloc status. Finally, the journals were grouped into two regions based upon the location of the editorial office: North America or Europe.
Corresponding author position was studied in three ways. The first simply describes the locations of the corresponding author as first, second, last, or other. Throughout the rest of the manuscript, this method uses “location” as the adjective. The other two use continuous variables. The first is simply the numerical position of the corresponding author in the byline of all authors. However, there has been an increase in author numbers over time. This was standardized by dividing the numerical position of the author by the total number of authors to give a normalized value. Throughout the rest of the manuscript, these two continuous variable methods use “position” as the adjective.
2.2. Statistical Analyses
Continuous data are reported as the mean ± 1 standard deviation. Discrete data are reported as frequencies and percentages. Analyses between groups of continuous data were performed using nonparametric tests due to the data not having normal distributions (Mann–Whitney U test—2 groups, Kruskal–Wallis test—3 or more groups). A multifactorial ANOVA was used to study the effect of various categorical variables on a continuous variable, as there is no good nonparametric test equivalent [85]. Differences between groups of discrete data were analyzed by the Fisher's exact test (2 × 2 tables) and the Pearson's χ2 test (greater than 2 × 2 tables). Trends over time for categorical variables were assessed using the Cochran linear trend test (2 × tables). Multivariate logistic regression was used to determine predictor variables of authorship gender (first, corresponding, and gender combination) and single authorship, giving odds ratios (OR), 95% confidence intervals [CI], and associated p values. Statistical analyses were performed with Systat 10 software™ (Chicago, IL, 2000).
The reader must be aware that when multiple statistical tests are performed on a single data set, there is an increased chance of finding a significant value when in fact it is not truly significant. In this study, ∼350 unique statistical analyses were performed. Some statisticians do not believe that a correction for multiple analyses is needed [86, 87], and in many circumstances may be counterproductive [87]. This is an area of considerable discussion in statistics [86–89]. However, many others believe that some sort of adjustment should be used. Assuming that there should be an adjustment, one method of correction is that of Holm [90]. The Holm correction for these 350 analyses gives a p < 0.0005 of being statistically significant. This is extremely conservative, and we suggest that for our type of study such a limit will exclude important information. This is not a clinical trial looking at outcome measures [87]. Another approach is to simply set the p value lower, such as 0.005; this has been recently proposed by major journals [91, 92]. These authors, however, note that this is meant for very important decisions regarding new medical treatments. Clearly when a new medical treatment is being considered, it should be strongly proven. However, in this study, we are not making any inferences regarding new treatments but rather performing exploratory studies in bibliometrics and how it relates to author gender between various variables. Thus, it is possible that the 0.005 is too conservative; however, we have elected to use this value and consider those between 0.005 and 0.05 as suggestive [92]. Throughout this study, the actual (not Holm adjusted) p value is given, allowing the individual reader to decide appropriate significance.
3. Results
3.1. Overall Results
There were 12,819 manuscripts that met the inclusion criteria; 3,178 (24.8%) were in the basic science and 9,641(75.2%) in the clinical groups. The journal was based in North America for 9,857 (76.9%) and in Europe for 2,962 (23.1%) manuscripts. With regard to published manuscripts, the numbers were 1,576 (12.3%) in 1985–1987, 2,830 in 1995–1996 (22.1%), 3,924 in 2005–2006 (30.6%), and 4,489 in 2015–2016 (35.0%). The gender of the 1st author was male in 10,191 (79.5%), female in 2,210 (17.2%), and unknown in 418 (3.3%) manuscripts. The corresponding author was identified in 12,692 manuscripts; the gender of the corresponding author was male in 10,555 (83.2%), female in 1,782 (14.0%), and unknown in 355 (2.8%). Author gender combination was known for 4,557 manuscripts. It was MM in 3,174 (69.7%), MF in 367 (8.1%), FM in 777 (17.1%), and FF in 239 (5.2%). The region of origin was known for 12,816 manuscripts: North America (6,651–51.9%), Europe (3,846–30.0%), Asia (1,771–13.8%), Australia/New Zealand (393–3.1%), Latin America (93–0.7%), and Africa (62–0.5%). Due to the small numbers from Africa and Latin America, they were excluded from detailed regional analyses.
The average number of authors was 4.7 ± 2.4, institutions 2.0 ± 1.5, countries 1.2 ± 0.6, references 28.6 ± 19.2, pages 6.7 ± 2.9, citations 32.0 ± 55.8, annualized citations 2.98 ± 4.04, corresponding author position 2.3 ± 2.3, and normalized corresponding position 0.51 ± 0.34 (Table 1). There were differences between the 17 journals for all the above variables. The basic science group demonstrated greater values for all these variables compared to the clinical group. North-American-based journals had equivalent or larger values for all these variables compared to European journals except for the normalized corresponding author position. All variables increased over time except for the number of annualized citations, which dropped in the 2015–2016 decade. There were differences in all variables by region, with Asia having the highest number of authors and corresponding author positions; Australia/New Zealand the highest number of institutions and references; North America the highest number of pages, normalized corresponding author positions, and citations; and Europe the highest number of countries. Those with a female first author had more authors, institutions, countries, references, pages, annualized citations, and corresponding author position but with a lower normalized corresponding author position. Those with a female corresponding author had more authors, institutions, countries, references, pages, annualized citations, a lower normalized corresponding author position, and no difference in the unadjusted corresponding author position.
Table 1.
Continuous bibliometric variables.
| n | Author number | Number of institutions | Number of countries | Number of references | Number of pages | Number of citations | Number of annualized citations | Corresponding author position | Corresponding author position standardized | |
|---|---|---|---|---|---|---|---|---|---|---|
| All-mean ± 1sd (median) | 4.7 ± 2.4 (4) | 2.0 ± 1.5 (2) | 1.2 ± 0.6 (1) | 28.6 ± 19.2 (26) | 6.7 ± 2.9 (6) | 32.0 ± 55.8 (13) | 2.98 ± 4.04 (1.9) | 2.3 ± 2.3 (1) | 0.51 ± 0.34 (0.33) | |
| Journal type | ||||||||||
| Clinical | 9,641 | 4.4 ± 2.1 | 2.0 ± 1.5 | 1.1 ± 0.5 | 25.7 ± 17.7 | 6.1 ± 2.6 | 31.9 ± 56.5 | 2.92 ± 4.02 | 2.0 ± 1.9 | 0.48 ± 0.33 |
| Basic science | 3,178 | 5.6 ± 3.0 | 2.3 ± 1.7 | 1.3 ± 0.8 | 37.5 ± 20.8 | 8.3 ± 3.1 | 32.3 ± 53.6 | 3.15 ± 4.10 | 3.3 ± 3.2 | 0.58 ± 0.38 |
| p value | — | <10−15 | <10−15 | <10−15 | <10−15 | <10−15 | 0.000127 | 0.00000022 | <10−15 | <10−15 |
| Specific Journal | ||||||||||
| ABME | 402 | 4.5 ± 2.4 | 2.1 ± 1.3 | 1.3 ± 0.6 | 35.9 ± 18.1 | 12.0 ± 3.8 | 18.0 ± 26.6 | 2.47 ± 2.80 | 2.9 ± 2.4 | 0.66 ± 0.36 |
| BONE | 899 | 5.8 ± 3.0 | 2.4 ± 1.7 | 1.3 ± 0.8 | 41.4 ± 26.6 | 7.7 ± 2.5 | 32.3 ± 54.4 | 3.40 ± 4.02 | 3.2 ± 3.1 | 0.57 ± 0.38 |
| CTI | 514 | 4.9 ± 2.4 | 2.0 ± 1.4 | 1.2 ± 0.5 | 31.7 ± 18.4 | 6.7 ± 2.8 | 30.7 ± 63.4 | 2.06 ± 2.83 | 2.6 ± 2.7 | 0.50 ± 0.35 |
| JBMR | 746 | 6.8 ± 3.5 | 2.7 ± 2.3 | 1.4 ± 1.0 | 40.8 ± 18.8 | 8.6 ± 2.6 | 43.3 ± 60.0 | 4.13 ± 5.59 | 4.1 ± 3.9 | 0.60 ± 0.40 |
| JOR | 617 | 5.6 ± 2.5 | 2.3 ± 1.4 | 1.2 ± 0.5 | 33.7 ± 14.0 | 8.0 ± 2.4 | 29.4 ± 45.2 | 2.95 ± 3.33 | 3.2 ± 2.9 | 0.58 ± 0.38 |
| AJSM | 814 | 4.6 ± 2.0 | 2.1 ± 1.7 | 1.2 ± 0.5 | 32.2 ± 18.4 | 7.1 ± 2.8 | 44.8 ± 67.8 | 5.16 ± 6.15 | 2.2 ± 2.0 | 0.48 ± 0.33 |
| Arthroscopy | 656 | 4.3 ± 2.1 | 1.9 ± 1.2 | 1.1 ± 0.4 | 23.9 ± 14.4 | 6.8 ± 2.8 | 29.7 ± 45.1 | 3.14 ± 3.76 | 2.1 ± 1.9 | 0.48 ± 0.32 |
| BJJ | 893 | 4.3 ± 2.1 | 2.0 ± 1.4 | 1.2 ± 0.5 | 25.7 ± 18.0 | 5.5 ± 1.9 | 36.6 ± 50.1 | 3.08 +3.45 | 1.8 ± 1.6 | 0.43 ± 0.30 |
| FAI | 491 | 4.0 ± 1.8 | 2.1 ± 1.3 | 1.1 ± 0.4 | 25.2 ± 18.4 | 6.3 ± 2.5 | 21.7 ± 29.4 | 2.26 ± 2.11 | 1.9 ± 1.5 | 0.51 ± 0.33 |
| Injury | 1,105 | 4.3 ± 2.3 | 2.0 ± 1.4 | 1.1 ± 0.4 | 23.3 ± 20.2 | 5.2 ± 2.4 | 11.7 ± 32.0 | 1.50 ± 2.99 | 1.7 ± 1.7 | 0.43 ± 0.30 |
| JAR | 877 | 4.3 ± 1.6 | 1.8 ± 1.1 | 1.1 ± 0.4 | 26.4 ± 14.4 | 5.2 ± 2.2 | 17.4 ± 27.6 | 2.97 ± 3.24 | 2.0 ± 1.7 | 0.49 ± 0.34 |
| JBJS | 989 | 4.6 ± 2.3 | 2.2 ± 1.9 | 1.2 ± 0.6 | 30.5 ± 22.1 | 8.0 ± 2.8 | 60.7 ± 85.8 | 4.56 ± 5.28 | 1.9 ± 2.0 | 0.43 ± 0.32 |
| JHSA | 763 | 3.7 ± 1.6 | 1.4 ± 0.8 | 1.1 ± 0.3 | 19.7 ± 13.0 | 6.1 ± 2.3 | 24.9 ± 33.8 | 1.77 ± 1.91 | 2.0 ± 1.6 | 0.55 ± 0.33 |
| JHSE | 450 | 3.4 ± 1.9 | 1.4 ± 1.1 | 1.1 ± 0.5 | 18.8 ± 14.2 | 5.3 ± 2.5 | 20.0 ± 21.3 | 1.81 ± 2.32 | 1.5 ± 1.1 | 0.47 ± 0.29 |
| JOT | 444 | 4.3 ± 1.9 | 1.8 ± 1.3 | 1.1 ± 0.3 | 25.4 ± 15.8 | 5.8 ± 2.1 | 20.2 ± 32.3 | 2.27 ± 2.81 | 2.2 ± 1.8 | 0.55 ± 0.34 |
| JPO | 593 | 4.0 ± 1.7 | 1.9 ± 1.1 | 1.1 ± 0.3 | 20.3 ± 10.8 | 5.0 ± 1.6 | 16.7 ± 20.3 | 1.18 ± 1.38 | 1.9 ± 1.5 | 0.50 ± 0.31 |
| Spine | 1,566 | 5.1 ± 2.6 | 2.3 ± 1.7 | 1.2 ± 0.6 | 28.3 ± 18.0 | 6.5 ± 2.5 | 47.0 ± 79.3 | 3.46 ± 4.61 | 2.5 ± 2.6 | 0.50 ± 0.35 |
| p value | — | <10−15 | <10−15 | <10−15 | <10−15 | <10−15 | <10−15 | <10−15 | <10−15 | <10−15 |
| Decade | ||||||||||
| 1985–1987 | 1,576 | 3.0 ± 1.5 | 1.4 ± 0.7 | 1.1 ± 0.3 | 18.3 ± 13.2 | 5.8 ± 3.3 | 48.2 ± 75.1 | 1.55 ± 2.42 | 1.4 ± 0.9 | 0.49 ± 0.27 |
| 1995–1996 | 2,830 | 3.9 ± 1.9 | 1.7 ± 1.1 | 1.1 ± 0.4 | 24.7 ± 17.1 | 6.0 ± 2.7 | 51.3 ± 70.3 | 2.35 ± 3.33 | 1.7 ± 1.3 | 0.46 ± 0.30 |
| 2005–2006 | 3,924 | 4.6 ± 2.1 | 2.0 ± 1.4 | 1.2 ± 0.5 | 29.5 ± 19.1 | 6.9 ± 2.8 | 44.7 ± 53.3 | 4.04 ± 4.85 | 2.1 ± 2.0 | 0.48 ± 0.34 |
| 2015–2016 | 4,489 | 5.8 ± 2.7 | 2.6 ± 1.9 | 1.3 ± 0.7 | 33.9 ± 20.4 | 7.3 ± 2.8 | 3.2 ± 4.3 | 2.95 ± 3.89 | 3.2 ± 3.0 | 0.56 ± 0.38 |
| p value | — | <10−15 | <10−15 | <10−15 | <10−15 | <10−15 | <10−15 | <10−15 | <10−15 | 2.8−11 |
| Geographic Region | ||||||||||
| North America | 6,651 | 4.5 ± 2.4 | 2.0 ± 1.6 | 1.1 ± 0.5 | 29.2 ± 19.8 | 7.0 ± 3.0 | 36.8 ± 63.0 | 3.24 ± 4.36 | 2.5 ± 2.4 | 0.55 ± 0.35 |
| Asia | 1,771 | 5.4 ± 2.5 | 2.0 ± 1.3 | 1.2 ± 0.5 | 27.4 ± 14.7 | 6.8 ± 2.9 | 19.4 ± 33.4 | 2.32 ± 2.80 | 2.8 ± 2.8 | 0.50 ± 0.35 |
| Europe | 3,846 | 4.6 ± 2.4 | 2.1 ± 1.6 | 1.3 ± 0.7 | 28.0 ± 19.7 | 6.2 ± 2.7 | 30.4 ± 50.6 | 2.85 ± 4.03 | 1.9 ± 2.1 | 0.43 ± 0.31 |
| Australia/New Zealand | 393 | 4.6 ± 2.2 | 2.2 ± 1.5 | 1.2 ± 0.5 | 31.3 ± 20.2 | 6.9 ± 3.1 | 30.1 ± 51.5 | 3.21 ± 3.56 | 2.3 ± 2.2 | 0.53 ± 0.35 |
| Africa | 62 | 3.6 ± 1.9 | 1.8 ± 1.2 | 1.2 ± 0.4 | 18.9 ± 12.4 | 5.4 ± 2.2 | 13.3 ± 18.8 | 1.37 ± 1.54 | 1.5 ± 1.2 | 0.43 ± 0.28 |
| Latin America | 93 | 4.8 ± 2.7 | 1.9 ± 1.2 | 1.2 ± 0.6 | 30.4 ± 26.9 | 6.2 ± 2.7 | 19.3 ± 30.5 | 1.96 ± 2.02 | 1.8 ± 1.9 | 0.38 ± 0.28 |
| p value | — | <10−15 | 0.007 | <10−15 | 4.2 × 10⁻⁹ | <10−15 | <10−15 | <10−15 | <10−15 | <10−15 |
| Journal Editorial Office Location | ||||||||||
| North America | 9,857 | 4.8 ± 2.5 | 2.1 ± 1.6 | 1.2 ± 0.6 | 29.7 ± 19.2 | 7.0 ± 2.9 | 34.5 ± 58.4 | 3.24 ± 4.25 | 2.5 ± 2.5 | 0.49 ± 0.34 |
| Europe | 2,958 | 4.3 ± 2.2 | 1.9 ± 1.4 | 1.2 ± 0.5 | 24.8 ± 18.8 | 5.5 ± 2.4 | 22.7 ± 44.9 | 2.12 ± 3.09 | 1.9 ± 1.8 | 0.55 ± 0.37 |
| p value | — | <10−15 | 1.96 × 10⁻¹² | 0.11 | <10−15 | <10−15 | <10−15 | <10−15 | <10−15 | 5.1 × 10⁻¹¹ |
| First Author Gender | ||||||||||
| Male | 10,191 | 4.5 ± 2.3 | 2.0 ± 1.5 | 1.2 ± 0.5 | 27.6 ± 18.6 | 6.6 ± 2.9 | 33.5 ± 57.3 | 2.97 ± 4.08 | 2.2 ± 2.1 | 0.51 ± 0.34 |
| Female | 2,210 | 5.3 ± 2.8 | 2.3 ± 1.8 | 1.2 ± 0.6 | 33.6 ± 21.6 | 7.4 ± 2.9 | 27.9 ± 52.0 | 3.16 ± 4.02 | 3.0 ± 3.0 | 0.48 ± 0.35 |
| p value | — | <10−15 | <10−15 | 2 × 10⁻⁷ | <10−15 | <10−15 | 1.6 × 10⁻¹³ | 0.0005 | <10−15 | 7.2 × 10⁻⁸ |
| Corresponding Author Gender | ||||||||||
| Male | 10,555 | 4.6 ± 2.4 | 2.0 ± 1.5 | 1.2 ± 0.5 | 27.9 ± 19.0 | 6.6 ± 2.9 | 32.5 ± 55.4 | 2.97 ± 4.09 | 2.3 ± 2.3 | 0.54 ± 0.36 |
| Female | 1,782 | 5.2 ± 2.8 | 2.3 ± 1.8 | 1.2 ± 0.7 | 33.4 ± 20.4 | 7.3 ± 2.9 | 27.9 ± 50.3 | 3.14 ± 3.91 | 2.4 ± 2.7 | 0.49 ± 0.36 |
| p value | — | <10−15 | <10−15 | 0.018 | <10−15 | <10−15 | 2.6 × 10⁻⁹ | 0.0017 | 0.26 | 3.3 × 10⁻⁸ |
ABME = Annals of Biomedical Engineering, CTI = Calcified Tissue International, JBMR = Journal of Bone and Mineral Research, JOR = Journal of Orthopaedic Research, AJSM = American Journal of Sports Medicine, BJJ = Bone and Joint Journal, FAI = Foot and Ankle International, JAR = Journal of Arthroplasty, JBJS = Journal of Bone and Joint Surgery, JHSA = Journal of Hand Surgery American, JHSE = Journal of Hand Surgery European, JOT = Journal of Orthopaedic Trauma, and JPO = Journal of Pediatric Orthopaedics.
The decade, journal/journal type, author, gender, and geographic region were the variables entered into the multifactorial ANOVA (Table 2) to study their effects on continuous bibliometric variables. When using each specific journal, author number was dependent on all variables except the corresponding author gender. The number of institutions, countries, and references were dependent upon the decade, journal, and geographic region of origin. The number of references was dependent upon the decade, journal, and geographic region. The number of pages was dependent upon the decade, journal, 1st author gender, and geographic region. The number of citations and annualized citations were dependent upon the decade, journal, and geographic region. The corresponding author position, both actual and normalized, was dependent upon all variables.
Table 2.
Multifactorial ANOVA of continuous variables, with p values.
| Variable | Author number | Number of institutions | Number of Countries | Number of references | Number of pages | Number of citations | Number of annualized citations | Corresponding author position | Corresponding author position normalized |
|---|---|---|---|---|---|---|---|---|---|
| Decade | 8.6 × 10⁻¹² | 9.8 × 10⁻¹² | 1.3 × 10⁻¹¹ | 1 × 10⁻¹¹ | 1.1 × 10⁻¹¹ | 8.9 × 10⁻¹² | 1.1 × 10⁻¹¹ | 9.6 × 10⁻¹² | 1.5 × 10⁻¹¹ |
| Journal | 5.4 × 10⁻¹² | 7.1 × 10⁻¹² | 8.2 × 10⁻¹² | 5.6 × 10⁻¹² | 4.5 × 10⁻¹² | 6.3 × 10⁻¹² | 6.3 × 10⁻¹² | 5.9 × 10⁻¹² | 8.3 × 10⁻¹² |
| 1st author Gender | 0.004 | 0.09 | 0.99 | 0.07 | 0.002 | 0.44 | 0.75 | 1.9 × 10⁻¹¹ | 2.1 × 10⁻¹¹ |
| CA gender | 0.014 | 0.75 | 0.012 | 0.70 | 0.72 | 0.67 | 0.58 | 1.9 × 10⁻¹¹ | 1.9 × 10⁻¹¹ |
| Region | 1.5 × 10⁻¹¹ | 0.005 | 1.5 × 10⁻¹¹ | 2.4 × 10⁻¹⁰ | 0.00004 | 1.1 × 10⁻⁷ | 1.6 × 10⁻¹¹ | 1.4 × 10⁻¹¹ | 1.1 × 10⁻¹¹ |
| Decade | 8.7 × 10⁻¹² | 9.8 × 10⁻¹² | 1.3 × 10⁻¹¹ | 9.9 × 10⁻¹² | 1.1 × 10⁻¹¹ | 8.9 × 10⁻¹² | 1.8 × 10⁻¹¹ | 9.6 × 10⁻¹² | 1.5 × 10⁻¹¹ |
| Journal type | 1.5 × 10⁻¹¹ | 2.0 × 10⁻¹¹ | 1.9 × 10⁻¹¹ | 1.5 × 10⁻¹¹ | 1.4 × 10⁻¹¹ | 0.56 | 0.007 | 1.5 × 10⁻¹¹ | 1.8 × 10⁻¹¹ |
| 1st author Gender | 0.0002 | 0.038 | 0.69 | 0.04 | 0.031 | 0.44 | 0.82 | 1.9 × 10⁻¹¹ | 2.0 × 10⁻¹¹ |
| CA gender | 0.09 | 0.45 | 0.029 | 0.37 | 0.52 | 0.99 | 0.93 | 1.9 × 10⁻¹¹ | 1.9 × 10⁻¹¹ |
| Region | 1.6 × 10⁻¹¹ | 0.002 | 1.5 × 10⁻¹¹ | 1.7 × 10⁻¹¹ | 1.3 × 10⁻¹¹ | 1.6 × 10⁻¹¹ | 1.4 × 10⁻¹¹ | 1.3 × 10⁻¹¹ | 1.1 × 10⁻¹¹ |
When using journal type (basic/clinical) instead of the actual journal, the author number was dependent upon all variables except for the corresponding author gender. The number of institutions, countries, pages, and references were dependent upon decade, journal type, and geographic region of origin. The number of citations and annualized citations were dependent upon the decade and geographic region. Both the actual and normalized corresponding author positions were again dependent upon all the variables.
3.2. Gender Analyses
There were differences in first author gender by journal type, specific journal, decade, geographic region, corresponding author location, and single authorship (Table 3). There were more female 1st authors in the basic science group compared to the clinical group (33.2% vs. 12.7%). The percentage of female first authors rose from 10.8% in 1985–1987 to 23.7% in 2015–2016. The highest percentage of female first authors was in Australia/New Zealand (29.9%) and the lowest in Asia (13.6%). The corresponding author was more commonly last compared to 1st (23.6% vs. 15.5%) when the first author was female. Single-authored manuscripts were more likely to be written by males (5.1% vs. 2.4%). There were differences in corresponding author gender by journal type, specific journal, decade, and geographic region. Female corresponding authors were more common in the basic science group compared to the clinical group (25.8% vs. 10.6%). The percentage of female corresponding authors rose from 8.9% in 1985–1987 to 18.9% in 2015–2016. The highest percentage of female corresponding authors was in Australia/New Zealand (23.3%) and the lowest in Asia (10.8%). There were no differences between North-American- and European-based journals by author gender, either 1st or corresponding (p = 0.33 and p = 0.36, respectively).
Table 3.
Author gender.
| 1st author gender | Corresponding author gender | |||||||||
|---|---|---|---|---|---|---|---|---|---|---|
| Female | Male | %F | %M | p value | Female | Male | %F | %M | p value | |
| Journal type | ||||||||||
| Clinical | 1,180 | 8,123 | 12.7 | 87.3 | <10−15 | 978 | 8,246 | 10.6 | 89.4 | <10−15 |
| Basic science | 1,030 | 2,068 | 33.2 | 66.8 | 804 | 2,309 | 25.8 | 74.2 | ||
| Specific journal | ||||||||||
| ABME | 91 | 302 | 23.2 | 76.8 | <10−15 | 71 | 326 | 17.9 | 82.1 | <10−15 |
| BONE | 324 | 548 | 37.2 | 62.8 | 251 | 621 | 28.8 | 71.2 | ||
| CTI | 188 | 316 | 37.3 | 62.7 | 142 | 365 | 28.0 | 72.0 | ||
| JBMR | 286 | 445 | 39.1 | 60.9 | 229 | 505 | 31.2 | 68.8 | ||
| JOR | 141 | 457 | 23.6 | 76.4 | 111 | 492 | 18.4 | 81.6 | ||
| AJSM | 107 | 700 | 13.3 | 86.7 | 96 | 717 | 11.8 | 88.2 | ||
| Arthroscopy | 85 | 776 | 9.9 | 90.1 | 41 | 591 | 6.5 | 93.5 | ||
| BJJ | 86 | 723 | 10.6 | 89.4 | 76 | 756 | 9.1 | 90.9 | ||
| FAI | 65 | 410 | 13.7 | 86.3 | 62 | 412 | 13.1 | 86.9 | ||
| Injury | 152 | 900 | 14.4 | 85.6 | 139 | 923 | 13.1 | 86.9 | ||
| JAR | 85 | 776 | 9.9 | 90.1 | 84 | 773 | 9.8 | 90.2 | ||
| JBJS | 110 | 849 | 11.5 | 88.5 | 91 | 747 | 10.9 | 89.1 | ||
| JHSA | 106 | 650 | 14.0 | 86.0 | 73 | 683 | 9.7 | 90.3 | ||
| JHSE | 56 | 383 | 12.8 | 87.2 | 38 | 401 | 8.7 | 91.3 | ||
| JOT | 44 | 388 | 10.2 | 89.8 | 32 | 406 | 7.3 | 92.7 | ||
| JPO | 96 | 489 | 16.4 | 83.6 | 68 | 515 | 11.7 | 88.3 | ||
| Spine | 223 | 1,284 | 14.8 | 85.2 | 178 | 1,322 | 11.9 | 88.1 | ||
| Decade | ||||||||||
| 1985–1987 | 164 | 1,353 | 10.8 | 89.2 | <10−15 | 128 | 1,312 | 8.9 | 91.1 | <10−15 |
| 1995–1996 | 403 | 2,377 | 14.5 | 85.5 | 329 | 2,459 | 11.8 | 88.2 | ||
| 2005–2006 | 619 | 3,171 | 16.3 | 83.7 | 513 | 3,291 | 13.5 | 86.5 | ||
| 2015–2016 | 1,024 | 3,290 | 23.7 | 76.3 | 812 | 3,493 | 18.9 | 81.1 | ||
| Geographic Region | ||||||||||
| North America | 1,109 | 5,465 | 16.9 | 83.1 | <10−15 | 870 | 5,637 | 13.4 | 86.6 | 2.2 × 10⁻¹⁴ |
| Asia | 213 | 1,355 | 13.6 | 86.4 | 169 | 1,396 | 10.8 | 89.2 | ||
| Europe | 751 | 2,974 | 20.2 | 79.8 | 634 | 3,097 | 17.0 | 83.0 | ||
| Australia/New Zealand | 114 | 267 | 29.9 | 70.1 | 89 | 293 | 23.3 | 76.7 | ||
| Journal Editorial Office Location | ||||||||||
| North America | 1,728 | 7,869 | 18.0 | 82.0 | 0.33 | 1,387 | 8,110 | 14.6 | 85.4 | 0.36 |
| Europe | 482 | 2,322 | 17.2 | 82.8 | 395 | 2,445 | 13.9 | 86.1 | ||
| Corresponding author location | ||||||||||
| First | 1,131 | 6,182 | 15.5 | 84.5 | <10−15 | 1,092 | 6,129 | 15.1 | 84.9 | 0.16 |
| Second | 157 | 806 | 16.3 | 83.7 | 131 | 841 | 13.5 | 86.5 | ||
| Other | 87 | 305 | 22.2 | 77.8 | 51 | 345 | 12.9 | 87.1 | ||
| Last | 782 | 2,525 | 23.6 | 76.4 | 462 | 2,883 | 13.8 | 86.2 | ||
| Single Author | ||||||||||
| No | 2,157 | 9,638 | 97.6 | 94.9 | 2.3 × 10⁻⁹ | |||||
| Yes | 53 | 552 | 2.4 | 5.1 | ||||||
ABME = Annals of Biomedical Engineering, CTI = Calcified Tissue International, JBMR = Journal of Bone and Mineral Research, JOR = Journal of Orthopaedic Research, AJSM = American Journal of Sports Medicine, BJJ = Bone and Joint Journal, FAI = Foot and Ankle International, JAR = Journal of Arthroplasty, JBJS = Journal of Bone and Joint Surgery, JHSA = Journal of Hand Surgery American, JHSE = Journal of Hand Surgery European, JOT = Journal of Orthopaedic Trauma, and JPO = Journal of Pediatric Orthopaedics.
For author gender combinations, there were more FF and FM (Table 4) in the basic science vs. clinical science journals (Figure 1(a)), more recent decades (Figure 1(b)), and Australia/New Zealand compared to other regions (Figure 1(c)). There were no differences between North-American- and European-based journals by author gender combinations (p = 0.57).
Table 4.
Author gender combinations.
| FF | FM | MF | MM | %FF | %FM | %MF | %MM | p value | |
|---|---|---|---|---|---|---|---|---|---|
| All | 239 | 777 | 367 | 3,174 | 5.2 | 17.1 | 8.1 | 69.7 | — |
| Journal type | |||||||||
| Clinical | 64 | 393 | 208 | 2,376 | 2.1 | 12.9 | 6.8 | 78.1 | <10−15 |
| Basic Science | 175 | 384 | 159 | 798 | 11.5 | 25.3 | 10.5 | 52.6 | |
| Specific journal | |||||||||
| ABME | 12 | 44 | 21 | 140 | 5.5 | 20.3 | 9.7 | 64.5 | <10−15 |
| BONE | 51 | 117 | 47 | 193 | 12.5 | 28.7 | 11.5 | 47.3 | |
| CTI | 30 | 66 | 20 | 84 | 15.0 | 33.0 | 10.0 | 42.0 | |
| JBMR | 59 | 93 | 37 | 191 | 15.5 | 24.5 | 9.7 | 50.3 | |
| JOR | 23 | 64 | 34 | 190 | 7.4 | 20.6 | 10.9 | 61.1 | |
| AJSM | 9 | 32 | 22 | 229 | 3.1 | 11.0 | 7.5 | 78.4 | |
| Arthroscopy | 3 | 19 | 7 | 168 | 1.5 | 9.6 | 3.6 | 85.3 | |
| BJJ | 2 | 25 | 14 | 164 | 1.0 | 12.2 | 6.8 | 80.0 | |
| FAI | 5 | 17 | 13 | 135 | 2.9 | 10.0 | 7.6 | 79.4 | |
| Injury | 7 | 32 | 22 | 179 | 2.9 | 13.3 | 9.2 | 74.6 | |
| JAR | 3 | 30 | 28 | 269 | 0.9 | 9.1 | 8.5 | 81.5 | |
| JBJS | 4 | 26 | 12 | 186 | 1.8 | 11.4 | 5.3 | 81.6 | |
| JHSA | 4 | 26 | 12 | 186 | 1.8 | 11.4 | 5.3 | 81.6 | |
| JHSE | 2 | 18 | 3 | 84 | 1.9 | 16.8 | 2.8 | 78.5 | |
| JOT | 3 | 24 | 12 | 152 | 1.6 | 12.6 | 6.3 | 79.6 | |
| JPO | 2 | 38 | 19 | 159 | 0.9 | 17.4 | 8.7 | 72.9 | |
| Spine | 14 | 84 | 41 | 431 | 2.5 | 14.7 | 7.2 | 75.6 | |
| Decade | |||||||||
| 1985–1987 | 6 | 46 | 17 | 273 | 1.8 | 13.5 | 5.0 | 79.8 | 1.4 × 10⁻¹⁴ |
| 1995–1996 | 28 | 106 | 43 | 651 | 3.4 | 12.8 | 5.2 | 78.6 | |
| 2005–2006 | 67 | 219 | 118 | 945 | 5.0 | 16.2 | 8.7 | 70.1 | |
| 2015–2016 | 138 | 406 | 189 | 1,305 | 6.8 | 19.9 | 9.3 | 64.0 | |
| Geographic region | |||||||||
| North America | 127 | 455 | 225 | 2,016 | 4.5 | 16.1 | 8.0 | 71.4 | 1.1 × 10⁻⁷ |
| Asia | 22 | 88 | 40 | 447 | 3.7 | 14.7 | 6.7 | 74.9 | |
| Europe | 69 | 138 | 88 | 604 | 7.7 | 15.4 | 9.8 | 67.2 | |
| Australia/New Zealand | 17 | 34 | 10 | 90 | 11.3 | 22.5 | 6.6 | 59.6 | |
| Journal editorial office location | |||||||||
| North America | 198 | 636 | 308 | 2663 | 5.2 | 16.7 | 8.1 | 70.0 | 0.57 |
| Europe | 41 | 141 | 59 | 511 | 5.5 | 18.8 | 7.8 | 68.0 |
FF = both authors female, FM = first author female and corresponding author male, MF = first author male and corresponding author female, and MM = both authors male. ABME = Annals of Biomedical Engineering, CTI = Calcified Tissue International, JBMR = Journal of Bone and Mineral Research, JOR = Journal of Orthopaedic Research, AJSM = American Journal of Sports Medicine, BJJ = Bone and Joint Journal, FAI = Foot and Ankle International, JAR = Journal of Arthroplasty, JBJS = Journal of Bone and Joint Surgery, JHSA = Journal of Hand Surgery American, JHSE = Journal of Hand Surgery European, JOT = Journal of Orthopaedic Trauma, and JPO = Journal of Pediatric Orthopaedics.
Figure 1.
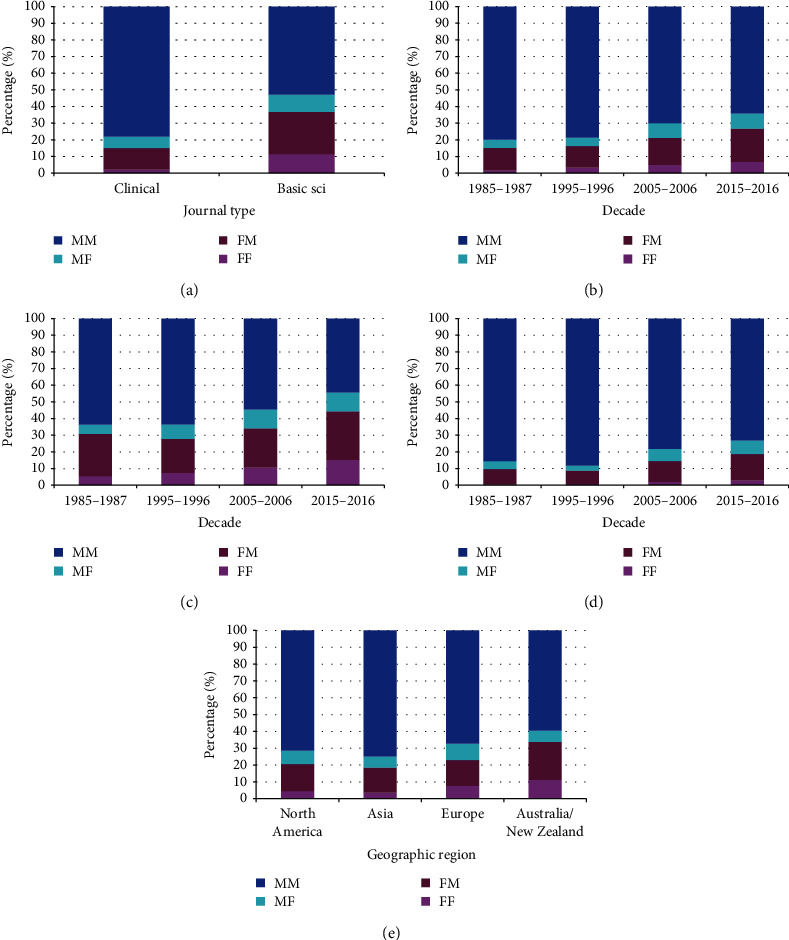
Gender combinations of first and corresponding authors, excluding single-authored manuscripts and those where the first author was also the corresponding author (FF = both authors female, FM = 1st author female and corresponding author male, MF = 1stauthor male and corresponding author male, MM = both authors male). (a) By journal type (p < 10−15). (b) By decade (p = 1.4 × 10⁻¹⁴). (c) By decade for basic science journals (p = 1 × 10⁻⁶). (d) By decade for clinical journals (p = 2.5 × 10⁻¹⁰). (e) By geographic region (p = 1.1 × 10⁻⁷).
3.3. Changes over Time
Of the 17 journals, seven demonstrated an increased percentage in the number of manuscripts per decade (BONE, JOR, AJSM, Injury, JAR, JHSA, JOT), five had essentially no change between 2015 and 2016 compared to 2005-2006 (ABME, CTI, JBMR, JHSE, JPO), and five (Arthroscopy, BJJ, FAI, JBJS, Spine) had fewer manuscripts in 2015–2016 compared to 2005–2006 (Figure 2(a)) (Table 5). Proportionally, manuscripts from North America and Europe decreased over time (Figure 2(b)) while manuscripts from Asia demonstrated an increase. There was an increase in author numbers for all 17 journals, going from 3.0 ± 1.5 in 1985–1987 to 5.8 ± 2.7 in 2015–2016 (Figure 2(c)). The percentage increase was the highest for Arthroscopy (147%) and the lowest for JAR (53%). There was an increase in the number of references per manuscript over time for all journals (Figure 2(d)), going from an average 18.3 ± 13.2 in 1985–1987 to 33.9 ± 20.4 in 2015–2016. Some journals had greater increases compared to others. Injury had the highest increase (204%) and FAI the lowest (27%). The standardized corresponding author position increased over time in some journals, indicating a move toward the end of the author byline, while in other journals it did not change or moved in the opposite direction over time (Figure 2(e)). The journal with the greatest move to the end of the author byline was Spine (50%), going from 0.49 to 0.74, the greatest move in the opposite direction was in FAI (36%), going from 0.76 to 0.48. Overall, eight of the journals moved more to the end of the byline while nine moved more to the beginning of the byline. The number of institutions involved in a study increased over time, going from 1.4 ± 0.7 in 1985–1987 to 2.6 ± 1.9 in 2015–2016, and was seen in all journals (Figure 2(f)). The number of pages on average increased over time, going from 5.8 ± 3.3 in 1985–1987 to 7.3 ± 2.8 in 2015–16; however, there was marked variability by journal (Figure 2(g)) with 11 showing an increase, five a decrease, and one (JBJS) with no change. The journal with the greatest increase in page number was JHSE (82.1%) and the journal with the greatest decrease was JAR (−35%). The raw data for Figures 2(b)–2(g) are given in S1 Appendix.
Figure 2.
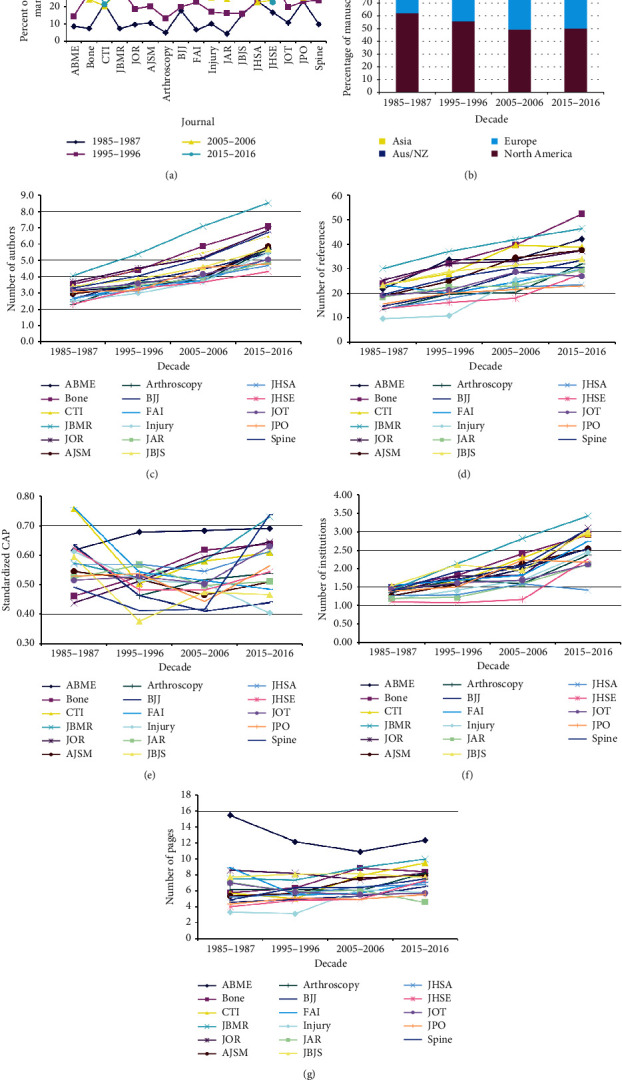
(a) The percentage of manuscripts published per year by specific journal (p < 10−15). ABME = Annals of Biomedical Engineering, CTI = Calcified Tissue International, JBMR = Journal of Bone and Mineral Research, JOR = Journal of Orthopaedic Research, AJSM = American Journal of Sports Medicine, BJJ = Bone and Joint Journal, FAI = Foot and Ankle International, JAR = Journal of Arthroplasty, JBJS = Journal of Bone and Joint Surgery, JHSA = Journal of Hand Surgery American, JHSE = Journal of Hand Surgery European, JOT = Journal of Orthopaedic Trauma, and JPO = Journal of Pediatric Orthopaedics. (b) Changes over time by region of origin for all manuscripts (p < 10−15). (c) Increasing number of authors over time for all journals (p < 10−15). (d) Increasing number of references over time for all journals (p < 10−15). (e) Change in the standardized corresponding author position over time for all journals (p < 10−15). (f) Change in the number of institutions over time for all journals (p < 10−15). (g) Changes in the average number of pages per manuscript over time and by journal (p < 10−15).
Table 5.
Changes over time in the number of manuscripts.
| 1985–1987 | 1995–1996 | 2005–2006 | 2015–2016 | % 1985–1987 | % 1995–1996 | %2005–2006 | % 2015–2016 | p value | |
|---|---|---|---|---|---|---|---|---|---|
| Journal type | |||||||||
| Clinical | 1,248 | 1,974 | 3,012 | 3,407 | 12.9 | 20.5 | 31.2 | 35.3 | 5.7 × 10⁻¹⁴ |
| Basic science | 328 | 856 | 912 | 1,082 | 10.3 | 26.9 | 28.7 | 34.0 | |
| Specific journal | |||||||||
| ABME | 35 | 58 | 155 | 154 | 8.7 | 14.4 | 38.6 | 38.3 | <10−15 |
| BONE | 67 | 258 | 219 | 355 | 7.5 | 28.7 | 24.4 | 39.5 | |
| CTI | 111 | 187 | 106 | 110 | 21.6 | 36.4 | 20.6 | 21.4 | |
| JBMR | 55 | 237 | 230 | 224 | 7.4 | 31.8 | 30.8 | 30.0 | |
| JOR | 60 | 116 | 202 | 239 | 9.7 | 18.8 | 32.7 | 38.7 | |
| AJSM | 86 | 165 | 213 | 350 | 10.6 | 20.3 | 26.2 | 43.0 | |
| Arthroscopy | 33 | 87 | 307 | 229 | 5.0 | 13.3 | 46.8 | 34.9 | |
| BJJ | 159 | 178 | 298 | 258 | 17.8 | 19.9 | 33.4 | 28.9 | |
| FAI | 33 | 112 | 188 | 158 | 6.7 | 22.8 | 38.3 | 32.2 | |
| Injury | 112 | 188 | 281 | 524 | 10.1 | 17.0 | 25.4 | 47.4 | |
| JAR | 37 | 143 | 216 | 481 | 4.2 | 16.3 | 24.6 | 54.8 | |
| JBJS | 154 | 159 | 400 | 276 | 15.6 | 16.1 | 40.4 | 27.9 | |
| JHSA | 179 | 175 | 174 | 235 | 23.5 | 22.9 | 22.8 | 30.8 | |
| JHSE | 75 | 167 | 107 | 101 | 16.7 | 37.1 | 23.8 | 22.4 | |
| JOT | 48 | 88 | 125 | 183 | 10.8 | 19.8 | 28.2 | 41.2 | |
| JPO | 138 | 137 | 152 | 166 | 23.3 | 23.1 | 25.6 | 28.0 | |
| Spine | 154 | 375 | 591 | 446 | 9.8 | 23.9 | 37.7 | 28.5 | |
| Geographic region | |||||||||
| North America | 969 | 1,560 | 1,906 | 2,216 | 14.6 | 23.5 | 28.7 | 33.3 | <10−15 |
| Asia | 110 | 263 | 568 | 830 | 6.2 | 14.9 | 32.1 | 46.9 | |
| Europe | 451 | 905 | 1,270 | 1,220 | 11.7 | 23.5 | 33.0 | 31.7 | |
| Australia/New Zealand | 31 | 71 | 129 | 162 | 7.9 | 18.1 | 32.8 | 41.2 | |
| Africa | 10 | 10 | 16 | 26 | 16.1 | 16.1 | 25.8 | 41.9 | |
| Latin America | 4 | 20 | 35 | 34 | 4.3 | 21.5 | 37.6 | 36.6 | |
| Journal editorial office location | |||||||||
| North America | 1,119 | 2,110 | 3,132 | 3496 | 11.4 | 21.4 | 31.8 | 35.5 | 4.0 × 10⁻¹³ |
| Europe | 457 | 720 | 792 | 993 | 15.4 | 24.3 | 26.7 | 33.5 | |
| Corresponding author location | |||||||||
| First | 1,081 | 1,823 | 2,384 | 2191 | 14.5 | 24.4 | 31.9 | 29.3 | <10−15 |
| Second | 129 | 255 | 334 | 302 | 12.6 | 25.0 | 32.7 | 29.6 | |
| Other | 38 | 83 | 107 | 193 | 9.0 | 19.7 | 25.4 | 45.8 | |
| Last | 220 | 539 | 974 | 1729 | 6.4 | 15.6 | 28.1 | 49.9 | |
| Single Author | |||||||||
| No | 1,356 | 2,645 | 3778 | 4,418 | 11.1 | 21.7 | 31.0 | 36.2 | <10−15 |
| Yes | 220 | 185 | 146 | 70 | 35.4 | 29.8 | 23.5 | 11.3 |
ABME = Annals of Biomedical Engineering, CTI = Calcified Tissue International, JBMR = Journal of Bone and Mineral Research, JOR = Journal of Orthopaedic Research, AJSM = American Journal of Sports Medicine, BJJ = Bone and Joint Journal, FAI = Foot and Ankle International, JAR = Journal of Arthroplasty, JBJS = Journal of Bone and Joint Surgery, JHSA = Journal of Hand Surgery American, JHSE = Journal of Hand Surgery European, JOT = Journal of Orthopaedic Trauma, and JPO = Journal of Pediatric Orthopaedics.
3.4. Corresponding Author Location
Corresponding author location was known for 12,382 manuscripts. It was first in 60.4% (7,479), second in 8.2% (1,020), other in 3.4% (421), and last in 28.0% (3,462). We deleted the second and other positions for further analyses (Table 6), keeping the first and last positions. The corresponding author occupying the last position differed markedly by journal, ranging from 18.5% to 52.1%, and was 46.1% for the basic science and 26.7% for the clinical journals. The corresponding author occupying the last position increased over time, going from 16.9% in 1985–87 to 44.1% in 2015–2016 (p < 10−15). The corresponding author occupying the last position was observed in 20.8% of the manuscripts from Europe and 37.6% from North America (p < 10−15). Of note, the first author was more commonly the corresponding author in European-based journals compared to North-American-based journals (78.2% vs. 65.3%, p < 10−15).
Table 6.
Corresponding author location.
| Variable | First | Last | % first | % last | p value |
|---|---|---|---|---|---|
| Journal type | |||||
| Clinical | 5,977 | 2,179 | 73.3 | 26.7 | <10−15 |
| Basic science | 1,502 | 1,283 | 53.9 | 46.1 | |
| Specific journal | |||||
| ABME | 172 | 187 | 47.9 | 52.1 | <10−15 |
| BONE | 421 | 340 | 55.3 | 44.7 | |
| CTI | 285 | 155 | 64.8 | 35.2 | |
| JBMR | 338 | 346 | 49.4 | 50.6 | |
| JOR | 286 | 255 | 52.9 | 47.1 | |
| AJSM | 515 | 188 | 73.3 | 26.7 | |
| Arthroscopy | 427 | 145 | 74.7 | 25.3 | |
| BJJ | 638 | 156 | 80.4 | 19.6 | |
| FAI | 300 | 127 | 70.3 | 29.7 | |
| Injury | 748 | 170 | 81.5 | 18.5 | |
| JAR | 488 | 224 | 68.5 | 31.5 | |
| JBJS | 621 | 171 | 78.4 | 21.6 | |
| JHSA | 621 | 171 | 78.4 | 21.6 | |
| JHSE | 638 | 156 | 80.4 | 19.6 | |
| JOT | 227 | 140 | 61.9 | 38.1 | |
| JPO | 345 | 131 | 72.5 | 27.5 | |
| Spine | 880 | 439 | 66.7 | 33.3 | |
| Decade | |||||
| 1985–1987 | 1,081 | 220 | 83.1 | 16.9 | <10−15 |
| 1995–1996 | 1,823 | 539 | 77.2 | 22.8 | |
| 2005–2006 | 2,384 | 974 | 71.0 | 29.0 | |
| 2015–2016 | 2,191 | 1,729 | 55.9 | 44.1 | |
| Geographic region | |||||
| North America | 3,526 | 2,129 | 62.4 | 37.6 | <10−15 |
| Asia | 938 | 489 | 65.7 | 34.3 | |
| Europe | 2,681 | 704 | 79.2 | 20.8 | |
| Australia/New Zealand | 221 | 119 | 65.0 | 35.0 | |
| Journal editorial office location | |||||
| Europe | 2,000 | 556 | 78.2 | 21.8 | <10−15 |
| North America | 5,479 | 2,906 | 65.3 | 34.7 |
ABME = Annals of Biomedical Engineering, CTI = Calcified Tissue International, JBMR = Journal of Bone and Mineral Research, JOR = Journal of Orthopaedic Research, AJSM = American Journal of Sports Medicine, BJJ = Bone and Joint Journal, FAI = Foot and Ankle International, JAR = Journal of Arthroplasty, JBJS = Journal of Bone and Joint Surgery, JHSA = Journal of Hand Surgery American, JHSE = Journal of Hand Surgery European, JOT = Journal of Orthopaedic Trauma, and JPO = Journal of Pediatric Orthopaedics.
3.5. Single Author Manuscripts
The percentage of single author manuscripts was 4.8% (621 of 12,819) and ranged from 0.9% in JBMR to 9.6% in JHSE (Table 7). Single-author manuscripts declined over the past 30 years from 14.0% to 1.6% (p < 10−15). Single authorship was more common for manuscripts originating from Europe (5.4%) compared to other regions (3.0 to 4.9%) (p = 0.00017), was more common in the clinical journals compared to the basic science journals (5.5 vs. 2.8%, p = 6.1 × 10⁻¹⁰), and was more common in European-based journals compared to North-American-based journals (6.8 vs. 4.3%, p = 1.1 × 10⁻⁸).
Table 7.
Single-author manuscripts.
| No | Yes | % no | % yes | p value | |
|---|---|---|---|---|---|
| Journal type | |||||
| Clinical | 9,108 | 532 | 94.5 | 5.5 | 6.1 × 10⁻¹⁰ |
| Basic science | 3,089 | 89 | 97.2 | 2.8 | |
| Specific journal | |||||
| ABME | 386 | 16 | 96.0 | 4.0 | <10−15 |
| BONE | 865 | 34 | 96.2 | 3.8 | |
| CTI | 489 | 25 | 95.1 | 4.9 | |
| JBMR | 739 | 7 | 99.1 | 0.9 | |
| JOR | 610 | 7 | 98.9 | 1.1 | |
| AJSM | 773 | 41 | 95.0 | 5.0 | |
| Arthroscopy | 604 | 52 | 92.1 | 7.9 | |
| BJJ | 838 | 55 | 93.8 | 6.2 | |
| FAI | 470 | 21 | 95.7 | 4.3 | |
| Injury | 1,026 | 79 | 92.9 | 7.1 | |
| JAR | 833 | 44 | 95.0 | 5.0 | |
| JBJS | 940 | 49 | 95.0 | 5.0 | |
| JHSA | 711 | 52 | 93.2 | 6.8 | |
| JHSE | 406 | 43 | 90.4 | 9.6 | |
| JOT | 429 | 15 | 96.6 | 3.4 | |
| JPO | 567 | 26 | 95.6 | 4.4 | |
| Spine | 1,511 | 55 | 96.5 | 3.5 | |
| Decade | |||||
| 1985–1987 | 1,356 | 220 | 86.0 | 14.0 | <10−15 |
| 1995–1996 | 2,645 | 185 | 93.5 | 6.5 | |
| 2005–2006 | 3,778 | 146 | 96.3 | 3.7 | |
| 2015–2016 | 4,418 | 70 | 98.4 | 1.6 | |
| Geographic region | |||||
| North America | 6,323 | 327 | 95.1 | 4.9 | 0.0017 |
| Asia | 1,717 | 54 | 97.0 | 3.0 | |
| Europe | 3,639 | 207 | 94.6 | 5.4 | |
| Australia/New Zealand | 1,717 | 54 | 97.0 | 3.0 | |
| Journal editorial office location | |||||
| North America | 9,438 | 419 | 95.7 | 4.3 | 1.1 × 10⁻⁸ |
| Europe | 2759 | 202 | 93.2 | 6.8 |
ABME = Annals of Biomedical Engineering, CTI = Calcified Tissue International, JBMR = Journal of Bone and Mineral Research, JOR = Journal of Orthopaedic Research, AJSM = American Journal of Sports Medicine, BJJ = Bone and Joint Journal, FAI = Foot and Ankle International, JAR = Journal of Arthroplasty, JBJS = Journal of Bone and Joint Surgery, JHSA = Journal of Hand Surgery American, JHSE = Journal of Hand Surgery European, JOT = Journal of Orthopaedic Trauma, and JPO = Journal of Pediatric Orthopaedics.
3.6. Analyses within Regions
This section focuses on findings within regions as the more global results are described above. Of the 6,651 manuscripts from North America, 6,120 (92.0%) came from the United Sates and 531 came (8.0%) from Canada; the four most common states were California (761–12.4%), New York (642–10.5%), Pennsylvania (418–6.8%), and Massachusetts (407–6.7%). There were 1,737 from the North East (28.4%), 1,644 from the Midwest (26.9%), 1,534 from the South (25.1%), and 1,199 from the West (19.6%) (S2 Appendix). There were some significant differences between the different regions (decade, journal type, first author gender), but when visually reviewing them they are likely not meaningful.
For Canada, the four most common provinces were Ontario (285–60.0%), Quebec (90–17.7%), Alberta (56–11.0%), and British Columbia (55–10.8%); 69.5% were from the Midwest, 19.6% the East, and 10.8% the West. It was suggestive that the East was more likely to contribute a basic science manuscript (44.0% basic science, 56.0% clinical) compared to the West (30.9% basic science, 69.1% clinical) and the Midwest (27.4% basic science, 72.6% clinical) (p = 0.0066) (S3 Appendix). The East also had the lowest percentage of MM gender author combination (42.2%) compared to the West (53.6%) and the Midwest (66.5%) (p = 0.005).
Of the 3,846 from Europe, the four most common countries were the United Kingdom (1,360–35.4%), Germany (379–9.9%), The Netherlands (269–7.0%), and France (254–6.6%). The manuscripts from the Nordic countries and British Isles (S4 Appendix) decreased over time and those from Continental Europe increased over time (Continental Europe went from 6.2% in 1985–1987 to 28.3% in 2015–2016 (p < 10−15)); the percentage of basic science manuscripts ranged from 14.7% for the British Isles to 32.7% for Nordic Europe (p < 10−15); single-author manuscripts ranged from 3.0% for Continental Europe to 8.0% for the British Isles (p < 10−9); female first author manuscripts ranged from 16.7% for Continental Europe to 25.3% for Nordic Europe (p = 0.00004); female corresponding author manuscripts ranged from 13.1% for Continental Europe to 23.5% for Nordic Europe (p = 1.2 × 10⁻⁷); and MM gender author combination ranged from 57.9% in Continental Europe to 70.1% in the British Isles (p = 0.0008). When analyzing by the political division groups in Europe, 2.8% came from the Eastern Bloc. The only noticeable difference between the Eastern Bloc and the remainder of Europe (S4 Appendix) was the number of Eastern Bloc manuscripts over time (Figure 3). Of all the manuscripts from the Eastern Bloc, 7.5% were published in 1985–1987 and increased to 41.5% in 2015–2016; or stated differently, 1.8% of all manuscripts in 1985–1987 came from the Eastern Bloc and doubled to 3.6% in 2015–2016.
Figure 3.
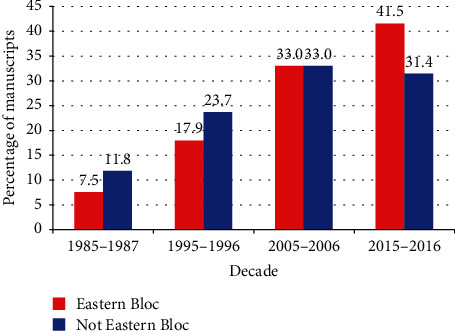
Differences by decade for previous Eastern Bloc nations (p = 0.013—Cochrane linear trend test). The sum of the percentages for each group will equal 100. Thus, the percentage of manuscripts coming from Eastern Bloc countries in 2015–2016 accounted for 41.5% of all the manuscripts from the Eastern Bloc.
Of the 1,771 published manuscripts from Asia (S5 Appendix), 1,463 originated from four Asian countries: 39.6% (702) originated from Japan, 18.9% (334) from China, 15.6% (276) from South Korea, and 7.0% (124) from Israel. There were marked differences between all four countries (all p < 10−6) except for single-author manuscripts (p = 0.75). The proportion of manuscripts from China and Korea increased over time while the proportion from Japan decreased and from Israel it was relatively unchanged. Of all the manuscripts from China, 0.9% were published in 1985–1987 and increased to 75.4% in 2015–2016. A similar trend was noted for those from Korea, going from 0% of their total in 1985–1987 to 64.1% in 2015–2016. For Japan, the percentage of all their manuscripts went from 7.5% in 1985–1987 to 31.6% in 2015–2016; the percentages for Israel remained relatively constant, the low being 23.4% in 1985–1987 and the high being 27.4% in 2005–2006. The percentage of manuscripts in basic science journals per country was highest for Israel (33.1%) and lowest for Korea (13.0%). The percentage of female first and corresponding authors was highest for manuscripts from China (21.5% for both) and lowest for Japan (8.3% and 6.1%, respectively). The author gender combination MM was lowest in China (58.1%) and highest in Japan (86.7%).
3.7. Predictors of a Female Author and Single Author Manuscript
We next determined which variables could predict author gender or a single author manuscript. For female-authored manuscripts, two different analyses were performed. One included each journal individually, and the other used journal type (Table 8). The odds ratio (OR) of a female first author was highest for CTI (7.9 [5.6, 11.2]) and lowest for Arthroscopy (1.0), the present decade compared to prior decades (OR 2.9 [2.4, 3.5]), and Australia/New Zealand (OR 2.7 [2.0, 3.6]). The OR of a female corresponding author was highest for JBMR (OR 6.6 [4.6, 9.5]), present decade (OR 2.5 [2.1, 3.1]), and Australia/New Zealand (OR 2.4 [1.7, 3.2]). When analyzing by journal group, the findings for decade and region were exactly the same but with slightly different ORs. By journal type, the OR of a female first author was higher in the basic science group compared to the clinical group (OR 3.5 [3.2, 3.9]) and was the same for a female corresponding author (OR 3.0 [1.6, 2.3]).
Table 8.
Predictors of a female author from multivariate logistic regression analysis.
| By individual journal | |||||||
|---|---|---|---|---|---|---|---|
| Female first author | Female corresponding author | ||||||
| Journal | OR | 95% CI | p value | OR | 95% CI | p value | |
| CTI | 7.9 | 5.6, 11.2 | <10−15 | JBMR | 6.6 | 4.6, 9.5 | <10−15 |
| JBMR | 7.4 | 5.3, 10.3 | <10−15 | CTI | 6.3 | 4.3, 9.2 | <10−15 |
| BONE | 6.6 | 4.8, 9.2 | <10−15 | BONE | 5.7 | 4.0, 8.1 | <10−15 |
| JOR | 3.3 | 2.4, 4.8 | 1.1 × 10⁻¹¹ | JOR | 3.2 | 2.2, 4.6 | 4.1 × 10⁻⁹ |
| ABME | 3.2 | 2.2, 4.7 | 1.3 × 10⁻⁹ | ABME | 3.0 | 2.9, 4.6 | 1.7 × 10⁻⁷ |
| JPO | 2.4 | 1.7, 3.5 | 0.000002 | FAI | 2.2 | 1.4, 3.3 | 0.0003 |
| Spine | 2.1 | 1.5, 2.9 | 0.00001 | JPO | 2.1 | 1.4, 3.2 | 0.0004 |
| JHSA | 2.0 | 1.4, 2.9 | 0.0001 | Spine | 2.0 | 1.4, 2.9 | 0.0001 |
| JHSE | 1.8 | 1.2, 2.7 | 0.004 | Injury | 1.8 | 1.2, 2.6 | 0.002 |
| FAI | 1.8 | 1.2, 2.7 | 0.005 | AJSM | 1.8 | 1.2, 2.7 | 0.002 |
| Injury | 1.6 | 1.1, 2.3 | 0.008 | JBJS | 1.8 | 1.2, 2.6 | 0.004 |
| AJSM | 1.6 | 1.1, 2.2 | 0.014 | JHSA | 1.7 | 1.1, 2.5 | 0.01 |
| JBJS | 1.5 | 1.1, 2.1 | 0.024 | JAR | 1.4 | 0.9, 2.1 | 0.09 |
| JOT | 1.2 | 0.8, 1.9 | 0.40 | JHSE | 1.4 | 0.9, 2.3 | 0.12 |
| BJJ | 1.2 | 0.9, 1.8 | 0.27 | BJJ | 1.3 | 0.9, 2.0 | 0.17 |
| JAR | 1.1 | 0.7, 1.5 | 0.76 | JOT | 1.1 | 0.7, 1.8 | 0.68 |
| Arthroscopy | R | — | — | Arthroscopy | R | — | — |
| Decade | Decade | ||||||
| 2015–2016 | 2.9 | 2.4, 3.5 | <10−15 | 2015–2016 | 2.5 | 2.1, 3.1 | <10−15 |
| 2005–2006 | 1.7 | 1.4, 2.1 | <10−15 | 2005–2006 | 1.6 | 1.3, 2.0 | 0.000005 |
| 1995–1996 | 1.2 | 1.0, 1.5 | 5.7 × 10⁻⁸ | 1995–1996 | 1.2 | 1.0, 1.5 | 0.13 |
| 1985–1987 | R | — | — | 1985–1987 | R | — | — |
| Region | Region | ||||||
| Australia/New Zealand | 2.7 | 2.0, 3.6 | 3.1 × 10⁻¹² | Australia/New Zealand | 2.4 | 1.7, 3.2 | 1.9 × 10⁻⁸ |
| Europe | 1.9 | 1.6, 2.3 | 5.5 × 10⁻¹³ | Europe | 1.9 | 1.6, 2.3 | 1.3 × 10⁻¹¹ |
| North America | 1.6 | 1.3, 1.9 | 5.6 × 10⁻⁸ | North America | 1.5 | 1.2, 1.8 | 0.000027 |
| Asia | R | — | — | Asia | R | — | — |
| By journal type | |||||||
| Journal type | Journal type | ||||||
| Basic Science | 3.5 | 3.2, 3.9 | <10−15 | Basic Science | 3.0 | 1.6, 2.3 | <10−15 |
| Clinical | R | — | — | Clinical | R | — | — |
| Decade | Decade | ||||||
| 2015–2016 | 2.6 | 2.2, 3.1 | <10−15 | 2015–2016 | 2.4 | 2.0, 3.0 | <10−15 |
| 2005–2006 | 1.6 | 1.3, 1.9 | 0.000002 | 2005–2006 | 1.6 | 1.3, 2.0 | 0.00001 |
| 1995–1996 | 1.2 | 1.0, 1.5 | 0.05 | 1995–1996 | 1.2 | 1.0, 1.5 | 0.067 |
| 1985–1987 | R | — | — | 1985–1987 | R | — | — |
| Region | Region | ||||||
| Australia/New Zealand | 2.7 | 2.1, 3.6 | 8.7 × 10⁻¹³ | Australia/New Zealand | 2.4 | 1.8, 3.3 | 3.6 × 10⁻⁹ |
| Europe | 1.9 | 1.6, 1.2 | 4.9 × 10⁻¹³ | Europe | 1.9 | 1.6, 2.3 | 4.6 × 10⁻¹² |
| North America | 1.5 | 1.3, 1.8 | 0.000001 | North America | 1.4 | 1.2, 1.7 | 0.00006 |
| Asia | R | — | — | Asia | R | — | — |
OR = odds ratio, 95% CI = 95% confidence interval, R = reference value. ABME = Annals of Biomedical Engineering, CTI = Calcified Tissue International, JBMR = Journal of Bone and Mineral Research, JOR = Journal of Orthopaedic Research, AJSM = American Journal of Sports Medicine, BJJ = Bone and Joint Journal, FAI = Foot and Ankle International, JAR = Journal of Arthroplasty, JBJS = Journal of Bone and Joint Surgery, JHSA = Journal of Hand Surgery American, JHSE = Journal of Hand Surgery European, JOT = Journal of Orthopaedic Trauma, and JPO = Journal of Pediatric Orthopaedics.
For single-authored manuscripts, two different analyses were performed. The first excluded author gender and the second included author gender (Table 9). In general, the results were very similar for both analyses. Single-authored manuscripts were most common in Injury and Arthroscopy and least common in JBMR, had a male author, were from the 1985–1987 decade, and were from a clinical journal.
Table 9.
Predictors of a single author from multivariate logistic regression analysis.
| Without author gender | With author gender | ||||||
|---|---|---|---|---|---|---|---|
| By individual journal | |||||||
| Journal | OR | 95% CI | p value | Journal | OR | 95% CI | p value |
| Arthroscopy | 12.2 | 5.2, 28.8 | 1.2 × 10⁻⁸ | Injury | 12.8 | 5.1, 32.2 | 7.0 × 10⁻⁸ |
| Injury | 11.7 | 5.0, 27.4 | 1.4 × 10⁻⁸ | Arthroscopy | 12.6 | 5.0, 32.0 | 1.2 × 10⁻⁷ |
| JHSE | 10.6 | 4.4, 25.3 | 1.3 × 10⁻⁷ | JHSE | 11.7 | 4.5, 30.1 | 3.8 × 10⁻⁷ |
| JAR | 9.6 | 4.0, 22.8 | 2.9 × 10⁻⁷ | JAR | 10.1 | 4.9, 25.9 | 0.000001 |
| BJJ | 7.4 | 3.1, 17.6 | 0.000005 | BJJ | 8.0 | 3.1, 20.6 | 0.00001 |
| AJSM | 7.0 | 2.9, 22.8 | 0.00001 | JHSA | 7.3 | 2.9, 18.6 | 0.00003 |
| JHSA | 6.8 | 2.9, 16.1 | 0.00001 | AJSM | 7.2 | 2.8, 18.6 | 0.00004 |
| ABME | 6.0 | 2.3, 15.5 | 0.0002 | ABME | 6.7 | 2.4, 18.5 | 0.0003 |
| JBJS | 6.0 | 2.5, 14.1 | 0.00005 | BONE | 6.6 | 2.6, 17.2 | 0.0009 |
| BONE | 5.5 | 2.3, 13.4 | 0.0001 | JBJS | 6.2 | 2.4, 15.8 | 0.0001 |
| FAI | 5.3 | 2.1, 13.4 | 0.0005 | FAI | 5.7 | 2.1, 15.5 | 0.0007 |
| CTI | 4.7 | 1.9, 11.7 | 0.0008 | CTI | 5.3 | 2.9, 14.0 | 0.0009 |
| JOT | 4.6 | 1.8, 12.0 | 0.002 | Spine | 5.1 | 2.9, 12.8 | 0.0006 |
| Spine | 4.6 | 1.8, 12.0 | 0.004 | JOT | 4.9 | 1.8, 13.7 | 0.002 |
| JPO | 4.4 | 1.8, 10.8 | 0.0001 | JPO | 4.7 | 1.2, 12.4 | 0.002 |
| JOR | 1.5 | 0.5, 4.6 | 0.45 | JOR | 1.7 | 0.5, 5.4 | 0.37 |
| JBMR | R | — | — | JBMR | R | — | — |
| Decade | Decade | ||||||
| 1985–1987 | 11.0 | 8.2, 14.6 | <10−15 | 1985–1987 | 10.2 | 7.6, 13.7 | <10−15 |
| 1995–1996 | 5.0 | 3.8, 6.7 | <10−15 | 1995–1996 | 4.8 | 3.6, 6.5 | <10−15 |
| 2005–2006 | 2.6 | 1.9, 3.5 | 5.8 × 10⁻¹⁰ | 2005–2006 | 2.5 | 1.9, 3.4 | 1.9 × 10⁻⁹ |
| 2015–2016 | R | — | — | 2015–2016 | R | — | — |
| Region | Region | ||||||
| North America | 1.3 | 1.0, 1.8 | 0.066 | North America | 1.5 | 1.0, 2.0 | 0.025 |
| Europe | 1.2 | 0.9, 1.7 | 0.18 | Europe | 1.4 | 0.9, 1.9 | 0.08 |
| Australia/New Zealand | 1.4 | 0.8, 2.5 | 0.22 | Australia/New Zealand | 1.5 | 0.8, 2.8 | 0.17 |
| Asia | R | — | — | Asia | R | — | — |
| Author Gender | |||||||
| Male | 1.6 | 1.2, 2.14 | 0.003 | ||||
| Female | R | — | — | ||||
| By journal type | |||||||
| Journal type | Journal type | ||||||
| Clinical | 2.0 | 1.6, 2.5 | 4.2 × 10⁻⁹ | Clinical | 1.9 | 1.5, 2.4 | 2.5 × 10⁻⁷ |
| Basic science | R | — | — | Basic Science | R | — | — |
| Decade | Decade | ||||||
| 1985–1987 | 10.2 | 7.7, 13.5 | <10−15 | 1985–1987 | 9.4 | 7.1, 12.6 | <10−15 |
| 1995–1996 | 4.7 | 3.5, 6.2 | <10−15 | 1995–1996 | 4.5 | 3.3, 6.0 | <10−15 |
| 2005–2006 | 2.4 | 1.8, 3.2 | 1.2 × 10⁻⁸ | 2005–2006 | 2.3 | 1.7, 3.1 | 4.3 × 10⁻⁸ |
| 2015–2016 | R | — | — | 2015–2016 | R | — | — |
| Region | Region | ||||||
| Europe | 1.4 | 1.0, 1.9 | 0.05 | North America | 1.3 | 0.9, 1.7 | 0.14 |
| Australia/New Zealand | 1.4 | 0.8, 2.4 | 0.27 | Europe | 1.5 | 1.1, 2.1 | 0.016 |
| North America | 1.2 | 0.9, 1.6 | 0.28 | Australia/New Zealand | 1.5 | 0.8, 2.6 | 0.21 |
| Asia | R | — | — | Asia | R | — | — |
| Author gender | |||||||
| Male | 1.7 | 1.2, 2.2 | 0.00087 | ||||
| Female | R | — | — | ||||
OR = odds ratio, 95% CI = 95% confidence interval, R = reference value. ABME = Annals of Biomedical Engineering, CTI = Calcified Tissue International, JBMR = Journal of Bone and Mineral Research, JOR = Journal of Orthopaedic Research, AJSM = American Journal of Sports Medicine, BJJ = Bone and Joint Journal, FAI = Foot and Ankle International, JAR = Journal of Arthroplasty, JBJS = Journal of Bone and Joint Surgery, JHSA = Journal of Hand Surgery American, JHSE = Journal of Hand Surgery European, JOT = Journal of Orthopaedic Trauma, and JPO = Journal of Pediatric Orthopaedics.
3.8. Editorial Board Changes by Gender
While analyzing changes in author gender, we also wished to determine if such changes reflected the editorial board composition and compare that to the first and corresponding authors (Table 10). The author gender paralleled that of the editorial board composition. That is, as the number of female first authors increased, so did the number of female corresponding authors, editorial board members, and editors in chief. Over time, the greatest number of women was in the first author position, followed by the corresponding author, editorial board, and editor in chief position (Figure 4(a)). The clinical group of journals consistently lagged behind the basic science group (Figure 4(b)).
Table 10.
Comparison between author gender and editorial board composition.
| Decade | |||||||||
|---|---|---|---|---|---|---|---|---|---|
| 1985–86 | 1995–96 | 2005–06 | 2015–16 | % 1985–86 | % 1995–96 | % 2005–06 | % 2015–16 | p value^ | |
| Entire study | |||||||||
| First author | |||||||||
| Female | 164 | 403 | 619 | 1,024 | 10.8 | 14.5 | 16.3 | 23.7 | <1015 |
| Male | 1,353 | 2,377 | 3,171 | 3,290 | 89.2 | 85.5 | 83.7 | 76.3 | |
| Corresponding author | |||||||||
| Female | 128 | 329 | 513 | 812 | 8.9 | 11.8 | 13.5 | 18.9 | <1015 |
| Male | 1,312 | 2,459 | 3,291 | 3,493 | 91.1 | 88.2 | 86.5 | 81.1 | |
| Editorial board | |||||||||
| Female | 26 | 78 | 100 | 144 | 4.4 | 7.8 | 8.6 | 11.2 | 0.000001 |
| Male | 567 | 925 | 1,068 | 1,144 | 95.6 | 92.2 | 91.4 | 88.8 | |
| By Journal Type | |||||||||
| Clinical | |||||||||
| First author | |||||||||
| Female | 95 | 177 | 331 | 577 | 7.9 | 9.1 | 11.4 | 17.8 | <1015 |
| Male | 1,107 | 1,759 | 2,584 | 2,673 | 92.1 | 90.9 | 88.6 | 82.2 | |
| Corresponding author | |||||||||
| Female | 78 | 145 | 279 | 476 | 7.0 | 7.5 | 9.6 | 14.7 | <1015 |
| Male | 1,041 | 1,795 | 2,641 | 2,769 | 93.0 | 92.5 | 90.4 | 85.3 | |
| Editorial board | |||||||||
| Female | 11 | 33 | 48 | 39 | 2.9 | 4.7 | 5.8 | 4.5 | 0.27 |
| Male | 374 | 675 | 778 | 826 | 97.1 | 95.3 | 94.2 | 95.5 | |
| Basic science | |||||||||
| First Author | |||||||||
| Female | 69 | 226 | 288 | 447 | 21.9 | 26.8 | 32.9 | 42.2 | <1015 |
| Male | 246 | 618 | 587 | 612 | 78.1 | 73.2 | 67.1 | 57.8 | |
| Corresponding author | |||||||||
| Female | 50 | 184 | 234 | 336 | 15.6 | 21.7 | 26.5 | 31.7 | 2.8 × 10⁻¹¹ |
| Male | 271 | 664 | 650 | 724 | 84.4 | 78.3 | 73.5 | 68.3 | |
| Editorial board | |||||||||
| Female | 15 | 45 | 52 | 105 | 7.2 | 15.3 | 15.2 | 24.8 | 4.7 × 10⁻⁸ |
| Male | 193 | 250 | 290 | 318 | 92.8 | 84.7 | 84.8 | 75.2 | |
| By geographic region | |||||||||
| North America | |||||||||
| Corresponding author | |||||||||
| Female | 66 | 175 | 261 | 368 | 7.4 | 11.3 | 13.8 | 16.9 | 5.3 × 10⁻¹⁴ |
| Male | 827 | 1,374 | 1,626 | 1,810 | 92.6 | 88.7 | 86.2 | 83.1 | |
| Editorial board | |||||||||
| Female | 16 | 50 | 60 | 97 | 4.0 | 8.3 | 8.5 | 11.0 | 0.00008 |
| Male | 387 | 554 | 648 | 785 | 96.0 | 91.7 | 91.5 | 89.0 | |
| Europe | |||||||||
| Corresponding author | |||||||||
| Female | 53 | 121 | 187 | 273 | 12.9 | 13.7 | 15.1 | 22.8 | 4.9 × 10⁻⁹ |
| Male | 359 | 761 | 1,055 | 922 | 87.1 | 86.3 | 84.9 | 77.2 | |
| Editorial board | |||||||||
| Female | 9 | 15 | 19 | 36 | 6.7 | 7.2 | 8.7 | 14.1 | 0.0046 |
| Male | 126 | 192 | 200 | 219 | 93.3 | 92.8 | 91.3 | 85.9 | |
| Asia | |||||||||
| Corresponding author | |||||||||
| Female | 6 | 18 | 44 | 101 | 6.4 | 7.0 | 8.8 | 14.2 | 0.00015 |
| Male | 88 | 240 | 458 | 610 | 93.6 | 93.0 | 91.2 | 85.8 | |
| Editorial board | |||||||||
| Female | 0 | 1 | 2 | 5 | 0.0 | 1.7 | 3.4 | 5.1 | 0.16 |
| Male | 18 | 59 | 56 | 93 | 100.0 | 98.3 | 96.6 | 94.9 | |
| Australia/New Zealand | |||||||||
| Corresponding author | |||||||||
| Female | 3 | 10 | 16 | 60 | 10.3 | 14.3 | 13.1 | 37.3 | 0.000004 |
| Male | 26 | 60 | 106 | 101 | 89.7 | 85.7 | 86.9 | 62.7 | |
| Editorial board | |||||||||
| Female | 0 | 0 | 1 | 3 | 0.0 | 0.0 | 8.3 | 11.1 | 0.096 |
| Male | 8 | 19 | 11 | 24 | 100.0 | 100.0 | 91.7 | 88.9 | |
| Latin America | |||||||||
| Corresponding author | |||||||||
| Female | 0 | 3 | 3 | 7 | 0.0 | 15.0 | 8.6 | 20.6 | 0.27 |
| Male | 4 | 17 | 32 | 27 | 100.0 | 85.0 | 91.4 | 79.4 | |
| Editorial board | |||||||||
| Female | 0 | 0 | 0 | 0 | 0.0 | 0.0 | 0.0 | 0.0 | — |
| Male | 4 | 7 | 5 | 9 | 100.0 | 100.0 | 100.0 | 100.0 | |
| Africa | |||||||||
| Corresponding author | |||||||||
| Female | 0 | 2 | 2 | 3 | 0.0 | 22.2 | 12.5 | 11.5 | 0.74 |
| Male | 8 | 7 | 14 | 23 | 100.0 | 77.8 | 87.5 | 88.5 | |
| Editorial board | |||||||||
| Female | 1 | 0 | 0 | 1 | 20.0 | 0.0 | 0.0 | 11.1 | 0.81 |
| Male | 4 | 5 | 1 | 8 | 80.0 | 100.0 | 100.0 | 88.9 | |
| By location of journal editorial office | |||||||||
| North America | |||||||||
| First author | |||||||||
| Female | 107 | 302 | 498 | 821 | 9.7 | 14.5 | 16.4 | 24.4 | <1015 |
| Male | 997 | 1,784 | 2,545 | 2,543 | 90.3 | 85.5 | 83.6 | 75.6 | |
| Corresponding author | |||||||||
| Female | 74 | 252 | 423 | 638 | 7.2 | 12.1 | 13.9 | 19.0 | <1015 |
| Male | 947 | 1,833 | 2,614 | 2,716 | 92.8 | 87.9 | 86.1 | 81.0 | |
| Editorial board | |||||||||
| Female | 22 | 64 | 86 | 118 | 4.7 | 7.8 | 8.6 | 11.2 | 0.000023 |
| Male | 448 | 757 | 919 | 933 | 95.3 | 92.2 | 91.4 | 88.8 | |
| Europe | |||||||||
| First author | |||||||||
| Female | 57 | 101 | 121 | 203 | 13.8 | 14.6 | 16.2 | 21.4 | 0.000053 |
| Male | 356 | 593 | 626 | 747 | 86.2 | 85.4 | 83.8 | 78.6 | |
| Corresponding author | |||||||||
| Female | 54 | 77 | 90 | 174 | 12.9 | 11.0 | 11.7 | 18.3 | |
| Male | 365 | 626 | 677 | 777 | 87.1 | 89.0 | 88.3 | 81.7 | 0.00029 |
| Editorial board | |||||||||
| Female | 4 | 14 | 14 | 26 | 3.3 | 7.7 | 8.6 | 11.0 | |
| Male | 119 | 168 | 149 | 211 | 96.7 | 92.3 | 91.4 | 89.0 | 0.014 |
^ = Cochran linear trend test.
Figure 4.
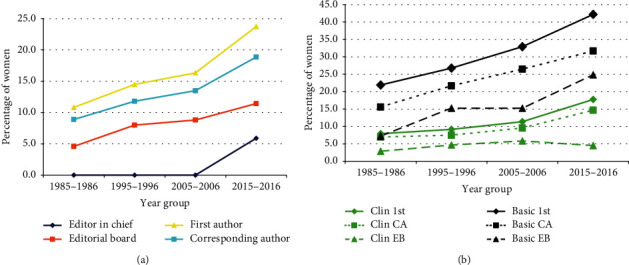
Changes over time in the percentage of women in the musculoskeletal literature by role. (a) The percentage of women being a first author, corresponding author, journal editorial board member, or editor in chief. (b) Changes by the type of musculoskeletal journal (Clin = clinical, Basic = basic science, 1st = first author, CA = corresponding author, EB = editorial board).
4. Discussion
As with any study, there are limitations. First, the accuracy of our gender-based analysis depends on the accuracy of the website for gender ratio scores ≥3.0. However, this website/technique has been previously validated [68]. We also analyzed one year per decade. While we recognize this is not an analysis of all data for every year, the decade method was compared to a 10% random sampling of all manuscripts from each year in JBMR [75], and there were no significant differences based on the method used. As a result, we are confident that the decade approach is reliable for these types of bibliometric studies. Another limitation is that all of the journal's editorial offices are based either in North America or Europe, which lends our study's bias to those regions. We excluded much from the global south because the lower numbers were not sufficient to make meaningful analyses, and this lack of representation of authors within these journals could mean that there is a gap in worldwide knowledge of musculoskeletal publishing trends from those areas of the world.
This is obviously not a comprehensive study of the entire English musculoskeletal literature. There are many more musculoskeletal journals that could have been studied as well. However, time and human resource constraints limit the number of such journals, as the acquisition of these data are extremely time-consuming and much is manually curated. We apologize if a certain journal was not included in these analyses, as we were trying to study a wide sample of the musculoskeletal literature, both basic science and clinical, from both the North American and European continents, and both general and subspecialty orthopaedic surgery journals. Author ethnicity was not studied, as we could not identify any appropriate, validated means to obtain such data; we acknowledge this would have been an interesting aspect to study.
With these limitations in mind, we noted many interesting findings. First, one-half of the journals had an increase in the number of manuscripts published per year, while in the other one half it dropped. One explanation may be the increasing number of journals in which an author may publish [93, 94], especially subspecialty orthopaedic journals. Some of the journals have recently developed sister journals within their own journal as well (i.e., for JBJS, besides the flagship JBJS, they are also publishing JBJS Essential Surgical Techniques, JBJS Reviews, JBJS Case Connector, and JBJS Open Access). Next is the increasing number of authors per manuscript. This has been noted by others [9, 21–24, 27–29]. It was projected that by 2034 the average paper will list 8 authors [28]. The importance of publications in career advancement in academia likely explains this finding. Some individuals accept unearned authorship [95, 96], and even in the most influential medical journals, prevalence of ghost/honorary authorship is estimated to be 21%. Using 2–3 authors per article as baseline, 4–6 coauthors increase the chance of honorary authors by 3.5; 7–10 by 7.9; and 11 or more by 10.8. Power asymmetry among coauthors leads to this phenomenon, as powerful senior researchers often simply read their junior colleague's manuscript, and by approving it, feel entitled to authorship [97]. Indeed, Kovacs states that, “without ensuring a really democratic framework for authorship decisions, the law of the jungle prevails, as often is the case today in publication science.” Finally, a 2020 study of the surgical literature regarding courtesy authorship and different generations of surgeons [98] noted that both junior and senior faculty publishing in the surgical literature had similar historical rates of adding a courtesy author (58% junior, 51% senior) and that junior faculty more frequently added a courtesy author compared to senior faculty (23% versus 13%). The junior faculty felt more pressure by superiors to add courtesy authors, although interestingly senior faculty stated the reason to add courtesy authors was to avoid conflicts more frequently than junior faculty (33% vs. 17%). As long as such behavior prevails, there will likely continue to be an increasing number of authors per manuscript.
The musculoskeletal literature does not demonstrate the massive numbers of authors that occurs in other areas of science. Mega-authored manuscripts are common in the very complex world of high-energy physics [99]. The most authors in the world on a manuscript, to the best of our knowledge, is 3,173, and involved a study from the Large Hadron Collider project; indeed, most manuscripts with over 1000 authors are from that same project [28]. There are differing opinions regarding author inflation. Some believe that if it is due to increasing study complexity, then nothing is inherently objectionable to increasing authorship [28]. The rising number of authors can also be interpreted as a positive phenomenon, reflecting increasing collaboration [23, 95, 100–105]. However, that view is not held by all orthopaedic surgery journals. Indeed, in the past few years, several orthopaedic journals have limited the number of authors allowed on a manuscript (JBJS, JAR, and JHS no more than 6, Arthroscopy no more than 7, and for AJSM only 12 will be placed on the masthead). The impact of such restrictions will become evident several years from now and will likely decrease the number of authors for those particular journals. However, it may result in an even lower number of submissions and subsequent publications for such a journal as some researchers may submit their study to a different journal having no limitation on the number of authors, believing that with the increasing complexity of research, more participants/authors are needed to perform the research. An author number restriction may not appropriately credit all authors as defined by the International Committee of Medical Journal Editors [106].
The increasing number of authors per manuscript seen in this study likely represents increasing collaboration, supported by the increasing number of institutions and countries over time. Advancements in technology have allowed much easier collaboration between institutions and countries. Researchers can now access manuscripts from other institutions and countries, which was more difficult before the ubiquitous nature of the Internet. The increasing number of references per manuscript is likely attributed to this ease of identifying other relevant publications due to advances in computer search capabilities and access to multiple databases. There are many advantages to collaboration including resource sharing, allowing individuals with different skills to come together to solve a problem, and increasing research productivity [19, 20, 107]. Collaboration has been described as the fourth age of research [13]. There are, however, drawbacks to collaboration from a global perspective, especially when both developing and developed countries are intertwined [19, 108]. These drawbacks are: equal opportunities for all researchers, competence of potential partners, respect between all researchers involved, trust and confidence, and justice and fairness in collaboration. The regional differences seen for author number, number of institutions, countries, and references may reflect different cultural views on collaboration between regions. It would appear that female investigators are more collaborative in the musculoskeletal arena than male investigators, since the number of institutions and countries was greater for female first authors than male first authors.
While the number of authors increased, the number of single-author manuscripts concomitantly decreased from 14.0% in 1985–1987 to 1.6% in 2015–2016. This likely is due to increasing collaboration and complexity of the studies. In the clinical group, the percentage of single-author manuscripts was 5.5% and 2.8% in the basic science group. It is clearly easier for one researcher to perform a clinical case series study compared to a laboratory, basic science study.
We also noted an increase in the number of references per manuscript over time. The explosion of scientific literature [93, 94] as well as the increasing ability to access such literature via the Internet and electronic libraries likely is one factor behind this increase. Recently, some journals have been asking authors to limit the number of references. This is likely due to the need to minimize the number of pages and reduce weight/shipping costs for standard print journals. For journals that are solely digital, such a requirement would not be necessary. The same is true for the number of pages over time, with some journals showing an increase and others a decrease. As of November 2020, there were word limits for many journals (JBJS—3000, BJJ—4000, JPO—2500, Spine—2700, JOT—3000, FAI—4000, JHSA—3000, Arthroscopy—4000, AJSM—6000, JOR—420, CTI—5000), with most excluding references in these limits except for BJJ and AJSM, which included references in the word limit. Reference limits have been placed by AJSM (60), JOR (50), CTI (45), and JHSE (limit to pertinent ones).
Many changes/differences in the corresponding author position/location were noted. The normalized corresponding author position (which accounts for the total number of authors in a manuscript) was higher in the basic compared to the clinical journals (0.58 ± 0.38 vs. 0.48 ± 0.33). It was highest for those from North America (0.55 ± 0.35) and lowest for those from Latin America (0.38 ± 0.28). In some journals, it increased over time, indicating a move toward the end of the author byline, while in other journals it did not change over time (Figure 2(e)). The journal with the greatest move to the end of the author byline was JOR (66%), going from 0.39 to 0.65; the greatest move in the opposite direction was in FAI (−36%), going from 0.75 to 0.48. Overall, eight of the journals moved more to the end of the byline, while nine moved more to the beginning of the byline.
Corresponding author location was last in 26.7% of the clinical journals and 73.3% of the basic science journals. From 1985 to 87 to 2015–16, it moved from 16.9% to 44.1% (p < 10−6, CLT). For the basic science journals, the change was from 22.1% to 58.7% (p < 10−6, CLT) and for the clinical journals from 15.5% to 39.3% (p < 10−6, CLT). First authors traditionally have performed much of the research and manuscript preparation [109–114], while corresponding authors are typically the more senior person who generated the research idea or in whose clinical division/laboratory the research was undertaken. This is especially so for those studies that were more basic science in nature and is confirmed by our results. In clinical journals, even today, the first author is most commonly the corresponding author. It would appear from these analyses that the investigators in the basic science compared to the clinical realms differ in assignment of first and corresponding author locations. It is very possible that in the clinical studies, the first author was the clinician who conceived the study, did most of the surgical procedures, and drafted the manuscript, while the other authors played additional roles, such as reviewing charts/collecting data/analyzing data, and finalizing the manuscript.
There were many changes in the geographic regions of origin. Within Europe, the percentage of contributions decreased from the British Isles and Nordic countries and increased for the remainder of Europe. This is likely due to the rapid increase in publications from former European Eastern Bloc nations (Figure 3). Within Asia, there was a significant change with increases in numbers from South Korea and China (S5 Appendix). China is known to be a rapidly rising research nation [115]. This likely is due to many factors. The advent of the Internet and other easy means of communication allows for increased collaboration. Secondly, many of these countries having an increasing research/publication presence have undergone sociopolitical changes. The Eastern Bloc is now dissolved, and China and South Korea have become more important in the political spheres of the world. Within the United States, there were minimal changes in the proportion of manuscripts from the four major regions (S2 Appendix). However, every decade saw an increase in the number of papers from every region. Within Canada, there were an increasing number from Western Canada (likely British Columbia) (S3 Appendix).
Between the two major journal groups, the North East US produced more of the basic science manuscripts compared to the other three regions (S2 Appendix); this may in part be due to this region having three out of four of the most prolific states in this study. For Canada, the Midwest region (S3 Appendix) produced more of the basic science manuscripts compared to the other two regions. Within Europe, the Nordic countries had proportionally more basic science manuscripts than clinical manuscripts, with the opposite being true for the British Isles (S4 Appendix). Within Asia, Japan had the highest number of both basic and clinical science manuscripts, with South Korea contributing the lowest proportion of basic science manuscripts and Israel the lowest proportion of clinical manuscripts (S5 Appendix).
Many differences were noted for author gender, in both the basic science and clinical groups. First, the basic science journals had a greater proportion of women first and corresponding authors (33.2% vs. 12.7%-first; 25.8% vs. 10.6%-clinical) (Table 3). This is likely due to the fact that the clinical group comprises primarily orthopaedic surgery journals, and it is well-known that orthopaedic surgery is still a male-dominated field [116–124]. Many of the basic science journals involve the study of bone and mineral metabolism and bioengineering, and it is known that these areas have many more women, with primarily PhDs and not MDs. The proportion of women gaining doctorates in science has more than doubled in the United States since 1980 and is now nearing equity [45]. In biomedical engineering, in 2015, women received 40.9% of the B.S. degrees as compared to 13.2% and 12.5% in mechanical and electrical engineering, respectively [125]. Women in biomedical engineering have also received more M.S. and Ph.D. degrees than in traditional engineering areas [125].
Both journal groups demonstrated an increasing number of women authors (Table 3). The percentage of women first authors increased from 10.8% in 1985–1987 to 23.7% in 2015–2016. For the basic science group, it increased from 21.9% to 42.0% (p < 10−6), and for the clinical group from 7.9% to 17.8% (p < 10−6). There were differences by geographic region. The proportion of women first authors was highest for those from Australia/New Zealand (29.9%) and lowest from Asia (13.6%); the same pattern was true for corresponding authors, with Australia/New Zealand the highest (23.3%) and Asia the lowest (10.8%). Within Asia, there were differences, with China contributing the greatest number of women as first and corresponding authors (S5 Appendix). This is encouraging regarding the issue of gender parity in the musculoskeletal literature. The same phenomenon has been noted in the surgical literature [126–128] over the last two decades, as well as in the neurosurgery literature [129] and thoracic surgery literature [130], but not in the oral/maxillofacial [131] or hepatopancreaticobiliary [132] literature. This is different from what has been previously observed in the general medical literature. For example, Filardo et al. [64] found that representation of women among first authors in high-impact medical journals increased significantly over the past 20 years but plateaued and even declined in some journals in recent years.
One metric of studying mentorship for authors is to reflect upon the identity of the first and corresponding author. We assessed changes over time for those manuscripts having more than one author and where the first author was also not the corresponding author. Previous studies have shown that women authors prefer to be mentored by women [133]. In orthopaedic surgery, there are fewer women in the senior academic positions compared to the basic sciences. This likely explains the fact that the FF gender combination is ∼5.5 times less in clinical journals compared to basic science journals (2.1% vs. 11.5%). Only 6.8% of the clinical and 10.5% of the basic science manuscripts had a male first author and female corresponding author, likely indicating that males rarely choose female mentors (understanding that the supply of female mentors is low). Hopefully, such mentoring will continue, especially between genders. However, there is some anxiety among potential male mentors in taking on female mentees in the #MeToo era [134–136]. This has been noted by the American Academy of Orthopaedic Surgeons, resulting in education from male orthopaedic surgery leaders on how to mentor in the #MeToo era [137].
As the number of female orthopaedic surgeons is the lowest of all the surgical specialties in the United States, avenues to increase this number have been proposed. Strong mentorship was the largest modifiable factor in choosing a subspecialty for female orthopaedic surgeons [58]. Mentoring may also further help in diversifying the racial/ethnic mix of the orthopaedic surgeon workforce. The efforts to increase diversity in the orthopaedic workforce should begin early in medical school [138, 139]; an emphasis should be placed on female medical students having a positive experience on orthopaedic surgery rotations [140]. In one study, the few female applicants to orthopaedic surgery residencies strongly considered the presence of other female residents and faculty, program reputation for gender diversity, and their personal interactions with members of the programs as important factors when selecting their final residency program [141]. In another study, increased exposure to orthopaedic content and increased female mentorship might help recruit more females into the orthopaedic surgery workforce [142]. However, there are some data that these efforts have had little effect on increasing the number of female orthopaedic residents [143]. Another study noted that the number of female orthopaedic faculty did not influence the number of female applicants for orthopaedic residency [144]. Finally, such endeavors might need to occur before medical school [145], as 51% of medical students selecting orthopaedics had decided on this before their third-year rotations, with 27% deciding before medical school. However, requiring instruction in musculoskeletal medicine in medical school curriculums results in a 12% higher rate of applications to orthopaedic surgery residency [146], and was even more pronounced among women with an 82% higher rate of application to orthopaedic surgery residency.
Unfortunately, a recent study by Holman et al. [147] noted that the gender gap appears likely to persist for generations, particularly in surgery, computer science, physics, and math, unless efforts are made to effect change. They calculated the time in years to gender parity for all authors in studies for many different disciplines. They noted that gender parity will take over 100 years for physics and astrophysics, 73 years for biomedical engineering, 60 years for mathematics, 42 years for chemistry, 27 years for biochemistry, and 13 years for cell biology. Within the medical disciplines, they noted that pediatrics and obstetrics/gynecology are at gender parity, 98 years for orthopaedics, 86 years for urology, 56 years for emergency medicine, 52 years for general surgery, 42 years for traumatology, 40 years for neurosurgery, 39 years for ophthalmology, 29 years for otoloaryngology, and 8 years for rheumatology. Interestingly, physical medicine and rehabilitation was the only discipline that has a negative parity (more women than men), and they calculated that gender parity will take 34 years.
It has been noted that female scientists have a larger number of collaborators than male scientists [148, 149]. We noted that the number of authors, institutions, and countries was slightly higher for female authors compared to male authors, both first and corresponding (Table 1). This likely supports the study of Bozeman [148]. We also noted that the number of references and pages was higher for female authors (Table 1). While our study does not address the reasons for these differences, it is possible that female authors place an increased number of authors on their manuscripts in an effort to increase collaboration or are more generous in giving credit to those involved in the study. Female authors may also not be as confident that their work will be accepted due to the male predominance in orthopaedic surgery, and therefore may feel the need to place more mentors, contributing authors, and references on their work for corroboration and to support their research.
Author gender changes over time are clearly reflected in the composition of the editorial board makeup. It is standard knowledge in academia that individuals begin their academic career by becoming first authors, and then corresponding authors (as discussed above). Editorial members of a journal, after demonstrating academic productivity, as a first and subsequently corresponding author, may then be appointed to an editorial board on a journal of their discipline. From the editorial board members, the editor-in-chief is often later selected. This study demonstrated a very parallel track for these four different levels in academia. Over time, the greatest number of women was in the first author position, followed by the corresponding author, editorial board, and editor-in-chief position (Figure 4(a)). This is very encouraging and seems to demonstrate that the gender gap is being slowly closed. A recent study [150] noted that women were represented equally or in greater numbers as editors in JBJS, Journal of the American Academy of Orthopaedic Surgeons, and Clinical Orthopaedics and Related Research. They noted the same lag that we did when comparing editors to authors, with the percentage of female editors in 2017 roughly equaling the percentage of female authors in 2007. Regarding professional orthopaedic subspecialty societies, there was a strong correlation between the percentage of women in a society and the percentage of women on the society's board of directors [151].
Author diversity is important in that manuscripts with diverse authorship have increased citations [13]. Women who obtain a patent, especially those in academia, have a higher number of International Patent Classification codes than men. Medical manuscripts having female authors have an increased probability of reporting sex in their results [152], and there has been a recent outcry from the orthopaedic surgery community that research needs to give more gender-specific outcomes [4, 153]. In the general surgical literature, female authors proportionally include more female participants in their studies, and studies addressing sex differences have increased citation rates [154]. Thus, this is another benefit of having more female authors, as it will likely improve the quality of care for female patients.
The regional differences seen in many of the bibliometric variables (author number, number of institutions, countries, references, author gender) likely represent different cultural views between regions. It is well-known that different parts of the world have markedly different percentages of male and female physicians. The percentage of female physicians is the highest in Latvia (74.3%) and the lowest in Japan (20.3%) [155], although the figures were not broken down by medical specialty. Some societies are more patriarchal, while others are more matriarchal [156]. This could possibly influence the differences in author gender noted in this study. While Saudi Arabia has been accused of treating women poorly, according to the Human Rights Watch organization [157], the Journal of Musculoskeletal Surgery and Research (the official journal of the Saudi Orthopaedic Association) was noted to have more female authors compared to the Egyptian Orthopaedic Journal [158]. The prevalence of international contributions was higher in the JMSR compared with the Egyptian Orthopaedic Journal. Thus, it is difficult to state that perceived gender differences/rights/abilities are seen in the musculoskeletal research productivity area.
Regarding future research, one important area is to study changes in the race and ethnicity of authors over time. Such data are difficult to acquire unless each and every author can be contacted and they themselves self-identify their race/ethnicity. Perhaps, this could be done for corresponding authors, as that contact information is given in most manuscripts, but it would be difficult to know the response rate for such questioning. Another area of further research would be to explore changes in journals published in languages other than English, such as Spanish in journals from Mexico, Central and South America; Chinese in journals from China; Japanese in journals from Japan, etc. In addition, since all the journals highlighted in our research have editorial boards in either North America or Europe, expanding to journals with editorial boards in the Global South or Asia may also provide a broader perspective. Such studies might give further insight into some of the differences between geographic regions that we noted in this study.
5. Conclusion
In this detailed bibliometric analysis of select musculoskeletal journals, several key findings were noted. First, there was an increase in the number of authors, institutions, countries, references, pages, citations, and corresponding author position overall over time. There were many differences by the geographic region of origin, likely reflecting different socio/cultural attitudes regarding academia and research, as well as the gender composition of the disciplines by geographic region. The overall mentorship of junior female authors has been improving over time by both male and female mentors. There has been an increase in the number of female 1st and corresponding authors, editorial board members, and chief editors, indicating a slow but progressive narrowing of the gender gap, although parity has clearly not yet been achieved. Based on projections, it may take up to a century to achieve gender parity. Therefore, continued active and intentional programs for improvement are needed including continued mentorship, development of orthopaedic opportunities for women in medical school, program development by musculoskeletal societies, and increased representation of women in leadership roles including editorial board and editor-in-chief position.
Acknowledgments
The authors are thankful for the work of the many individuals that tabulated the data for the various journals. These individuals are Gremah Adam, Micahel B. N. Adjei, Izath Nizeet Aguilar, Mohammed T. Ali, Elliott Beckner, Mashuq Bhuyia, Peter Bolaji, Alexander R. Brinker, Alyssa M. Cooke, Jacob C. Davis, Joseph Dynako, James P. Fischer, Tony Frimpong, Venkateswaran Ganesh, Rolando Gabriel Gerena, Riley Gorden, Kyle Grassel, Michael Groswald, Andrew S. Gudeman, Kyle Hart, Fawaz Hasnain, Jennifer M. Hatch, Ryan Kabir, Ethan J. Kacena-Merrell, Faisal Khan, Kent R. Kraus, Jennifer Lamb, Jane L. Liao, Elive F. Likine, Shatoria Lunsford, Sarina Masso Maldonado, Rachel Mannfeld, Carlos R. Martinez Lica, Kevin A. Maupin, Donnell McDonald, Cory Meixner, Anthony Milto, Carter Miskell, Michelle Nguyen, Blessing Ogbemudia, Garrett W. Owens, Christina Pedro, Alexander W. Peters, Daniel Robinson, Arielle F. Russell, Abhijit Seetharam, Michael Savaglio, Katherine E. Schultz, David C. Scofield, Dayton C. Snyder, Sydney Spagna, Maria E. Squire, Aamir Tucker, Jeffrey D. Rytlewski, Jonathan Ryu, Morgan M. Sandelski, Piimaria Virtanen, Christine Y. Wang, Austin E. Wininger, Serena Wright-Freiman, and Jocelyn Young. Elliott Beckner also contributed to this work. This study was supported in part by the Department of Orthopaedic Surgery, Indiana University School of Medicine (MAK, RTL), the Ralph W. and Grace M. Showalter Research Trust (MAK), the Garceau Professorship Endowment and Rapp Pediatric Orthopaedic Research Fund, Riley Children's Foundation (RTL), and the Ruth Lilly Medical Library (ECW).
Data Availability
The data are available from the corresponding author upon request.
Conflicts of Interest
The authors declare that they have no conflicts of interest.
Authors' Contributions
MAK, ECW, RTL conceived and designed the study; BE, HNN, AA, NN, OM, ZG collected and analyzed the data; RTL performed statistical analyses; ECW, MAK, RTL prepared the original manuscript; all authors participated in manuscript reviews and approved the final manuscript.
Supplementary Materials
S1 Appendix: Continuous bibliometric variables over time for each journal. S2 Appendix: Analyses by US regions. S3 Appendix: Analyses by Canadian regions. S4 Appendix: Analyses by European regions. S5 Appendix: Analyses by the four major Asian countries.
References
- 1.Ovseiko P. V., Edmunds L. D., Pololi L. H., et al. Markers of achievement for assessing and monitoring gender equality in translational research organisations: a rationale and study protocol. BMJ Open. 2016;6 doi: 10.1136/bmjopen-2015-009022.e009022 [DOI] [PMC free article] [PubMed] [Google Scholar]
- 2.Larivière V., Ni C., Gingras Y., Cronin B., Sugimoto C. R. Global gender disparities in science. Nature. 2013;504:211–213. doi: 10.1038/504211a. [DOI] [PubMed] [Google Scholar]
- 3.Piper C. L., Scheel J. R., Lee C. I., Forman H. P. Gender trends in radiology authorship: a 35-year analysis. American Journal of Roentgenology. 2016;206(1):3–7. doi: 10.2214/AJR.15.15116. [DOI] [PubMed] [Google Scholar]
- 4.Hettrich C. M., Hammoud S., LaMont L. E., Arendt E. A., Hannafin J. A. Sex-specific analysis of data in high-impact orthopaedic journals: how are we doing? Clinical Orthopaedics & Related Research. 2015;473(12):3700–3704. doi: 10.1007/s11999-015-4457-9. [DOI] [PMC free article] [PubMed] [Google Scholar]
- 5.King J. T. How many neurosurgeons does it take to write a research article? Authorship proliferation in neurosurgical research. Neurosurgery. 2000;47(2):435–440. doi: 10.1097/00006123-200008000-00032. [DOI] [PubMed] [Google Scholar]
- 6.Modi P., Hassan A., Teng C. J., Chitwood W. R., Jr. “How many cardiac surgeons does it take to write a research article?”: seventy years of authorship proliferation and internationalization in the cardiothoracic surgical literature. The Journal of Thoracic and Cardiovascular Surgery. 2008;136(1):4–6. doi: 10.1016/j.jtcvs.2007.12.057. [DOI] [PubMed] [Google Scholar]
- 7.Schrock J. B., Kraeutler M. J., McCarty E. C. Trends in authorship characteristics in the American journal of sports medicine, 1994 to 2014. American Journal of Sports Medicine. 2016;44(7):1857–1860. doi: 10.1177/0363546516639955. [DOI] [PubMed] [Google Scholar]
- 8.Sugrue C. M., Carroll S. M. Authorship proliferation in hand surgery research: how many hand surgeons does it take to write a research article? Journal of Hand and Microsurgery. 2015;7(1):108–109. doi: 10.1007/s12593-015-0175-5. [DOI] [PMC free article] [PubMed] [Google Scholar]
- 9.Camp M., Escott B. G. Authorship proliferation in the orthopaedic literature. Journal of Bone and Joint Surgery. 2013;95-A(7):p. e44. doi: 10.2106/jbjs.l.00519. [DOI] [PubMed] [Google Scholar]
- 10.Lehman J. D., Schairer W. W., Gu A., Blevins J. L., Sculco P. K. Authorship trends in 30 years of the Journal of arthroplasty. The Journal of Arthroplasty. 2017;32(5):1684–1687. doi: 10.1016/j.arth.2016.11.037. [DOI] [PubMed] [Google Scholar]
- 11.Kim C.-Y., Sivasundaram L., Trivedi N. N., et al. A 46-year analysis of gender trends in academic authorship in orthopaedic sports medicine. Journal of the American Academy of Orthopaedic Surgeons. 2019;27(13):493–501. doi: 10.5435/jaaos-d-18-00669. [DOI] [PubMed] [Google Scholar]
- 12.Ho Y.-S. Bibliometric analysis of the journal of orthopaedic research from 1991 to 2018. Orthopedic Research Online Journal. 2019;6(2):574–584. doi: 10.31031/oproj.2019.06.000632. [DOI] [Google Scholar]
- 13.Adams J. The fourth age of research. Nature. 2013;497(7451):557–560. doi: 10.1038/497557a. [DOI] [PubMed] [Google Scholar]
- 14.Borgman C. L. The conundrum of sharing research data. Journal of the American Society for Information Science and Technology. 2012;63(6):1059–1078. doi: 10.1002/asi.22634. [DOI] [Google Scholar]
- 15.Tenopir C., Allard S., Douglass K., et al. Data sharing by scientists: practices and perceptions. PLoS One. 2011;6(6) doi: 10.1371/journal.pone.0021101.e21101 [DOI] [PMC free article] [PubMed] [Google Scholar]
- 16.D’Amour D., Ferrada-Videla M., San Martin Rodriguez L., Beaulieu M.-D. The conceptual basis for interprofessional collaboration: core concepts and theoretical frameworks. Journal of Interprofessional Care. 2005;19(sup1):116–131. doi: 10.1080/13561820500082529. [DOI] [PubMed] [Google Scholar]
- 17.Warner E. T., Carapinha R., Weber G. M., Hill E. V., Reede J. Y. Faculty promotion and attrition: the importance of coauthor network reach at an academic medical center. Journal of General Internal Medicine. 2015;31(1):60–67. doi: 10.1007/s11606-015-3463-7. [DOI] [PMC free article] [PubMed] [Google Scholar]
- 18.Johnson C. D., Green B. N. Association of chiropractic colleges educational conference and research agenda conference 2015. Journal of Chiropractic Education. 2016;30(1):42–47. doi: 10.7899/jce-15-24. [DOI] [PMC free article] [PubMed] [Google Scholar]
- 19.Parker M., Kingori P. Good and bad research collaborations: researchers’ views on science and ethics in global health research. PLoS One. 2016;11(10) doi: 10.1371/journal.pone.0163579.e1063579 [DOI] [PMC free article] [PubMed] [Google Scholar]
- 20.Zeng X. H. T., Duch J., Sales-Pardo M., et al. Differences in collaboration patterns across discipline, career stage, and gender. PLoS Biology. 2016;14(11) doi: 10.1371/journal.pbio.1002573.e1002573 [DOI] [PMC free article] [PubMed] [Google Scholar]
- 21.Weeks W. B., Wallace A. E., Kimberly B. C. S. Changes in authorship patterns in prestigious US medical journals. Social Science & Medicine. 2004;59(9):1949–1954. doi: 10.1016/j.socscimed.2004.02.029. [DOI] [PubMed] [Google Scholar]
- 22.Baerlocher M. O., Newton M., Gautam T., Tomlinson G., Detsky A. S. The meaning of author order in medical research. Journal of Investigative Medicine. 2007;55(4):174–180. doi: 10.2310/6650.2007.06044. [DOI] [PubMed] [Google Scholar]
- 23.Papatheodorou S. I., Trikalinos T. A., Ioannidis J. P. A. Inflated numbers of authors over time have not been just due to increasing research complexity. Journal of Clinical Epidemiology. 2008;61(6):546–551. doi: 10.1016/j.jclinepi.2007.07.017. [DOI] [PubMed] [Google Scholar]
- 24.Tornetta P., III, Siegel J., McKay P., Bhandari M. Authorship and ethical considerations in the conduct of observational studies. Journal of Bone and Joint Surgery. 2009;91(S3):61–67. doi: 10.2106/jbjs.h.01538. [DOI] [PubMed] [Google Scholar]
- 25.McDonald R. J., Neff K. L., Rethlefsen M. L., Kallmes D. F. Effects of author contribution disclosures and numeric limitations on authorship trends. Mayo Clinic Proceedings. 2010;85(10):920–927. doi: 10.4065/mcp.2010.0291. [DOI] [PMC free article] [PubMed] [Google Scholar]
- 26.Tilak G., Prasad V., Jena A. B. Authorship inflation in medical publications. Inquiry. 2015;52 doi: 10.1177/0046958015598311. [DOI] [PMC free article] [PubMed] [Google Scholar]
- 27.Sahu S. R., Panda K. C. Does the multi-authorship trend influence the quality of an article? Scientometrics. 2014;98(3):2161–2168. doi: 10.1007/s11192-013-1127-0. [DOI] [Google Scholar]
- 28.Aboukhalil R. The rising trend in authorship. The Winnower. 2014;2e141832.26907 [Google Scholar]
- 29.Nabout J. C., Parreira M. R., Teresa F. B., et al. Publish (in a group) or perish (alone): the trend from single- to multi-authorship in biological papers. Scientometrics. 2015;102(1):357–364. doi: 10.1007/s11192-014-1385-5. [DOI] [Google Scholar]
- 30.Baek S., Yoon D. Y., Cho Y. K., et al. Trend toward an increase in authorship for leading radiology journals. American Journal of Roentgenology. 2015;205(5):924–928. doi: 10.2214/ajr.15.14979. [DOI] [PubMed] [Google Scholar]
- 31.Angell M. Publish or perish: a proposal. Annals of Internal Medicine. 1986;104(2):261–262. doi: 10.7326/0003-4819-104-2-261. [DOI] [PubMed] [Google Scholar]
- 32.Halperin E. C. Publish or perish-and bankrupt the medical library while weʼre at it. Academic Medicine. 1999;74(5):470–472. doi: 10.1097/00001888-199905000-00009. [DOI] [PubMed] [Google Scholar]
- 33.Lundberg G. D. Writing is all. The Lancet. 1998;352(9131):p. 898. doi: 10.1016/s0140-6736(05)60037-2. [DOI] [PubMed] [Google Scholar]
- 34.Neill U. S. Publish or perish, but at what cost? Journal of Clinical Investigation. 2008;118(7):p. 2368. doi: 10.1172/jci36371. [DOI] [PMC free article] [PubMed] [Google Scholar]
- 35.Brumback R. A. 3 . . 2 . . 1 . . Impact [factor]: target [academic career] destroyed! Journal of Child Neurology. 2012;27(12):1565–1576. doi: 10.1177/0883073812465014. [DOI] [PubMed] [Google Scholar]
- 36.Conroy M. B., Shaffiey S., Jones S., et al. Scholarly research projects benefit medical students’ research productivity and residency choice. Academic Medicine. 2018;93(11):1727–1731. doi: 10.1097/acm.0000000000002328. [DOI] [PubMed] [Google Scholar]
- 37.Stain S. C., Hiatt J. R., Ata A., et al. Characteristics of highly ranked applicants to general surgery residency programs. JAMA Surgery. 2013;148(5):413–417. doi: 10.1001/jamasurg.2013.180. [DOI] [PubMed] [Google Scholar]
- 38.Chen A. F., Secrist E. S., Scannell B. P., Patt J. C. Matching in orthopaedic surgery. Journal of the American Academy of Orthopaedic Surgeons. 2020;28(4):135–144. doi: 10.5435/jaaos-d-19-00313. [DOI] [PubMed] [Google Scholar]
- 39.National Resident Matching Program. Washington, DC, USA: National Resident Matching Program; November 2018. Charting outcomes in the match: U.S. allopathic seniors. http://www.nrmp.org/wp-content/uploads/2018/06/Charting-Outcomes-in-the-Match-2018-Seniors.pdf. [Google Scholar]
- 40.The World Bank. Washington, DC, USA: The World Bank; January 2016. World development indicators-population, female (% of total) http://data.worldbank.org/indicator/SP.POP.TOTL.FE.ZS. [Google Scholar]
- 41.US Census Bureau. Suitland-Silver Hill, MD, USA: US Census Bureau; June 2017. World midyear population by age and sex for 2017. http://www.census.gov/population/international/data/idb.worldpop.php. [Google Scholar]
- 42.Warner J. Fact Sheet: The Women’s Leadership Gap Women’s Leadership by the Numbers. Washington, DC, USA: Center for American Progress; 2014. [Google Scholar]
- 43.Warner J. What’s True, What’s False, and Why it Matters. Washington, DC, USA: Center for American Progress; March 2014. Women’s leadership. https://cdn.americanprogress.org/wp-content/uploads/2014/03/WomensLeadership-report.pdf. [Google Scholar]
- 44.Organisation for Economic Cooperation and Development. Paris, France: Organisation for Economic Cooperation and Development; July 2012. Education at a glance. [DOI] [Google Scholar]
- 45.Shen H. Inequality quantified: mind the gender gap. Nature. 2013;495(7439):22–24. doi: 10.1038/495022a. [DOI] [PubMed] [Google Scholar]
- 46.Shaw A. K., Stanton D. E. Leaks in the pipeline: separating demographic inertia from ongoing gender differences in academia. Proceedings of the Royal Society B: Biological Sciences. 2012;279(1743):3736–3741. doi: 10.1098/rspb.2012.0822. [DOI] [PMC free article] [PubMed] [Google Scholar]
- 47.Pohlhaus J. R., Jiang H., Wagner R. M., Schaffer W. T., Pinn V. W. Sex differences in application, success, and funding rates for NIH extramural programs. Academic Medicine. 2011;86(6):759–767. doi: 10.1097/acm.0b013e31821836ff. [DOI] [PMC free article] [PubMed] [Google Scholar]
- 48.McMillan G. S. Gender differences in patenting activity: an examination of the US biotechnology industry. Scientometrics. 2009;80(3):683–691. doi: 10.1007/s11192-008-2101-0. [DOI] [Google Scholar]
- 49.Sugimoto C. R., Ni C., West J. D., Larivière V. The academic advantage: gender disparities in patenting. PLoS One. 2015;10(5) doi: 10.1371/journal.pone.0128000.e0128000(1-10) [DOI] [PMC free article] [PubMed] [Google Scholar]
- 50.Williams W. M., Ceci S. J. National hiring experiments reveal 2:1 faculty preference for women on STEM tenure track. Proceedings of the National Academy of Sciences. 2015;112(17):5360–5365. doi: 10.1073/pnas.1418878112. [DOI] [PMC free article] [PubMed] [Google Scholar]
- 51.Yoder B. L. Engineering by the Numbers. Washington, DC, USA: American Society for Engineering Education; February 2019. https://www.asee.org/documents/papers-and-publications/publications/college-profiles/16Profile-Front-Section.pdf. [Google Scholar]
- 52.American Association of Medical Colleges. Table 1.3 Number and Percentage of Active Physicians by Sex and Specialty, 2015. Washington, DC, USA: American Association of Medical Colleges; November 2018. 2016 physician specialty data report. https://www.aamc.org/data/workforce/reports/458712/1-3-chart.html. [Google Scholar]
- 53.American Association of Medical Colleges. Washington, DC, USA: American Association of Medical Colleges; December 2018. Table B-1.2: total enrollment by U.S. Medical School and Sex, 2014-2015 through 2018-2019. https://www.aamc.org/download/321526/data/factstableb1-2.pdf. [Google Scholar]
- 54.Klifto K. M., Payne R. M., Siotos C., et al. Women continue to be underrepresented in surgery: a study of AMA and AGME data from 2000 to 2016. Journal of Surgical Education. 2020;77(2):362–368. doi: 10.1016/j.jsurg.2019.10.001. [DOI] [PubMed] [Google Scholar]
- 55.American Association of Medical Colleges. Washington, DC, USA: American Association of Medical Colleges; June 2017. 2016 physician specialty data report. https://www.aamc.org/data/workforce/reports/457712/1-3-chart.html. [Google Scholar]
- 56.American Association of Medical Colleges. 2016-2017 Active Residents. Washington, DC, USA: American Association of Medical Colleges; December 2017. Table B3. number of active residents, by type of medical school, GME specialty, and sex. https://www.aamc.org/data/484718/report-on-residents-2017-b3table.html. [Google Scholar]
- 57.Cannada L. K. Women in orthopaedic fellowships: what is their match rate, and what specialties do they choose? Clinical Orthopaedics & Related Research. 2016;474(9):1957–1961. doi: 10.1007/s11999-016-4829-9. [DOI] [PMC free article] [PubMed] [Google Scholar]
- 58.Bratescu R. A., Gardner S. S., Jones J. M., et al. Which supspecialties do female orthopaedic surgeons choose and why? Identifying the role of mentorship and additional factors in subspecialty choice. Journal of the American Academy of Orthopaedic Surgeons Global Research and Review. 2020;4(1) doi: 10.5435/JAAOSGlobal-D-19-00140.e19.00140 [DOI] [PMC free article] [PubMed] [Google Scholar]
- 59.Cochran A., Hauschild T., Elder W. B., Neumayer L. A., Brasel K. J., Crandall M. L. Perceived gender-based barriers to careers in academic surgery. The American Journal of Surgery. 2013;206(2):263–268. doi: 10.1016/j.amjsurg.2012.07.044. [DOI] [PubMed] [Google Scholar]
- 60.Cydulka R. K., D’Onofrio G., Schneider S., Emerman C. L., Sullivan L. M., Force S. W. a. M. T. Women in academic emergency medicine. Academic Emergency Medicine: Official Journal of the Society for Academic Emergency Medicine. 2000;7(9):999–1007. doi: 10.1111/j.1553-2712.2000.tb02091.x. [DOI] [PubMed] [Google Scholar]
- 61.Puljak L., Kojundzic S. L., Sapunar D. Gender and academic medicine: a good pipeline of women graduates is not advancing. Teaching and Learning in Medicine. 2008;20(3):273–278. doi: 10.1080/10401330802199617. [DOI] [PubMed] [Google Scholar]
- 62.Sidhu R., Rajashekhar P., Lavin V. L., et al. The gender imbalance in academic medicine: a study of female authorship in the United Kingdom. Journal of the Royal Society of Medicine. 2009;102(8):337–342. doi: 10.1258/jrsm.2009.080378. [DOI] [PMC free article] [PubMed] [Google Scholar]
- 63.Hoof M. A., Sommi C., Meyer L. E., Bird M. L., Brown S. M., Mulcahey M. K. Gender-related differences in research productivity, position, and advancement among academic orthopaedic faculty within the United States. Journal of the American Academy of Orthopaedic Surgeons. 2020;28(21):893–899. doi: 10.5435/jaaos-d-19-00408. [DOI] [PubMed] [Google Scholar]
- 64.Filardo G., da Graca B., Sass D. M., Pollock B. D., Smith E. B., Martinez M. A.-M. Trends and comparison of female first authorship in high impact medical journals: observational study (1994-2014) Bmj. 2016;352:p. i847. doi: 10.1136/bmj.i847. [DOI] [PMC free article] [PubMed] [Google Scholar]
- 65.Lautenberger D. M., Dandar V. M., Raezer C. L., Sloane R. A. The Pipeline and Pathways to Leadership. Washington, DC, USA: American Association of Medical Colleges; December 2016. The state of women in academic medicine. https://members.aamc.org/eweb/upload/The%20State%20of%20Women%20in%20Academic%20Medicine%202013-2014%20FINAL.pdf. [Google Scholar]
- 66.Davis E. C., Risucci D. A., Blair P. G., Sachdeva A. K. Women in surgery residency programs: evolving trends from a national perspective. Journal of the American College of Surgeons. 2011;212(3):320–326. doi: 10.1016/j.jamcollsurg.2010.11.008. [DOI] [PubMed] [Google Scholar]
- 67.Jagsi R., Guancial E. A., Worobey C. C., et al. The “gender gap” in authorship of academic medical literature - a 35-year perspective. New England Journal of Medicine. 2006;355(3):281–287. doi: 10.1056/nejmsa053910. [DOI] [PubMed] [Google Scholar]
- 68.Mimouni M., Zayit-Soudry S., Segal O., et al. Trends in authorship of articles in major ophthalmology journals by gender, 2002–2014. Ophthalmology. 2016;123(8):1824–1828. doi: 10.1016/j.ophtha.2016.04.034. [DOI] [PubMed] [Google Scholar]
- 69.Brown M. A., Erdman M. K., Munger A. M., Miller A. N. Despite growing number of women surgeons, authorship gender disparity in orthopaedic literature persists over 30 years. Clinical Orthopaedics & Related Research. 2020;478(7):1542–1552. doi: 10.1097/corr.0000000000000849. [DOI] [PMC free article] [PubMed] [Google Scholar]
- 70.Haws B. E., Khechen B., Movassaghi K., et al. Authorship trends in spine publications from 2000 to 2015. Spine. 2018;43(17):1225–1230. doi: 10.1097/brs.0000000000002585. [DOI] [PubMed] [Google Scholar]
- 71.Judy R. P., Talentino S., Bedi A., Lesniak B. P. Ten years of sports health: authorship characteristics and levels of evidence. Sports Health: A Multidisciplinary Approach. 2020;12(6):573–578. doi: 10.1177/1941738120922163. [DOI] [PMC free article] [PubMed] [Google Scholar]
- 72.Alexander B. K., Hicks J. W., Agarwal A., et al. Publishing characteristics of foot and ankle research over a 15-year time interval. Journal of Bone and Joint Surgery. 2020;102(20):p. e117. doi: 10.2106/jbjs.20.00367. [DOI] [PubMed] [Google Scholar]
- 73.Vora M., Kuripla C., Ouyang D., Sing D. C. Gender trends in authorship of foot and ankle academic literature over 24 years. The Journal of Foot and Ankle Surgery. 2019;58(5):898–903. doi: 10.1053/j.jfas.2019.01.002. [DOI] [PubMed] [Google Scholar]
- 74.Ovseiko P. V., Greenhalgh T., Adam P., et al. A global call for action to include gender in research impact assessment. Health Research Policy and Systems. 2016;14(14):p. 50. doi: 10.1186/s12961-016-0126-z. [DOI] [PMC free article] [PubMed] [Google Scholar]
- 75.Wininger A. E., Fischer J. P., Likine E. F., et al. Bibliometric analysis of female authorship trends and collaboration dynamics OverJBMR’s 30-year history. Journal of Bone and Mineral Research. 2017;32(12):2405–2414. doi: 10.1002/jbmr.3232. [DOI] [PMC free article] [PubMed] [Google Scholar]
- 76.Khan F., Sandelski M. M., Rytlewski J. D., et al. Bibliometric analysis of authorship trends and collaboration dynamics over the past three decades of BONE’s publication history. Bone. 2018;107(1):27–35. doi: 10.1016/j.bone.2017.10.026. [DOI] [PMC free article] [PubMed] [Google Scholar]
- 77.Seetharam A., Ali M. T., Wang C. Y., et al. Authorship trends in the journal of orthopaedic research: a bibliometric analysis. Journal of Orthopaedic Research. 2018;36(11):3071–3080. doi: 10.1002/jor.24054. [DOI] [PubMed] [Google Scholar]
- 78.Fischer J. P., Wininger A. E., Scofield D. C., et al. Historical analysis of bibliometric trends in the Journal of Pediatric Orthopaedics with a particular focus on sex. Journal of Pediatric Orthopaedics. 2018;38(3):e168–e171. doi: 10.1097/bpo.0000000000001124. [DOI] [PubMed] [Google Scholar]
- 79.Brinker A. R., Liao J. L., Kraus K. R., et al. Bibliometric analysis of gender authorship trends and collaboration dynamics over 30 Years of spine 1985 to 2015. Spine. 2018;43(14):E849–E854. doi: 10.1097/brs.0000000000002562. [DOI] [PubMed] [Google Scholar]
- 80.Russell A. F., Nguyen M., Bhuiya M., et al. Comparative analysis of bibliometric, authorship, and collaboration trends over the past 30-year publication history of the journal of orthopaedic Trauma and Injury. Journal of Orthopaedic Trauma. 2018;32(8):e327–e333. doi: 10.1097/bot.0000000000001200. [DOI] [PubMed] [Google Scholar]
- 81.Aguilar I. N., Ganesh V., Mannfeld R., et al. Authorship trends over the past 30-years in the Annals of biomedical engineering. Annals of Biomedical Engineering. 2019;47(5):1171–1180. doi: 10.1007/s10439-019-02222-3. [DOI] [PMC free article] [PubMed] [Google Scholar]
- 82.Dynako J., Owens G. W., Loder R. T., et al. Bibliometric and authorship trends over a 30 year publication history in two representative US sports medicine journals. Heliyon. 2020;6(3) doi: 10.1016/j.heliyon.2020.e03698.e03698 [DOI] [PMC free article] [PubMed] [Google Scholar]
- 83.Peters A. W., Savaglio M. K., Gunderson Z. J., et al. Comparative analysis of authorship trends in the journal of hand surgery European and American volumes: a bibliometric analysis. Annals of Medicine and Surgery. 2020;55:200–206. doi: 10.1016/j.amsu.2020.05.015. [DOI] [PMC free article] [PubMed] [Google Scholar]
- 84.Squire M. E., Schultz K., McDonald D., et al. Trends in gender authorship and collaborations: a 30 year comparative bibliometirc analysis of manuscripts from the journal of bone and joint surgery and bone and joint journal. Scientifica. 2020;2020:11. doi: 10.1155/2020/5019607.5019607 [DOI] [PMC free article] [PubMed] [Google Scholar]
- 85.Zar J. H. Biostatistical Analysis. 5th. Upper Saddle River, NJ, USA: Pearson; 2010. [Google Scholar]
- 86.Rothman K. J. No adjustments are needed for multiple comparisons. Epidemiology. 1990;1(1):43–46. doi: 10.1097/00001648-199001000-00010. [DOI] [PubMed] [Google Scholar]
- 87.Streiner D. L. Statistics commentary series. Journal of Clinical Psychopharmacology. 2016;36(1):5–8. doi: 10.1097/jcp.0000000000000447. [DOI] [PubMed] [Google Scholar]
- 88.Altman D. G. Statistics in medical journals: some recent trends. Statistics in Medicine. 2000;19(23):3275–3289. doi: 10.1002/1097-0258(20001215)19:23<3275::aid-sim626>3.0.co;2-m. [DOI] [PubMed] [Google Scholar]
- 89.Aickin M., Gensler H. Adjusting for multiple testing when reporting research results: the Bonferroni vs. Holm methods. American Journal of Public Health. 1996;86(5):726–728. doi: 10.2105/ajph.86.5.726. [DOI] [PMC free article] [PubMed] [Google Scholar]
- 90.Holm S. A simple sequentially rejective multiple test procedure. Scandinavian Journal of Statistics. 1979;6(2):65–70. [Google Scholar]
- 91.Ioannidis J. P. A. The proposal to lower p value thresholds to .005. Jama. 2018;319(14):1429–1430. doi: 10.1001/jama.2018.1536. [DOI] [PubMed] [Google Scholar]
- 92.Benjamin D. J., Berger J. O., Johannesson M., et al. Nature Human Behaviour. 1. Vol. 2. January: 2018. Redefine statistical significance; pp. 6–10. [DOI] [PubMed] [Google Scholar]
- 93.Gu X., Blackmore K. L. Recent trends in academic journal growth. Scientometrics. 2016;108(2):693–716. doi: 10.1007/s11192-016-1985-3. [DOI] [Google Scholar]
- 94.Tenopi C., King D. W. The growth of journals publishing. In: Cope B., Phillips A., editors. The Future of the Academic Journal. 2nd. Oxford, UK: Chandos Publishing; 2014. [Google Scholar]
- 95.Smith J. Gift authorship: a poisoned chalice? BMJ. 1994;309(6967):1456–1457. doi: 10.1136/bmj.309.6967.1456. [DOI] [PMC free article] [PubMed] [Google Scholar]
- 96.Slone R. M. Coauthors’ contributions to major papers published in the AJR: frequency of undeserved coauthorship. American Journal of Roentgenology. 1996;167(3):571–579. doi: 10.2214/ajr.167.3.8751654. [DOI] [PubMed] [Google Scholar]
- 97.Kovacs J. Honorary authorship and symbolic violence. Medicine, Health Care and Philosophy. 2017;20(1):51–59. doi: 10.1007/s11019-016-9722-5. [DOI] [PubMed] [Google Scholar]
- 98.Derickson M., McClellan J. M., Mansukhani N. A., Kibbe M. R., Martin M. J. Variations in courtesy authorship perceptions and practices among modern surgical journals: the generation gap. Journal of Surgical Research. 2020;254:242–246. doi: 10.1016/j.jss.2020.04.034. [DOI] [PubMed] [Google Scholar]
- 99.Birnholtz J. P. What does it mean to be an author? The intersection of credit, contribution, and collaboration in science. Journal of the American Society for Information Science and Technology. 2006;57(13):1758–1770. doi: 10.1002/asi.20380. [DOI] [Google Scholar]
- 100.Reich M. S., Shaw J., Barrett L., Goldberg V. M., Schnaser E. Level of evidence trends in the journal of bone and joint surgery, 1980–2010. Iowa Orthopaedic Journal. 2014;34:197–203. [PMC free article] [PubMed] [Google Scholar]
- 101.Newman M. E. J. Coauthorship networks and patterns of scientific collaboration. Proceedings of the National Academy of Sciences. 2004;101(S1):5200–5205. doi: 10.1073/pnas.0307545100. [DOI] [PMC free article] [PubMed] [Google Scholar]
- 102.Jones B. F., Wuchty S., Uzzi B. Multi-university research teams: shifting impact, geography, and stratification in science. Science. 2008;322(5905):1259–1262. doi: 10.1126/science.1158357. [DOI] [PubMed] [Google Scholar]
- 103.Falk-Krzesinski H. J., Börner K., Contractor N., et al. Advancing the science of team science. Clinical and Translational Science. 2010;3(5):263–266. doi: 10.1111/j.1752-8062.2010.00223.x. [DOI] [PMC free article] [PubMed] [Google Scholar]
- 104.González-Alcaide G., Park J., Huamaní C., Belinchón I., Ramos J. M. Evolution of cooperation patterns in psoriasis research: co-authorship network analysis of papers in medicine (1942–2013) PLoS One. 2015;10(12) doi: 10.1371/journal.pone.0144837.e0144837 [DOI] [PMC free article] [PubMed] [Google Scholar]
- 105.Wuchty S., Jones B. F., Uzzi B. The increasing dominance of teams in production of knowledge. Science. 2007;316(5827):1036–1039. doi: 10.1126/science.1136099. [DOI] [PubMed] [Google Scholar]
- 106.ICMJE. Vancouver, Canada: International Committee of Medical Journal Editors; February 2019. Defining the role of authors and contributors. http://www.icmje.org/recommendations/browse/roles-and-responsibilities/defining-the-role-of-authors-and-contributors.html. [Google Scholar]
- 107.Sugimoto C. R., Thelwall M., Larivière V., Tsou A., Mongeon P., Macaluso B. Scientists popularizing science: characteristics and impact of TED talk presenters. PLoS One. 2013;8(4) doi: 10.1371/journal.pone.0062403.e62403 [DOI] [PMC free article] [PubMed] [Google Scholar]
- 108.Chetwood J. D., Ladep N. G., Taylor-Robinson S. D. Research partnerships between high and low-income countries: are intentional partnerships always a good thing? BMC Medical Ethics. 2015;16:p. 36. doi: 10.1186/s12910-015-0030-z. [DOI] [PMC free article] [PubMed] [Google Scholar]
- 109.Riesenberg D., Lundberg G. D. The order of authorship: who’s on first? JAMA: The Journal of the American Medical Association. 1990;264(14):p. 1857. doi: 10.1001/jama.264.14.1857. [DOI] [PubMed] [Google Scholar]
- 110.Svider P. F., Husain Q., Mauro K. M., Folbe A. J., Baredes S., Eloy J. A. Impact of mentoring medical students on scholarly productivity. International Forum of Allergy & Rhinology. 2014;4(2):138–142. doi: 10.1002/alr.21247. [DOI] [PubMed] [Google Scholar]
- 111.Borenstein J., Shamoo A. E. Rethinking authorship in the era of collaborative research. Accountability in Research. 2015;22(5):267–283. doi: 10.1080/08989621.2014.968277. [DOI] [PubMed] [Google Scholar]
- 112.McNutt M. K., Bradford M., Drazen J. M., et al. Transparency in authors’ contributions and responsibilities to promote integrity in scientific publication. Proceedings of the National Academy of Sciences. 2018;115(11):2557–2560. doi: 10.1073/pnas.1715374115. [DOI] [PMC free article] [PubMed] [Google Scholar]
- 113.Parish A. J., Boyack K. W., Ioannidis J. P. A. Dynamics of co-authorship and productivity across different fields of scientific research. PLoS One. 2018;13(1) doi: 10.1371/journal.pone.0189742.e0189742 [DOI] [PMC free article] [PubMed] [Google Scholar]
- 114.Shapiro D. W., Wenger N. S., Shapiro M. F. The contributions of authors to multiauthored biomedical research papers. JAMA: The Journal of the American Medical Association. 1994;271(6):438–442. doi: 10.1001/jama.1994.03510300044036. [DOI] [PubMed] [Google Scholar]
- 115.Zhou Y. The rapid rise of a research nation. Nature. 2015;528(7582):S170–S173. doi: 10.1038/528s170a. [DOI] [PubMed] [Google Scholar]
- 116.Biermann J. S. Women in orthopedic surgery residencies in the United States. Academic Medicine. 1998;73(6):708–709. doi: 10.1097/00001888-199806000-00020. [DOI] [PubMed] [Google Scholar]
- 117.Blakemore L. C., Hall J. M., Biermann J. S. Women in surgical residency training programs. The Journal of Bone and Joint Surgery-American Volume. 2003;85(12):2477–2480. doi: 10.2106/00004623-200312000-00031. [DOI] [PubMed] [Google Scholar]
- 118.Chambers C. C., Ihnow S. B., Monroe E. J., Suleiman L. I. Women in orthopaedic surgery. Journal of Bone and Joint Surgery. 2018;100(17):p. e116. doi: 10.2106/jbjs.17.01291. [DOI] [PubMed] [Google Scholar]
- 119.Day C. S., Lage D. E., Ahn C. S. Diversity based on race, ethnicity, and sex between academic orthopaedic surgery and other specialties. Journal of Bone and Joint Surgery. 2010;92-A(13):2328–2335. doi: 10.2106/jbjs.i.01482. [DOI] [PubMed] [Google Scholar]
- 120.Freischlag J. A. Women surgeons - still in a male-dominated world. Yale Journal of Biology and Medicine. 2008;81:203–204. [PMC free article] [PubMed] [Google Scholar]
- 121.Hill J. F., Johnson A. H., Cannada L. A profile of female academic orthopaedic surgeons. Current Orthopaedic Practice. 2013;24(6):636–640. doi: 10.1097/bco.0000000000000034. [DOI] [Google Scholar]
- 122.Lewis V. O., Scherl S. A., O’Connor M. I. Women in orthopaedics-way behind the number curve. Journal of Bone and Joint Surgery. 2012;94(5):p. e30. doi: 10.2106/jbjs.j.01408. [DOI] [PubMed] [Google Scholar]
- 123.Miller E. K., LaPorte D. M. Barriers to women entering the field of orthopedic surgery. Orthopedics. 2015;38(9):530–533. doi: 10.3928/01477447-20150902-03. [DOI] [PubMed] [Google Scholar]
- 124.O’Connor M. I. Where are all the women? Journal of Bone and Joint Surgery, American. 2018;100(4):p. e26. doi: 10.2106/JBJS.17.01501. [DOI] [PubMed] [Google Scholar]
- 125.Gutierrez C., Paulosky M., Aguinaldo A., Gerhart J. Women break an engineering barrier: while other engineering disciplines stumble, BME represents a success story in attracting American women to a male-dominated field. IEEE Pulse. 2017;8(6):49–53. doi: 10.1109/mpul.2017.2750818. [DOI] [PubMed] [Google Scholar]
- 126.Hart K. L., Boitano L. T., Tanious A., et al. Trends in female authorship in high Impact surgical journals between 2008 and 2018. Annals of Surgery. 2020 doi: 10.1097/SLA.0000000000004057. [DOI] [PubMed] [Google Scholar]
- 127.Bernardi K., Lyons N. B., Huang L., et al. Gender disparity among surgical peer-reviewed literature. Journal of Surgical Research. 2020;248:117–122. doi: 10.1016/j.jss.2019.11.007. [DOI] [PubMed] [Google Scholar]
- 128.Padmanaban V., DaCosta A., Tran A., et al. Closing the gender gap in global surgery: trends at the Academic Surgical Congress. Journal of Surgical Research. 2021;257:389–393. doi: 10.1016/j.jss.2020.08.027. [DOI] [PubMed] [Google Scholar]
- 129.Farhan S. A., Shahid I., Siddiqi J., Khosa F. Assessing the gap in female authorship in neurosurgery literature: a 20-year analysis of sex trends in authorship. World Neurosurgery. 2020;141:e661–e669. doi: 10.1016/j.wneu.2020.05.248. [DOI] [PubMed] [Google Scholar]
- 130.Luc J. G. Y., Vervoort D., Percy E., et al. Trends in female authorship: a bibliometric analysis of the annals of thoracic surgery. Annals of Thoracic Surgery. 2020;S0003-4975(20):31324–31332. doi: 10.1016/j.athoracsur.2020.06.031. [DOI] [PubMed] [Google Scholar]
- 131.Consky E. K., Bradshaw S. M., Wein A. N., Abramowicz S. The proportion of female authors in oral and maxillofacial surgery literature has not changed in 20 years. Journal of Oral and Maxillofacial Surgery. 2020;78(6):877–881. doi: 10.1016/j.joms.2020.03.011. [DOI] [PubMed] [Google Scholar]
- 132.Farooq A., Sahara K., Muneeb A., et al. Analysis of authorship in hepatopancreaticobiliary surgery: women remain underrepresented. Journal of Gastrointestinal Surgery. 2020;24(9):2070–2076. doi: 10.1007/s11605-019-04340-8. [DOI] [PubMed] [Google Scholar]
- 133.Cullen D. L., Luna G. Women mentoring in academe: addressing the gender gap in higher education. Gender and Education. 1993;5(2):125–137. doi: 10.1080/0954025930050201. [DOI] [Google Scholar]
- 134.Bennhold K. Another Side of #MeToo: Male Managers Fearful of Mentoring Women. New York, NY, USA: New York Times; 2017. [Google Scholar]
- 135.Gebhardt J. San Mateo, CA, USA: Survey Monkey; November 2020. How #MeToo has impacted mentorship for women. https://www.surveymonkey.com/curiosity/mentor-her-2019/ [Google Scholar]
- 136.McGregor J. #MeToo Backlash: More Male Managers Avoid Mentoring Women or Meeting Alone with Them. Washington, DC, USA: Washington Post; 2019. [Google Scholar]
- 137.Samora J. B. Advice from male leaders on how to mentor in the #MeToo era. AAOS Now. 2020:32–33. [Google Scholar]
- 138.Lattanza L. L., Meszaros-Dearolf L., O’Connor M. I., et al. The Perry initiative’s medical student outreach program recruits women into orthopaedic residency. Clinical Orthopaedics & Related Research. 2016;474(9):1962–1966. doi: 10.1007/s11999-016-4908-y. [DOI] [PMC free article] [PubMed] [Google Scholar]
- 139.Mason B. S., Ross W., Ortega G., Chambers M. C., Parks M. L. Can a strategic pipeline initiative increase the number of women and underrepresented minorities in orthopaedic surgery? Clinical Orthopaedics & Related Research. 2016;474(9):1979–1985. doi: 10.1007/s11999-016-4846-8. [DOI] [PMC free article] [PubMed] [Google Scholar]
- 140.O’Connor M. I. Medical school experiences shape women students’ interest in orthopaedic surgery. Clinical Orthopaedics & Related Research. 2016;474(9):1967–1972. doi: 10.1007/s11999-016-4830-3. [DOI] [PMC free article] [PubMed] [Google Scholar]
- 141.Kroin E., Garbarski D., Shimomura A., Romano J., Schiff A., Wu K. Gender differences in program factors important to applicants when evaluating orthopaedic surgery residency programs. Journal of Graduate Medical Education. 2019;11(5):565–569. doi: 10.4300/jgme-d-18-01078.1. [DOI] [PMC free article] [PubMed] [Google Scholar]
- 142.Hill J. F., Yule A., Zurakowski D., Day C. S. Resident’s perceptions of sex diversity in orthopaedic surgery. Journal of Bone and Joint Surgery, American. 2013;95-A(19):p. e144. doi: 10.2106/jbjs.l.00666. [DOI] [PubMed] [Google Scholar]
- 143.Poon S., Kiridly D., Mutawakkil M., et al. Current trends in sex, race, and ethnic diversity in orthopaedic surgery residency. Journal of the American Academy of Orthopaedic Surgeons. 2019;27(16):e725–e733. doi: 10.5435/jaaos-d-18-00131. [DOI] [PubMed] [Google Scholar]
- 144.Munger A. M., Heckmann N., McKnight B., Dusch M. N., Hatch G. F., III, Omid R. Revisiting the gender gap in orthopaedic surgery. Journal of the American Academy of Orthopaedic Surgeons. 2019;27(8):295–300. doi: 10.5435/jaaos-d-17-00686. [DOI] [PubMed] [Google Scholar]
- 145.Johnson A. L., Sharma I., Chinchilli V. M., et al. Why do medical students choose orthopaedics as a career? Journal of Bone and Joint Surgery, American. 2012;94-A(11):p. e78. doi: 10.2106/jbjs.k.00826. [DOI] [PubMed] [Google Scholar]
- 146.Bernstein J., DiCaprio M. R., Mehta S. The relationship between required medical school instruction in musculoskeletal medicine and application rates to orthopaedic surgery residency programs. The Journal of Bone & Joint Surgery. 2004;86-A(10):2335–2338. doi: 10.2106/00004623-200410000-00031. [DOI] [PubMed] [Google Scholar]
- 147.Holman L., Stuart-Fox D., Hauser C. E. The gender gap in science: how long until women are equally represented? PLoS Biology. 2018;16(4) doi: 10.1371/journal.pbio.2004956.e2004956 [DOI] [PMC free article] [PubMed] [Google Scholar]
- 148.Bozeman B., Gaughan M. How do men and women differ in research collaborations? An analysis of the collaborative motives and strategies of academic researchers. Research Policy. 2011;40(10):1393–1402. doi: 10.1016/j.respol.2011.07.002. [DOI] [Google Scholar]
- 149.Ghiasi G., Larivière V., Sugimoto C. R. On the compliance of women engineers with a gendered scientific system. PLoS One. 2015;10(12) doi: 10.1371/journal.pone.0145931.e0145931 [DOI] [PMC free article] [PubMed] [Google Scholar]
- 150.Rynecki N. D., Krell E. S., Potter J. S., Ranpura A., Beebe K. S. How well represented are women orthopaedic surgeons and residents on major orthopaedic editorial boards and publications? Clinical Orthopaedics & Related Research. 2020;478(7):1563–1568. doi: 10.1097/corr.0000000000000824. [DOI] [PMC free article] [PubMed] [Google Scholar]
- 151.Saxena S., Cannada L. K., Weiss J. M. Does the proportion of women in orthopaedic leadership roles reflect the gender composition of specialty societies? Clinical Orthopaedics & Related Research. 2020;478(7):1572–1579. doi: 10.1097/corr.0000000000000823. [DOI] [PMC free article] [PubMed] [Google Scholar]
- 152.Sugimoto C. R., Ahn Y.-Y., Smith E., Macaluso B., Larivière V. Factors affecting sex-related reporting in medical research: a cross-disciplinary bibliometric analysis. The Lancet. 2019;393(10171):550–559. doi: 10.1016/s0140-6736(18)32995-7. [DOI] [PubMed] [Google Scholar]
- 153.Bryant J., Yi P., Miller L., Peek K., Lee D. Potential sex bias exists in orthopaedic basic science and translational research. Journal of Bone and Joint Surgery. 2018;100(2):124–130. doi: 10.2106/jbjs.17.00458. [DOI] [PubMed] [Google Scholar]
- 154.Xiao N., Mansukhani N. A., Mendes de Oliveira D. F., Kibbe M. R. Association of author gender with sex bias in surgical research. JAMA Surgery. 2018;153(7):663–670. doi: 10.1001/jamasurg.2018.0040. [DOI] [PMC free article] [PubMed] [Google Scholar]
- 155.Organisation for Economic Co-operation and Development. March 2021. https://www.oecd.org/gender/data/women-make-up-most-of-the-health-sector-workers-but-they-are-under-represented-in-high-skilled-jobs.htm.
- 156.Carli L. L., Eagly A. H. Gender, hierarchy, and leadership: an introduction. Journal of Social Issues. 2001;57(4):629–636. doi: 10.1111/0022-4537.00232. [DOI] [Google Scholar]
- 157.Human Rights Watch. March 2021. https://www.hrw.org/news/2019/01/30/saudi-arabia-10-reasons-why-women-flee.
- 158.Khalifa A. A., El-Hawary A. S., Sadek A. E., Ahmed E. M., Ahmed A. M., Haridy M. A. Comparing the gender diversity and affiliation trends of the authors for two orthopaedics journals from the Arab world. Journal of Taibah University Medical Sciences. 2021;6(1) doi: 10.1016/j.jtumed.2020.12.008. [DOI] [PMC free article] [PubMed] [Google Scholar]
Associated Data
This section collects any data citations, data availability statements, or supplementary materials included in this article.
Supplementary Materials
S1 Appendix: Continuous bibliometric variables over time for each journal. S2 Appendix: Analyses by US regions. S3 Appendix: Analyses by Canadian regions. S4 Appendix: Analyses by European regions. S5 Appendix: Analyses by the four major Asian countries.
Data Availability Statement
The data are available from the corresponding author upon request.