

Abstract
NUT carcinoma (NC), characterized most commonly by the BRD4-NUTM1 fusion, is a rare, aggressive variant of squamous carcinoma with no effective treatment. BRD4-NUT drives growth and maintains the poorly differentiated state of NC by activating pro-growth genes such as MYC, through the formation of massive, hyperacetylated, super-enhancer-like domains termed megadomains. BRD4-NUT-mediated hyperacetylation of chromatin is facilitated by the chromatin-targeting tandem bromodomains of BRD4, combined with NUT, which recruits the histone acetyltransferase, p300. Here, we developed a high throughput small molecule screen to identify inhibitors of transcriptional activation by NUT. In this dCAS9-based GFP-reporter assay, the strongest hits were diverse histone deacetylase (HDAC) inhibitors. Two structurally unrelated HDAC inhibitors, panobinostat and the novel compound, IRBM6, both repressed growth and induced differentiation of NC cells in proportion to their inhibition of NUT transcriptional activity. These two compounds repressed transcription of megadomain-associated oncogenic genes, such as MYC and SOX2, while upregulating pro-differentiation, non-megadomain-associated genes, including JUN, FOS, and key cell cycle regulators, such as CDKN1A. The transcriptional changes correlate with depletion of BRD4-NUT from megadomains, and redistribution of the p300/CBP-associated chromatin acetylation mark, H3K27ac, away from megadomains towards regular enhancer regions previously populated by H3K27ac. In NC xenograft models, we demonstrated that suppression of tumor growth by panobinostat was comparable to that of bromodomain inhibition, and when combined they improved both survival and growth suppression.
INTRODUCTION
NUT Carcinoma (NC, aka NUT Midline Carcinoma) is a rare subtype of squamous carcinoma defined by NUT (NUTM1) gene rearrangement1–3. With a median survival 6.5 months4, 5, NC is one of the most aggressive solid tumors, and there exists no effective treatment.
In 78% of cases, NUTM1 is fused to BRD4, encoding the BRD4-NUT fusion protein5. BRD4, a ubiquitously expressed member of the bromodomain and extraterminal (BET) family, plays a critical role in transcription1, 6–9. By contrast, wild type NUT expression is restricted to testes1, and plays a critical role in male germ cell development. It is expressed in post-meiotic spermatids where, through recruitment of the acetyltransferase, p300, global H4 histones are hyperacetylated, allowing for a BET protein, BRDT, to remove histones and be replaced with protamines1, 10. Knockdown of BRD4-NUT induces cellular differentiation and growth arrest11, indicating that BRD4-NUT maintains the poorly differentiated, proliferative state of NC. In less common variants of NC, NUTM1 is fused to genes which encode key members of the core BRD4-NUT chromatin complex, including BRD3, NSD3, ZNF532 and ZNF59211–14, indicating that NUT-fusion partners that bring NUT in proximity to BRD4 can be interchangeable.
The oncogenic function of BRD4-NUT depends on unique properties of both NUT and BRD4. While the BRD4 moiety binds acetylated histones through its dual bromodomains15, 16 and recruits numerous protein-interactors through its ET domain12, 17, NUT serves to recruit p300 and activate its catalytic histone acetyltransferase (HAT) domain10, 13, 18, 19. When fused, BRD4-NUT forms massive, 55kb-2MB, contiguous stretches of BRD4-NUT-enriched chromatin, termed megadomains. Megadomains are hyperacetylated, likely as a result of recruitment of p300, and drive transcription of associated coding and non-coding DNA20. In several respects, they function like enormous super-enhancers21. Key oncogenic targets of megadomains are p63, SOX2, and MYC, whose expression is required for the growth and blockade of differentiation in NC cells16, 20, 22. The interaction and activation of p300 HAT by NUT may in part confer NUT with its intrinsic transcriptional activating properties19, and is likely required for megadomains to drive transcription18, 20. Megadomains share many, but not all, properties with super-enhancers (aka locus control region), including the enrichment with p300, BRD4, H3K27ac, mediator, and association with non-coding enhancer regions. However there are some differences, including their massive size and typical origin from pre-existing regular, not super-, enhancers13, 20, 23.
The bromodomains of BRD4 are required for the blockade of differentiation in NC 16. Indeed, inhibition of BET bromodomains by small molecules as potential cancer therapeutics was originally pioneered in NC24, where it was shown that BET inhibitors disrupt BRD4-NUT megadomains, and induce growth arrest and differentiation of NC cells, both in vitro and in vivo24. However, despite the on-target activity of BET inhibitors in NC, the therapeutic window is limited by toxicity, likely due to the dependency of many normal tissues on BRD4 function25–28. A recent study demonstrated that CDK4/6 inhibition could overcome resistance to BET inhibition, and the combination of BET and CDK4/6 inhibitors improved the survival of a mouse xenograft model of NC, however the response was not durable29. Apart from BET inhibitors, histone deacetylase (HDAC) inhibitors have also been shown to induce differentiation and growth arrest of NC30, 31, and have demonstrated some limited activity in NC patients30, 32, although the mechanism by which they inhibit NC growth is poorly understood.
Given the therapeutic challenge of targeting ubiquitously expressed proteins, such as BRD4, we sought to identify selective inhibitors of NUT. Because NC growth is dependent upon BRD4-NUT-driven expression, we reasoned that a small molecule that blocks NUT-dependent gene activation would be a strong candidate for a new therapeutic agent. Here, we performed a high throughput chemical screen using a dCAS9-based GFP-reporter assay to identify small molecules that inhibit NUT-dependent gene activation, and identify HDAC inhibitors, unexpectedly, as the top hits. We further evaluate the effect of HDAC inhibition on BRD4-NUT. We find that it interferes with BRD4-NUT function by redistributing histone acetylation and BRD4-NUT in a manner that reprograms NUT carcinoma to a pro-differentiative state.
MATERIALS AND METHODS
Chemical library Screening with dCas9-NUT transcriptional activation assay
293T cells were seeded onto 150 mm dishes at a density of 6 × 10⁶ cells per dish and incubated at 37 °C for 24 hours. To create cells expressing the experimental GFP reporter, one 150 mm dish of 293T cells was co-transfected with pcDNA-N-SMASh-dCas9_NUT_full (1.6 μg), pGL3-Basic-8x-gRNA-eGFP (4 μg), and gRNA-eGFP-Reporter (13 μg) using Polyjet In Vitro Transfection Reagent (SL100688, SignaGen Laboratories, Frederick, MA). For control mCherry reporter expression, pcDNA-dCas9-VP64-Rta-AD (1.6 μg), pGL3-Basic-8x-gRNA-mCherry (4 μg), and gRNA-GFP-Reporter (13 μg) plasmids were co-transfected into 293T cells. Transfected cells were incubated for 2 hours at 37ºC. 30 μl of DMEM media was dispensed into 384-well plates (3764, Corning, Corning, NY) using a Multidrop Combi Reagent Dispenser (5840300; Thermo Fisher Scientific), and 100 nL of each compound from chemical libraries were added to the plate by pin transfer method with Seiko Compound Transfer Robot (SGM611) at the Harvard Medical School Institute of Chemistry and Cell Biology-Longwood (ICCB-L) Screening facility (Boston, MA). The working concentration of compounds are a 1/500 dilution of the stock concentration listed in Table S1. DMSO (negative control) and Asunaprevir (ASV, positive control, A3195, APExBIO, Houston, TX) were added manually to each plate. Plates were kept in the dark until cells were dispensed. After incubating transfected cells for 2 hours, cells were collected by treating with Accutase (07922, Stemcell Technologies, Vancouver, BC) for 10 min at 37 °C, then GFP-expressing cells and mCherry expressing cells were mixed at ratio of 50:50. Cell density was adjusted to 4 × 10⁵ cells/ml and 20 μl of the cell suspension was added to each well (8000 cells per well) using Multidrop Combi Reagent Dispenser. The plates were incubated in 37 °C incubator for 24 hours, then eGFP and mCherry signals were measured by an acumen Cellista instrument (SPT Labtech, Hertfordshire, UK) under the following settings: resolution: X=1.0;Y=0.8; area of interest: whole well; laser setup: 400V for both channels; counting signal method: area/total signal.
We screened 6945 distinct compounds in duplicate using the following chemical libraries: Biomol4, BiomolCCBL1012, Cayman Biolipid 1, CB GPCR, GB ION Core, GB KINA Core, GB NHRB Core, Emegadomain1, eMolecules 2014, LINCS3, LOPAC1, Selleck-10 mM, SYNthesis2. We measured total fluorescent intensity of GFP and mCherry in individual wells and obtained the ratio of GFP: mCherry fluorescence intensity as a readout. Z-score was calculated based on the standard deviation of each plate, and we obtained potential hits using the following criteria: strong hit: Z<−5, medium hit: −5<Z<−4, weak hit: −4<Z<−3.
In vitro HDAC assay
The in vitro HDAC assay was performed using a Fluor de Lys-HDAC-H3 peptide assay kit (HDAC Fluorogenic Assay Kit, BPS Bioscience) and recombinant HDAC1 in complex with HSP70 (BPS Bioscience, San Diego, CA). The inhibitors were dissolved in pH7.5 reaction buffer (50 mM HEPES, 100 mM KCl, 0.2 mg/ml BSA, 0.1 % DMSO) at final concentrations of 10 μM, 1 μM, 100 nM, 40 nM, and 10 nM of IRBM6, or 10 μM, 1 μM, 400 nM, 100 nM, and 10 nM of MS275. The HDAC1/HSP70 complex was added to a final concentration of 10 nM and was incubated with inhibitors for 30 min at room temperature. After incubating for another 2 min on ice, fluorescence peptide substrate 3 was added at a final concentration of 50 μM. The 40 μl reactions were then incubated at 37°C for 30 min, followed by the addition of 60 μl developer solution. The solutions were loaded onto a 96-well plate and fluorescence (excitation 365 nm, emission 450 nm) was measured on a BioTek plate reader33.
In vitro CoREST inhibition assay
Reagents
Reagents used are provided in Supplementary Methods.
Histone H3K9ac synthesis
The depsipeptide as Fmoc-Thr(OtBu)-glycolic acid was first synthesized based on a reported two-step protocol 34. Then, H3K9ac(aa1–34) with a sequence as ARTKQTARKS-TGGKAPRKQL-ATKAARKSAP-A-TOG-G was synthesized via standard solid phase peptide synthesis (SPPS), purified by reversed phase HPLC, and the structure was confirmed by MALDI-TOF Mass Spectrometry (MS) ([M + H]+ calculated as m/z 3494.9, observed at m/z 3493.0) at the Molecular Biology Core Facilities of Dana Farber Cancer Institute. F40 sortase was expressed and purified as reported previously, and bacterial expression and purification of X. laevis globular H3 (gH3; amino acids 34–135 C110A) were performed also following a previous protocol 29869982. Then, the F40 sortase catalyzed histone H3 ligation reaction was carried out between the H3K9ac (aa1–34, please note the C-terminal residue is extruded) peptide and the gH3. The reaction mixture was purified by ion-exchange chromatography to release pure semisynthetic histone H3K9ac (C110A) characterized by MALDI-TOF MS ([M + H]+ calculated as m/z 15280.8, observed as m/z 15274.3).
Octamer refolding and nucleosome reconstitution
146 bp Widom 601 DNA was prepared by previously reported methods used for nucleosome reassembly 35. Bacterial expression and purification of X. laevis core histones H2A, H2B and H4 were then carried out, followed by assembly of the histone octamer and refolding as previously reported 36. The octamer was purified by size exclusion chromatography using a Superdex 200 10/300 GL column (GE Healthcare) and was used for nucleosome assembly with 146 bp 601 Widom DNA as reported previously 36. The final mixture was subjected to HPLC purification (Waters, 1525 binary pump, 2489 UV-Vis detector), using a TEKgel DEAE ion exchange column that was employed to purify the final nucleosome product. The purified nucleosome containing H3K9ac was analyzed by native TBE-gel with EtBr staining, as well as SDS-PAGE gel and then Western blot analysis by anti-H3K9ac antibody.
Analysis of CoREST complex deacetylation of acetylated nucleosomes with the existence of IRBM6 or MS275
IRBM6 (320 nM, 160 nM, 80 nM, 40 nM, and 20 Nm) or MS-275 (10 μM, 6 μM, 3 μM and 1 Μm) were dissolved in a pH7.5 reaction buffer containing 50 mM HEPES, 100 mM KCl, 0.2 mg/ml BSA, 100 μM inositol hexaphosphate (IP6), and 0.1 % DMSO. The CoREST complex (RCoR1-HDAC1-LSD1) was added to a final concentration of 20 nM, and was incubated with inhibitors for 10 min at room temperature. After incubating for another 2 min on ice, a final concentration of 100 nM of H3K9ac nucleosomes was added. These 40 μl reactions were then warmed to 37°C and aliquots removed at time points of 0, 40 min, 80 min and 160 min. Each aliquot was quenched with an SDS-loading buffer containing 20 mM EDTA, and was heated at 95° C for 3 min. After running SDS-PAGE and iBlot transfer to nitrocellulose membranes, Western blot analysis was performed with anti-H3K9ac primary antibody (1:2000 dilution), followed by the Goat anti-Rabbit secondary antibody (1:2000 dilution). Imaging analysis with chemiluminescence on GeneSys was quantified using ImageJ software37.
Cell culture
NUT carcinoma (NC) cell lines TC-79738, 10–1516, PER40339 were derived from pleural effusions in two male (TC-797 and 10–15) and one female (PER-403) NC patients. These cell lines and non-NC 293T cells are maintained as monolayer cultures in DMEM (Invitrogen, Carlsbad, CA) supplemented with 10% (TC-797, 10–15, 293T) or 20% (PER-403) fetal bovine serum (Hyclone, South Logan, UT), 1% Penicillin Streptomycin (SV30010, Hyclone) and 1X GlutaMAX (35050061, Gibco/Thermo Fisher Scientific, Waltham, MA). Authentication of each cell line is periodically (bimonthly) performed by staining for expression of BRD4-NUT by IF (anti-NUT), which reveals nuclear foci staining in NC cell lines, and no staining in non-NC cell lines. Cell lines are always tested for mycoplasma using a commercial PCR-based method (MycoScope PCR Detection Kit (Gelantis)) prior to freezing for storage, and after a month of continued passaging. Experimental procedures are performed no later than two weeks after each cell line is thawed.
Plasmids
Plasmids and their construction are provided in Supplementary Methods.
Cell viability assay
Cell viability was assayed by CellTiter-Glo according to the manufacturer’s instructions. Details are provided in Supplementary Methods.
Cytologic staining
TC-797, 10–15 or PER-403 cells grown on 25 mm glass coverslips (12-545-102, Fisher Scientific, Pittsburg, PA) were treated with DMSO, IRBM6 (200 nM) or panobinostat (15 nM) for 72 hours and stained with Hemacolor Rapid Staining kit (1.11661, Millipore Sigma, Temecula, CA) according to the manufacturer’s instructions.
Chromatin immunoprecipitation and library preparation for next generation sequencing (chip-seq)
The protocol for Chromatin immunoprecipitation (ChIP) on TC-797 treated with DMSO or panobinostat was adapted from Rosencrance et al 202040. 3 × 10⁷ cells were used for anti-NUT ChIP, and 1 × 10⁷ cells were used for anti-H3K27ac ChIP. TC-797 was treated with DMSO or panobinostat (30 nM) for 4 hours prior to cross-linking. Full details of the remaining procedure are in Supplemental Methods.
RNA isolation and library preparation for RNA sequencing
TC-797 or 10–15 cells grown on 150 mm dishes were treated with DMSO, IRBM6 (200 nM), or panobinostat (30 nM) for 4 hours. RNA was extracted from 1 × 10⁷ cells using TRIzol RNA Isolation Reagent (15596026, Invitrogen) followed by a second purification using RNeasy Plus Mini Kit according to the manufacturer’s instructions (74134, Qiagen, Hilden, Germany). Genomic DNA was removed by DNase digestion with Turbo DNA-free kit (AM 1907, Fisher Scientific). DNase digestion was repeated twice at 37 °C for 30 min, and the RNA was cleaned using the Zymo RNA Clean & Concentrator kit according to the manufacturer’s instructions (R1013, Zymo Research). DNA integrity was analyzed on a 2200 TapeStation RNA ScreenTape (Agilent Technologies, Santa Clara, CA) (RIN>7 as intact). ERCC ExFold RNA spike-in mixes (4456739, Invitrogen) were added at 2 μl of 1:100 diluted spike-in per 1000 ng of RNA for normalization of RNA transcript levels. Ribosomal RNA was removed by NEBNext rRNA Depletion Kit (E6350, NEB). Sequencing libraries were generated using NEBNext Ultra II Directional RNA library kit (E7760S, NEB), and the quality of generated libraries were analyzed on a 2200 TapeStation D1000 (Agilent Technologies). The libraries of IRBM6-treated cells were sequenced on an Illumina NextSEQ500 at the Molecular Biology Core Facilities (MBCF) at Dana-Farber Cancer institute (DFCI, Boston, MA) by 75 bp single-end sequencing, and the libraries of panobiostat-treated cells were sequenced on Illumina Novaseq 6000 by 50 bp paired-end with SP flowcell Genomics Facility at University of Chicago (Chicago, IL). The libraries were generated from two biological duplicates for each sample type.
Next-generation sequencing data analysis
RNA-seq
RNA-seq analysis was performed as described previously41. Details are provided in Supplementary Methods.
ChIP-seq
Reads were trimmed and verified for quality with Trim Galore! (v.0.6.4_dev, https://www.bioinformatics.babraham.ac.uk/projects/trim_galore/). Trimmed reads were aligned with STAR (v.2.7.5a42) to the human genome (GRCh38 primary assembly) using end-to-end alignment (--runMode alignReads --alignIntronMax 1 --alignEndsType EndToEnd). Alignment files were restricted to named chromosomes (chr1, chr2, …, chrX, chrY). Duplicate reads were filtered out using Picard Tools MarkDuplicates (v.2.23.8).
Megadomain identification
MACS2 (v.2.2.7.143) was used to identify enrichment peaks in each sample vs its matched input. Peaks from replicate samples were combined with bedtools2 mergeBed (-d 300) (v2.23.044) to make a superset of peaks per condition. Megadomains were identified from the size distribution of the DMSO H3K27ac superset. The domain size at the inflection point was 55Kb. Enrichment domains exceeding the 55Kb cut off were deemed to be megadomains in all conditions.
H3K27ac internal control (“desert”) region selection
Bigwig files for the 7 cells lines comprising the ENCODE Consortium “Layered H3K27ac Track” (using data from the Bernstein Lab at the Broad Institute, https://bernstein.mgh.harvard.edu/) were downloaded from the UCSC GRCh38 page (http://genome.ucsc.edu) and used to identify regions of consistently low H3K27ac signal. Briefly, non-overlapping 10Kb windows were used to partition the genome. For each cell line individually, regions with < median counts were retained. Retained regions were then further limited to only those where all 7 cell lines had low signal. Regions falling on chrX or chrY were excluded. One final filtering step removed regions that were included by a small overlap but resulted in full regions with excess H3K27ac signal. The resulting 4,741 regions covering a total of 400Mb distributed across all non-sex chromosomes (regions sizes ranged from 40Kb to 500Kb, Table S3) were then used to evaluate background read levels across samples. Based on these desert regions, normalization factors for ChIPs and their input controls ranged from 0.78 to 1.04, indicating no need for scaling beyond sequencing depth corrections.
Accession numbers
RNA-seq and ChIP-seq data will be available in Gene Expression Omnibus with accession number GSE179694.
Xenograft model
All in vivo studies were performed at the DFCI with Institutional Animal Care and Use Committee approval in an AAALAC accredited vivarium as described41. The PER-403 BRD4-NUT+ NC cell line was stably transduced with FUW-Luc-mCherry-puro (PER-403-CLP)45, which constitutively expresses luciferase and mCherry, to enable bioluminescence imaging (BLI) of tumor growth. Disseminated NC mice were generated by injecting 1 × 10⁶ PER-403-CLP cells into the tail vein of 8-week-old NSG (NOD-scid IL2Rγ−/−) female mice (Jackson Laboratory, Bar Harbor, ME). BLI was performed to quantify tumor burden in mice by injecting D-luciferin (75 mg/kg, Promega) subcutaneously, and imaged with the IVIS Spectrum Imaging System (Perkin Elmer, Waltham, MA). To quantify bioluminescence, the integrated total flux of photons (the sum of the prone and supine values) were quantified within identical regions of interest using Living Image Software (Perkin Elmer). BLI quantification of tumor burden was used for initial randomization of mice into various treatment groups; and for weekly imaging to assess tumor response.
Drug treatment was initiated at the time disseminated tumor was established in all mice as determined by BLI measurements. Panobinostat (LBH589) was formulated in 10% DMSO + D5W and administered intraperitoneally once daily for 21 days. CPI-0610 was formulated in 0.5% methylcellulose and administered subcutaneously twice daily for 21 days. Cisplatin and etoposide were obtained from the pharmacy and diluted with normal saline before use. Bioluminescence imaging was performed once weekly after treatment initiation and body weights were measured twice weekly.
Immunoblotting
Cells were lysed in RIPA Buffer (50 mM Tris-HCl, 250 mM NaCl, 1% NP-40, 0.5% Sodium Deoxycholate, 0.1% SDS, 5 mM EDTA) containing 250 mM NaCl and Halt Protease and Phosphatase Inhibitor Cocktail (78445, Thermo Fisher Scientific) for 30 min at 4°C with rotation. Immunoblotting was performed as described30. Antibodies used are provided in the Supplementary Methods.
For immunoblotting BRD4-NUT or p300 from TC-797 cell lysates following 200nM IRBM6 HDACi treatment, extraction was performed in 8M urea.
Histone extraction
To evaluate levels of H3K27ac in the chromatin, histone was extracted using a Histone Extraction Kit (ab113476, Abcam) according to the manufacturer’s instructions. The extracted histones were analyzed by immunoblot.
Immunofluorescence
Immunofluorescence was performed as described previously18, and details are provided in Supplementary Methods. The primary antibodies used were: anti-NUT (1/1,000, clone C52B1), and anti-H3K27ac (1/2,500, mouse monoclonal MABI0309; Active Motif).
RESULTS
Small molecule screen identifies inhibitors of NUT-dependent transcriptional activation
BRD4-NUT driven upregulation of oncogenic targets, particularly MYC, is required for NC growth, and thus represents a therapeutic vulnerability. We hypothesized that BRD4-NUT drives transcription at least in part through the NUT moiety, which is a potent transcriptional activator19. Thus, inhibition of NUT-dependent transcriptional activation could potentially serve to a) identify more selective inhibitors of BRD4-NUT, and b) therapeutically target the fundamental function of BRD4-NUT to activate transcription. In order to identify compounds that selectively inhibit NUT-dependent gene transcription, we designed a chemical screen using transcriptional activation (TA) of a fluorescent reporter as readout. Our screen utilized a nuclease-deactivated mutant of Cas9 enzyme (dCas9) fused with NUT (dCas9-NUT), co-transfected with a GFP reporter gene and guide RNA (gRNA), the latter which recognizes the promoter of the reporter gene (Fig. 1A).
Figure 1.

Chemical screen for small molecules that specifically inhibit the dCas9-NUT-dependent reporter gene activation. A. Schematic overview of the screen workflow. B. GFP expression in the presence (DMSO) or absence (ASV) of dCas9-NUT. ASV-induced dCas9-NUT degradation through a SMASh tag suppress GFP expression, confirming the specificity of the assay. C. Scatter plot of the Z-score of the GFP/mCherry fluorescent ratio. Weak hits (W) (−3 > Z > −4) are represented by magenta, medium hits (M) (−4 > Z > −5) are in green, and strong hits (S) (Z < −5) in red. Other data points shown in gray are non-hits (N/A).
Ideally, our screen would also compare inhibitors of dCas9-NUT with those of dCas9-BRD4-NUT and dCas9-BRD4 to distinguish which compounds are specific to the BRD4-NUT fusion from those targeting NUT or BRD4 alone, however including dCAS-BRD4 or -BRD4-NUT in the screen would conflate results. The bromodomains of BRD4 will allow the dCAS9-BRD4/BRD4-NUT to bind acetyl-histones not associated with the gRNA target site. Indeed, 293T cells co-transfected with dCAS9-BRD4-NUT/gRNA/GFP-reporter, in contrast with dCAS9-NUT, appears to localize to chromatin-associated foci, likely forming megadomains (Fig. S1A). The promiscuous chromatin binding of dCAS9-BRD4/BRD4-NUT, in contrast to the diffuse nuclear distribution of dCAS9-NUT, which is the expected pattern for localization to the GFP reporter plasmid46, is predicted to be further altered by compounds that modify the acetylation state of chromatin. One could imagine, for example, that hyperacetylation of chromatin by an HDAC inhibitor could sponge dCAS9-BRD4-NUT, leading to less gRNA target site binding and decreased signal.
Apart from the above, a key aspect of our rationale for this screen is that NUT is a more favorable therapeutic target to screen for inhibitors than BRD4, given that its expression is restricted to testes, whereas BRD4 is ubiquitously expressed. In fact, targeting BRD4 has been the central challenge with BET inhibitors – they are quite toxic due to their effects on normal tissue25. For these reasons, the screen was intended to identify potential inhibitors of NUT-mediated transcriptional activation that can be later validated for their activity against BRD4-NUT.
In order to distinguish NUT-specific from unrelated transcriptional activation, we counter-screened using dCas9-VP64, a known dCas9-fused transcriptional activator47, using a mCherry reporter gene. The dCas9-NUT/gRNA/GFP plasmid cocktail and dCAS9-VP64/gRNA/mCherry plasmid cocktail were transfected separately into 293T cells. Transfected 293T cells were then mixed and treated with small molecule libraries in high-throughput format. We measured the ratio of signal intensity for each reporter and searched for compounds that reduced NUT-dependent TA, scored by GFP fluorescence intensity relative to VP64-dependent TA, scored by mCherry intensity (Fig. 1B). Using this system, we sought compounds that reduce GFP signals without affecting mCherry signals, reflecting specific inhibition of NUT-dependent TA.
For use as a positive control, dCas9-NUT was fused with a small molecule-assisted shut-off tag (SMASh) degron48, which induces degradation of the tagged protein in the presence of asunaprevir (ASV). At baseline, the SMASh tag is cleaved by HCV NS3 protease, preventing recognition by ubiquitin ligase. Upon exposure to ASV, which inhibits the protease, the SMASh tag remains intact and leads to proteosomal degradation of the tagged protein. As predicted, addition of ASV leads to rapid degradation of dCAS9-NUT and subsequent loss of the GFP signal, confirming that GFP expression faithfully scores NUT-dependent transcriptional activation (Fig. 1B). Using this positive control, a robustness score (Z’) of 0.6–0.8 was achieved.
In this system, we screened 6945 distinct compounds listed in Table S1. Compounds screened were from diverse chemical libraries (Table S2) as follows: FDA-approved bioactive molecules (Biomol4, Biomol ICCB-L-2012, Selleck-10mM, and eMolecules 2014), kinase inhibitors (Chembridge KINA core, EMD, and SYNthesis2), G-protein coupled receptor ligands (Chembridge GPCR), ion channel inhibitors (Chembridge ION core), nuclear hormone receptor inhibitors, such as those targeting the androgen receptor, estrogen receptor, PPAR, RAR, etc. (Chembridge NHRB), biolipids, such as thromboxanes and prostaglandins (Cayman Biolipid 1), chromatin targeting molecules (LINCS3), and diverse pharmacologically active molecules (Selleck-10mM, LOPAC1).
We calculated the Z score of GFP/mCherry ratios for each plate and defined potential hits when both replicates satisfy the following criteria: Z < −5 as strong hits, −4 > Z > −5 as medium hits, −3 > Z > −4 weak hits (Figure 1C). We also calculated the Z score of mCherry fluorescence intensity and excluded compounds that had Zmcherry < −3 as this is indicative of non-specific inhibition. Using these criteria, 73 experimental events (67 distinct events) were identified. We further removed experimental wells with an unusually low number of objects (below 100), wells with no detectable fluorescence, and compounds known to function as NS3 protease inhibitors which activate the SMASh tag, from the list of potential hits. After removing these presumed false positives, we identified 31 compounds (14 strong hits, 12 medium hits, 5 weak hits). Unexpectedly, 78.6% of strong hits (11/14 compounds), 41.7 % of medium hits (5/12), and 60% of weak hits (3/5), were HDAC inhibitors (HDACi) of diverse chemical structures (Table 1). Images of some wells of the screen plates are shown in Figure S1. Generally, histone deacetylases are thought to silence gene expression by erasing histone acetylation, creating a closed chromatin configuration. The result of our TA screen is therefore counterintuitive to the prediction that increased histone acetylation through HDAC inhibition should increase transcriptional activity. The finding is of particular interest due to the known inhibitory effect of HDAC inhibitors on NC growth. Thus, we performed further analysis to elucidate the mechanism of inhibition of HDACi on NUT and BRD4-NUT function.
Table 1:
Hits identified in dCas9-NUT gene activation screen.
| Category | Name | Z-score ratio | Detail |
|---|---|---|---|
|
| |||
| Strong hits (Z < −5) |
Resminostat | −7.4899133 | HDAC1,3,6 inhibitor |
| AR-42 | −7.3883485 | Pan HDAC inhibitor | |
| Givinostat (ITF2357) | −7.3514841 | HD1, HD2 inhibitor | |
| CUDC-907 | −7.0452166 | PI3Kalpha, HDAC1/2/3/10 inhibitor | |
| M344 | −6.4871558 | Pan HDAC inhibitor | |
| CAY10603 | −5.9989529 | HDAC6 inhibitor | |
| LAQ824 (Dacinostat) | −5.8206081 | Pan HDAC inhibitor | |
| Panobinostat (LBH589) | −5.7445099 | Pan HDAC inhibitor | |
| CUDC-101 | −5.6817125 | HDAC, EGFR, HER2 inhibitor | |
| Trichostatin A (TSA) | −5.6657951 | Pan HDAC inhibitor | |
| Tie2 kinase inhibitor | −5.5794341 | Tie2 kinase inhibitor | |
| Aurora Kinase/Cdk Inhibitor | −5.5303834 | Aurora Kinase/Cdk Inhibitor | |
| Quisinostat (JNJ-26481585) | −5.4915758 | HDAC1,2,3,4,5,8,10,11 inhibitor | |
| PCI-24781 (Abexinostat) | −5.3587855 | HDAC1,2,3,6,8,10 inhibitor | |
|
| |||
| Medium hits (−4 > Z > −5) |
TG101209 | −4.9992613 | JAk2 inhibitor |
| Scriptaid | −4.4155906 | HDAC inhibitor | |
| Belinostat; PXD101 | −4.3646698 | Pan HDAC inhibitor | |
| SB939; Pracinostat | −4.3620555 | Pan HDAC inhibitor | |
| Cdk4 Inhibitor III | −4.3052789 | Cdk4 Inhibitor | |
| TG101348 (SAR302503) | −4.2147643 | JAK2 ihnibitor | |
| Mocetinostat; MGCD0103 | −4.1676383 | HDAC1,2,3 inhibitor | |
| BI-D1870 | −4.1113278 | RSK1/2/3/4 inhibitor. Ribosome. ATP competitive. | |
| TPEN | −4.0883568 | Zinc chelator | |
| YM155 (Sepantronium Bromide) | −4.0877919 | Survivin inhibitor | |
| Vorinostat; suberoylanilide hydroxamic acid (SAHA); Zolinza | −4.086072 | Pan HDAC inhibitor | |
| LY-83583 | −4.0449138 | Inhibitor of guanulate cyclase and of cGMP production | |
|
| |||
| Weak hits (−3 > Z > −4) |
CTB | −3.898452 | p300 activator. |
| Nexturastat A | −3.8182979 | HDAC6 inhibitor | |
| Belinostat; PXD101 | −3.8092171 | Pan HDAC inhibitor | |
| Rocilinostat; ACY-1215 | −3.5746703 | HDAC1,2,3,6,8 inhibitor | |
| HO-3867 | −3.3855469 | STAT3 inhibitor | |
HDAC inhibitors suppress NUT-dependent transcription
To determine the potency of different HDAC inhibitors on suppression of NUT-dependent transcriptional activation, we scored the effect of a range of doses of each compound in the above screening assay. We found that the potency of each compound generally matched its ranking in our screen. Nexturostat A, one of the weak hits, inhibited the reporter expression only at high dose. Entinostat, a non-hit class I specific HDACi, exhibited no activity, and panobinostat, a hydroxamic acid and one of the strong hits, was the most potent (Fig. 2 A). In addition, we also tested apicidin, a structurally unrelated class I HDACi not present in our screen. This fungal-derived, natural compound contains an ethylketone zinc binding warhead49, also showed potent inhibition in this assay (Fig. 2 A). The demonstration that structurally dissimilar HDAC inhibitors can inhibit NUT-dependent transcriptional activation provides evidence of a common mechanism of inhibition.
Figure 2.

Inhibition of NUT-dependent gene activation and growth of BRD4-NUT-positive NC cells with HDAC inhibitors. A. Inhibitory effect of entinostat (non-hit), nexturastat A (weak hit), apicidin (not included in screen), and panobinostat (strong hit) on dCas9-NUT-dependent reporter expression. Ratios of GFP/mCherry fluorescence were calculated. The results are from 3 biological replicates. B. IC50 and corresponding C. dose response of a series of indicated HDAC inhibitors measured on the NC cell line TC-797 by CellTiterGlo assay (Promega). Data are expressed as mean +/−SD.
Because of its structural complexity and high molecular weight, the cyclic tetrapeptide apicidin is not an ideal starting point for orally bioavailable small molecule HDAC inhibitors. As part of their efforts to develop new class I selective HDAC inhibitors, the IRBM/Merck group (Rome, Italy) thus explored smaller and more synthetically tractable compounds that retained the ethylketone zinc binding group of apicidin50, 51. Some of those compounds, including compound 6 in their study51, here termed ‘IRBM6’, were found to be active against class I HDACs. We obtained IRBM6 and tested its activity toward purified HDAC1 in an in vitro HDAC assay using an H3K9ac peptide as substrate. IRBM6 demonstrated low nM IC50 towards HDAC activity in this assay, 21-fold more potent than entinostat (Fig. S2A). Interestingly, the difference in potency was even more pronounced (~48-fold) comparing these compounds’ inhibition of the CoREST complex (Fig. S2B). This finding supports the idea that binding of an HDAC inhibitor to its target within a co-repressor complex differs from that with a purified enzyme, likely due to the difference in structural contexts52; and provides a possible explanation for why there may be differences in potency of different HDACi in inhibiting NUT.
Inhibition of NUT carcinoma growth correlates with suppression of NUT-dependent transcription
To determine whether the effect of HDAC inhibitors on NUT-dependent transcription is functionally linked to their suppression of NC growth, and thus BRD4-NUT function, we compared the growth inhibitory effects of the above HDACs on NC cell lines, all of which express endogenous BRD4-NUT, but not wild type NUT. We found that the suppression of NUT-dependent transcription by various HDAC inhibitors roughly correlated with that on the growth of the NC cell line, TC-797 (Fig. 2B, C). For example, entinostat and nexturostat were found to be weak inhibitors of NUT transcriptional activity and NC growth, whereas the strong inhibitors of NUT activity, panobinostat and apicidin, were found to be highly effective inhibitors of NC growth. Indeed, the apicidin synthetic derivative, IRBM6, also showed a potent inhibitory effect on the growth TC-797s and two additional NC cell lines, PER-403, and 10–15 (Fig. 2B, 2C, S2B).
HDAC inhibition induces a transcriptional program of differentiation in NC cells
Previous studies demonstrated that NUT carcinoma cell lines undergo differentiation and growth arrest upon treatment with HDAC inhibitors such as TSA and panobinostat30. Here, we demonstrated the effect of panobinostat, and for the first time, IRBM6, inducing differentiation indicated by morphological changes and increased expression of cytokeratin, in three NUT carcinoma cell lines, TC-797, 10–15, and PER-403 (Fig 3A, S3A). Apoptosis, as evidenced by PARP cleavage, was minimally present or absent (Fig. S3B). We hypothesized that HDAC inhibitors affect a set of genes that are essential for proliferation whose expression depends on NUT. Indeed, RNAseq of two NC cell lines, 10–15 and TC-797, treated with panobinostat or IRBM6 demonstrated large-scale changes in gene expression that were significantly enriched with differentiation gene sets and depleted of pro-growth gene sets, including those of MYC and E2F targets53, 54(Fig. 3B–C, S3C–D). These findings are consistent with the previously observed arrest in proliferation of NC cells following HDAC inhibition30. Whether these changes in gene expression are a result of changes in transcription of target genes of BRD4, BRD4-NUT, or both cannot be determined because both proteins are predicted to bind to acetylated histones through their bromodomains in a DNA-sequence-independent manner15, 55; neither protein contains a DNA-binding domain. In fact, we have previously shown that BRD4 and BRD4-NUT proteins co-purify in pull-downs, and co-localize on chromatin13, 20.
Figure 3.

Panobinostat induces growth arrest and differentiation through altering transcriptome in NC. A. Hemacolor staining, left, and cytokeratin (differentiation marker) immunoblots, right, of NC cells (TC-797, PER-403, 10–15) treated with panobinostat (15nM) for 72h. Scale bar, 20μm. B. Differentially expressed genes identified by RNA-seq of TC-797 and 10–15 cells treated with panobinostat (30nM, 4h). Venn diagram, left, shows the number of up- or down-regulated genes in TC-797, 10–15, or both NC cell lines treated with panobinostat compared with DMSO. The heatmap, right, shows differential expression of all affected genes for each treatment. C. Heatmap of row-scaled Normalized Enrichment Scores (NES) for Hallmark or Genome Ontology (GO) gene sets with family-wise error < 0.25 in comparisons by GSEA of pre-ranked log2 fold change in panobinostat treated cells relative to DMSO control.
HDAC inhibitors redistribute BRD4-NUT and H3K27ac and deplete megadomains
To better understand the transcriptional changes induced in NC cells by HDACi, we sought to determine whether changes occur in the localization of BRD4-NUT and the p300/CBP-mark, H3K27ac, on chromatin. One might predict that HDAC inhibition would increase chromatin acetylation resulting in enhanced binding and enrichment of BRD4-NUT, creating larger, and more transcriptionally active megadomains. To test this idea, we initially examined the effect on BRD4-NUT nuclear foci, which correspond with megadomains, in TC-797 cells following exposure to panobinostat and IRBM6. Rather than seeing increased signal within BRD4-NUT foci, these foci appear to disperse and redistribute throughout the nucleus shortly after HDAC inhibitor treatment, in keeping with what has been observed previously18(Fig. 4A, S4A). Though the immunofluorescent images give the appearance that BRD4-NUT is increasing, likely due to lack of concentration within foci, the protein levels in fact remain unchanged (Fig. S4B–C). H3K27ac, which normally is enriched within megadomains, also redistributes along chromatin, and this accompanies increased H3K27ac in cell lysates (Fig. 4A, S4A, D).
Figure 4.
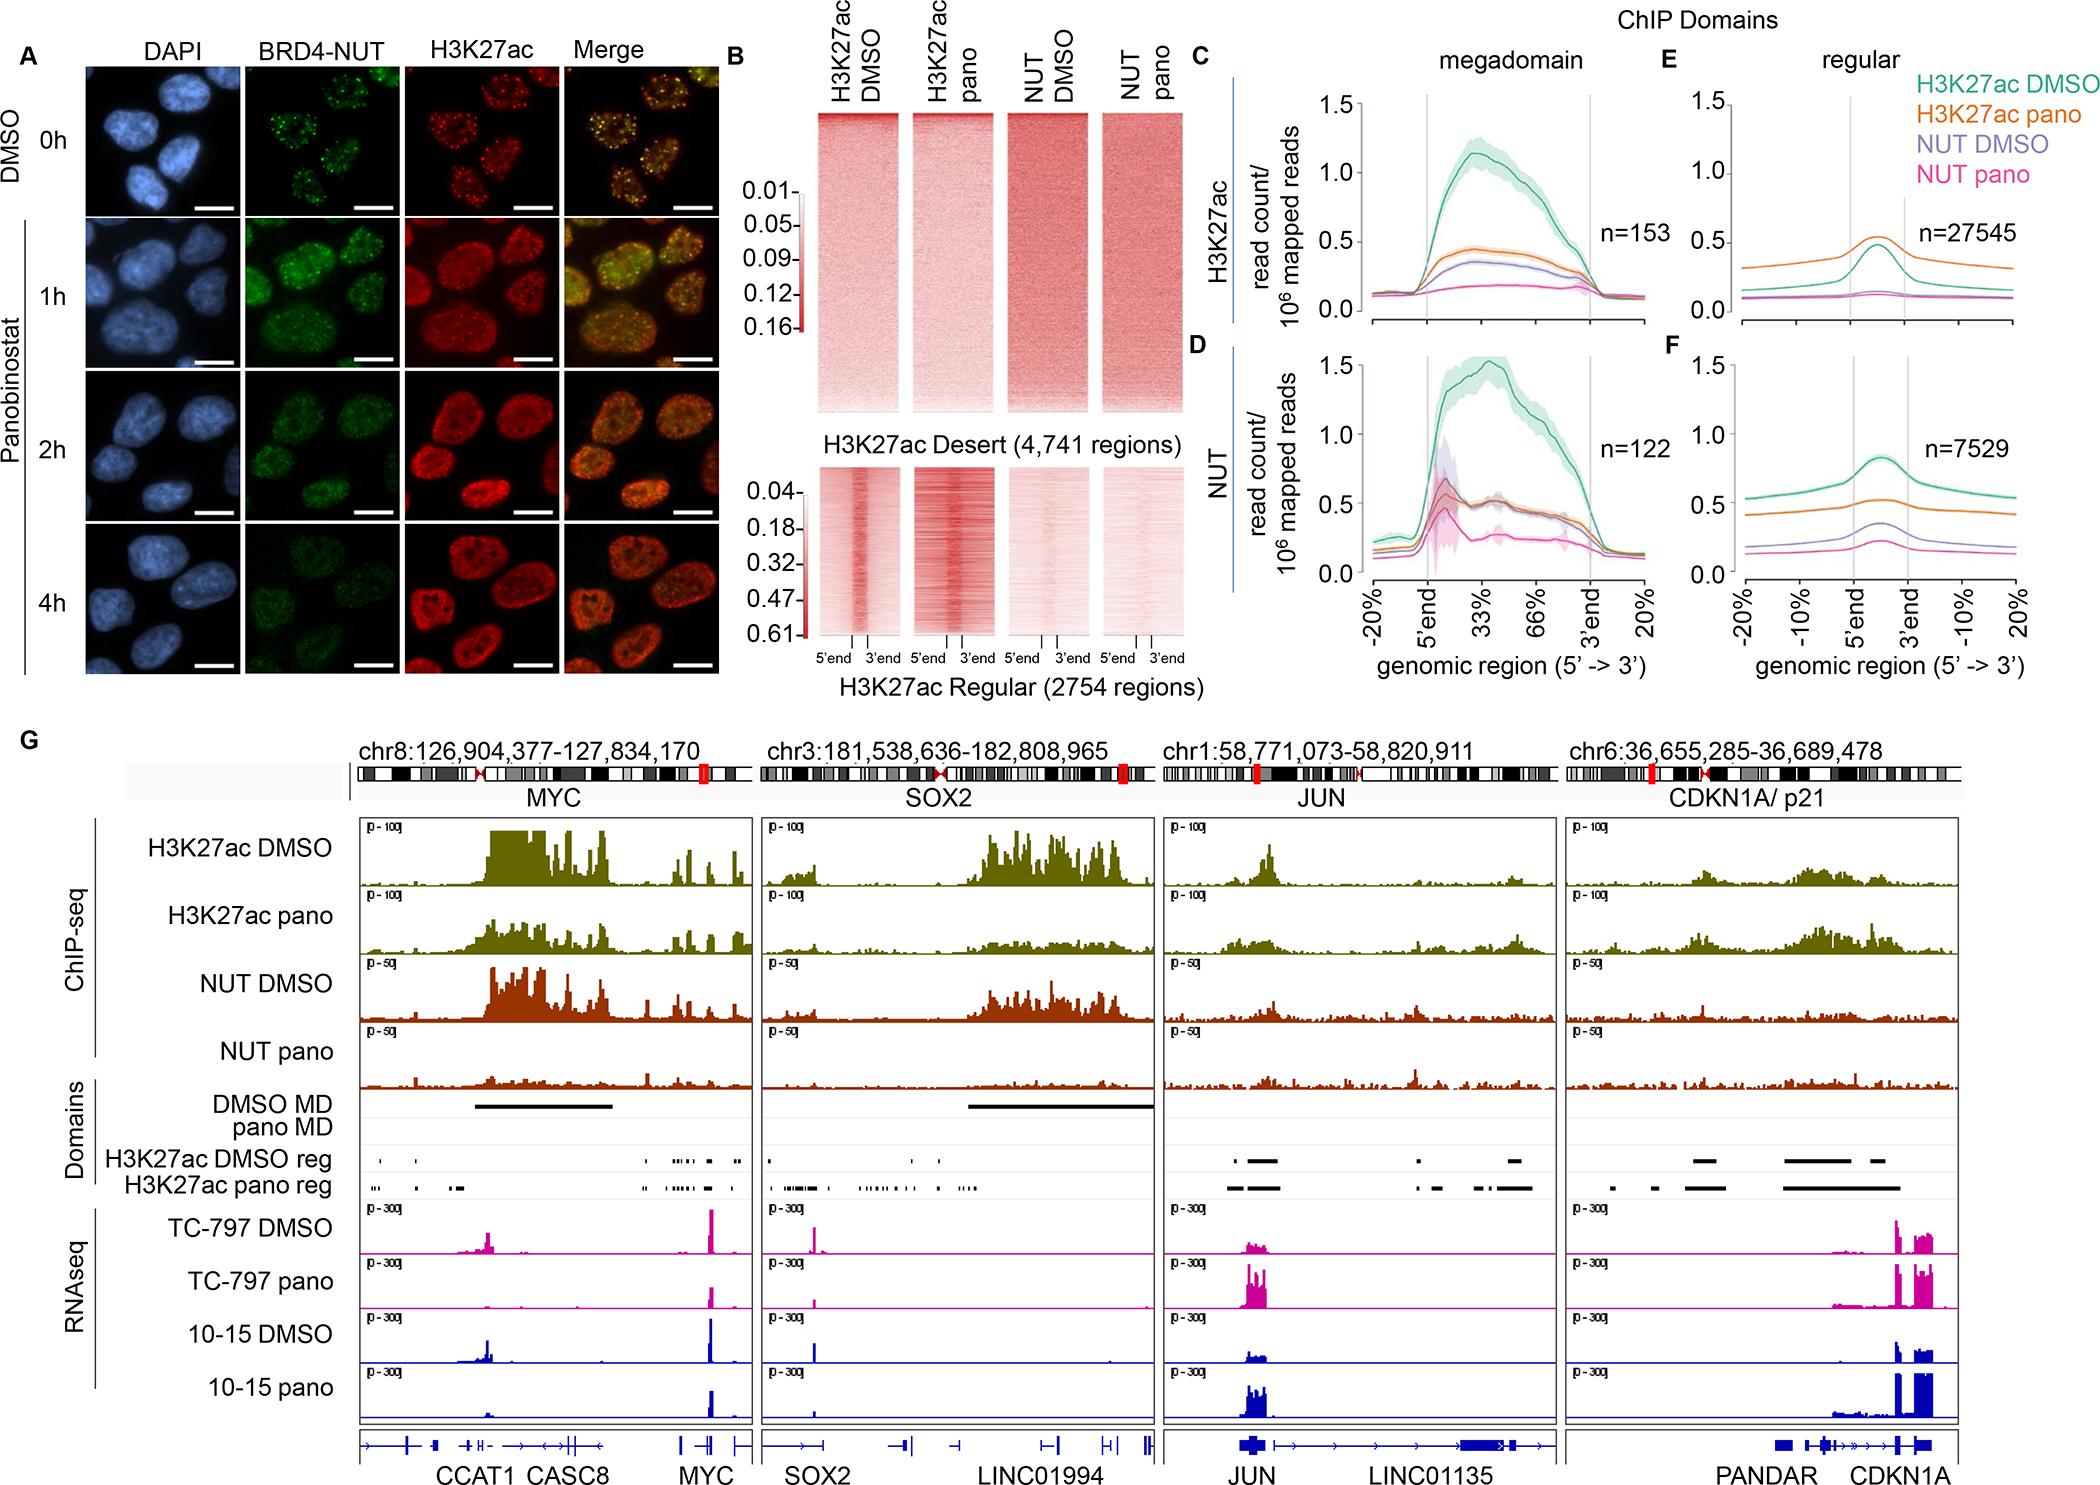
Panobinostat treatment induces redistribution of BRD4-NUT and H3K27ac in NC cells. A. Images of immunofluorescence showing BRD4-NUT (green) and H3K27ac (red) localization in TC-797 cells treated with 30 nM of panobinostat for 1, 2, or 4 h. No further changes were seen at 8h (not shown). Control cells were treated with DMSO for 4 h. Scale bar, 10μm. B. Heatmaps of ChIP-seq performed on TC-797 cells treated with panobinostat (30nM) or DMSO for 4h. Top, H3K27Ac ChIPseq signal heatmaps of 4,741 H3K27Ac desert regions. Bottom, heatmaps of randomly sampled H3K27Ac peaks (n=2,754, 10% of 27,545 peaks). C-F. ChIP-seq signal profiles of BRD4-NUT and H3K27ac in TC-797 cells treated with panobinostat or DMSO for 4h obtained from ChIP-seq data as in B. ChIP-seq signal profiles within megadomain regions and regular peak regions (“regular”) as indicated are shown. Megadomains are defined by the inflection point obtained from the H3K27ac superset of peaks in DMSO-treated cells, for which the cutoff is 55kb. Regular domains are defined as non-megadomain peaks for the indicated antibodies used for ChIP. Number of peaks used for each profile are indicated. C. Enrichment profile in H3K27ac-associated megadomains. D. Enrichment profile in NUT-associated megadomains identified using the 55kb cutoff. E. Enrichment profile in H3K27ac-associated regular domains. F. Enrichment profile in NUT-associated regular domains. G. Integrated genome browser (IGV) track of regions around MYC/SOX2 and JUN/CDKN1A loci as examples of megadomain (MD) and non-megadomain regions, respectively. BRD4-NUT and H3K27ac ChIP-seq signals are colored rust and green, respectively. Each track shown for ChIP-seq and RNA-seq is from replicate 1 of two replicates. Black bars indicate domains (megadomain or regular, as indicated) identified for the provided conditions. Megadomains indicated by the black bars include only overlapping H3K27ac and NUT-associated megadomains. Regular domains, also indicated by black bars, are shown only for H3K27ac peaks. RNA-seq tracks are colored pink and blue. pano, panobinostat; reg, regular domain.
We next performed ChIP-sequencing (ChIP-seq) using antibodies to NUT and H3K27ac to determine the changes in chromatin enrichment and distribution following treatment with panobinostat in TC-797 cells. Quantification of H3K27ac-enrichment within 4,741 H3K27ac-desert regions revealed no differences in enrichment of these regions by NUT or H3K27ac between replicates or treated samples. The finding indicates that background enrichment of NUT and H3K27ac does not change with panobinostat treatment (Fig. 4B). Thus, the increase in H3K27ac enrichment seen in regular enhancer regions (Fig. 4B) is likely responsible for the bulk increase in H3K27 acetylation seen in cell lysates (Fig. S4D), and in gene expression generally (Fig. 3B).
We had predicted that, because bulk acetylation and gene expression increase following HDACi, enrichment of megadomains with H3K27ac and BRD4-NUT might increase upon HDACi exposure. Instead, both H3K27ac and BRD4-NUT enrichment paradoxically decreased within megadomains as well as regular NUT-enriched peaks (Fig. 4C–G). Megadomains depleted by HDACi include those targeting regions that uphold expression of MYC and SOX2, both of which play a key oncogenic role in the blockade of differentiation and maintenance of NUT carcinoma growth16, 20, 22,. These epigenetic changes correlate well with downregulation of MYC pathway gene sets (Fig. 3C, S3D). By contrast, H3K27ac regular peaks (but not BRD4-NUT) showed broadening, including those associated with cell cycle arrest (e.g. CDKN1A) and differentiation (e.g. JUN, FOS). These changes correlate with the upregulation of differentiation and apoptotic transcriptional programs, and the downregulation of proliferation-associated gene sets (Fig. 3C, S3D).
Taken together, the findings indicate that HDACi treatment of NC cells can confer depletion of H3K27ac and BRD4-NUT from BRD4-NUT-associated domains, and redistribution of H3K27ac to regular enhancer regions. The overall effect of the epigenetic rewiring by HDACi appears to be decreased expression of megadomain-associated oncogenic target genes, and increased expression of non-BRD4-NUT-associated pro-senescent/differentiation genes. Of note, the global depletion of BRD4-NUT from chromatin does not correlate with bulk BRD4-NUT protein levels, which are unchanged upon HDACi treatment (Fig. S4B–C). The finding suggests that BRD4-NUT may be redistributed widely along chromatin in small peaks that are indistinguishable from baseline.
Improved in vivo efficacy of HDAC inhibitor is achieved when combined with BET inhibitor
We sought to compare the in vivo activity of clinically-relevant doses of panobinostat (aka LBH-589) with that of BET inhibitor, pelabresib (CPI-0610, Constellation Pharmaceuticals, Cambridge, MA) which is being evaluated in phase 3 trials. Our data above, coupled with that which has been published using BET inhibitors20, suggest that HDAC and BET inhibitors both target BRD4-NUT through an overlapping mechanism of depletion of megadomains and downregulation of BRD4-NUT oncogenic targets genes. Such synergy appeared counterintuitive. Nevertheless, since neither compound class alone appears to completely evict BRD4-NUT from megadomains (Fig. 4D, G, and20), we reasoned that the combination may be complementary in this process. Thus, we included the combination of HDAC inhibitor and BET inhibitor in an additional arm.
For this pre-clinical study (n = 8 mice per arm), we used one of our xenograft models of disseminated NC41, where a human-derived BRD4-NUT+ NC cell line, PER-40339, is injected by tail vein into a NOD scid gamma (NSG) mouse, after which tumor disseminates to solid organs and bone. This cell line has been modified with a stably integrated FUW-Luc-mCherry-puro45 plasmid that constitutively expresses luciferase and mCherry to allow for non-invasive visualization of tumor by bioluminescence imaging (BLI). Treatment was initiated one week after cell implantation and continued for 21 days after which treatment was stopped. Mouse tumor burden and survival continued to be monitored to evaluate the durability of response after the cessation of treatment.
During the first twenty-one days of treatment, tumor growth was inhibited equally by panobinostat and CPI-0610 (Fig. 5A), and survival was significantly improved compared with vehicle using either panobinostat or CPI-0610 alone (Fig. 5B). The combination of HDAC and BET inhibitor demonstrated greater growth inhibition and survival benefit than any other treatment (Fig. 5A–B). The survival of combination-treated mice was borderline significantly better than that of vehicle, HDAC inhibitor alone, or BET inhibitor, with p values of 0.0518 and 0.0461 using log-rank (Mantel-Cox) and Gehan-Breslow-Wilcoxon tests, respectively (Fig. 5B). These findings indicate that while HDAC and BET inhibition may confer similar therapeutic benefit in NC patients, combining them may improve the outcomes of NC patients.
Figure 5.

Improved in vivo growth repression and prolonged survival of mouse xenograft model of NC combining BET and HDAC inhibitors. A. Tumor growth in luciferase-expressing PER-403 NC cells engrafted into NOD-scid-GAMMA mice measured by bioluminescence imaging. Green and red triangles indicate treatment start and stop, respectively. B. Survival of PER-403 xenograft mice receiving various treatments (CPI-0610 (pelabresib): BETi, LBH589 (panobinostat)). The table summarizes median survival and p-values for each treatment. Green and red triangles are as described in A. C. Representative (4 of 8 mice per group) BLI images in prone mice. Color scale: minimum, 1 × 10⁶; maximum, 5 × 10⁷.
DISCUSSION
Histone deacetylase activity is traditionally considered to be associated with transcriptional repression, through a process of nucleosome deacetylation, chromatin compaction, and decreased access of transcription factors and transcriptional machinery to DNA. Here we describe an apparent paradox where de-repression of histone acetylation through HDAC inhibition leads to repression of NUT-mediated transcriptional activation. The transcriptional repression correlates with redistribution of H3K27ac away from NUT-enriched regions, whether they be megadomains or regular peaks, to non-NUT-associated regions previously occupied by H3K27ac (Fig. 4C–G). The net result of this redistribution is a global increase in transcription, which associates with the increase in acetylation of pre-existing H3K27ac peaks (Fig. 3B, 4B). Thus, in fact, HDAC inhibition does not lead to a paradoxical decrease in transcription associated with increased acetylation, but rather the opposite; HDACi leads to redistribution of acetylation, and those regions where acetylation is increased are predictably transcriptionally upregulated, whereas those where acetylation is decreased, transcription is downregulated.
The question then is why does HDAC inhibition lead to the redistribution of H3K27 acetylation away from NUT-associated regions? The most likely cause is the redistribution of HAT activity by the only known proteins to acetylate H3K27ac, the paralogs p300 and CBP, which are thought to be present in limiting concentrations 56. Thus, initial acetylation of normal enhancers upon HDAC inhibition may be followed by redistribution of p300 and BRD4-NUT, both present in limited quantities, away from megadomains and other NUT-associated regions (Fig. 4D, F–G). p300 would logically redistribute to poised p300-associated regions, defined by pre-existing H3K27ac peaks (Fig. 4C, E, G). In addition, it is possible that the interaction between NUT and p300 is disrupted by HDAC inhibition, possibly through changes in the acetylation of Lys residues of NUT and/or p300. In support of this possibility is the observation that the bromodomains of BRD4 have been shown to interact with p300, presumably through acetyl-lysine-bromodomain binding57. Disengagement of NUT and p300 would also explain the results of the chemical screen, where HDACi led to decreased transcriptional activation by NUT.
An alternative explanation for the uncoupling of H3K27ac from BRD4-NUT following HDAC inhibition is that HDACs themselves, particularly their multiprotein complexes, may not be equally distributed at baseline. It is possible that HDACs might be relatively depleted at NUT-associated regions, resulting in a disproportionate increase in HAT activity at non-NUT-associated regions. This second scenario is less likely than the first because HDACs are known to be present at nearly all promoter and enhancer regions, many of which overlap with BRD4-NUT-enriched regions (Fig. 4F–G and 13, 20), and we have previously shown that at least HDAC2 is associated with the BRD4-NUT complex based on proteomic studies13.
Another question arising from our study is, where is BRD4-NUT going? As shown in Fig. S4B–C, BRD4-NUT protein levels remain unchanged in the presence of HDACi, yet it becomes depleted from pre-existing NUT peaks (Fig. 4D, F–G). Based on our immunofluorescence showing dispersion of BRD4-NUT shortly after panobinostat or IRBM6 treatment (Fig. 4A, S4A), it appears to redistribute on chromatin, but possibly to different sites than H3K27ac. BRD4 is known to preferentially bind a rare histone 4 polyacetylation state, which is increased in the presence of HDACi58, thus it is likely that the widespread increase in histone H4 polyacetylation following HDACi causes a similarly widespread redistribution of BRD4-NUT to these sites. This could lead to uncoupling from p300 whose bromodomain is not known to preferentially bind polyacetylated histone H4. Finally, because BRD4-NUT protein levels are limited, it is likely that its redistribution to new peaks on a global scale cannot be detected above baseline by our ChIP-seq.
The epigenetic changes induced by HDACi may also lead to higher order perturbations that may influence the transcriptional changes seen in NC. In a rhabdomyosarcoma model Gryder et al., (201959) describe changes in chromatin conformation that result from HDACi. In this model, HDACi leads to spreading of histone acetylation at super-enhancers, resulting in decreased DNA-DNA contacts at those super-enhancers while new contacts form at sites of newly acetylated chromatin. The result is the eviction of RNA pol II from the super-enhancers and decreased transcription of associated genes. This may be relevant to NUT carcinoma because DNA-DNA contacts occur between megadomains both intra- and inter-chromosomally40. HDACi may also lead to decreased contacts between megadomains, repressing transcription even further than would happen otherwise through depletion of H3K27ac and BRD4-NUT.
From a therapeutic perspective, our findings provide mechanistic rationale for the use of HDACi in treatment of NC. In fact, the clinical proof-of-principle of single agent or combinations with HDACi treatment of NC patients has already been demonstrated 30, 32, 60. It is likely that the combination of BET with HDAC inhibition is at least additive therapeutically because while both inhibitors contribute to depletion of BRD4-NUT from megadomains, neither alone is sufficient for its full eviction20. Because mono-agent therapy of NC using BET bromodomain inhibitors has shown activity, but limited by toxicity26–28, the improved efficacy of combining BET with HDAC inhibitors in our preclinical study warrants consideration of further clinical investigation.
Supplementary Material
IMPLICATIONS.
The findings provide mechanistic and pre-clinical rationale for the use of HDAC inhibitors, alone or combined with other agents, in the treatment of NUT carcinoma.
Acknowledgements
This work was supported by research grants from the NCI (CA124633 Moonshot administrative supplement, to C.A. French and P.A. Cole), NIGMS (GM62437, to P.A. Cole, and GM126944 to M.I. Kuroda), the Samuel Waxman Cancer Research Foundation (to C.A. French), the St. Baldrick’s Foundation (to C.A. French). The authors thank Steven Harper, Vincenzo Summa, and Carlo Toniatti (IRBM, S.p.A.) for sharing IRBM6 with us. We thank the ICCB-Longwood Screening Facility at Harvard Medical School for their support in performing the chemical screen.
Footnotes
Competing interests
P.A. Cole has ownership interest (including patents) in Acylin Therapeutics and has consulted for Abbvie and Constellation Pharmaceuticals. C.A. French is a consultant at Boehringer-Ingelheim, and reports receiving a commercial research grant from Boehringer-Ingelheim, Glaxo-Smith-Kline, and Constellation Pharmaceuticals (Cambridge, MA). No potential conflicts of interest were disclosed by the other authors.
References
- 1.French CA, Miyoshi I, Kubonishi I, Grier HE, Perez-Atayde AR, Fletcher JA. Brd4-nut fusion oncogene: A novel mechanism in aggressive carcinoma. Cancer Res. 2003;63(2):304–7. [PubMed] [Google Scholar]
- 2.French CA, Kutok JL, Faquin WC, Toretsky JA, Antonescu CR, Griffin CA, et al. Midline carcinoma of children and young adults with nut rearrangement. J Clin Oncol. 2004;22(20):4135–9. Epub 2004/10/16. [DOI] [PubMed] [Google Scholar]
- 3.French CA. Pathogenesis of nut midline carcinoma. Annu Rev Pathol. 2012;7:247–65. Epub 2011/10/25. [DOI] [PubMed] [Google Scholar]
- 4.Bauer DE, Mitchell CM, Strait KM, Lathan CS, Stelow EB, Luer SC, et al. Clinicopathologic features and long-term outcomes of nut midline carcinoma. Clin Cancer Res. 2012;18(20):5773–9. Epub 2012/08/17. [DOI] [PMC free article] [PubMed] [Google Scholar]
- 5.Chau NG, Ma C, Danga K, Al-Sayegh H, Nardi V, Barrette R, et al. An anatomical site and genetic based prognostic model for patients with nut midline carcinoma: Analysis of 124 patients. JNCI Cancer Spectrum. 2019. [DOI] [PMC free article] [PubMed] [Google Scholar]
- 6.Yang Z, Yik JH, Chen R, He N, Jang MK, Ozato K, et al. Recruitment of p-tefb for stimulation of transcriptional elongation by the bromodomain protein brd4. Mol Cell. 2005;19(4):535–45. [DOI] [PubMed] [Google Scholar]
- 7.Mochizuki K, Nishiyama A, Jang MK, Dey A, Ghosh A, Tamura T, et al. The bromodomain protein brd4 stimulates g1 gene transcription and promotes progression to s phase. J Biol Chem. 2008;283(14):9040–8. [DOI] [PMC free article] [PubMed] [Google Scholar]
- 8.Yang Z, He N, Zhou Q. Brd4 recruits p-tefb to chromosomes at late mitosis to promote g1 gene expression and cell cycle progression. Mol Cell Biol. 2008;28(3):967–76. [DOI] [PMC free article] [PubMed] [Google Scholar]
- 9.Kanno T, Kanno Y, LeRoy G, Campos E, Sun HW, Brooks SR, et al. Brd4 assists elongation of both coding and enhancer rnas by interacting with acetylated histones. Nat Struct Mol Biol. 2014;21(12):1047–57. Epub 2014/11/11. [DOI] [PMC free article] [PubMed] [Google Scholar]
- 10.Shiota H, Barral S, Buchou T, Tan M, Coute Y, Charbonnier G, et al. Nut directs p300-dependent, genome-wide h4 hyperacetylation in male germ cells. Cell Rep. 2018;24(13):3477–87 e6. [DOI] [PubMed] [Google Scholar]
- 11.French CA, Ramirez CL, Kolmakova J, Hickman TT, Cameron MJ, Thyne ME, et al. Brd-nut oncoproteins: A family of closely related nuclear proteins that block epithelial differentiation and maintain the growth of carcinoma cells. Oncogene. 2008;27(15):2237–42. Epub 2007/10/16. [DOI] [PubMed] [Google Scholar]
- 12.French CA, Rahman S, Walsh EM, Kuhnle S, Grayson AR, Lemieux ME, et al. Nsd3-nut fusion oncoprotein in nut midline carcinoma: Implications for a novel oncogenic mechanism. Cancer Discov. 2014;4(8):928–41. Epub 2014/05/31. [DOI] [PMC free article] [PubMed] [Google Scholar]
- 13.Alekseyenko AA, Walsh EM, Zee BM, Pakozdi T, Hsi P, Lemieux ME, et al. Ectopic protein interactions within brd4-chromatin complexes drive oncogenic megadomain formation in nut midline carcinoma. Proc Natl Acad Sci U S A. 2017;114(21):E4184–E92. Epub 2017/05/10. [DOI] [PMC free article] [PubMed] [Google Scholar]
- 14.Shiota H, Elya JE, Alekseyenko A, Chou PM, Gorman SA, Barbash O, et al. ‘Z4’ complex member fusions in nut carcinoma: Implications for a novel oncogenic mechanism. Mol Cancer Res. 2018. [DOI] [PMC free article] [PubMed] [Google Scholar]
- 15.Dey A, Chitsaz F, Abbasi A, Misteli T, Ozato K. The double bromodomain protein brd4 binds to acetylated chromatin during interphase and mitosis. Proc Natl Acad Sci U S A. 2003;100(15):8758–63. [DOI] [PMC free article] [PubMed] [Google Scholar]
- 16.Grayson AR, Walsh EM, Cameron MJ, Godec J, Ashworth T, Ambrose JM, et al. Myc, a downstream target of brd-nut, is necessary and sufficient for the blockade of differentiation in nut midline carcinoma. Oncogene. 2014;33(13):1736–42. Epub 2013/04/23. [DOI] [PMC free article] [PubMed] [Google Scholar]
- 17.Rahman S, Sowa ME, Ottinger M, Smith JA, Shi Y, Harper JW, et al. The brd4 extraterminal domain confers transcription activation independent of ptefb by recruiting multiple proteins, including nsd3. Mol Cell Biol. 2011;31(13):2641–52. Epub 2011/05/11. [DOI] [PMC free article] [PubMed] [Google Scholar]
- 18.Reynoird N, Schwartz BE, Delvecchio M, Sadoul K, Meyers D, Mukherjee C, et al. Oncogenesis by sequestration of cbp/p300 in transcriptionally inactive hyperacetylated chromatin domains. EMBO J. 2010;29(17):2943–52. Epub 2010/08/03. [DOI] [PMC free article] [PubMed] [Google Scholar]
- 19.Wang R, You J. Mechanistic analysis of the role of bromodomain-containing protein 4 (brd4) in brd4-nut oncoprotein-induced transcriptional activation. J Biol Chem. 2015;290(5):2744–58. [DOI] [PMC free article] [PubMed] [Google Scholar]
- 20.Alekseyenko AA, Walsh EM, Wang X, Grayson AR, Hsi PT, Kharchenko PV, et al. The oncogenic brd4-nut chromatin regulator drives aberrant transcription within large topological domains. Genes Dev. 2015;29(14):1507–23. Epub 2015/07/30. [DOI] [PMC free article] [PubMed] [Google Scholar]
- 21.Eagen KP, French CA. Supercharging brd4 with nut in carcinoma. Oncogene. 2021. Epub 2021/01/17. [DOI] [PMC free article] [PubMed] [Google Scholar]
- 22.Wang R, Liu W, Helfer CM, Bradner JE, Hornick JL, Janicki SM, et al. Activation of sox2 expression by brd4-nut oncogenic fusion drives neoplastic transformation in nut midline carcinoma. Cancer Res. 2014;74(12):3332–43. [DOI] [PMC free article] [PubMed] [Google Scholar]
- 23.Loven J, Hoke HA, Lin CY, Lau A, Orlando DA, Vakoc CR, et al. Selective inhibition of tumor oncogenes by disruption of super-enhancers. Cell. 2013;153(2):320–34. Epub 2013/04/16. [DOI] [PMC free article] [PubMed] [Google Scholar]
- 24.Filippakopoulos P, Qi J, Picaud S, Shen Y, Smith WB, Fedorov O, et al. Selective inhibition of bet bromodomains. Nature. 2010;468(7327):1067–73. Epub 2010/09/28. [DOI] [PMC free article] [PubMed] [Google Scholar]
- 25.Stathis A, Zucca E, Bekradda M, Gomez-Roca C, Delord JP, de La Motte Rouge T, et al. Clinical response of carcinomas harboring the brd4-nut oncoprotein to the targeted bromodomain inhibitor otx015/mk-8628. Cancer Discov. 2016;6(5):492–500. Epub 2016/03/16. [DOI] [PMC free article] [PubMed] [Google Scholar]
- 26.Lewin J, Soria JC, Stathis A, Delord JP, Peters S, Awada A, et al. Phase ib trial with birabresib, a small-molecule inhibitor of bromodomain and extraterminal proteins, in patients with selected advanced solid tumors. J Clin Oncol. 2018:JCO2018782292. [DOI] [PubMed] [Google Scholar]
- 27.Piha-Paul SA, Hann CL, French CA, Cousin S, Braña I, Cassier PA, et al. Phase 1 study of molibresib (gsk525762), a bromodomain and extra-terminal domain protein inhibitor, in nut carcinoma and other solid tumors. JNCI Cancer Spectrum. 2019. [DOI] [PMC free article] [PubMed] [Google Scholar]
- 28.Shapiro GI, LoRusso P, Dowlati A, K TD, Jacobson CA, Vaishampayan U, et al. A phase 1 study of ro6870810, a novel bromodomain and extra-terminal protein inhibitor, in patients with nut carcinoma, other solid tumours, or diffuse large b-cell lymphoma. Br J Cancer. 2020. Epub 2020/12/15. [DOI] [PMC free article] [PubMed] [Google Scholar]
- 29.Liao S, Maertens O, Cichowski K, Elledge SJ. Genetic modifiers of the brd4-nut dependency of nut midline carcinoma uncovers a synergism between betis and cdk4/6is. Genes Dev. 2018;32(17–18):1188–200. [DOI] [PMC free article] [PubMed] [Google Scholar]
- 30.Schwartz BE, Hofer MD, Lemieux ME, Bauer DE, Cameron MJ, West NH, et al. Differentiation of nut midline carcinoma by epigenomic reprogramming. Cancer Res. 2011;71(7):2686–96. Epub 2011/03/31. [DOI] [PMC free article] [PubMed] [Google Scholar]
- 31.Sun K, Atoyan R, Borek MA, Dellarocca S, Samson ME, Ma AW, et al. Dual hdac and pi3k inhibitor cudc-907 downregulates myc and suppresses growth of myc-dependent cancers. Mol Cancer Ther. 2017;16(2):285–99. [DOI] [PubMed] [Google Scholar]
- 32.Maher OM, Christensen AM, Yedururi S, Bell D, Tarek N. Histone deacetylase inhibitor for nut midline carcinoma. Pediatr Blood Cancer. 2015;62(4):715–7. [DOI] [PubMed] [Google Scholar]
- 33.Kalin JH, Wu M, Gomez AV, Song Y, Das J, Hayward D, et al. Targeting the corest complex with dual histone deacetylase and demethylase inhibitors. Nat Commun. 2018;9(1):53. Epub 2018/01/06. [DOI] [PMC free article] [PubMed] [Google Scholar]
- 34.Wu M, Hayward D, Kalin JH, Song Y, Schwabe JW, Cole PA. Lysine-14 acetylation of histone h3 in chromatin confers resistance to the deacetylase and demethylase activities of an epigenetic silencing complex. Elife. 2018;7. Epub 2018/06/06. [DOI] [PMC free article] [PubMed] [Google Scholar]
- 35.Luger K, Rechsteiner TJ, Richmond TJ. Preparation of nucleosome core particle from recombinant histones. Methods Enzymol. 1999;304:3–19. Epub 1999/06/18. [DOI] [PubMed] [Google Scholar]
- 36.Dyer PN, Edayathumangalam RS, White CL, Bao Y, Chakravarthy S, Muthurajan UM, et al. Reconstitution of nucleosome core particles from recombinant histones and DNA. Methods Enzymol. 2004;375:23–44. Epub 2004/02/12. [DOI] [PubMed] [Google Scholar]
- 37.Wang ZA, Millard CJ, Lin CL, Gurnett JE, Wu M, Lee K, et al. Diverse nucleosome site-selectivity among histone deacetylase complexes. Elife. 2020;9. Epub 2020/06/06. [DOI] [PMC free article] [PubMed] [Google Scholar]
- 38.Toretsky JA, Jenson J, Sun CC, Eskenazi AE, Campbell A, Hunger SP, et al. Translocation (11;15;19): A highly specific chromosome rearrangement associated with poorly differentiated thymic carcinoma in young patients. Am J Clin Oncol. 2003;26(3):300–6. [DOI] [PubMed] [Google Scholar]
- 39.Kees UR, Mulcahy MT, Willoughby ML. Intrathoracic carcinoma in an 11-year-old girl showing a translocation t(15;19). Am J Pediatr Hematol Oncol. 1991;13(4):459–64. [DOI] [PubMed] [Google Scholar]
- 40.Rosencrance CD, Ammouri HN, Yu Q, Ge T, Rendleman EJ, Marshall SA, et al. Chromatin hyperacetylation impacts chromosome folding by forming a nuclear subcompartment. Mol Cell. 2020;78(1):112–26 e12. Epub 2020/04/04. [DOI] [PMC free article] [PubMed] [Google Scholar]
- 41.Morrison-Smith CD, Knox TM, Filic I, Soroko KM, Eschle BK, Wilkens MK, et al. Combined targeting of the brd4-nut-p300 axis in nut midline carcinoma by dual selective bromodomain inhibitor, neo2734. Mol Cancer Ther. 2020;19(7):1406–14. Epub 2020/05/07. [DOI] [PMC free article] [PubMed] [Google Scholar]
- 42.Dobin A, Davis CA, Schlesinger F, Drenkow J, Zaleski C, Jha S, et al. Star: Ultrafast universal rna-seq aligner. Bioinformatics. 2013;29(1):15–21. Epub 2012/10/30. [DOI] [PMC free article] [PubMed] [Google Scholar]
- 43.Zhang Y, Liu T, Meyer CA, Eeckhoute J, Johnson DS, Bernstein BE, et al. Model-based analysis of chip-seq (macs). Genome Biol. 2008;9(9):R137. Epub 2008/09/19. [DOI] [PMC free article] [PubMed] [Google Scholar]
- 44.Quinlan AR, Hall IM. Bedtools: A flexible suite of utilities for comparing genomic features. Bioinformatics. 2010;26(6):841–2. [DOI] [PMC free article] [PubMed] [Google Scholar]
- 45.Williamson MJ, Silva MD, Terkelsen J, Robertson R, Yu L, Xia C, et al. The relationship among tumor architecture, pharmacokinetics, pharmacodynamics, and efficacy of bortezomib in mouse xenograft models. Mol Cancer Ther. 2009;8(12):3234–43. Epub 2009/11/26. [DOI] [PubMed] [Google Scholar]
- 46.Bai H, Lester GMS, Petishnok LC, Dean DA. Cytoplasmic transport and nuclear import of plasmid DNA. Biosci Rep. 2017;37(6). Epub 2017/10/22. [DOI] [PMC free article] [PubMed] [Google Scholar]
- 47.Chavez A, Scheiman J, Vora S, Pruitt BW, Tuttle M, E PRI, et al. Highly efficient cas9-mediated transcriptional programming. Nat Methods. 2015;12(4):326–8. Epub 2015/03/03. [DOI] [PMC free article] [PubMed] [Google Scholar]
- 48.Chung HK, Jacobs CL, Huo Y, Yang J, Krumm SA, Plemper RK, et al. Tunable and reversible drug control of protein production via a self-excising degron. Nat Chem Biol. 2015;11(9):713–20. [DOI] [PMC free article] [PubMed] [Google Scholar]
- 49.Bhuiyan MP, Kato T, Okauchi T, Nishino N, Maeda S, Nishino TG, et al. Chlamydocin analogs bearing carbonyl group as possible ligand toward zinc atom in histone deacetylases. Bioorg Med Chem. 2006;14(10):3438–46. Epub 2006/01/28. [DOI] [PubMed] [Google Scholar]
- 50.Jones P, Altamura S, De Francesco R, Paz OG, Kinzel O, Mesiti G, et al. A novel series of potent and selective ketone histone deacetylase inhibitors with antitumor activity in vivo. J Med Chem. 2008;51(8):2350–3. Epub 2008/03/29. [DOI] [PubMed] [Google Scholar]
- 51.Bresciani A, Ontoria JM, Biancofiore I, Cellucci A, Ciammaichella A, Di Marco A, et al. Improved selective class i hdac and novel selective hdac3 inhibitors: Beyond hydroxamic acids and benzamides. ACS Med Chem Lett. 2019;10(4):481–6. Epub 2019/04/19. [DOI] [PMC free article] [PubMed] [Google Scholar]
- 52.Fuller NO, Pirone A, Lynch BA, Hewitt MC, Quinton MS, McKee TD, et al. Corest complex-selective histone deacetylase inhibitors show prosynaptic effects and an improved safety profile to enable treatment of synaptopathies. ACS Chem Neurosci. 2019;10(3):1729–43. Epub 2018/11/30. [DOI] [PMC free article] [PubMed] [Google Scholar]
- 53.Herrera MC, Chymkowitch P, Robertson JM, Eriksson J, Boe SO, Alseth I, et al. Cdk1 gates cell cycle-dependent trna synthesis by regulating rna polymerase iii activity. Nucleic Acids Res. 2018;46(22):11698–711. Epub 2018/09/25. [DOI] [PMC free article] [PubMed] [Google Scholar]
- 54.Johnson DG, Schneider-Broussard R. Role of e2f in cell cycle control and cancer. Front Biosci. 1998;3:d447–8. Epub 1998/04/29. [DOI] [PubMed] [Google Scholar]
- 55.Filippakopoulos P, Picaud S, Mangos M, Keates T, Lambert JP, Barsyte-Lovejoy D, et al. Histone recognition and large-scale structural analysis of the human bromodomain family. Cell. 2012;149(1):214–31. Epub 2012/04/03. [DOI] [PMC free article] [PubMed] [Google Scholar]
- 56.Gillespie MA, Palii CG, Sanchez-Taltavull D, Shannon P, Longabaugh WJR, Downes DJ, et al. Absolute quantification of transcription factors reveals principles of gene regulation in erythropoiesis. Mol Cell. 2020;78(5):960–74 e11. Epub 2020/04/25. [DOI] [PMC free article] [PubMed] [Google Scholar]
- 57.Wu T, Kamikawa YF, Donohoe ME. Brd4’s bromodomains mediate histone h3 acetylation and chromatin remodeling in pluripotent cells through p300 and brg1. Cell Rep. 2018;25(7):1756–71. Epub 2018/11/15. [DOI] [PubMed] [Google Scholar]
- 58.Slaughter MJ, Shanle EK, Khan A, Chua KF, Hong T, Boxer LD, et al. Hdac inhibition results in widespread alteration of the histone acetylation landscape and brd4 targeting to gene bodies. Cell Rep. 2021;34(3):108638. Epub 2021/01/21. [DOI] [PMC free article] [PubMed] [Google Scholar]
- 59.Gryder BE, Pomella S, Sayers C, Wu XS, Song Y, Chiarella AM, et al. Histone hyperacetylation disrupts core gene regulatory architecture in rhabdomyosarcoma. Nat Genet. 2019;51(12):1714–22. Epub 2019/12/01. [DOI] [PMC free article] [PubMed] [Google Scholar]
- 60.Jung M, Kim S, Lee JK, Yoon SO, Park HS, Hong SW, et al. Clinicopathological and preclinical findings of nut carcinoma: A multicenter study. Oncologist. 2019. [DOI] [PMC free article] [PubMed] [Google Scholar]
Associated Data
This section collects any data citations, data availability statements, or supplementary materials included in this article.