

Abstract
This work explores the application of a physiologically structured population (PSP) framework in modeling hepatitis C virus (HCV) kinetics. To do so, a model was developed for the viral RNA load in plasma and liver as observed in 15 patients treated with a combination therapy of pegylated interferon, ribavirin, and telaprevir. By including both intracellular and extracellular processes of the HCV lifecycle, the model provided a description of the treatment effect on the intracellular HCV lifecycle. Combining PSP models with a nonlinear mixed effects approach in a single model permits a natural inclusion of the direct‐acting antiviral effect on intracellular processes, which can then be integrated with the viral kinetics within the host while accounting for the interindividual variability between patients. This should allow an exploration of the treatment effect within the entire chronic HCV‐infected population.
Study Highlights.
WHAT IS THE CURRENT KNOWLEDGE ON THE TOPIC?
Direct‐acting antiviral (DAA) drugs affect the intracellular reproduction of the virus. Multiscale models mechanistically describe the critical intracellular steps in the hepatitis C virus (HCV) lifecycle that are affected by DAA‐based therapy while capturing the extracellular viral kinetics and accounting for sources of between‐subject variability.
WHAT QUESTION DID THIS STUDY ADDRESS?
This study describes and quantifies the intracellular processes of the HCV replication machinery that are affected by DAA agents.
WHAT DOES THIS STUDY ADD TO OUR KNOWLEDGE?
The multiscale model provides quantification of the distribution of the viral RNA in the HCV‐infected hepatocytes following treatment with DAAs and provides a quantification of the extent and duration of the treatment effects, which is critical to select the appropriate dose, schedule, and treatment duration of new drug combinations.
HOW MIGHT THIS CHANGE DRUG DISCOVERY, DEVELOPMENT, AND/OR THERAPEUTICS?
Monotherapy with DAAs often results in the development of HCV resistance. Identifying intracellular processes affected by the drug provides insights to streamline the optimization of new drug combination therapies to achieve functional cure and avoid resistance.
INTRODUCTION
Hepatitis C virus (HCV) is a positive‐strand RNA virus of the Flaviviridae family that primarily infects hepatocytes and can lead to liver cirrhosis, hepatocellular carcinoma, liver failure, and liver failure–related death.1 Less than 50% of the patients with HCV treated with general inhibitors of viral infection, such as pegylated interferon (IFN) and ribavirin (RBV), achieved sustained virologic response (SVR), defined as the absence of detectable virus at the end of the therapy and 6 months later. Improvements in the understanding of the intracellular HCV lifecycle2 have led to the identification of new targets and the development of direct‐acting antiviral (DAA) drugs affecting the intracellular reproduction of the virus. However, DAA‐based monotherapy resulted in viral breakthroughs attributed to the development of drug resistance, but the combination of protease inhibitors, telaprevir (TVR) or boceprevir, with IFN and RBV was able to overcome resistance and yielded SVR rates of approximately 70%. Recently, IFN‐free combinations of DAA reach a SVR of >95%, with treatment durations of less than 12 weeks, thus becoming the new standard of care.
Understanding the key mechanism of action of DAA‐based therapy is essential for the development of optimal drug combinations. Previous mathematical models of HCV infection provided multiple insights into the pathogenesis and treatment effects on the virus. For instance, the estimation of the antiviral agents’ efficacy3, 4 and the lifespan of HCV‐infected cells justified the chosen treatment duration required to cure the infection.5 These modeling efforts have led to a wide range of available viral kinetics models,3, 4, 5, 6 which describe the production of uninfected (target) hepatocytes that become infected by circulating virions, which in turn produce and release new virions in the circulation. However, these models fail to consider the viral RNA replication/degradation within the infected cell. Multiscale models mechanistically describe the critical intracellular steps in the HCV lifecycle that are affected by DAA‐based therapy while describing the extracellular viral kinetics.7, 8
In a previous article,9 we introduced the potential of a physiologically structured population (PSP) model framework where tissue heterogeneity is expressed in terms of the vRNA load, assuming that (1) all cells can be characterized by their intracellular viral RNA (vRNA) load, (2) all extracellular interactions are mediated through a (well‐stirred) environment, and (3) intracellular vRNA replication in a typical cell can be described as a deterministic process. In other words, assuming each cell behaves as an independent individual within the host helps describe intracellular dynamics using a semimechanistic model, depending on changes in the environment, for instance, changes attributed to the presence of a drug. However, where the classic compartmental models will assume that the infected population of cells could be represented by a single “average cell,” PSP models capture the evolution of the entire (infected) cell population to derive the overall dynamics accounting for the fact that cells affect their environment differently depending on their internal state.
In this article, we apply the PSP model for the first time to describe the dynamics of HCV in plasma and liver following TVR/IFN/RBV administration, and we propose the intracellular vRNA in infected hepatocytes as a structure. We have used publicly available data to estimate model parameters of the nonlinear mixed effects model using MONOLIX (2018R2 Lixoft10). The model proposed justifies the need for considering an additional TVR effect on vRNA synthesis. In addition, the steady‐state distribution of HCV is determined, and its clinical implications are discussed.
METHODS
Data
The data set, digitized from the publication of Talal et al. on TVR/IFN/RBV‐based treatment effects on HCV in the liver and blood,11 consists of the concentration of vRNA in blood (about 106.5 copies/mL at baseline) and liver (copies/ng total RNA) obtained through fine‐needle aspiration. Data from 15 subjects with genotype 1 chronic HCV (cHVC) infection, for which the vRNA plasma concentrations were measured at baseline, 6 h, 10 h, day 1, day 3, and day 14 after the start of therapy in blood and at baseline, 10 h, day 3, and day 14 after the start of therapy in the liver. Patients were treated with a combination of TVR, PegIFN, and RBV, resulting in a significant drop in both blood and liver vRNA concentrations.
To evaluate the intracellular vRNA load, the data set is complemented with the data published by Kandathil et al. in their mapping of the HCV‐positive hepatocytes in human liver obtained by laser capture microdissection.12 The digitized data consist of histograms reporting cell counts for a given vRNA load per cell (IU/hepatocyte) as well as the baseline viral load. These data come from the analysis of biopsies, originating from 4 patients with genotype 1 cHCV infection. For each subject, about 120 to 290 hepatocytes expressed vRNA levels at and above a detection limit of 1 IU/hepatocytes. Only hepatocytes with vRNA >1 IU were considered infected and included in the analysis.
Multiscale vRNA model
As with the classic/standard viral kinetic model2 used to describe chronic infections, the spread of the virus within the host is modeled by describing the turnover of the target (uninfected) cells , which are infected at a rate proportional to the viral load :
| (1) |
| (2) |
where represents the zero‐order production rate of target hepatocytes; the first‐order elimination rate of target hepatocytes; the rate of contact between virions and target hepatocytes; the virion secretion at time and the elimination rate of virion.
In the classic viral kinetic models,13 this virion secretion is assumed to be proportional to the number of infected cells, . In this PSP model, however, the viral secretion is assumed to be proportional to the intracellular vRNA load , such that the total secretion can be evaluated by integration over the hepatocyte distribution function i(r, t) ([cells/copies/cell] = [cell2/copies]) corresponding to the number of cells with a given vRNA load ranging form to infinity, with the added restriction that no cell could reach such density . In general, one can define a time invariant function expressing some quantity in terms of vRNA load such that, by integration over the whole (infected) tissue, one could derive the total at any moment :
| (3) |
where or is the domain of the vRNA load, and the function is or .
Let the function be defined for infected hepatocytes as , for the intracellular vRNA content as , and for the virion secretion as , where is the first‐order vRNA secretion rate constant in an infected hepatocyte. Then the total number of infected hepatocytes (cell), the amount of intracellular vRNA (copies/cell), and the virion secretion [copies/cell/day] are:
| (4) |
| (5) |
| (6) |
The evolution of the distribution function is at the core of the PSP modeling framework.14 Assuming infected hepatocytes do not replicate and a fixed hazard rate for the death of infected hepatocytes independent of the intracellular vRNA load, the evolution of this distribution is described by the following partial differential equation (PDE):
| (7) |
where represents the vRNA dynamics of hepatocytes with a given vRNA load .
The intracellular vRNA dynamics are captured by the following model:
| (8) |
with the vRNA replication rate, the vRNA decay rate, and represents the loss of cellular vRNA as a result of the secretion of virions.
Finally, the boundary conditions are such that all newly infected hepatocytes enter the distribution through the boundary at :
| (9) |
The initial conditions of the model are derived assuming steady state before the onset of the treatment (Appendix S1):
| (10) |
where and . is the number of infected hepatocytes at steady state calculated in Appendix S2. To conclude, the effect of the therapy is introduced given the mechanisms of action of the combination of TVR, PegIFN, and RBV,15 which basically consists of disrupting the synthesis of proteins required for the formation and replication of HCV. Consequently, the effect of the therapy is assumed to inhibit both the replication and secretion rates and . Unfortunately, although it has been demonstrated that the model can naturally be extended to include the pharmacokinetics (PK) of the drugs,9 in the absence of PK data the inhibition of these rates is assumed to be constant after some lag time. Hence:
| (11) |
where represent the inhibition of virion production/secretion and the vRNA replication denoted by the shorthand and .
Macroscopic model
As the model described by (1) to (11) is linear, it can be partially solved 9 (Appendix S2) whereby the dynamics of the total number of infected hepatocytes, I, and the total amount of intracellular vRNA, R, and the virion production due secretion, P (t), be expressed as a system of ODEs at the macroscopic level:
| (12) |
| (13) |
| (14) |
| (15) |
with the initial conditions determined by the steady state:
| (16) |
Equations for T 0, I 0, and R 0 as functions of the model parameters and V 0 are provided in Appendix S2.
Data fitting
The fitting of data was performed in two steps. First, the hepatocyte vRNA distribution data were fitted allowing to obtain estimates of the two parameters rm and γ. In the next step, the observations of viral load in plasma and liver were fitted with rm and γ fixed at their estimated values from the previous step.
Fitting hepatocyte vRNA distribution
The data consisted of vRNA measurements rij in the infected hepatocytes of four patients (i = 1, …,4, j = 1,…ni ). The measurements rij were assumed to have no error. This allowed us to fit the probability density function.
| (17) |
to each patient and obtain the maximum likelihood estimates of parameters rm and γi (i = 1, …,4). The mean values of rm 1,…, rm 4 and γ 1,…, γ 4 were considered to be the estimates of rm and γ, respectively, for the patient population. The maximum likelihood estimation was performed in MONOLIX version 2018R210 using a basic time‐to‐event (TTE) model, with rij (j = 1,…ni ) interpreted as the TTE and the hazard function that can be calculated from the probability density function (Equation 17) according to the following formula16
| (18) |
Subsequently, the vRNA distribution parameters γ and rm were estimated as if vRNA measurements were the death times of the infected hepatocytes determined by the hazard of death function (Equation 18) using survival analysis techniques.16
Reparameterization and scaling
The viral load in plasma C v expressed as copies/mL was described by
| (19) |
where , denotes the patient's plasma volume, and f is the fraction of the viral load V in the plasma. The viral load in the liver C R was measured with units copies/(ng total RNA) and was modeled as
| (20) |
where s R is the conversion factor between copies/cell and copies/(ng total RNA). As is not identifiable from the available data, we introduced hybrid variables and parameters:
| (21) |
| (22) |
| (23) |
The Models (1) to (11) and output equations were rewritten in new variables. The steady‐state Equations (24) to (27) were used to evaluate some of the model parameters as follows:
| (24) |
| (25) |
| (26) |
| (27) |
The parameters and obtained from the fitting of the hepatocyte distribution were further used to calculate three more parameters from the steady‐state Equations (17) and (18).
| (28) |
where and . The parameter q expresses as a fraction of the first‐order elimination rate constant p + u representing the total elimination rate of vRNA from a hepatocyte. A set of final (primary) parameters estimated from the observed data was , c, , , q, , , and . The death rate of target hepatocytes was fixed at a value (1/day),3 matching the 150 to 200 day lifespan of healthy hepatocytes.
Fitting viral load data
The parameters , c, , , and were allowed to be lognormally distributed among patients:
| (29) |
where denotes an individual parameter value and its population mean. Since the parameters , , we assumed that they were logit distributed.
| (30) |
The viral load data11 consisted of viral load profiles in plasma and vRNA loads in the liver , where j is an index for individual measurements for the i th subject. The data were log10 transformed and the constant residual error models were used:
| (31) |
| (32) |
where , , and represent the model predicted viral load, vRNA content, target, and infected hepatocytes at the time of observation, . Moreover, and represent the residual error associated with each variable and assumed to be additive and normally distributed on the log10 scale, a technique referred to as “both sides transformation.”
The maximum likelihood estimates were obtained for the typical values and the variance of the model parameters, along with the residual variances, using the Stochastic Approximation of Expectation Maximization algorithm implemented in MONOLIX version 2018R2.10 The model performance was assessed using the goodness of fit plots and visual predictive checks.
RESULTS
The individual patient hepatocyte vRNA distribution was fitted with the probability density function given by Equation (17). The density histograms overlaid with fitted distribution curves are shown in Figure 1. The distributions are unimodal and skewed to the right, with the mode located at the lowest detectable vRNA load of 1 to 4 IU/cell. The maximum estimates of the distribution parameters γ and r m are shown in Table 1. The average γ was 9.8, and the average r m was 48.2 IU/cell with a standard deviation of 33.9 IU/cell representing between‐subject variability based on a sample of N = 4. To convert IU/cell to copies/cell, we used a relationship from Kandathil et al.12
| (33) |
FIGURE 1.

Individual patient hepatocyte vRNA distributions. The density histograms of observed vRNA concentration in a sample of hepatocytes for a patient with hepatitis C virus is overlaid with a curve representing the probability density curve for the hepatocyte vRNA distribution at steady state (Equation 17). The distribution parameters were obtained by the maximum likelihood fitting of Equation (17) to the vRNA data reported in de Roos14
TABLE 1.
Estimates of parameters for the hepatocyte vRNA distribution at steady state
| Patient | Subject 1, estimate (SE) | Subject 2, estimate (SE) | Subject 3, estimate (SE) | Subject 4, estimate (SE) | Mean (SD) |
|---|---|---|---|---|---|
| rm, IU/cell | 26.5 (2.7) | 90.7 (28.6) | 59.5(23.7) | 15.9 (4.6) | 48.2 (33.9) |
| γ | 7.7 (1.2) | 18.9 (5.3) | 10.0 (4.5) | 2.4 (1.3) | 9.8 (6.9) |
SD, standard deviation; SE, standard error.
This implies that for a typical patient with HCV, the maximum number of vRNA copies per infected hepatocyte is 94.5, which agrees with the value reported in Kandathil et al.12 The explicit Equation (17) for the probability density function of the vRNA distribution allows us to calculate its mean as
| (34) |
This implies that on average there are about 9.6 vRNA copies in an infected hepatocyte.
Graphical analysis of the plasma viral load data, shown alongside the individual fits (Figure 2), reveal a biphasic decline of HCV load in blood in most of the (n = 15) treated subjects. The early part of the plasma vRNA load profile had a median half‐life of 0.1 days with an interquartile interval of 0.08–0.12 days, whereas the terminal phase exhibited a median half‐life of 2.2 days with an interquartile interval of 1.9–2.6 days. The individual liver vRNA concentration‐time profiles for patients with HCV are shown in Figure 3. The model predicted an exponential decline for all subjects with median half‐life of 2.2 days with an interquartile interval of 2.0–2.4 days.
FIGURE 2.

Log10 transformed plasma concentrations of hepatitis C vRNA in individual patients. Symbols represent the observed data, and the lines are model‐fitted profiles using microscopic Models (1) to (11). The bars indicate the observations below the limit of quantification. Data were obtained from Canini and Perelson13
FIGURE 3.

Log10 transformed liver concentrations of hepatitis C vRNA in individual patients. Symbols represent the observed data, and the lines are model‐fitted profiles using microscopic Models (1) to (11). The bars indicate the observations below the limit of quantification. Data were obtained from Canini and Perelson13
Estimates of the microscopic model parameters are presented in Table 2. The estimates of typical values of q and were at the upper limit of the domain, and therefore were fixed at 1.0. The interindividual variability (IIV) for β was not estimable and removed from the model. The estimate of was close to 0 and subsequently fixed at this value. The relative standard errors of estimates of typical values did not exceed 14%, and for IIVs they were less than 38%. The model evaluation was performed at a population level using goodness‐of‐fit plots and visual predictive checks (Figures S1–S2), which showed that the model was able to describe the time course of the vRNA and its associated variability in HCV subjects.
TABLE 2.
Model parameters along with description, units, typical values, and IIV or source for the typical value
| Parameter | Description | Units | Typical value (RSE) | IIV/source (RSE) | |
|---|---|---|---|---|---|
|
|
Baseline concentration of vRNA in plasma | log10(copies/mL) | 6.53 (0.18) | 0.59 (0.13) | |
| c | First‐order elimination rate constant of vRNA from plasma | 1/day | 6.84 (0.95) | 0.42 (0.12) | |
|
|
First‐order elimination rate constant of infected hepatocytes | 1/day | 0.299 (0.035) | 0.31 (0.12) | |
|
|
Second‐order production rate constant of infected hepatocytes | log10([ml/copy]/day) | −7.68 (0.44) | ||
|
|
Conversion factor between copies/cell and copies/(ng total RNA) | cell/(ng total RNA) | 4.02 (0.36) | 0.69 (0.17) | |
| q | Fraction of elimination rate of vRNA from hepatocyte due to secretion to plasma | 1 | 1.0a | ||
|
|
Inhibition of vRNA secretion to plasma | 1 | 0.999 (0.00027) | ||
|
|
Inhibition of vRNA replication | 1 | 1.0a | ||
|
|
Standard deviation of the residual error for log10 transformed viral load in plasma | log10(copies/mL) | 0.403 (0.036) | ||
|
|
Standard deviation of the residual error for log10 transformed viral load in liver | log10(copies/[ng total RNA]) | 0.587 (0.077) | ||
| rm | Maximum number of vRNA copies per hepatocyte | copies/cell | 94.5 | 66.4b | |
| γ | Shape factor of hepatocyte vRNA distribution | 1 | 9.8 | 6.9b | |
| d | First‐order elimination rate constant of target hepatocytes | 1/day | 0.006a | 3 | |
| α | Zero‐order vRNA replication rate constant | (copies/cell)/day | 139a | Equation (28) | |
| p | First‐order vRNA secretion rate constant | 1/day | 0.0305a | Equation (28) | |
| μ | First‐order vRNA degradation rate constant | 1/day | 0.0a | Equation (28) | |
|
|
Total number of vRNA copies in liver at baseline | 108 copies/mL | 7.6a | Equation (24) | |
|
|
Total number of infected cells in liver at baseline | 106 cells/mL | 1.8a | Equation (25) | |
|
|
Total number of target cells in liver at baseline | 106 cells/mL | 7.6a | Equation (26) | |
|
|
Zero‐order target cells production rate constant | (106 cells/mL)/day | 0.584a | Equation (27) |
IIV, individual variability; RSE, relative standard error.
Parameter was fixed.
Standard deviation of sample, N = 4.
Three scenarios were considered to assess the impact of inhibition of vRNA secretion versus inhibition of vRNA replication on the viral load time course in plasma and liver via the model‐based simulations (Figure 4). In scenario A, both inhibitory mechanisms are in place as estimated from the available data ( and ). In scenario B, we turned off the inhibition of vRNA replication while keeping the inhibition of vRNA secretion on ( and ). In scenario C, we turned off the inhibition of vRNA secretion while keeping the inhibition of vRNA replication on ( and ). The inhibition of vRNA secretion is the dominant mechanism controlling the viral load in the plasma. Scenario C resulted in a 62% reduction of the baseline viral load (in the log10 domain) after 2 weeks of treatment, whereas scenario B resulted in a 30% reduction. When the two mechanisms are present (scenario A), a 73% reduction of the baseline viral load was observed. On the other hand, the inhibition of vRNA replication is a dominant mechanism controlling the viral load in the liver. Scenario B resulted in a 51% reduction of the baseline viral load after 2 weeks of treatment, whereas scenario C resulted in a 29% reduction. Scenario A yielded a 47% reduction of the log10‐transformed baseline viral load.
FIGURE 4.
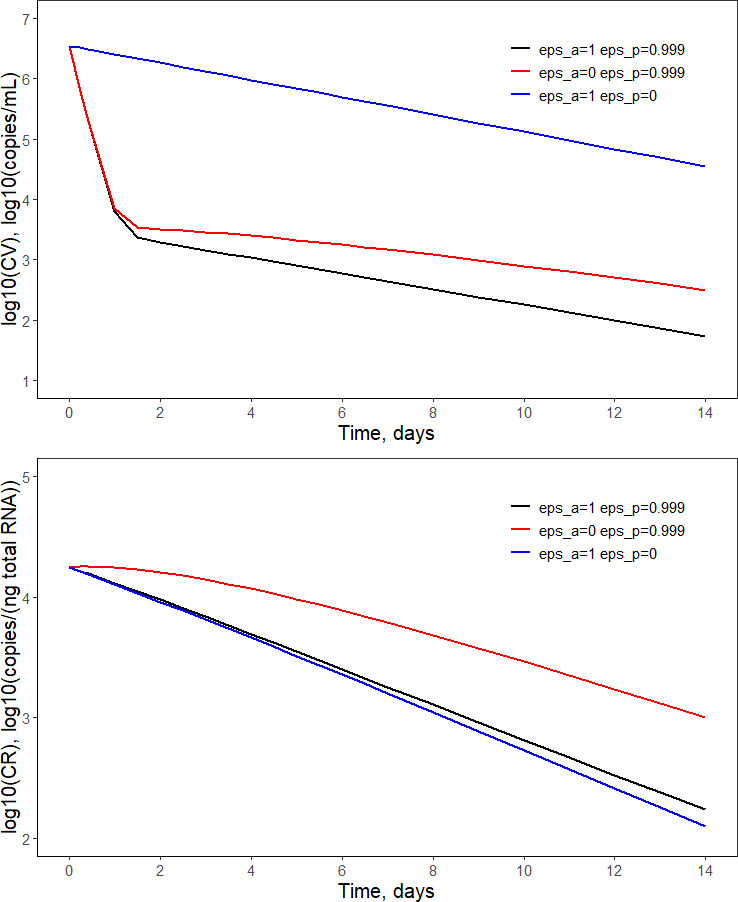
Simulations assessing the impact of inhibition of vRNA secretion versus inhibition of vRNA replication on the viral load time course in plasma (upper) and liver (lower). The values of treatment inhibition parameters and are shown in the legend. The remaining parameter values used for simulations are presented in Table 2
The i‐state model permits the evaluation of the impact of two mechanisms of action on the distribution of vRNA in a hepatocyte. Using the method of characteristics (Appendix S3), we performed simulations of the probability density function for the distribution of vRNA versus time t for the three scenarios defined previously. The results are shown in Figure 5. There is a distinct difference in vRNA distribution in the presence of inhibition of vRNA replication (scenarios A and C) and in its absence (scenario B) that is manifested by the observed peak in the latter scenario. The blockage of the vRNA replication ensures that all infected hepatocytes contain vRNA produced only before the treatment, whereas scenario B is a mixture of hepatocytes infected before treatment (old cells) and hepatocytes infected after the start of treatment (new cells). Since the vRNA in each hepatocyte increases over time and newly infected hepatocytes have a vRNA load close to 0, the vRNA distribution is divided into new hepatocytes with lower vRNA load and old hepatocytes with higher vRNA load with a boundary that coincides with the distribution mode (data not shown). The continuous increase of vRNA in time shifts the distribution to the right. A drop in the probability density function (r, t) corresponding to vRNA for new hepatocytes is caused by a rapid decrease in the number of infected hepatocytes I(t) attributed to the blockage of the virion secretion. In scenario C, the vRNA production is blocked and the number of vRNA copies in each old hepatocyte decreases to 0, causing the vRNA distribution to shift to the left with time. Since both the viral production and elimination are blocked in scenario A, there is almost no change in intracellular vRNA load, and its distribution among old hepatocytes does not differ from the steady‐state distribution over time.
FIGURE 5.

Simulations assessing the impact of inhibition of vRNA secretion vs. inhibition of vRNA replication on the distribution of vRNA in hepatocytes at various times from the beginning of treatment. The black lines correspond to and (scenario A), red lines to and (scenario B), and blue lines to to and (scenario C). The dashed line represents the steady‐state distribution. The vertical lines indicate the mean vRNA value for the corresponding distribution. The remaining parameter values used for simulations are presented in Table 2. The steady‐state distribution overlaps with the black lines
DISCUSSION
The theoretical potential of the PSP model framework to consider the tissue heterogeneity in terms of a physiological entity, such as vRNA load, has been presented previously.9 In this article, a mixed effects approach has been developed and applied to describe dynamics of HCV in plasma and liver following TVR/IFN/RBV treatment based on real data collected from patients infected with HCV. The current analysis demonstrates the value of structuring infected hepatocytes in terms of their vRNA load. As the approach uses an explicit, compartmental, (sub‐)model to describe dynamics of the intracellular state variable associated with the model structure, the approach permits to naturally account for drug effects driven by (time varying) compound concentration in the infected tissue. By extension, the model could also be used to introduce more complex PK/PD9 models to describe viral load in treated subjects. Although PK has not been explored here because of the lack of available data, incorporating the PK component will be critical to use the PSP model framework for dose and schedule selections during the development of new drugs or drug combinations in the target population.
Multiscale models mechanistically describe the critical intracellular steps in the HCV lifecycle that are affected by DAA‐based therapy while capturing the extracellular viral kinetics. An age‐structured model of HCV has been previously introduced where the underlying structure is the time from infection.7, 8 It proved to properly describe the time course of viral declines in patients on IFN, daclatasvir, and TVR and has helped decipher the mode of action and the antiviral effectiveness of these drugs in blocking intracellular vRNA production and virion assembly/secretion in vivo. Our vRNA‐structured population model is similar in formalism to the age‐structured model of HCV. More information about the differences between these two approaches can be found in Woot de Trixhe et al.9
The flexibility of the PSP model allowed the incorporation of data from multiple sources under a common mechanism‐based framework. The current analysis was able to pool data from laser micro‐dissection to determine the shape of the distribution of vRNA copies per infected cell along with clinical data on the viral dynamics observed in patients. Unfortunately, these data were from two different sources with only common baseline distributions, which does not allow for firm conclusions; however, these data allow us to show the added value of the proposed methodology to integrate data at microscopic and macroscopic levels. The estimate of the mean vRNA copies per infected hepatocyte (9.6), with a maximum range of 94.5 copies per hepatocyte, is consistent with the values reported in Kandathil et al.,12 but falls below the range observed in in vitro studies of 250–5000 (copies/cell) as reported in Lohmann et al.17, 18 and Quinkert et al.17, 18 These numbers need to be interpreted with caution given the small sample of patients with HCV enrolled in the study from which the data were obtained.12
A new mechanism of drug action was added to our previous model.9 In fact, in addition to the intracellular degradation rate μ, TVR/IFN/RBV inhibited the elimination rate of vRNA from an infected hepatocyte due to the secretion of virions to the plasma p, and both parameters were estimated from the observed data. The model strongly favored the drug effect on p over μ rendering the effect on μ negligible. This can be interpreted that the dominant mechanism of vRNA removal from a hepatocyte is formation of virions rather than degradation, however, further studies are necessary to confirm this conclusion. The insignificance of μ predicted by our model might be an artifact of the overly simplified linear model for the turnover of vRNA in infected hepatocytes. Another factor contributing to our conclusion is the lack of a third slower phase in the viral kinetic profile in most of subjects in our data set that is informative about μ.9
The utility of the multiscale models lies in their ability to explain macroscopic observations based on microscopic (intracellular) mechanisms. We were able to estimate the efficacies of the TVR/IFN/RBV treatment on the inhibition of vRNA replication and secretion and subsequently on the viral load in plasma and liver and , respectively. Because of the linearity assumption of the vRNA turnover in hepatocytes, both parameters were at or almost at 100% inhibition. An implementation of a more realistic nonlinear model for the vRNA turnover would result in the macroscopic model to be a system of integral‐differential equations that is not solvable by currently available pharmacometric software. We tested through simulations the impact of and on the viral load in plasma and the liver. Although the dominant mechanism controlling the TVR/IFN/RBV effect in plasma is the inhibition of the virion secretion, the viral load in the liver is more affected by the inhibition of vRNA replication. The inhibition of vRNA secretion can be attributed to the TVR effect alone.5 Our model tested the impact of and on the intracellular vRNA level in hepatocytes. We observed that if the replication of vRNA is not completely blocked, the distribution of vRNA among infected hepatocytes significantly differs from the steady‐state distribution. While at steady state the mode is determined by hepatocytes with low vRNA levels, an inhibition of virion release alone results in a peak in vRNA distribution with a mode increasing with time. Interestingly, we observed that TVR/IFN/RBV treatment did not change the average vRNA content per hepatocyte that remained at the steady‐state level during the duration of the study.
Despite the limitations of the available data, the model (1) described the vRNA load in blood and liver as well as its intracellular distribution, (2) included secretion of virions as a mechanism of elimination of vRNA from hepatocytes, (3) indicated that inhibition of the virion secretion has a much stronger effect on the viral load in plasma than the inhibition of vRNA replication, and (4) combined multiple sources of data to investigate the density distribution of infected hepatocytes with respect to their vRNA content.
To conclude, although the model used for this analysis could rely on the linearity of the turnover model used to represent the intracellular vRNA replication and to derive a macroscopic equivalent model expressed as system of ODEs, it should be obvious that intracellular viral replication is much more complex than the proposed model. The simplified turnover model, which is sufficient to describe the heterogeneity of the HCV‐infected tissue, should be seen as first‐order Taylor approximation of the underlying physiological processes. This also implies that the intracellular model should not be seen as describing any specific cell but, rather, the behavior of a “typical” cell where fractional vRNA loads, which might seem biologically implausible especially below 1 copy per cell, are allowed to account for the fact that no (deterministic) model could ever be capable of fully describing the complete (stochastic) nature of each and every cell, let alone fully characterize each and every cell within each and every patient in a study. Similarly, the PSP framework allows much more complex intracellular models, for example, one could consider letting the cellular mortality depend on the intracellular vRNA load to capture the effect of the viral infection on the lifespan of a cell. Moreover, allowing a state‐dependent mortality would also improve granularity in the immune response, which could become dependent on the state of the infection in individual cells and allow for vertical (parent to child) transmission of the infection due to the division of infected cells. Such model improvements should, however, result in quantifiable changes at the macroscopic level to confirm—or refute—the hypothesis that the added complexity leads to more accurate predictions of the disease progression. In other words, although more precise descriptions of the (patho‐)physiology of viral infections could be formulated using structured population models that could be solved numerically to gain insights in the model behavior through simulation, it is unclear if and how the associated PDEs would translate to macroscopic models with predictable modes of action by which the drug effect can be accurately characterized.
CONFLICT OF INTEREST
Authors X.W., A.V., and J.J.P.‐R. were employees and shareholders of Janssen Pharmaceutical Companies at the time this analysis was conducted. W.K. declared no competing interests for this work.
AUTHOR CONTRIBUTIONS
X.W., W.K., A.V., and J.J.P.‐R. wrote the manuscript. X.W. designed the research. X.W. and W.K. performed the research. X.W. and W.K. analyzed the data.
Supporting information
Appendix S1
Appendix S2
Appendix S3
FigureS1‐S2
Funding information
No funding was received for this work.
REFERENCES
- 1.Lauer G, Walker B. Hepatitis C Virus Infection. N Engl J Med. 2001;345:41‐52. 10.1056/NEJM200107053450107. [DOI] [PubMed] [Google Scholar]
- 2.Pawlotsky J, Chevaliez S, McHutchison J. The Hepatitis C virus life cycle as a target for new antiviral therapies. Gastroenterology. 2007;132:1979‐1998. 10.1053/j.gastro.2007.03.116. [DOI] [PubMed] [Google Scholar]
- 3.Snoeck E, Chanu P, Lavielle M, et al. A comprehensive hepatitis C viral kinetic model explaining cure. Clin Pharmacol Ther. 2010;87(6):706‐713. 10.1038/clpt.2010.35. [DOI] [PubMed] [Google Scholar]
- 4.Neumann A, Lam N, Dahari H, et al. Hepatitis C viral dynamics in vivo and the antiviral efficacy of interferon‐alpha therapy. Science. 1998;282:103‐110. 10.1126/science.282.5386.103. [DOI] [PubMed] [Google Scholar]
- 5.Guedj J, Perelson A. Second phase HCV RNA decline during telaprevir based therapy increases with drug effectiveness: implications for treatment duration. Hepatology. 2011;6:1801‐1808. 10.1002/hep.24272. [DOI] [PMC free article] [PubMed] [Google Scholar]
- 6.Reluga T, Dahari H, Perelson A. Analysis of Hepatitis C virus infection models with hepatocyte homeostasis. SIAM J Appl Math. 2009;4:999‐1023. 10.1137/080714579. [DOI] [PMC free article] [PubMed] [Google Scholar]
- 7.Guedj J, Dahari H, Rong L, et al. Modeling shows that the NS5A inhibitor daclatasvir has two modes of action and yields a shorter estimate of the Hepatitis C virus half‐life. Proc Natl Acad Sci USA. 2013;110:3991‐3996. 10.1073/pnas.1203110110. [DOI] [PMC free article] [PubMed] [Google Scholar]
- 8.Rong L, Perelson A. Mathematical analysis of multiscale models for hepatitis C virus dynamics under therapy with direct‐acting antiviral agents. Math Biosci. 2013;245:22‐30. 10.1016/j.mbs.2013.04.012. [DOI] [PMC free article] [PubMed] [Google Scholar]
- 9.Woot de Trixhe X, Krzyzanski W, De Ridder F, Vermeulen A. vRNA Structured population model for hepatitis C virus”. J Theor Biol. 2015;378:1‐11. 10.1016/j.jtbi.2015.04.017. [DOI] [PubMed] [Google Scholar]
- 10.Lixoft . Monolix version 2018 R2. Antony, France: Lixoft; 2016. [Google Scholar]
- 11.Talal H, Dimova R, Zhang E, et al. Telaprevir‐based treatment effects on hepatitis C virus in liver and blood. Hepatology. 2014;60:1826‐1837. 10.1002/hep.27202. [DOI] [PMC free article] [PubMed] [Google Scholar]
- 12.Kandathil A, Graw F, Quinn J, et al. Use of laser capture microdissection to map hepatitis C virus‐positive hepatocytes in human liver. Gastroenterology. 2013;145(6):1404‐1413. 10.1053/j.gastro.2013.08.034. [DOI] [PMC free article] [PubMed] [Google Scholar]
- 13.Canini L, Perelson AS. Viral kinetic modeling: state of the art. J Pharmacokinet Pharmacodyn. 2014;41:431‐444. 10.1007/s10928-014-9363-3. [DOI] [PMC free article] [PubMed] [Google Scholar]
- 14.de Roos A. A gentle introduction to physiologically structured population models, structured‐population models in marine, terrestrial, and fresh water systems. In: Tuljapurkar S, Caswell H eds. Structured‐Population Models in Marine, Terrestrial, and Freshwater Systems. Boston, MA: Springer; 1997:119–204.Population and Community Biology Series; vol 18. [Google Scholar]
- 15.Feld JJ, Hoofnagle JH. Mechanism of action of interferon and ribavirin in treatment of hepatitis C. Nature. 2005;436:967‐972. 10.1038/nature04082. [DOI] [PubMed] [Google Scholar]
- 16.Collett D. Modeling Survival Data in Medical Research. 3rd ed. Boca Raton, FL: CRC Press; 2015. [Google Scholar]
- 17.Lohmann V, Kohrner F, Koch J‐O, Herian U, Theilmann L, Bartenschlage R. Replication of subgenomic hepatitis C virus RNAs in a hepatoma cell line. Science. 1999;285(5424):110‐113. 10.1126/science.285.5424.110. [DOI] [PubMed] [Google Scholar]
- 18.Quinkert D, Bartenschlager R, Lohmann V. Quantitative analysis of the hepatitis C virus replication complex. J Virol. 2005;79(21):13594‐13605. 10.1128/JVI.79.21.13594-13605.2005. [DOI] [PMC free article] [PubMed] [Google Scholar]
Associated Data
This section collects any data citations, data availability statements, or supplementary materials included in this article.
Supplementary Materials
Appendix S1
Appendix S2
Appendix S3
FigureS1‐S2