

Abstract
Ciguatoxins (CTX) are potent marine neurotoxins, which can bioaccumulate in seafood, causing a severe and prevalent human illness known as ciguatera poisoning (CP). Despite the worldwide impact of ciguatera, effective disease management is hindered by a lack of knowledge regarding the movement and biotransformation of CTX congeners in marine food webs, particularly in the Caribbean and Western Atlantic. In this study we investigated the hepatic biotransformation of C-CTX across several fish and mammalian species through a series of in vitro metabolism assays focused on phase I (CYP P450; functionalization) and phase II (UGT; conjugation) reactions. Using liquid chromatography high-resolution mass spectrometry to explore potential C-CTX metabolites, we observed two glucuronide products of C-CTX-1/-2 and provided additional evidence from high-resolution tandem mass spectrometry to support their identification. Chemical reduction experiments confirmed that the metabolites were comprised of four distinct glucuronide products with the sugar attached at two separate sites on C-CTX-1/-2 and excluded the C-56 hydroxyl group as the conjugation site.Glucuronidation is a novel biotransformation pathway not yet reported for CTX or other related polyether phycotoxins, yet its occurrence across all fish species tested suggests that it could be a prevalent and important detoxification mechanism in marine organisms. The absence of glucuronidation observed in this study for both rat and human microsomes suggests that alternate biotransformation pathways may be dominant in higher vertebrates.
Graphical Abstract

INTRODUCTION
Ciguatoxins (CTX) are potent marine neurotoxins which can bioaccumulate in seafood and cause ciguatera poisoning (CP), a leading cause of seafood-borne illness throughout the world.1 CTX congeners have been traditionally grouped into suites based on region of first characterization, i.e., Pacific and Caribbean CTX (P-CTX and C-CTX, respectively). While these regional classifications have been recently revised given the connectivity of the world’s oceans and prevalence of source organisms across the globe,1 congeners reported in the Caribbean are differentiated from their Pacific counterparts by the presence of an extra terminal N-ring on the molecule tail and the absence of an A-ring side chain, characteristic of CTX-4A and its analogs.2-4 Precursors of CTX have been reported to be produced by harmful algae in the genera Gambierdiscus and Fukuyoa, and these toxins are subsequently transferred through marine food webs, undergoing biotransformation that results in the production of structurally and toxicologically related CTX metabolites.5,6 However, despite the importance of biotransformation for CTX ecotoxicology, pathways of CTX metabolism remain poorly understood, and for C-CTX, which have been less intensively studied than CTXs isolated from the Pacific, they are entirely unknown. Identifying CTX metabolism pathways and products is critical to predicting the fate and toxicity of CTX in seafood species and in evaluating human exposure risks, both of which are key to the effective management of CP.
Biotransformation plays a major role in the conversion and elimination of toxic xenobiotic compounds, generally increasing the polarity of lipophilic compounds to facilitate their urinary or biliary excretion.7 Phase I biotransformation involves functionalization reactions (e.g., oxidation, reduction, and hydrolysis) that expose or introduce reactive functional groups,8 while phase II reactions involve the attachment of polar endogenous compounds to suitable functional groups via conjugative enzymes, including sulfotransferases, glutathione S-transferases (GST), and UDP-glucuronosyltransferases (UGT).9 Of the enzymes responsible for phase I and phase II reactions, the cytochrome P450 (CYP) monooxygenases and UGT enzymes are responsible for the clearance of the vast majority of marketed pharmaceuticals and play a predominant role in xenobiotic metabolism.10-12 Importantly, the structural modifications imparted during biotransformation reactions may substantially alter the physicochemical and toxicological properties of a compound and thus determine in vivo concentrations and effectivity. Therefore, characterizing biotransformation pathways of xenobiotics is a central focus in ecotoxicology, allowing researchers to predict the environmental fate of potentially harmful compounds and understand the nature and severity of toxicological responses following exposure.13,14
Although it has long been hypothesized that algal produced CTX derivatives undergo metabolic transformation after uptake in fish, there has been limited evidence in the literature to support this to date. Gambierdiscus strains isolated in the Pacific have been reported to synthesize a suite of CTX congeners, including CTX-3C and CTX-4A/B, as well as several M-seco analogs.2,3,15,16 These algal metabolites are taken up by consumers like fish and invertebrates, and presumably metabolized to give the more oxidized CTX-1B, 52-epi-54-deoxyCTX-1B (formerly P-CTX-2), and 54-deoxyCTX-1B (formerly P-CTX-3) analogs.2,5,17-20 Yet the metabolic enzymes that are responsible for producing these metabolites have not been clearly identified. Transcriptomic studies in mice exposed to CTX-1B showed significant upregulation of genes transcribing both phase I (CYP) and phase II (UGT and GST) enzymes, and indicated that CYPs likely play a crucial role in the toxicological response.21,22 However, direct evidence of CTX biotransformation in fish has been limited to only one previous study to date. Using hepatic fractions (microsomes and S9) of five relevant Pacific fish species (Lutjanus and Oplegnathus spp.), Ikehara et al. showed in vitro metabolism of algal CTX precursors resulting in the production of the oxidized analogs found in wild-caught fish, and additional experiments with recombinant human CYP3A4 led to comparable results.6 This provided the first confirmation that algal CTXs are subject to phase I metabolism and indicated that interspecific differences in metabolic pathways may help to explain variable CTX profiles observed across different Pacific fish species.5,20 Despite transcriptomic evidence that phase II (UGT and GST) biotransformation pathways are induced by CTX exposure, the role of conjugative enzymes in CTX metabolism has not yet been investigated, leaving a gap in our understanding of CTX biotransformation and elimination pathways.
Compared with CTX-1B and related congeners, data on the food web distribution and piscine biotransformation of C-CTX remains undescribed, largely due to the limited knowledge on algal C-CTX congeners or their metabolites. To date, only four C-CTX derivatives have been determined which include the chromatographically indistinguishable epimers C-CTX-1 and −2, and their C-56 reduced analogs, C-CTX-3 and −4, respectively4,23,24 (Scheme 1). So far, these congeners have been found only in fish, while their algal precursors or biotransformation products are yet to be determined, making it difficult to establish metabolic pathways for CTX in Caribbean food webs. Moreover, research into the biotransformation, toxicology, or transcriptomic responses of C-CTX has been hindered by the lack of commercial standards and reference materials compared to those made available for Pacific CTX congeners through chemical synthesis25-27 or isolation from natural sources. 15 It is worth noting that, although C-CTX congeners have been predominantly studied in Caribbean ecosystems, C-CTX-1/-2 are also the main toxic constituents in ciguateric biota in eastern Atlantic regions.28-30 Therefore, determining C-CTX biotransformation pathways is critical to understand connected ecotoxicological effects across geographical regions. Identification of C-CTX metabolites in fish may improve the detection of these compounds in contaminated organisms and aid in studies of the distribution and fate of C-CTX throughout marine ecosystems.
Scheme 1. Molecular Structure of the Caribbean CTX Epimers C-CTX-1 and C-CTX-2 and Their C-56 Reduced Congeners C-CTX-3 and C-CTX-4a.
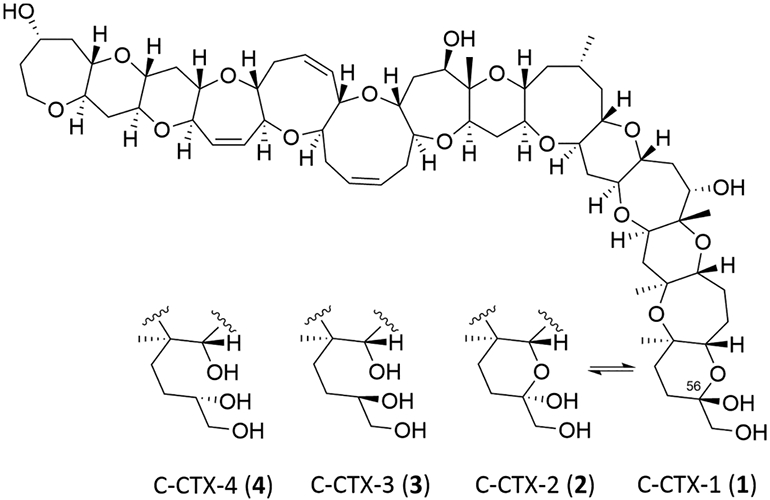
aAdapted from Kryuchkov et al. 2020.24
In this study, we aimed to elucidate biotransformation products of C-CTX-1/-2 in liver microsomes prepared from a variety of reef fish collected from the northern Gulf of Mexico, where emergence of CP has been documented.31,32 Prior to their use in C-CTX metabolism assays, the microsomes were characterized with respect to major CYP and UGT enzyme activities using specific probe substrates, which were analyzed by high-performance liquid-chromatography coupled with triple quadrupole mass spectrometry (HPLC-TQMS). Subsequently, the in vitro metabolism of C-CTX-1/-2 was studied with a reference material prepared in-house by semipurification from ciguateric fish.23,24 The metabolism of C-CTX was also evaluated in liver microsomes from Atlantic salmon, rat, and human to explore characteristics of C-CTX metabolic pathways across taxa. To augment these studies and allow unambiguous detection of C-CTX-1/-2 and potential metabolites, ultrahigh-performance liquid-chromatography high-resolution mass spectrometry (UHPLC-HRMS) was employed.
EXPERIMENTAL PROCEDURES
Materials and Reagents.
Optima LC-MS grade acetonitrile (MeCN), methanol (MeOH), n-hexane, and water were obtained from Thermo Fisher Scientific (Waltham, MA, USA); dichloromethane (DCM) was purchased from Honeywell (Charlotte, NC, U.S.A.); and formic acid (>98%) was purchased from Merck (Darmstadt, Germany). Potassium phosphate (KH2PO4) and potassium hydrogen phosphate trihydrate (K2HPO4·3H2O), used in the preparation of hepatic microsomes from fish and in vitro metabolism experiments, were purchased from Merck (Darmstadt, Germany). Sodium borohydride (≥99.8%, NaBH4), phenyl-β-glucuronide (≥99%), and acetic acid (pro analysis grade) were from Sigma-Aldrich (St. Louis, MO, U.S.A.). Glucuronic acid conjugates of deoxynivalenol (DON; DON-3β-GlcA and DON-15-β-GlcA) were available from earlier work.33
Reagents used for in vitro metabolism experiments including β-nicotinamide adenine dinucleotide 2′-phosphate reduced tetrasodium salt hydrate (NADPH), β-nicotinamide adenine dinucleotide phosphate sodium salt hydrate (NADP+), HEPES sodium salt, d-glucose 6-phosphase sodium salt, d-glucose 6-phosphate dehydrogenase from baker’s yeast (Saccharomyces cerevisiae), uridine 5′-diphosphoglucuronic acid trisodium salt (UDPGA), uridine 5′-diphospho-N-acetylglucosamine sodium salt (UDPAG), MgSO4, and CaCl2 were purchased from Sigma-Aldrich (St. Louis, MO, U.S.A.). Magnesium chloride hexahydrate (MgCl2·6H2O) was obtained from Honeywell Fluka (Bucharest, Romania). UDP-glucuronosyltransferase (UGT) Reaction Solution B containing 250 mM Tris·HCl, 40 mM MgCl2, and 0.125 mg/mL alamethicin in water was supplied by BD Biosciences (Woburn, MA, U.S.A.). Sodium chloride (NaCl) and potassium chloride (KCl) were purchased from Merck. For the enzymatic deconjugation experiments, β-glucuronidase derived from both Roman snail (Helix pomatia) and bacteria (Escherichia coli; type IX A) were obtained from Sigma-Aldrich. Phosphate-buffered saline (PBS, pH 7.3, 170 mM) was prepared from ready-to-use tablets (Oxoid, Hampshire, U.K.).
Enzyme activities of specific CYP and UGT were characterized in prepared fish microsomes using specific probe substrates and their respective metabolites, which are detailed in Table 1. Compounds used for the characterization of CYP included phenacetin (PCN), acetaminophen (ACP), tolbutamide (TB), 4-hydroxytolbutamide (4-OH-TB), chlorzoxazone (CH), 6-hydroxychlorzoxazone (6-OH−CH), dextromethorphan (DEX), dextrophan (DOR), midazolam (MDZ), and 4-hydroxymidazolam (4-OH-MDZ), which were purchased from Sigma-Aldrich. Compounds used for the characterization of UGT included β-estradiol (E2), β-estradiol 17-β-d-glucuronide sodium salt (E2-GlcA), N-acetyl serotonin (NAS), naloxone (NLX), naloxone-3β-d-glucuronide solution (NLX-GlcA), mycophenolic acid (MA), mycophenolic acid-β-d-glucuronide (MA-GlcA), trifluoperazine dihydrochloride (TFP), and trifluoperazine N-β-d-glucuronide (TFP-GlcA), which were also purchased from Sigma-Aldrich. N-Acetyl serotonin β-d-glucuronide (NAS-GlcA) was obtained from Santa Cruz Biotechnology (Dallas, TX, U.S.A.). Substrate stock solutions were prepared in 100% MeOH, except for MA-GlcA and NLX-GlcA, which were dissolved in MeCN and MeOH:H2O (9:1, v/v), respectively.
Table 1.
Probe Substrates and Respective Metabolites Used to Characterize the Activities of Major CYP and UGT Enzymes in Northern Gulf of Mexico Fish Microsomes
| enzyme | probe substrate | metabolite |
|---|---|---|
| CYP (phase I) | ||
| CYP1A2 | phenacetin (PCN) | acetaminophen (ACP) |
| CYP2C9 | tolbutamide (TB) | 4-hydroxytolbutamide (4-OH-TB) |
| CYP2D6 | dextromethorphan (DEX) | dextrophan (DOR) |
| CYP2E1 | chlorzoxazone (CH) | 6-hydroxychlorzoxazone (6-OH-CH) |
| CYP3A4 | midazolam (MDZ) | 4-hydroxymidazolam (4-OH-MDZ) |
| UGT (phase II) | ||
| UGT1A1 | β-estradiol (E2) | β-estradiol 17-β-d-glucuronide (E2-GlcA) |
| UGT1A4 | trifluoperazine dihydrochloride (TFP) | trifluoperazine N-β-d-glucuronide (TFP-GlcA) |
| UGT1A6 | N-acetylserotonin (NAS) | N-acetyl serotonin β-d-glucuronide (NAS-GlcA) |
| UGT1A9 | mycophenolic acid (MA) | mycophenolic acid-β-d-glucuronide (MA-GlcA) |
| UGT2B7 | naloxone (NLX) | naloxone-3β-d-glucuronide (NLX-GlcA) |
A stock of semipurified C-CTX-1/-2 and C-CTX-3/-4 equilibrating isomers was prepared in-house from pooled muscle tissue of ciguateric Great barracuda (Sphyraena barracuda) collected from coastal waters near St. Thomas, United States Virgin Islands, using extraction and purification methods modified from those described by Vernoux and Lewis.23 While the purity and concentration of the C-CTX-1/-2 stock (dissolved in 80% or 50% aq. MeOH for CYP and UGT metabolism experiments, respectively) is not yet determined due to available quantities, the same volume of the substrate solution was used in microsomal incubation and analyses to ensure comparability across assays and give sufficient LC-HRMS signal intensity (upper 105 range).
Microsomal Sources.
In this study, we used commercially available liver microsomes from humans (Homo sapiens) and Wistar rats (Rattus norvegicus) as well as microsomes prepared in-house from Atlantic salmon (Salmo salar) and several species of northern Gulf of Mexico fish: Red snapper (Lutjanus campechanus), Gray snapper (Lutjanus griseus), Red lionfish (Pterois volitans), Emerald parrotfish (Nicholsina usta), and Sheepshead (Archosargus probatocephalus). The human liver microsomes (HLM) were obtained from a commercial supplier (Bioreclamation IVT, Westbury, NY, U.S.A.) and consisted of a mixed gender pool of 50 donors (No. X008067, Lots SBM, YAO, and IHG). Male Wistar rat liver microsomes (RLM) were obtained from Celsis In Vitro Technologies (Baltimore, MD, U.S.A.) and had been prepared from a pool of 30 animals (No. M00021, Lot NDR). The total protein concentrations, total CYP contents, and activities of specific CYP and UGT enzymes were provided by the manufacturers. Northern Gulf of Mexico fish liver microsomes were prepared in-house from collected specimens and characterized according to the methods described below. Liver microsomes from Atlantic salmon (SLM) had been previously prepared and characterized as reported by Johny et al.34 and made available for use during this study. All liver microsome preparations were stored in liquid N2 or at −80 °C until use in incubations.
Collection of Northern Gulf of Mexico Fish Specimens.
Fish specimens representing several taxonomic groups and trophic levels were obtained during late 2019 from northern Gulf of Mexico collection sites to allow cross-species comparison of C-CTX biotransformation. Fish collection methods varied depending on the species. Red snapper were caught by longlining on November 16th, 2019 from artificial reef structures located approximately 30 km offshore of Biloxi, MS, U.S.A., while Gray snapper were collected by divers on SCUBA on October 27th, 2019 from natural gas platforms located about 15 km offshore from Gulf Shores, AL, U.S.A. Both snapper species were collected under federal collection permit F/SER24:RM and were euthanized on board the collection vessels according to IACUC protocol 1562086. Red lionfish were collected from artificial reef structures by recreational sport fisherman on SCUBA on November 17th, 2019 and sampled by researchers immediately upon harvest. Emerald parrotfish were collected from St. Andrew Bay, FL, U.S.A. on October 17th, 2019 using shallow seagrass trawls under Florida Special Activities License SAL-18-1230-SR and euthanized according to IACUC protocol 1384468. Sheepshead were captured live on hook-and-line from Mobile Bay, AL, U.S.A. and Mississippi Sound, U.S.A., and were donated by researchers at the Dauphin Island Sea Lab (DISL, Dauphin Island, AL, U.S.A.) after temporary holding at the DISL wet-lab facility followed by euthanasia, performed according to IACUC protocols 1442738 and 1380906. Immediately following euthanasia of the fish, livers were dissected and flash-frozen in liquid N2. All livers were stored at −80 °C until microsome preparation.
Preparation of Hepatic Microsomes from Northern Gulf of Mexico Fish.
Hepatic microsomes were prepared as described by Ivanova et al.35 All preparation steps were carried out on ice, unless otherwise stated. Frozen liver tissue was added to about 5 volumes (v/w) of ice-cold preparation buffer (0.1 M K PO4, adjusted to pH 7.5) and manually homogenized in a Potter-Elvehjem tissue grinder (Sigma-Aldrich). Homogenates were separated using a series of centrifugation steps carried out at 16 000g for 30 min to remove nuclear and cellular debris, and then at 100 000g for 1 h to isolate microsomal fractions. Ultracentrifugation steps were conducted using a swing-out rotor SW41Ti ultracentrifuge (Beckman Instruments, Palo Alto, CA, USA) maintained at 4 °C. The microsomal particulate fractions were resolubilized in preparation buffer, aliquoted into single-use volumes, and stored at −80 °C until use in metabolism assays. Triplicate measures of total microsomal protein concentrations were taken from one single-use aliquot for each batch of microsomes prepared according to the method by Lowry et al.36 (Bio-Rad, DC Protein Kit, Hercules, CA, U.S.A.).
Characterization of Major CYP Activities in Northern Gulf of Mexico Fish Microsomes.
Prepared microsomes were characterized with respect to CYP activities using the probe substrates PCN (CYP1A2), TB (CYP2C9), DEX (CYP2D6), CH (CYP2E1), and MDZ (CYP3A4), as previously described.34 The reaction mixture included the following components: NADPH regeneration system (0.91 mM NADPH, 0.83 mM NADP+, 19.4 mM glucose 6-phosphate, 9 mM MgCl2·6H2O dissolved in 0.05 M HEPES buffer, adjusted to pH 7.4), 1 U mL−1 glucose-6-phosphate dehydrogenase, and 2 mg mL−1 microsomal protein adjusted to a total volume of 1.0 mL. The reaction mixture was preincubated with all components for 2 min in a shaking water bath maintained at the set incubation temperature. Following preincubation, reactions were initiated by the addition of 3.5 μL of a combined probe substrate solution containing 715 μM PCN, 710 μM TB, 715 μM DEX, 1444 μM CH, and 2824 μM MDZ (dissolved in 100% MeOH). After dilution in the assay, this dose resulted in start concentrations of 2.5 μM (PCN, TB, and DEX), 5 μM CH, and 10 μM MDZ. Samples were capped and incubated for 1 h in the shaking water bath. Aliquots (140 μL) were withdrawn after 0, 5, 10, 15, 30, and 60 min, and immediately added to equal volumes of ice cold 100% MeCN to terminate the reactions. Samples were kept on ice until centrifugation at 20 000g for 10 min at 4 °C to precipitate proteins, after which the supernatant was transferred to a 0.22 μm nylon Costar Spin-X filter (Corning Life Sciences, Corning, NY, U.S.A.) and centrifuged at 20 000g for 1 min at 4 °C. The filtrate was collected in 300 μL fixed insert HPLC vials (Thermo Fisher Scientific) and stored at −20 °C until analysis by HPLC-TQMS.
Preliminary incubations with CYP probe substrates were performed using L. campechanus (RSN1) microsomes to determine optimal temperatures for fish metabolism experiments, seeking to constrain incubation temperatures within an environmentally relevant range. Long-term data obtained near coastal Alabama indicate that water temperatures in excess of 25 °C occur only for short periods during the summer months and are generally restricted to surface waters above 20 m depth.37 Therefore, exploratory runs were conducted at 17, 20, and 25 °C, after which subsequent incubations with northern Gulf of Mexico fish microsomes were set to 25 °C (acknowledging the possibility that untested higher temperatures may result in increased metabolism rates). All temperature optimization and CYP characterization incubations were performed in duplicate.
Characterization of Major UGT Activities in Northern Gulf of Mexico Fish Microsomes.
The glucuronidation capacities of prepared microsomes were characterized using the probe substrates E2 (UGT1A1), TFP (UGT1A4), NAS (UGT1A6), MA (UGT1A9), and NLX (UGT2B7), as previously described.34 The reaction mixture included the following components: 7.4 mM UDPGA, 0.3 mM UDPAG, reaction solution B (1:5, v/v), and 2 mg mL−1 microsomal protein adjusted to a total volume of 0.5 mL. The reaction mixture was preincubated for 2 min in a shaking water bath maintained at 25 °C based on the temperature optimization performed during the CYP characterization experiments. Following preincubation, reactions were initiated by the addition of 3 μL of combined substrate solution containing 250 μM E2, 83 μM TFP, 250 μM NAS, 83 μM MA, and 167 μM NLX (dissolved in 100% MeOH). After dilution in the assay, this resulted in start concentrations of 1.5 μM (E2, NAS), 0.5 μM TFP, 0.2 μM MA, and 1 μM NLX. Samples were capped and incubated for 1 h in the shaking water bath. Aliquots (70 μL) were withdrawn after 0, 5, 10, 15, 30, and 60 min, and prepared for HPLC-TQMS analysis as described above. Incubations were performed in duplicate.
Phase I (CYP-Catalyzed) Metabolism of C-CTX-1/-2.
Phase I (CYP) metabolism of C-CTX-1/-2 was investigated in HLM and L. campechanus (RSN1) microsomes, following the same assay format described above for the characterization of fish microsomal CYP enzyme activities. The reaction mixtures were adjusted to a final volume of 0.5 mL to conserve C-CTX-1/-2 reference material. Incubations were performed in a shaking water bath maintained at 37 or 25 °C for experiments with HLM or RSN1 microsomes, respectively. Following preincubation, reactions were initiated by addition of 1.75 μL C-CTX-1/-2 stock solution (dissolved in 80% aq. MeOH, v/v). Samples were capped and incubated in a shaking water bath for 1 h, during which time aliquots (70 μL) were withdrawn after 0, 5, 10, 15, 30, and 60 min and prepared as described above for analysis by UHPLC-HRMS. The incubations for each of the two species were performed in duplicate.
Phase II (UGT-Catalyzed) Metabolism of C-CTX-1/-2.
Phase II (UGT) metabolism of C-CTX-1/-2 was investigated using the same assay format described for the characterization of fish microsomal UGT enzyme activities. Preliminary experiments were conducted using HLM and RSN1 microsomes to monitor the production of UGT metabolites over time. The reaction mixture was preincubated in a shaking water bath maintained at 37 °C (HLM) or 25 °C (RSN1). Reactions were initiated by addition of 5 μL of C-CTX-1/-2 stock solution (dissolved in 50% aq. MeOH, v/v). Samples were capped and incubated for 1 h, during which aliquots (70 μL) were withdrawn at 0, 5, 10, 15, 30, and 60 min and prepared for analysis as described for the activity characterization experiments. Single replicate incubations were performed for each species. An additional single replicate incubation was performed with RSN1 microsomes using 1.5 μL of C-CTX-1/-2 stock solution (dissolved in 50% aq. MeOH, v/v) to test the concentration dependence of glucuronide metabolite production.
We further explored UGT-catalyzed C-CTX-1/-2 metabolism using other northern Gulf of Mexico fish as well as HLM, RLM, and SLM microsomes to compare C-CTX-1/-2 glucuronidation capacity across species and taxa. These incubations were conducted as described above, with some minor modifications to conserve the C-CTX-1/-2 stock material and maximize metabolite concentrations. Incubations were maintained at 37 °C for HLM or RLM, 25 °C for incubations with northern Gulf of Mexico fish microsomes, and 20 °C for those with SLM. Reactions were initiated by addition of 1.5 μL of C-CTX-1/-2 stock solution (dissolved in 50% aq. MeOH, v/v), and incubations were allowed to proceed for 1 h. Aliquots were drawn at the six time points described above during incubations with RSN2, GSN3, GSN4, LNF5, PRT6, and SHP7, while for incubations with RSN1, HLM, RLM, and SLM only one sample was taken at 1 h, at which point the entire incubation solution was added to ice-cold MeCN and prepared for analysis as described above. To produce larger amounts of 1 and 2 for HRMS/MS experiments, enzymatic deconjugation, and chemical derivatization, RSN1 microsomes were incubated for 1 h with 1.75 μL of C-CTX-1/-2 stock solution.
To increase the signal/noise ratio and thus the quality of the HRMS data, 1 h incubations using RSN1, HLM, RLM, and SLM microsome incubations were extracted and target compounds upconcentrated using SPE. In the case of incubations with microsomes from RSN2, GSN3, GSN4, LNF5, PRT6, and SHP7, for which six time points were collected, the 10–60 min aliquots were pooled. The incubation mixtures were diluted 9 fold with water and vortexed. Strata-X polymeric reverse phase mini-columns (60 mg, Phenomenex, Torrance, CA, U.S.A.) were conditioned with 2 mL of 100% MeOH, followed by 2 mL of water. The diluted incubation solutions were transferred to the columns, which were subsequently washed with 2 mL of water and 2 mL of 40% aq. MeOH. The C-CTX-1/-2-GlcA conjugates were eluted using 4 mL of 75% aq. MeOH, followed by elution of C-CTX-1/-2 using 4 mL of 100% MeOH. In cases where the separation of GlcA conjugates from the toxin was not required, the 75% aq. MeOH elution step was omitted. Eluates were evaporated to dryness at 60 °C under a gentle stream of nitrogen and residues dissolved in 200 μL of 60% aq. MeOH by vortexing. Solutions were transferred to fixed-insert HPLC vials and stored at −20 °C until further analysis.
Deconjugation of C-CTX-1/-2-GlcA Metabolites with β-Glucuronidase.
To support the identity of potential glucuronidation products observed during phase II C-CTX metabolism experiments, deconjugation experiments were performed to test the removal of GlcA from the conjugated metabolite using β-glucuronidase enzyme. Separate experiments with slightly different protocols were performed using β-glucuronidase derived from E. coli and H. pomatia. In Protocol 1, an aliquot (70 μL) of the pooled, solid-phase extracted and separated 10–60 min samples from incubation of C-CTX-1/-2 stock material with RSN1 microsomes in 75% aq. MeOH was incubated with 930 μL of H. pomatia β-glucuronidase solution (5000 units/mL in PBS, pH 7.3) at 37 °C for 22 h. To produce more C-CTX-1/-2-GlcA for follow-up experiments, C-CTX-1/-2 was incubated under phase II assay conditions for 60 min, and no aliquots were collected at earlier time points. Experimental controls included incubations in which either C-CTX-1/-2-GlcA or β-glucuronidase enzyme was excluded and replaced by 70 μL of 75% aq. MeOH or 930 μL of PBS, respectively. In Protocol 2, solid-phase extracted C-CTX-1/-2-GlcA stock material in 80% aq. MeOH (20 μL) was added to 250 μL of PBS and 250 μL of E. coli or H. pomatia β-glucuronidase enzyme solution in PBS (18 000 units/mL) and incubated at 37 °C for 22 h. Incubation mixtures were solid-phase extracted using Strata-X mini-columns (30 mg) that were conditioned with 1 mL of 100% MeOH, followed by 1 mL of water. Incubation solutions were transferred to the columns, which were subsequently washed with 1 mL water and 1 mL of 40% aq. MeOH, and then the C-CTX-1/-2-GlcA conjugates eluted using 2 mL of 75% aq. MeOH, followed by elution of C-CTX-1/-2 using 2 mL of 100% MeOH. The functionality of both β-glucuronidase enzymes was tested by incubating 708 ng of deoxynivalenol-3-β-d-GlcA using Protocol 2. Incubation samples were extracted following the protocol described by Uhlig et al.33 and analyzed using LC-HRMS as described by Sayyari et al.38
Borohydride Reduction of C-CTX-1/-2-GlcA Metabolites.
To explore potential sites for the GlcA attachment to C-CTX-1/-2, we performed chemical reduction experiments with the conjugates using NaBH4 as previously described for C-CTX-1/-2.24 An aliquot (10 μL) of a solid-phase extracted and separated sample from a 1 h incubation of C-CTX-1/-2 stock material with RSN1 (dissolved in 100% MeOH) was carefully added to 2 mg of solid NaBH4 in an uncapped 250 μL HPLC vial. Samples were incubated for 5 min at ambient temperature, after which the remaining NaBH4 was hydrolyzed by adding 20 μL of 10% acetic acid in water. A control experiment was performed in which phenyl-β-glucuronide was incubated with NaBH4 to test the reactivity of the hemiacetal functionality in the GlcA moiety.
HPLC-TQMS Analyses of CYP and UGT Probe Substrates and Respective Metabolites.
The instrumental analyses for the probe substrates and corresponding metabolites monitored during enzyme characterizations were performed as described by Johny et al.34 Analyses were performed using an Agilent 1290 Infinity Binary UHPLC System with vacuum degasser and column maintained at 30 °C, interfaced by an electrospray ionization source with an Agilent 6470 tandem quadrupole mass spectrometer (Agilent Technologies, Santa Clara, CA, U.S.A.). Chromatographic separation was achieved by injection of 1 μL sample volume onto a 150 × 2.1 mm i.d. Kinetex F5 2.6 μm UHPLC column with a 0.5 μm × 0.004 in i.d. KrudKatcher Ultra Column in-line filter (both Phenomenex). CYP and UGT substrates and respective metabolites were eluted using a binary gradient of mobile phases A (water) and B (MeCN), both containing 0.1% formic acid, at a flow rate of 0.25 mL min−1. For the elution of CYP substrates, the binary gradient was started at 18% B for 1 min followed by linear increase to 55% B at 13 min to 95% B at 14 min. After holding at 95% B for 3 min, the column was re-equilibrated for 4 min with 18% B for a total run time of 21 min. For UGT substrates, the binary gradient was started at 2% B for 1.5 min followed by linear increase to 39% B at 4 min, to 55% B at 10.5 min, and to 95% B at 11 min before a hold at 95% B (2 min) and re-equilibration to 2% B (2 min), for a total of 15 min.
Analytes were monitored by several product ion transitions in dynamic multiple reaction monitoring (dMRM) mode using instrument parameters (m/z values, fragmentor voltages, collision energies, cell accelerator voltages) as previously described34 and listed in the Supporting Information, Table S1. Probe substrates were semiquantified based on integrated peak areas, whereas respective metabolic products were quantified using matrix-assisted calibration curves from standards in solvent at 7.5, 15, 75, 150, and 300 μ/L. Data were analyzed using MassHunter software (version B 08.00; Agilent). Probe substrate depletion rates were determined by exponential regression of depletion curves of mean data from duplicate incubations, where depletion was expressed as percent substrate peak area relative to that at the 0 min time point. Metabolite formation rates were estimated by regression analysis from the initial slope of the concentration versus time curves.
UHPLC-HRMS(/MS) Analyses of C-CTX-1/-2 and Metabolites.
Analysis of C-CTX-1/-2 incubation samples were performed on a Vanquish Horizon UHPLC instrument (Thermo Fisher Scientific) connected to a Q-Exactive mass spectrometer (Thermo Fisher Scientific), equipped with a HESI-II heated electrospray interface (ESI). Incubation sample aliquots were maintained at 15 °C in the UHPLC autosampler and chromatographed on a 100 mm × 2.1 mm i.d. Kinetex F5 column (1.7 μm, Phenomenex) maintained at 20 °C. The capillary and probe heater temperatures were maintained at 270 and 300 °C, respectively. Compounds were eluted by linear gradient elution of the mobile phases A (0.1% formic acid in MeCN/water, 5:95, v/v) and B (0.1% formic acid in MeCN/water, 95:5, v/v). Three UHPLC-HRMS methods were employed in this study depending on the aim of the analyses. Instrument Method 1 was used during CYP and UGT metabolism experiments with HLM and RSN1 microsomes to search for and monitor the formation of potential metabolites over time. Based on the observation of an early eluting bimodal C-CTX-1/-2-GlcA product peak, the UHPLC gradient was adjusted to Instrument Method 2 to improve chromatographic separation of observed GlcA metabolites; this method was used during the additional UGT metabolism experiments to compare C-CTX glucuronidation across species, as well as follow up experiments with C-CTX-1/-2-GlcA metabolites (SPE optimization and borohydride reduction studies). Instrument Method 3 was used to achieve chromatographic separation of reduced diastereoisomers generated during the NaBH4 reduction experiments.
In Instrument Method 1, mobile phase B was increased linearly from 30% to 60% over 15 min. The column was held at 99% B for 2 min, and then re-equilibrated at 30% B for 2.6 min. The total run time was 20 min, throughout which the flow was maintained at 0.3 mL min−1. For full-scan data acquisition (FullMS), the mass spectrometer was set to scan in various mass ranges (up to m/z 2500) depending on the aim of the analyses and using a mass resolution of 70 000 (at m/z 200) when positive/negative ionization switching was performed, or a mass resolution of 140 000 (at m/z 200) when the polarity was held constant.
In Instrument Method 2, mobile phase B was increased from 25% to 35% over 11 min and then from 35% to 80% between 11 to 15 min. After holding at 99% B for 2 min, the column was re-equilibrated at 25% B for 2.5 min for a total runtime of 20 min. The flow rate was maintained at 0.3 mL min−1 from 0 to 15 min, then increased to 0.5 mL min−1 during the column wash with 99% mobile phase B, and then returned to 0.3 mL min−1 during re-equilibration. FullMS data acquisition was performed scanning with a mass resolution of 140 000 (at m/z 200) in the mass range m/z 1100–1500 in negative ionization mode, or with positive/negative switching from 0 to 10 or 11 min, then in the mass range m/z 900–1300 in positive ionization mode to 16 min. The automatic gain control target and maximum injection time was set to 3 × 10⁶ and 512 ms, respectively, while the spray voltage was set to 3.5 kV (positive mode) or −3.0 kV (negative ionization mode), and the S-lens RF voltage was 90 V.
In Instrument Method 3, a Vanquish C18+ UHPLC column (100 × 2.1 mm i.d.; 1.5 μm; Thermo Fisher Scientific) was used for improved chromatographic resolution of the borohydride reaction products. The mobile phase was identical to the above methods, but elution at 0.5 mL/min was isocratic using 25% B for 1 min, and then a linear gradient was applied to 40% B over 10 min. The mobile phase composition was increased linearly to 80% B over 4 min, and the column was subsequently flushed with 99% B for 2 min, before returning to the starting conditions and re-equilibration for 2.5 min.
Negative HRMS/MS analyses were performed on the deprotonated C-CTX-1/-2-GlcA ions, while positive HRMS/MS was performed on ammonium ions of C-CTX-1/-2 as well as of C-CTX-1/-2-GlcA. HRMS/MS data were collected in parallel reaction monitoring (PRM) mode using an isolation width of 1.5 m/z and variable collision energies, ranging from 15–50 eV in positive ionization mode versus 20–90 eV in negative ionization mode. The mass resolution during PRM was set to 70 000 (at m/z 200), the automatic gain control target was 3 × 10⁵ and the maximum injection time was 100 ms. All other interface settings were identical to FullMS. LC-HRMS and -HRMS/MS data were analyzed using Xcalibur software (version 4.2; Thermo Fisher). To search for potential oxidative metabolites of C-CTX-1/-2, FullMS data of RSN1 and HLM incubations were also processed using MZmine 2 (version 2.53,39 downloaded from http://mzmine.github.io/), using the methods and parameters detailed in the Supporting Information, Table S2.
RESULTS
CYP and UGT Enzyme Activities in Liver Microsomes Northern Gulf of Mexico Fish.
The fish species, number of individuals collected, and sex, as well as microsomal protein concentrations and protein yields are listed in Table 2. The yields of the microsomal preparations were generally low but varied considerably between the fish, ranging from 2.0 mg/g liver in P. volitans to 4.3 mg/g liver in A. probatocephalus.
Table 2.
Summary Information for Liver Microsome Batches Prepared from Northern Gulf of Mexico Fisha
| species | batch ID |
no. samples |
combined liver mass (g) |
sex | microsome protein concentration(mg/mL) |
total microsomal protein (mg) |
microsomal protein yield (mg/g liver) |
|---|---|---|---|---|---|---|---|
| Red Snapper Lutjanus campechanus | RSN1 | 3 | 21.8 | mix | 12.3 | 91 | 4.2 |
| Red Snapper L. campechanus | RSN2 | 5 | 20.1 | mix | 10.7 | 42 | 2.1 |
| Gray Snapper L. griseus | GSN3 | 3 | 20.7 | female | 10.7 | 50 | 2.4 |
| Gray Snapper L. griseus | GSN4 | 4 | 22.4 | male | 11.9 | 51 | 2.3 |
| Red Lionfish Pterois volitans | LNF5 | 5 | 18.9 | unknown | 8.41 | 37 | 2.0 |
| Emerald Parrotfish Nicholsina usta | PRT6 | 22 | 16.1 | mix | 7.05 | 35 | 2.2 |
| Sheepshead Archosargus probatocephalus | SHP7 | 14 | 27.3 | unknown | 16.9 | 118 | 4.3 |
Shown for each microsome batch are the number of samples combined and total mass of each batch, the genders of the specimens comprising each batch, protein concentrations estimated using the Lowry assay,36 the total microsomal protein, and preparation yield.
We were able to detect CYP enzyme activities in the prepared microsomes, but at low and variable levels across species. The peak area reductions were below 20% for the substrate’s phenacetin (PCN; CYP1A2), tolbutamide (TB; CYP1A9), chlorzoxazone (CH; CYP2E1), and midazolam (MDZ; CYP3A4) (Figure 1A). However, the peak area reduction of the substrate dextromethorphan (DEX; CYP2D6) ranged from 15% to 90% across species during the 60 min incubation period, indicating relatively high but variable activity related to this enzyme (Figure 1A). The metabolites dextrophan (DOR) and 4-hydroxymidazolam (4-OH-MDZ) were produced with relatively high efficiency in all five species (Figure 1B), which further supported the importance of CYP2D6-, and to a lesser extent, CYP3A4-related enzyme activities, respectively. In contrast, the formation rates of the metabolites acetaminophen (ACP), 4-hydroxy-tolbutamide (4-OH-TB), and 6-hydroxy-chlorzoxazone (6-OH-CH) were comparably small (<0.5 ng mL−1 min−1), indicating very minor contributions from enzyme reactions related to CYP1A2-, CYP2E1-, and CYP2C9-like activities. Curves showing substrate depletion and metabolite formation over time are shown in the Supporting Information, Figures S1 and S2; derived depletion and formation rates are listed in Tables S3 through S6. The variable rates identified in substrate depletion and metabolite formation across species under identical assay conditions (Tables S3 and S4) suggest interspecific variability with respect to the five CYP enzyme activities investigated. Microsomes prepared from L. campechanus (RSN1 and RSN2) and N. usta (PRT6) showed the highest activities related to CYP2D6 and CYP3A4, while greater production of 4-OH-TB by PRT6 than by microsomes prepared from the other fish species indicated a slightly higher CYP2C9 related activity in N. usta. Interestingly, P. volitans (LNF5) microsomes showed the lowest formation rates and final metabolite concentrations for all probe substrates, except for a relatively high production of ACP, which indicated a greater CYP1A2-related activity in this species.
Figure 1.

Major CYP and UGT enzyme activities characterized in northern Gulf of Mexico fish liver microsomes using specific probe substrates. Heatmaps show the relative depletion rates for CYP and UGT substrates (A and C, respectively) as well as relative formation rates of the corresponding metabolites (B and D, respectively). Scale bars on each panel show the range of observed depletion/formation rates for the represented compound. Depletion rates are expressed as min−1, while metabolite formation rates are expressed as ng mL−1 min−1. Rates were estimated from mean curves of duplicate incubations at 25 °C. Depletion rates could not be estimated for several phase II probe substrates, which are represented by an “X”.
UGT enzyme activities in liver microsomes of fish from the northern Gulf of Mexico were measurable in all species but varied considerably among the different enzymes and microsomes tested (Supporting Information, Tables S5 and S6). Activity related to UGT2B7 was high, as evidenced by ~100% reduction of the naloxone (NLX) substrate peak area after 5 to 30 min of the 60 min incubation. Simultaneously, we observed a rapid increase in the concentration of the corresponding metabolite NLX-glucuronide (NLX-GlcA), which plateaued between 300 and 500 ng mL−1 in all species, resulting in formation rates exceeding 10 ng mL−1 min−1 (Figure 1C,D). Interspecific differences in activities related to UGT1A1, UGT1A6, and UGT1A9 were indicated by considerable variability in the depletion of the UGT substrates beta-estradiol (E2), N-acetylserotonin (NAS), and mycophenolic acid (MA), respectively, which was reflected by a corresponding variability in the production of the respective GlcA metabolites. The elimination efficiency for the substrate trifluoperazine dihydrochloride (TFP; UGT1A4) was relatively low (<20%) across species, but formation of the conjugated TFP-GlcA metabolite was somewhat variable (Figure 1C). While TFP-GlcA formation could not be detected in several microsomes (RSN1, RSN2, GSN3, and LNF5), the final concentration in male L. griseus (GSN4), N. usta (PRT6), and A. probatocephalus (SHP7) liver microsomes ranged from approximately 45 to 3600 ng/mL, corresponding to formation rates of <0.1 to 60 ng mL−1 min−1 (Figure 1D). Notably, under identical assay conditions, N. usta (PRT6) microsomes showed the highest formation rates and achieved the highest total production for four of the five UGT reaction products analyzed (E2-GlcA, NAS-GlcA, TFP-GlcA, and MA-GlcA), highlighting the high glucuronidation capacity of this species compared to the other northern Gulf of Mexico fish included in this study.
Phase I Metabolism (by CYP P450) of C-CTX-1/-2 in L. campechanus (RSN1) and Human (HLM) Liver Microsomes.
The CYP-catalyzed in vitro phase I metabolism of C-CTX-1/-2 was investigated using HLM and RSN1 microsomes in 60 min incubations under assay conditions optimized for both species. Analysis by LC-HRMS did not show any depletion of the chromatographically unresolved C-CTX-1/-2 substrate peak ([M−H2O+H]+, m/z 1123.6200, Δm ± 5 ppm), indicating that functionalization reactions of the epimers were negligible in both species (data not shown). Additionally, no peaks related to C-CTX-1/-2 (i.e., with mass shifts expected for typical metabolites produced by hydrolysis, oxidation, and reduction reactions) could be identified from extracted ion chromatograms from any incubation time point, Similar results were obtained by in-depth analysis of peak lists generated using MZmine 2 (36; http://mzmine.github.io/), which confirmed the absence of measurable oxidized C-CTX-1/-2 metabolites in either species. The MZmine 2 method parameters are listed in the Supporting Information in Table S2 and full peak lists are shown in Tables S7-S10.
Phase II Metabolism (by UGT) of C-CTX-1/-2 in Fish and Mammalian Liver Microsomes.
We further explored the in vitro phase II (UGT) metabolism of C-CTX-1/-2 in glucuronidation assays with liver microsomes from different species. Preliminary incubations were performed with HLM and RSN1 microsomes to monitor the production of potential glucuronide products over time. While we were unable to detect any potential metabolites in HLM samples, we did observe a product peak forming over time in RSN1 incubations. This peak was from ions with m/z 1315.6543 ([C68H99O25]−, Δm = 4.7 ppm), which corresponded to the deprotonated molecules of a monoglucuronide conjugate of C-CTX-1/-2. Using Instrument Method 1, the C-CTX-1/-2-GlcA metabolite peak eluted at a retention time (RT) of approximately 3.35–3.53 min (compared to RT = 6.43 min for the unconjugated substrate) and appeared bimodal in shape, indicating that it was comprised of at least two closely eluting C-CTX-1/-2-GlcA conjugates. Although the C-CTX-1/-2 substrate peak did not substantially decrease over time, the signal intensity for C-CTX-1/-2-GlcA increased continuously during the incubation period, with the relative increase dependent on the start concentrations adequate for substrate additions of either 1.5 or 5 μL C-CTX-1/-2 stock solution (Figure 2). We detected only monoglucuronidated C-CTX-1/-2, whereas peaks with m/z consistent with the attachment of more than one GlcA were not observed in the mass range set for the HRMS analysis (up to m/z 2500).
Figure 2.
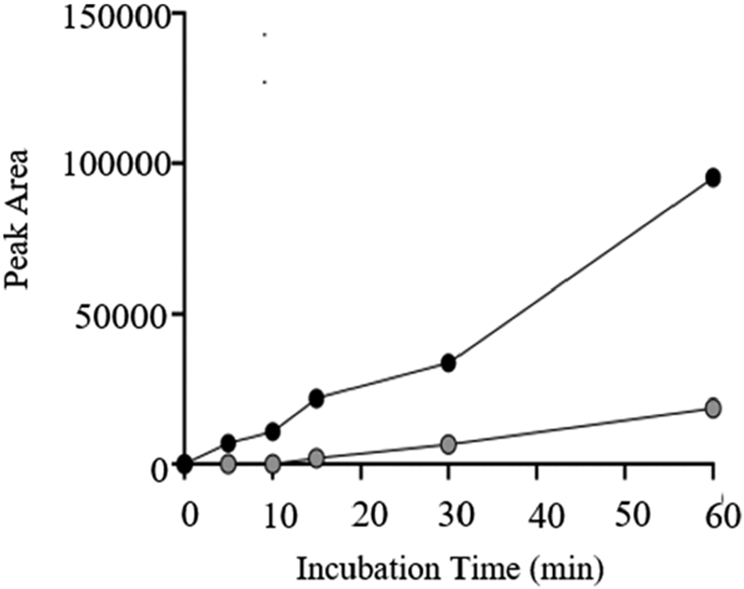
Formation of C-CTX-1/-2-GlcA conjugate over time during 60 min glucuronidation assay with L. campechanus (RSN1) microsomes. Figure shows an increase in peak area (arbitrary units) of C-CTX-1/-2-GlcA ([M−H]−, m/z 1315.6481, ± 5 ppm) following addition of 5.0 μL (black) or 1.5 μL (gray) of C-CTX-1/-2 reference stock solution. Note that substrate volumes are provided, since the concentration of C-CTX stock solution was not determined. Peak areas (arbitrary units) were obtained by manual integration of extracted ion LC-HRMS chromatograms using Instrument Method 1.
Prior to further experimentation, we adjusted the LC-HRMS parameters to Instrument Method 2 to improve chromatographic separation of the C-CTX-1/-2-GlcA peaks and focus on the expected mass range of the monoglucuronide products. Using the adjusted method, the chromatographically unresolved C-CTX-1/-2 substrate eluted at 13.24 min, while the two C-CTX-1/-2-GlcA metabolites (1 and 2) eluted at 8.57 and 9.13 min, respectively (Table 3). The FullMS spectra for the glucuronide metabolites in both positive and negative ionization modes are shown in Figure 3. In negative mode, the spectra contained deprotonated ([M−H]−) and chloride ([M+Cl]−) ions, as well as deprotonated sodium chloride saltcluster ions ([M+NaCl−H]−), all within ±1 ppm. In positive ionization mode, the ammonium ion ([M+NH4]+) dominated the spectra with minor contribution from the sodiated ([M + Na]+) ion, each within ±4 ppm. Identification of these adduct ions further confirmed the observed mass of the glucuronide products and lent support to their assignment as C-CTX-1/-2-GlcA.
Table 3.
Molecular Formulae, Ring Double Bond Equivalents (RDBE), Retention Times (RT), As Well As Observed m/z and Mass Error (Δm in ppm) for Relevant Compounds in This Studya
| compound | neutral formula | RDBE | instrument method | RT (min) | ion | observed m/z (Δm in ppm) |
|---|---|---|---|---|---|---|
| C-CTX-1/-2 | C62H92O19 | 17 | 2 | 13.24 | [M−H2O+H]+ | 1123.6177 (−2.1) |
| C-CTX-3/-4 | C62H94O19 | 16 | ||||
| C-CTX-1/2-GlcA (1) | C68H100O25 | 19 | 2 | 8.57 | [M−H]− | 1315.6510 (+2.2) |
| C-CTX-1/2-GlcA (2) | C68H100O25 | 19 | 2 | 9.13 | [M−H]− | 1315.6509 (+2.1) |
| C-CTX-3/4-GlcA (1) | C68H102O25 | 18 | 3 | 8.99 | [M−H]− | 1317.6697 (+4.5) |
| C-CTX-3/4-GlcA (2) | C68H102O25 | 18 | 3 | 9.22 | [M−H]− | 1317.6693 (+4.2) |
| C-CTX-3/4-GlcA (3) | C68H102O25 | 18 | 3 | 9.36 | [M−H]− | 1317.6692 (+4.1) |
| C-CTX-3/4-GlcA (4) | C68H102O25 | 18 | 3 | 9.62 | [M−H]− | (+4.1) |
Data for C-CTX-1/-2 and its GlcA metabolites were obtained from a sample collected after 60 min incubation of L. campechanus (RSN1) liver microsomes with C-CTX-1/-2 stock solution and analyzed using LC-HRMS Instrument Method 2. Data for the four C-CTX-3/-4-GlcA products were produced by reduction of RSN1-generated C-CTX-1/-2-GlcA with sodium borohydride and analyzed using Instrument Method 3. The neutral formula and RDBE for C-CTX-3/-4 is shown for comparison, but LC-HRMS information is omitted since these were not investigated during this study.
Figure 3.
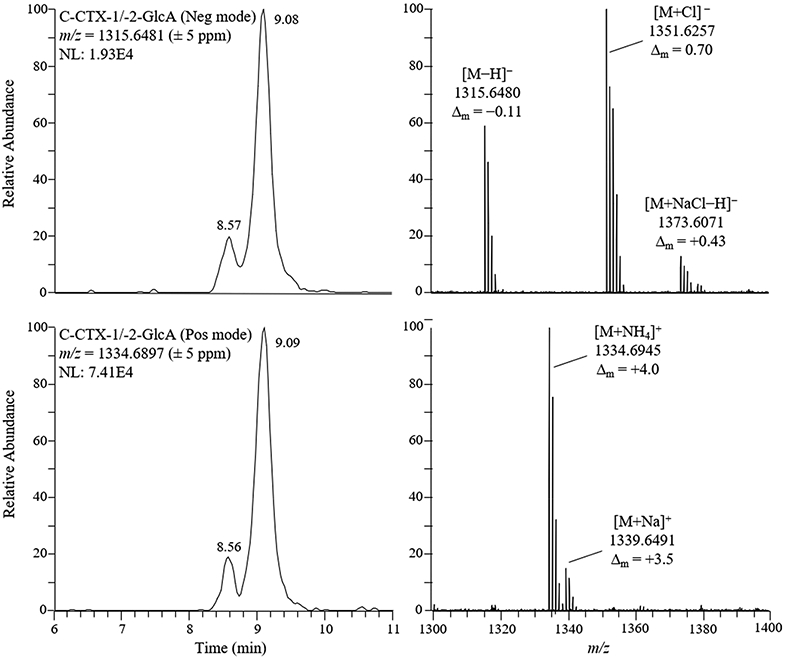
Extracted ion LC-HRMS chromatograms (left) and FullMS spectra (right) of the [M−H]− (top) and [M+NH4]+ (bottom) ions for C-CTX-1/-2-GlcA. The spectra show the cumulative ions taken across both metabolite peaks, and the proposed identities, observed m/z, and mass accuracies (Δm) of the base peak for each isotope group are labeled on the figure.
Additional incubations were performed to investigate the prevalence of C-CTX-1/-2-GlcA formation in different species using liver microsomes prepared from the reef fish species collected in the northern Gulf of Mexico (Table 2), commercially available microsomes from Wistar rat (Rattus norvegicus, RLM) and humans (HLM), and Atlantic salmon (Salmo salar, SLM) microsomes prepared in a previous study.34 Samples from incubations with Gulf of Mexico fish liver microsomes were pooled from multiple incubation time points (15, 30, and 60 min), submitted to solid-phase extraction (SPE), and concentrated to improve the detection of GlcA conjugates, while for RLM, HLM, and SLM the complete incubation volume was sampled after 60 min without the removal of intermediate aliquots. Therefore, the data produced do not show metabolite formation over time but were used to explore the presence/absence of glucuronidated metabolites. Our results indicated that both 1 and 2 were produced by liver microsomes of all Gulf of Mexico fish as well as by SLM (Figure 4). The metabolite peaks were produced in a nearly constant ratio by all fish microsomes, such that the mean ratios (±SD) of the peak areas and peak heights of 1 relative to 2 equaled 0.25 (±0.05) and 0.29 (±0.05), respectively, across species. In some of the incubations we detected three additional compounds which afforded ions that were within 5 ppm of the deprotonated ions for C-CTX-1/-2-GlcA. However, based on their HRMS spectra, these were determined not to be GlcA conjugates of C-CTX-1/-2. One of the observed peaks from a pooled incubation of GSN4 microsomes appeared to be an isotope peak of an ion with [M−H]− m/z 1313.6465 (RT = 8.5 min; Figure 4). The other two peaks were detected in the PRT6 chromatogram (eluting at 2.6 and 8.8 min), both of which were determined to be double-charged ions unrelated to C-CTX-1/-2-GlcA (data not shown). The glucuronide metabolite peaks, 1 and 2, were not produced by RLM or HLM (Figure 4), nor were any additional glucuronidation products identified in these species.
Figure 4.

Formation of C-CTX-1/-2 glucuronide products in liver microsomes prepared from five northern Gulf of Mexico fish species, as well as microsomes from Atlantic salmon, rats, and humans. Figure shows extracted ion LC-HRMS chromatograms for [M−H]− of C-CTX-1/-2-GlcA ([M−H]− m/z 1315.6481, ± 5 ppm) conjugates 1 and 2, which eluted at 8.57 and 9.13 min, respectively, using Instrument Method 2. The intensities of the highest peak in each chromatogram are indicated in the upper right-hand corners (arbitrary units); the scale was fixed for RLM and HLM chromatograms. The (*) labeled peak in the chromatogram from the N. usta microsome incubation is from a double-charged interfering ion and not from a C-CTX-1/-2-GlcA conjugate.
Deconjugation of C-CTX-1/-2-GlcA by β-Glucuronidase.
To verify the identity of C-CTX-1/-2-GlcA 1 and 2 observed during the glucuronidation experiments with fish microsomes, follow-up experiments were performed in which the presumably conjugated molecules (after separation from the parent toxin by SPE) were incubated with β-glucuronidase derived from either Roman snail (Helix pomatia) or bacteria (Escherichia coli). Samples were analyzed by LC-HRMS Instrument Method 1. The deconjugation experiments were unsuccessful with β-glucuronidase enzyme from E. coli, as neither reduction of the glucuronide peaks nor concomitant reformation of the C-CTX-1/-2 substrate peak could be detected. Experiments using β-glucuronidase from H. pomatia were inconclusive, since deconjugation was achieved in just one trial (results shown in the Supporting Information, Figure S3) but could not be repeated in subsequent trials (including trials where varied pH conditions were tested). It is possible that the assay conditions employed may not have been favorable for C-CTX-1/-2-GlcA deconjugation. The functionality of both β-glucuronidase enzymes under the chosen conditions was confirmed by testing their activities toward a control substrate, deoxynivalenol-3-β-d-GlcA (Supporting Information, Figure S4). However, assay conditions were not optimized to C-CTX-1/-2-GlcA given the limited amount of available substrate material, and the observed results may therefore reflect differences in the temperature dependency of the tested β-glucuronidase enzymes toward C-CTX-1/-2-GlcA.
HRMS/MS Analysis of C-CTX-1/-2-GlcA.
The HRMS/ MS fragmentation of the postulated glucuronides 1 and 2 was studied with the aim of identifying relevant and diagnostic fragment ions, which may further support their classification or provide structural information about the molecular site of GlcA attachment. Our HRMS/MS analyses targeted the deprotonated ([M−H]−) and ammonium ([M+NH4]+) ions detected during FullMS in negative and positive ionization modes, respectively (Figure 3).
Negative HRMS/MS of the deprotonated ([M−H]−) molecules of 1 and 2 was tested under collision energies ranging 20 to 90 eV. Fragmentation of the molecules required relatively high collision energies to show significant fragmentation. For instance, even at a collision energy of 90 eV the parent [M−H]− ions were among the most prominent ions in the mass spectrum. Under these conditions, however, we were able to detect a product ion at m/z 193.0356 that was consistent with deprotonated GlcA ([C6H9O7]−, Δm = 1.2 ppm), as well as fragments associated with subsequent water losses or further fragmentation of the deprotonated GlcA (Figure 5; Table 4). The observation of these fragments supported that C-CTX-1/-2 had been glucuronidated by the fish liver microsomes. However, the negative HRMS/MS spectra were otherwise uninformative regarding the potential site(s) of GlcA attachment. Fragmentation of the ammonium ([M+NH4]+) ions of 1 and 2, as well as that of C-CTX-1/-2, in positive HRMS/MS was tested at collision energies of 15, 30, and 50 eV. Substantial fragmentation of the C-CTX-1/-2 backbone was achieved at 50 eV (Supporting Information, Figure S5A), generating product ions primarily associated with the [M+H−H2O]+ ion of C-CTX-1/-2, which have been previously reported by Kryuchkov et al.24 The HRMS/MS spectrum of the minor C-CTX-1/-2-GlcA peak (1; Supporting Information, Figure S5B) was populated primarily by the dehydrated [M+H−H2O]+ ion of C-CTX-1/-2 (m/z 1123.6200) and fragments related to additional water losses. Furthermore, a product ion with m/z 1281.6345 ([M+H−2H2O]+, Δm = −5.5 ppm) associated with water loss of the protonated C-CTX-1/-2-GlcA conjugate was observed in lower collision energy spectra. Other previously described fragments were either not observed or were of relatively low abundance, likely owing to the already low intensity of the C-CTX-1/-2-GlcA (1) [M+NH4]+ ion precursor peak. The HRMS/MS spectrum of the major C-CTX-1/-2-GlcA peak (2; Supporting Information, Figure S5C) also showed the major [M+H−2H2O]+ fragment (m/z 1281.6417, Δm = 1.1), but otherwise presented a fragmentation pattern similar to that of unconjugated C-CTX-1/-2, affording no relevant ions that could indicate the potential site(s) of GlcA attachment. The absence of GlcA-attached product ions suggested that the sugar is likely easily removed at collision energies required to achieve fragmentation of the C-CTX-1/-2 backbone. Therefore, the positive HRMS/MS spectra were not particularly useful for the structural elucidation of the C-CTX-1/-2-GlcA metabolites, so borohydride reduction was incorporated into the workflow.
Figure 5.
HRMS/MS spectrum of C-CTX-1/-2-GlcA ([M−H]−, m/z 1315.6481) using a collision energy of 90 eV. The HRMS/MS analysis revealed several fragments related to glucuronic acid ([M−H]− m/z 193.0356), including sequential water loss ions (m/z 157.0141 and 175.0248). The spectra was taken across the LC-HRMS chromatogram peak for the major glucuronide product (metabolite 2; RT = 9.13); metabolite 1 (RT = 8.57) spectra (not shown) was confirmed to be similar. The chemical formulae, RDBE, fragment identities, and mass accuracies (in ppm) for the labeled fragment ions are listed in Table 4.
Table 4.
Fragment Ions (Negative Ionization Mode) Detected during HRMS/MS Analysis of C-CTX-1/-2-GlcA ([M−H]−, m/z 1315.6)a
| m/z | ion formula | RDBE | identity | Δm (ppm) |
|---|---|---|---|---|
| 1315.6482 | [C68H99O25]− | 19.5 | [M−H]− | 0.08 |
| 1297.6366 | [C68H97O24]− | 20.5 | [M−H−H2O]− | −0.71 |
| 1197.6200 | [C64H93O21]− | 18.5 | [M−C4H6O4−H]−b | −1.2 |
| 193.0356 | [C6H9O7]− | 2.5 | [GlcA−H]− | 1.2 |
| 175.0248 | [C6H7O6]− | 3.5 | [GlcA−H−H2O]− | −0.06 |
| 157.0141 | [C6H5O5]− | 4.5 | [GlcA−H−(H2O)2]− | −0.93 |
| 129.0194 | [C5H5O4]− | 3.5 | [GlcA−H−H2O−CO2]− | 0.53 |
| 113.0244 | [C5H5O3]− | 3.5 | [GlcA−H−H2O−CO2]− | −0.15 |
| 99.0088 | [C4H3O3]− | 3.5 | [GlcA−H−H2O−CO−CH2O]− | 0.33 |
| 95.0139 | [C5H3O2]− | 4.5 | [GlcA−H−(H2O)2−CO2]− | 0.50 |
Data were obtained using a collision energy of 90 eV. Table shows observed m/z, predicted ion formula, ring double bond equivalents (RDBE), suggested identities, and mass error (Δm in ppm) relative to the expected m/z.
Neutral loss from GlcA moiety.
Borohydride Reduction of C-56 Hydroxyl Group of C-CTX-1/-2.
Borohydride is commonly used for the chemical reduction of aldehydes and ketones to produce hydroxyl groups.40 Sodium borohydride (NaBH4) has been previously used to selectively convert C-CTX-1/-2 to C-CTX-3/-4 via reduction of the C-56 carbonyl of the open N-ring C-CTX-1/-2 tautomer.24 To explore potential molecular sites of GlcA attachment, C-CTX-1/-2-GlcA was reacted with NaBH4 to investigate whether the C-56 site could still be reduced and was therefore available in the conjugated molecule. A mixture of 1 and 2 was incubated with NaBH4, resulting in the appearance of several reduced product peaks affording [M−H]− ions observed with m/z 1317.6694 ([C68H101O25]−, Δm = 4.1–4.5 ppm), which represented glucuronide conjugates of C-CTX-3/-4 (Figure 6E). Using Instrument Method 2, the product peaks eluted with RT between 5.2 to 6.1 min but displayed poor chromatographic resolution (Figure 6B). The reduction product peaks were chromatographically resolved using Instrument Method 3 to give four +2H product peaks with RT between 8.99 to 9.62 min (Figure 6C and Table 3). These results indicated that the GlcA must be attached to two different hydroxyl groups in the metabolites 1 and 2, because the two products gave rise to four peaks, which is in accordance with two pairs of diastereoisomers. Whether this reduction might have occurred in the C-CTX-1/-2 or the GlcA part of the molecules was further tested by incubation of phenyl-β-GlcA with NaBH4. This control did not react with NaBH4 under our reaction conditions showing that the hemiacetal functionality in GlcA was unreactive (Supporting Information, Figure S6). Thus, we could confirm that the observed +2H reduction of C-CTX-1/-2-GlcA occurred on the C-CTX (rather than the GlcA) part of the molecule.24
Figure 6.
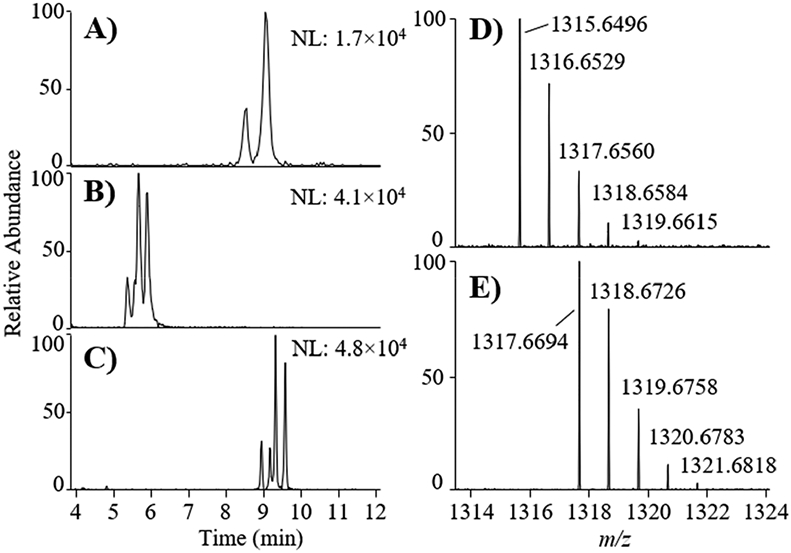
Extracted ion LC-HRMS chromatograms (±7 ppm, left panels) for [M−H]− of (A) C-CTX-1/-2-GlcA conjugates (m/z 1315.6481) from incubation of the toxin with L. campechanus liver microsomes and (B) the C-56 reduced product (m/z 1317.6637) following reaction with NaBH4 using the same chromatographic method (Instrument Method 2). Chromatogram C shows separation of the reduction products using optimized chromatography and different stationary phase (Instrument Method 3). The intensities of the highest peak in each chromatogram are indicated in the upper right-hand corners (arbitrary units). The mass spectra (right panels) are from (D) the major isomer of unreacted C-CTX-1/-2-GlcA and (E) the major isomer of the +2H reduced C-CTX-1/-2-GlcA. Mass spectra represent cumulative ions taken across the representative peaks in the respective LC-HRMS chromatograms.
DISCUSSION
We investigated the in vitro biotransformation of C-CTX-1/-2 using substituted liver microsomes of six different fish and two mammalian species with the aim of determining potential metabolites of phase I and phase II reactions. The information obtained from such experiments is relevant for characterizing the ecotoxicological pathways of C-CTX in marine food webs.
Microsomes prepared from five northern Gulf of Mexico fish species were first characterized with respect to major CYP and UGT enzyme activities prior to metabolism experiments with C-CTX-1/-2 (Figure 1). Determination of the enzyme activities of microsome preparations was an essential first step for robust comparisons of C-CTX biotransformation across fish species and aids in the interpretation of metabolite formation and substrate specificities. Information on known fish CYP and UGT enzymes has been reported in reviews [refs 41 and 42] and from comparative analyses of the fully sequenced zebrafish (Danio rerio) genome.43-45 So far, genes from 18 CYP families have been identified in fish. While CYPs with primarily endogenous functions display high conservation with mammalian genes, CYP families 1–4 (which are involved in xenobiotic and drug metabolism) are more diverse. However, some fish-human orthologs have been described, particularly within the CYP3A and CYP1A families.45 During microsome characterization experiments using probe substrates that are specific for human CYP enzymes, we observed substantial formation of 4-OH-MDZ, confirming activities related to CYP3A. However, we reported relatively low activities related to CYP1A2, suggesting human enzymes with an affinity for PCN may not have homologues in fish. There is very little fish-human sequence homology for enzymes in the CYP2 family, which supported our observations of low activities for CYP2C and CYP2E in the northern Gulf of Mexico fish tested. However, the substantial depletion of the substrate DEX and formation of the corresponding metabolite DOR in some northern Gulf of Mexico fish indicated relatively high CYP2D-related activities, as has been previously reported for S. salar.34 Given that CYP2D homologues are unknown in fish, it is possible that the metabolism of DOR is driven by other enzymes in the highly diverse CYP2 family, which may have affinity for DEX.
Research into piscine UGT enzymes is comparatively limited, despite the known importance of glucuronidation pathways in fish.42 The zebrafish genome has been shown to contain between 40 and 45 UGT genes across three families: UGT1, UGT2, and UGT5.43,44 Members of the diverse UGT5 family are apparently unique to fish and other lower vertebrates, with no mammalian homologues identified to date. However, the piscine and mammalian UGT1 and UGT2 families are thought to be ancestrally related, although the ancestral genes seem to have undergone further evolution through lineage-specific duplication and divergence events in fish. Characterization of enzyme activities using specific UGT probe substrates confirmed the glucuronidation capabilities of our northern Gulf of Mexico fish microsomes, revealing high UGT2B-like activity as well as variable activities related to UGT1A across species. Given the common ancestry of fish and mammalian UGT1 and UGT2 genes, it is possible that homologous enzymes in these two families were indeed responsible for the observed activities toward the specific probe substrates. However, until homologous relationships between fish and mammalian UGT genes and the substrate specificities of these enzymes are better established, it is difficult to trace the catalysis of probe substrates to specific enzymes in fish.
Once the functionality of CYPs and UGTs were confirmed, we then investigated the in vitro metabolism of C-CTX-1/-2 using identical assay formats to those used during our characterization experiments. The CYP-catalyzed metabolism of C-CTX-1/-2 was studied using only HLM and RSN1 microsomes. Although these microsomes contained active CYP enzymes and have been successfully used by our group to investigate the phase I metabolism of other algal polyether toxins, including brevetoxin (Gwinn et al., manuscript in preparation), we did not observe any oxidation, reduction, or hydroxylation of C-CTX-1/-2. Given the difficulties in identifying previously unreported metabolites with unknown chromatographic behaviors, ionization efficiencies, and detection limits, future efforts will focus on addressing experimental limitations that may have contributed to the lack of observable phase I metabolites. However, our current evidence suggested that C-CTX-1/-2 does not undergo CYP-mediated biotransformation or that the kinetics of such reactions are very slow and undetectable under the chosen experimental conditions. This implies that oxidative pathways, like those reported for Pacific CTX congeners,6,21,22 may play a limited role in the fate of C-CTX-1/-2 in Caribbean food webs or in human poisoning events. Based on these initial observations, the limited amount of available substrate material was instead allocated toward exploring potential UGT-mediated metabolism.
The glucuronidation of C-CTX-1/-2 by liver microsomes from a variety of fish resulted in the discovery of two GlcA metabolite peaks (1 and 2), which we identified as monoglucuronide conjugates of C-CTX-1/-2. Only limited studies of glucuronidation pathways have been reported for marine toxins including azaspiracid46 and the paralytic shellfish toxins gonyautoxin and saxitoxin,47,48 but none have been previously shown for ladder-frame polyether phycotoxins. The induction of phase II pathways for CTX-1B has been previously suggested from transcriptomic studies with mice.21,22 However, to our knowledge, the present study gives the first direct evidence of CTX glucuronidation in fish, and of C-CTX metabolism in any species. The role of 1 and 2 as C-CTX-1/-2 metabolites was initially inferred from the concentration-dependent increase of the C-CTX-1/-2-GlcA ion ([M−H]− m/z 1315.6481) during 1 h incubations with RSN1 (Figure 2). It should be noted that, given the limited amount of C-CTX-1/-2 stock material available, we did not perform incubation controls such as leaving out cofactors or microsomes, which would have further supported our conclusion that the metabolites 1 and 2 were neither artifacts already present in the fish microsomes nor originated from chemical conjugation rather than from UGT-catalyzed reactions. However, the C-CTX-1/-2-GlcA conjugates were not detected at the start of incubations, confirming that they were not present in the microsomes themselves. Furthermore, the lack of C-CTX-1/-2-GlcA production by mammalian microsomes using identical experimental conditions and reagents refuted the possibility of chemical conjugation. Together, these observations supported our interpretation of 1 and 2 as products of enzymatic biotransformation reactions occurring in fish. The negative ion HRMS/MS analyses of 1 and 2 further supported their assignment as glucuronide metabolites, since they afforded a product ion consistent with deprotonated GlcA and its associated water loss and fragmentation products (Figure 5 and Table 4), which was likely removed from the conjugated molecule during higher-energy collisional dissociation. Although a comprehensive analysis of metabolic pathways was beyond the scope of this study, the finding of two C-CTX-1/-2-GlcA conjugates, combined with the absence of CYP-catalyzed oxidation products, suggested that glucuronidation may be an important process for C-CTX biotransformation in fish.
Glucuronidation is the most important phase II metabolic pathway for xenobiotics in vertebrates,10,11 generally leading to detoxification as evidenced by the conjugated metabolites typically being less potent than their parent compounds and being rapidly excreted in urine or bile.9 The effect of glucuronidation on C-CTX toxicity or systemic elimination is unknown. However, it has been previously shown that structural differences among CTX congeners can alter the binding affinity to voltage-gated sodium channels, eliciting variable electrophysiological responses and toxic potencies.49-52 It is therefore possible that attachment of GlcA may additionally affect the binding and bioactive properties of C-CTX. Hence, identifying possible GlcA-attachment sites on the C-CTX molecules could be a critical step toward evaluating the mechanistic effects of glucuronidation on its toxic potential and may help further characterize CTX-binding mechanisms.
To explore potential sites for GlcA conjugation, we performed chemical reduction experiments with borohydride, which we previously used to show that the reduction of C-CTX-1/-2 to C-CTX-3/-4 occurs at the C-56 position.24 Using this approach, we were able to reduce the metabolites 1 and 2 to ions with m/z 1317.6694, a mass shift equivalent with the addition of two protons (Δm = 4.1–4.5 ppm). This reduction resulted in the formation of a pair of diastereoisomers for both C-CTX-1/-2-GlcA metabolites (1 and 2) that were observed as four separated peaks in the LC-HRMS chromatogram (Figure 6 and Table 3). The production of two diastereoisomeric pairs showed that the C-CTX-1/-2 metabolite peaks were comprised of four compounds: two epimeric pairs with GlcA attached to two different hydroxyl groups in either pair. The reduction experiment also revealed that the C-56 position is available in the conjugated toxin and is therefore not one of the sites of GlcA-attachment. Consequently, at least some part of the reactive diol group (comprising the C-56 and C-57 hydroxyls) in the reactive tail of the C-CTX-1/-2 molecule remained unbound after glucuronidation. Future efforts to unambiguously locate the sites of GlcA-conjugation in the glucuronide epimeric pairs 1 and 2, and to explore their toxic equivalency with other C-CTX congeners are needed to evaluate the effect of glucuronidation on binding affinity and toxic potency.
Glucuronidation can also lead to increased polarity of glucuronide metabolites relative to the parent compound and facilitates elimination by cell membrane-bound efflux transporters, promoting excretion into the bloodstream, bile, gastrointestinal lumen or urine.53-56 Consistent with this, the C-CTX-1/-2-GlcA metabolites eluted at earlier retention times than the unconjugated toxin, suggesting that they are more polar than their precursor C-CTX-1/-2. Further research into the toxicokinetic properties of C-CTX glucuronide metabolites is needed to establish whether this increase in polarity improves C-CTX transport and elimination. If this is the case, glucuronidation could be a mechanism responsible for reducing the overall bioaccumulation of C-CTX congeners in organisms capable of this biotransformation pathway.
Comparison of the ability for C-CTX-1/-2 glucuronidation across species showed that the GlcA metabolites 1 and 2 were produced by liver microsomes from all five fish species collected in the northern Gulf of Mexico as well as one cold-water fish (i.e., Atlantic salmon), but were not produced by liver microsomes from either of the two mammalian species tested (Figure 4). The predictive value of the performed C-CTX-1/-2 in vitro metabolism experiments for the in vivo situation has not been investigated so far, however, comparable studies have shown good congruency for other toxins.57-59 The production of the GlcA metabolites 1 and 2 by the subtropical and temperate fish included here, collected from areas in the northern Gulf of Mexico and northern Atlantic without a long-standing history of CP, as compared to tropical regions of the Caribbean and Pacific,60-63 suggested that CTX glucuronidation may be widespread among fish, even those originating from disparate regions. We were not able to compare rates of C-CTX-1/-2 glucuronidation across fish species, since samples were pooled to achieve sufficient detectability. However, our qualitative results do show differences in the glucuronidation capacity between species (e.g., RSN > SHP) which may aid in our understanding of species variability. For instance, if C-CTX-1/-2 glucuronidation does lead to a decreased toxic potential and/or increased elimination efficiency relative to the precursors, this conjugative pathway may be an important mechanism for driving the variable toxicity observed among marine organisms.64-66 Consequently, the impact of C-CTX-1/-2 glucuronidation for predicting human CP risk associated with the consumption of different seafood species could be considerable. Determining the prevalence of C-CTX glucuronide production among wild-caught fish and exploring the genetic or environmental factors driving the variability in C-CTX glucuronidation rates may be a promising avenue for future research.
The absence of GlcA metabolites in incubations with HLM or RLM indicated a potential disparity in the capacity of mammalian taxa for C-CTX glucuronidation. We found the lack of observed GlcA metabolite production in rat particularly interesting since prior evidence of CTX phase II biotransformation comes from research on the transcriptomic responses in mice.21,22 These studies reported that the expression of several murine UGT enzymes (UGT2A3, UGT2B1, UGT2B37, UGT2B5, and UGT3A2) significantly altered following exposure to CTX-1B with variable responses over time, generally decreasing within 1 h postexposure followed by a significant upregulation by 24 h.21,22 The activities of these UGT enzymes in our RLM and HLM are unconfirmed since they were not targeted during the UGT characterization experiments and were not certified materials. Moreover, the existence of homologies for these enzymes has only been determined for UGT2A3 and UGT2B1 in rat as well as UGT2A3 and UGT3A2 in humans, whereas the remaining UGT are mouse-specific67 and may not have corresponding enzymes in fish. If the UGT enzymes indicated by the transcriptomic evidence in mice are in fact involved in the glucuronidation of CTX-1B, it may be that their affinity to C-CTX-1/-2 is greatly reduced due to structural differences in the reactive tail of the molecule, where the hydroxyl groups are probably less sterically accessible.
Furthermore, it is unlikely that the major human UGT enzymes tested during the characterization experiments (UGT1A1, UGT1A4, UGT1A6, UGT1A9, and UGT2B7) are involved in C-CTX-1/-2 glucuronidation, considering the lack of C-CTX-1/-2-GlcA production in HLM despite confirmed enzyme activities. Rather, the observed occurrence of GlcA metabolites in the fish liver microsomes suggested that the formation of C-CTX-1/-2 glucuronides may be catalyzed by UGT enzymes which are either not present or relatively inactive in mammals. As previously discussed, the composition, expression, and substrate specificity of piscine UGT are little investigated. However, the full assembly of the zebrafish genome shows that fish contain many genes without mammalian homologues across the families UGT1, UGT2, and particularly UGT5.43,44 If C-CTX glucuronidation is exclusive in fish as our data suggest, targeted metabolism studies focusing on piscine-specific UGT enzymes may shed further light on the enzymatic pathways involved in C-CTX biotransformation.
The apparent lack of C-CTX-1/-2 glucuronidation in mammalian microsomes carries important clinical implications and considerations for experimental design in CP research. Since glucuronidation is considered as a detoxifying pathway, which may reduce the toxic potency and improve the elimination of harmful xenobiotics, different glucuronidation capacities across species may induce variable tissue accumulation and/or sensitivity after exposure to C-CTX-1/-2. An absence of this pathway in humans, as shown by our HLM data, may underlie the severity and duration of symptoms in patients suffering from CP. Unfortunately, little is known about the relative sensitivities of humans and other animals to C-CTX-1/-2 intoxication. Formal species sensitivity distributions are not available since most current CTX lethality data are derived from exposure studies in mice,2,3,16,18,23 and only limited studies attempting to determine a lowest adverse effect level (LOAEL) for the sum of Pacific CTX congeners in humans.68 However, no comparable studies exist in ecologically relevant species like fish. The distinct difference in the C-CTX-1/-2 glucuronidation capacity between mammals and fish observed in this study suggests that extrapolation of C-CTX biotransformation data across taxa may not be possible, a problem which has been reported for other xenobiotics.69,70 Until enough data exist, our findings cast doubt on the predictive reliability of the commonly used mouse model for the assessment of C-CTX toxicity, metabolism, or transcriptomic responses. Our study also highlights the advantages of utilizing ecologically relevant species in in vivo or in vitro experiments to characterize the ecological fate and effects of C-CTX.
In conclusion, we report for the first time the finding of phase II GlcA conjugates of C-CTX-1/-2 produced in vitro by liver microsomes of five fish species from the northern Gulf of Mexico and Atlantic salmon. The identities of the GlcA metabolites were supported by HRMS/MS, although the exact molecular site of the GlcA attachment site(s) could not yet be determined. Additional experiments utilizing borohydride reduction excluded the C-56 hydroxyl group as the reactive site and showed that the two observed metabolite peaks comprised four C-CTX-1/-2-GlcA conjugates (two epimeric pairs with GlcA attached at two different sites on the C-CTX-1/-2 molecule). The production of the observed metabolites by all tested fish microsomes could indicate that C-CTX glucuronidation may be a prevalent biotransformation pathway in fish, potentially affecting the fate of C-CTX in marine food webs. The absence of these metabolites in incubations with mammalian microsomes suggests that the UGT catalyzing the C-CTX-1/-2 glucuronidation may be specific to fish and could help to explain human sensitivity after C-CTX exposure.
Supplementary Material
ACKNOWLEDGMENTS
We would like to thank to Clay Bennett, Sean Collins, Grant Lockridge, Tom Guoba, Crystal Hightower, Edward Kim, Merritt McCall, Alex Rodriguez, Dottie Byron David, and Drs. Sean P. Powers and Kenneth L. Heck, Jr. (University of South Alabama) for assistance with fish collections. We also appreciate the time of Christopher O. Miles (National Research Council of Canada) and Morten Sandvik (Norwegian Veterinary Institute) for discussions and advice related to this project and Jennifer DeBose (University of South Alabama) for internal review of this manuscript.
Funding
This work was funded in part by the National Science Foundation (NSF) Partnerships in International Research and Education Program (CiguaPIRE; 1743802 to A.R.) and contributes to the NSF and NIEHS Center for Oceans and Human Health: Greater Caribbean Center for Ciguatera Research (NSF: 1841811 and NIH: 1P01ES028949-01, A.R.). The Norwegian Veterinary Institute contributions are supported by the supplemental PIRE award through the Research Council of Norway (Grant No. 279247 to S.U.). J.K.G. was supported by a graduate research assistantship funded by NSF and NIH (via A.R.), and received partial research support from the Bullard Fund (University of South Alabama) and travel support through NSF PIRE and a Student Training Exchange Opportunity award from the Society of Environmental Toxicology and Chemistry.
Footnotes
The authors declare no competing financial interest.
Supporting Information
The Supporting Information is available free of charge at https://pubs.acs.org/doi/10.1021/acs.chemrestox.1c00181.
Additional experimental details on instrumental analysis and data processing; results of enzyme characterization, phase I C-CTX-1/-2 metabolism experiments, and GlcA deconjugation experiments; additional HRMS/MS data for C-CTX-1/-2 and observed metabolites (PDF)
Contributor Information
Jessica Kay Gwinn, School of Marine and Environmental Sciences, University of South Alabama, Mobile, Alabama 36688, United States; Dauphin Island Sea Lab, Dauphin Island, Alabama 36528, United States.
Silvio Uhlig, Toxinology Research Group, Norwegian Veterinary Institute, Ås NO-1431, Norway.
Lada Ivanova, Toxinology Research Group, Norwegian Veterinary Institute, Ås NO-1431, Norway.
Christiane Kruse Fæste, Toxinology Research Group, Norwegian Veterinary Institute, Ås NO-1431, Norway.
Fedor Kryuchkov, Toxinology Research Group, Norwegian Veterinary Institute, Ås NO-1431, Norway.
Alison Robertson, School of Marine and Environmental Sciences, University of South Alabama, Mobile, Alabama 36688, United States; Dauphin Island Sea Lab, Dauphin Island, Alabama 36528, United States.
REFERENCES
- (1).FAO and WHO Report of the Expert Meeting on Ciguatera Poisoning. Rome, 19–23 November 2018. Food Saf. Qual No. 9 2020, 98–101.. [Google Scholar]
- (2).Murata M, Legrand AM, Ishibashi Y, Fukui M, and Yasumoto T (1990) Structures and Configurations of Ciguatoxin from the Moray Eel Gymnothorax Javanicus and Its Likely Precursor from the Dinoflagellate Gambierdiscus toxicus. J. Am. Chem. Soc 112 (11), 4380–4386. [Google Scholar]
- (3).Satake M, Murata M, and Yasumoto T (1993) The Structure of CTX3C, a Ciguatoxin Congener Isolated from Cultured Gambierdiscus Toxicus. Tetrahedron Lett. 34 (12), 1975–1978. [Google Scholar]
- (4).Lewis RJ, Vernoux J-P, and Brereton IM (1998) Structure of Caribbean Ciguatoxin Isolated from Caranx Latus. J. Am. Chem. Soc 120, 5914–5920. [Google Scholar]
- (5).Yogi K, Oshiro N, Inafuku Y, Hirama M, and Yasumoto T (2011) Detailed LC-MS/MS Analysis of Ciguatoxins Revealing Distinct Regional and Species Characteristics in Fish and Causative Alga from the Pacific. Anal. Chem 83, 8886–8891. [DOI] [PubMed] [Google Scholar]
- (6).Ikehara T, Kuniyoshi K, Oshiro N, and Yasumoto T (2017) Biooxidation of Ciguatoxins Leads to Species-Specific Toxin Profiles. Toxins 9, 205. [DOI] [PMC free article] [PubMed] [Google Scholar]
- (7).Parkinson A, and Ogilvie BW Biotransformation of Xenobiotics. In Casarrett and Doull’s Toxicology: the Basic Science of Poisons; Rozman KK, and Klaassen CD, Eds.; McGraw-Hill Education: New York, 2007; pp 161–304. [Google Scholar]
- (8).Penner N, Woodward C, and Prakash C Appendix: Drug Metabolizing Enzymes and Biotransformation Reactions. In ADME-Enabling Technologies in Drug Design and Development; Zhang D, and Surapaneni S, Eds.; John Wiley & Sons, Inc., 2012; pp 545–565. [Google Scholar]
- (9).Jancova P, Anzenbacher P, and Anzenbacherova E (2010) Phase II Drug Metabolizing Enzymes. Biomed. Pap 154 (2), 103–116. [DOI] [PubMed] [Google Scholar]
- (10).Williams JA, Hyland R, Jones BC, Smith DA, Hurst S, Goosen TC, Peterkin V, Koup JR, and Ball SE (2004) Drug–Drug Interactions for UDP-Glucuronosyltransferase Substrates: A Pharmacokinetic Explanation for Typically Observed Low Exposure (AUCi/AUC) Ratios. Drug Metab. Dispos 32 (11), 1201–1208. [DOI] [PubMed] [Google Scholar]
- (11).Testa B, Pedretti A, and Vistoli G (2012) Reactions and Enzymes in the Metabolism of Drugs and Other Xenobiotics. Drug Discovery Today 17 (11-12), 549–560. [DOI] [PubMed] [Google Scholar]
- (12).Zanger UM, and Schwab M (2013) Cytochrome P450 Enzymes in Drug Metabolism: Regulation of Gene Expression, Enzyme Activities, and Impact of Genetic Variation. Pharmacol. Ther 138, 103–141. [DOI] [PubMed] [Google Scholar]
- (13).Escher BI, and Fenner K (2011) Recent Advances in Environmental Risk Assessment of Transformation Products. Environ. Sci. Technol 45, 3835–3847. [DOI] [PubMed] [Google Scholar]
- (14).Daneshian M, Botana LM, Dechraoui Bottein M-Y, Buckland G, Campas M, Dennison N, Dickey RW, Diogene J, Fessard V, Hartung T, Humpage A, Leist M, Molgo J, Quilliam MA, Rovida C, Suarez-Isla BA, Tubaro A, Wagner K, Zoller O, Dietrich D, Bottein M-YD, Buckland G, Campas M, Dennison N, Dickey RW, Diogene J, Fessard V, Hartung T, Humpage A, Leist M, Molgo J, Quilliam MA, Rovida C, Suarez-Isla BA, Tubaro A, Wagner K, Zoller O, and Dietrich D (2013) A Roadmap for Hazard Monitoring and Risk Assessment of Marine Biotoxins on the Basis of Chemical and Biological Test Systems. ALTEX 30, 487–545. [DOI] [PubMed] [Google Scholar]
- (15).Yasumoto T, Igarashi T, Legrand A-M, Cruchet P, Chinain M, Fujita T, and Naoki H (2000) Structural Elucidation of Ciguatoxin Congeners by Fast-Atom Bombardment Tandem Mass Spectroscopy. J. Am. Chem. Soc 122 (20), 4988–4989. [Google Scholar]
- (16).Satake M, Ishibashi Y, Legrand A-M, and Yasumoto T (1996) Isolation and Structure of Ciguatoxin-4A, a New Ciguatoxin Precursor, from Cultures of Dinoflagellate Gambierdiscus toxicus and Parrotfish Scarus gibbus. Biosci., Biotechnol., Biochem 60 (12), 2103–2105. [DOI] [PubMed] [Google Scholar]
- (17).Tsubone K, Hashizume K, Fuwa H, and Sasaki M (2011) Studies toward the Total Synthesis of Gambieric Acids: Convergent Synthesis of the GHIJ-Ring Fragment Having a Side Chain. Tetrahedron Lett. 52, 548–551. [Google Scholar]
- (18).Lewis RJ, Sellin M, Poli MA, Norton RS, MacLeod JK, and Sheil MM (1991) Purification and Characterization of Ciguatoxins from Moray Eel (Lycodontis javanicus, Muraenidae). Toxicon 29 (9), 1115–1127. [DOI] [PubMed] [Google Scholar]
- (19).Satake M, Fukui M, Legrand A-M, Cruchet P, and Yasumoto T (1998) Isolation and Structures of New Ciguatoxin Analogs, 2,3-DihydroxyCTX3C and 51-HydroxyCTX3C, Accumulated in Tropical Reef Fish. Tetrahedron Lett. 39, 1197–1198. [Google Scholar]
- (20).Yogi K, Sakugawa S, Oshiro N, Ikehara T, Sugiyama K, and Yasumoto T (2014) Determination of Toxins Involved in Ciguatera Fish Poisoning in the Pacific by LC/MS. J. AOAC Int 97(2), 398–402. [DOI] [PubMed] [Google Scholar]
- (21).Morey JS, Ryan JC, Bottein Dechraoui M-Y, Rezvani AH, Levin ED, Gordon CJ, Ramsdell JS, and Van Dolah FM (2008) Liver Genomic Responses to Ciguatoxin: Evidence for Activation of Phase I and Phase II Detoxification Pathways Following an Acute Hypothermic Response in Mice. Toxicol. Sci 103 (2), 298–310. [DOI] [PubMed] [Google Scholar]
- (22).Ryan JC, Morey JS, Bottein M-YD, Ramsdell JS, and Van Dolah FM (2010) Gene Expression Profiling in Brain of Mice Exposed to the Marine Neurotoxin Ciguatoxin Reveals an Acute Anti-Inflammatory, Neuroprotective Response. BMC Neurosci. 11, 107. [DOI] [PMC free article] [PubMed] [Google Scholar]
- (23).Vernoux JP, and Lewis RJ (1997) Isolation and Characterisation of Caribbean Ciguatoxins from the Horse-Eye Jack (Caranx latus). Toxicon 35 (6), 889–900. [DOI] [PubMed] [Google Scholar]
- (24).Kryuchkov F, Robertson A, Miles CO, Mudge EM, and Uhlig S (2020) LC-HRMS and Chemical Derivatization Strategies for the Structure Elucidation of Caribbean Ciguatoxins. Mar. Drugs 18 (4), 182. [DOI] [PMC free article] [PubMed] [Google Scholar]
- (25).Hirama M, Oishi T, Uehara H, Inoue M, Maruyama M, Oguri H, and Satake M (2001) Total Synthesis of Ciguatoxin CTX3C. Science (Washington, DC, U. S.) 294, 1904–1907. [DOI] [PubMed] [Google Scholar]
- (26).Inoue M, Miyazaki K, Ishihara Y, Tatami A, Ohnuma Y, Kawada Y, Komano K, Yamashita S, Lee N, and Hirama M (2006) Total Synthesis of Ciguatoxin and 51-HydroxyCTX3C. J. Am. Chem. Soc 128, 9352–9354. [DOI] [PubMed] [Google Scholar]
- (27).Inoue M, Miyazaki K, Uehara H, Maruyama M, and Hirama M (2004) First- and Second-Generation Total Synthesis of Ciguatoxin CTX3C. Proc. Natl. Acad. Sci. U. S. A 101 (33), 12013–12018. [DOI] [PMC free article] [PubMed] [Google Scholar]
- (28).Boada LD, Zumbado M, Luzardo OP, Almeida-González M, Plakas SM, Granade HR, Abraham A, Jester ELE, and Dickey RW (2010) Ciguatera Fish Poisoning on the West Africa Coast: An Emerging Risk in the Canary Islands (Spain). Toxicon 56, 1516–1519. [DOI] [PubMed] [Google Scholar]
- (29).Estevez P, Castro D, Pequeño-Valtierra A, Leao JM, Vilariño O, Diogène J, and Gago-Martínez A (2019) An Attempt to Characterize the Ciguatoxin Profile in Seriola fasciata Causing Ciguatera Fish Poisoning in Macaronesia. Toxins 11 (4), 221. [DOI] [PMC free article] [PubMed] [Google Scholar]
- (30).Costa PR, Estevez P, Castro D, Soliño L, Gouveia N, Santos C, Rodrigues SM, Leao JM, and Gago-Martínez A (2018) New Insights into the Occurrence and Toxin Profile of Ciguatoxins in Selvagens Islands (Madeira, Portugal). Toxins 10 (12), 524. [DOI] [PMC free article] [PubMed] [Google Scholar]
- (31).Tester PA, Vandersea MW, Buckel CA, Kibler SR, Holland WC, Davenport ED, Clark RD, Edwards KF, Taylor JC, Pluym JLV, Hickerson EL, and Litaker RW (2013) Gambierdiscus (Dinophyceae) Species Diversity in the Flower Garden Banks National Marine Sanctuary, Northern Gulf of Mexico, USA. Harmful Algae 29, 1–9. [Google Scholar]
- (32).Villareal TA, Hanson S, Qualia S, Jester ELE, Granade HR, and Dickey RW (2007) Petroleum Production Platforms as Sites for the Expansion of Ciguatera in the Northwestern Gulf of Mexico. Harmful Algae 6, 253–259. [Google Scholar]
- (33).Uhlig S, Ivanova L, and Fæste CK (2013) Enzyme-Assisted Synthesis and Structural Characterization of the 3-, 8-, and 15-Glucuronides of Deoxynivalenol. J. Agric. Food Chem 61, 2006–2012. [DOI] [PubMed] [Google Scholar]
- (34).Johny A, Ivanova L, Knutsdatter Østbye T-K, and Fæste CK (2020) Biotransformation of Phytoestrogens from Soy in Enzymatically Characterized Liver Microsomes and Primary Hepatocytes of Atlantic Salmon. Ecotoxicol. Environ. Saf 197, 110611. [DOI] [PubMed] [Google Scholar]
- (35).Ivanova L, Fæste CK, Van Pamel E, Daeseleire E, Callebaut A, and Uhlig S (2014) Presence of Enniatin B and Its Hepatic Metabolites in Plasma and Liver Samples from Broilers and Eggs from Laying Hens. World Mycotoxin J. 7 (2), 167–175. [Google Scholar]
- (36).Lowry OH, Rosebrough NJ, Farr AL, and Randall RJ (1951) Protein Measurement with the Folin Phenol Reagent. J. Biol. Chem 193, 265–275. [PubMed] [Google Scholar]
- (37).Dzwonkowski B, Park K, Kyung Ha H, Graham WM, Hernandez FJ, and Powers SP (2011) Hydrographic Variability on a Coastal Shelf Directly Influenced by Estuarine Outflow. Cont. Shelf Res 31, 939–950. [Google Scholar]
- (38).Sayyari A, Uhlig S, Fæste CK, Framstad T, and Sivertsen T (2018) Transfer of Deoxynivalenol (DON) through Placenta, Colostrum and Milk from Sows to Their Offspring during Late Gestation and Lactation. Toxins 10, 517. [DOI] [PMC free article] [PubMed] [Google Scholar]
- (39).Pluskal T, Castillo S, Villar-Briones A, and Orešič M (2010) MZmine 2: Modular Framework for Processing, Visualizing, and Analyzing Mass Spectrometry-Based Molecular Profile Data. BMC Bioinf. 11, 395. [DOI] [PMC free article] [PubMed] [Google Scholar]
- (40).Chaikin SW, and Brown WG (1949) Reduction of Aldehydes, Ketones and Acid Chlorides by Sodium Borohydride. J. Am. Chem. Soc 71 (1), 122–125. [Google Scholar]
- (41).Uno T, Ishizuka M, and Itakura T (2012) Cytochrome P450 (CYP) in Fish. Environ. Toxicol. Pharmacol 34, 1–13. [DOI] [PubMed] [Google Scholar]
- (42).Clarke DJ, George SG, and Burchell B (1991) Glucuronidation in Fish. Aquat. Toxicol 20 (1–2), 35–56. [Google Scholar]
- (43).Wang Y, Huang H, and Wu Q (2014) Characterization of the Zebrafish Ugt Repertoire Reveals a New Class of Drug-Metabolizing UDP Glucuronosyltransferases. Mol. Pharmacol 86, 62–75. [DOI] [PubMed] [Google Scholar]
- (44).Huang H, and Wu Q (2010) Cloning and Comparative Analyses of the Zebrafish Ugt Repertoire Reveal Its Evolutionary Diversity. PLoS One 5 (2), e9144. [DOI] [PMC free article] [PubMed] [Google Scholar]
- (45).Goldstone JV, McArthur AG, Kubota A, Zanette J, Parente T, Jönsson ME, Nelson DR, and Stegeman JJ (2010) Identification and Developmental Expression of the Full Complement of Cytochrome P450 Genes in Zebrafish. BMC Genomics 11, 643. [DOI] [PMC free article] [PubMed] [Google Scholar]
- (46).Kittler K, Preiss-Weigert A, and These A (2010) Identification Strategy Using Combined Mass Spectrometric Techniques for Elucidation of Phase I and Phase II in Vitro Metabolites of Lipophilic Marine Biotoxins. Anal. Chem 82 (22), 9329–9335. [DOI] [PubMed] [Google Scholar]
- (47).García C, Rodriguez-Navarro A, Díaz JC, Torres R, and Lagos N (2009) Evidence of in Vitro Glucuronidation and Enzymatic Transformation of Paralytic Shellfish Toxins by Healthy Human Liver Microsomes Fraction. Toxicon 53, 206–213. [DOI] [PubMed] [Google Scholar]
- (48).García C, Barriga A, Díaz JC, Lagos M, and Lagos N (2010) Route of Metabolization and Detoxication of Paralytic Shellfish Toxins in Humans. Toxicon 55, 135–144. [DOI] [PubMed] [Google Scholar]
- (49).Bidard J-N, Vijverberg HPM, Frelin C, Chungue E, Legrand AM, Bagnis R, and Lazdunski M (1984) Ciguatoxin Is a Novel of Type of Na+ Channel Toxin. J. Biol. Chem 259 (13), 8353–8357. [PubMed] [Google Scholar]
- (50).Poli MA, Mende TJ, and Baden DG (1986) Brevetoxins, Unique Activators of Voltage-Sensitive Sodium Channels, Bind to Specific Sites in Rat Brain Synaptosomes. Mol. Pharmacol 30, 129–135. [PubMed] [Google Scholar]
- (51).Lombet A, Bidard J-N, and Lazdunski M (1987) Ciguatoxin and Brevetoxins Share a Common Receptor Site on the Neuronal Voltage-Dependent Na+ Channel. FEBS Lett. 219 (2), 355–359. [DOI] [PubMed] [Google Scholar]
- (52).Dechraoui M-Y, Naar J, Pauillac S, and Legrand A-M (1999) Ciguatoxins and Brevetoxins, Neurotoxic Polyether Compounds Active on Sodium Channels. Toxicon 37, 125–143. [DOI] [PubMed] [Google Scholar]
- (53).Li CY, Basit A, Gupta A, Gáborik Z, Kis E, and Prasad B (2019) Major Glucuronide Metabolites of Testosterone Are Primarily Transported by MRP2 and MRP3 in Human Liver, Intestine and Kidney. J. Steroid Biochem. Mol. Biol 191, 105350. [DOI] [PMC free article] [PubMed] [Google Scholar]
- (54).Järvinen E, Deng F, Kidron H, and Finel M (2018) Efflux Transport of Estrogen Glucuronides by Human MRP2, MRP3, MRP4 and BCRP. J. Steroid Biochem. Mol. Biol 178, 99–107. [DOI] [PubMed] [Google Scholar]
- (55).Khmiri I, Côté J, Mantha M, Khemiri R, Lacroix M, Gely C, Toutain PL, Picard-Hagen N, Gayrard V, and Bouchard M (2020) Toxicokinetics of Bisphenol-S and Its Glucuronide in Plasma and Urine Following Oral and Dermal Exposure in Volunteers for the Interpretation of Biomonitoring Data. Environ. Int 138, 105644. [DOI] [PubMed] [Google Scholar]
- (56).Ren G, Chen H, Zhang M, Yang N, Yang H, Xu C, Li J, Ning C, Song Z, Zhou S, Bian Y, Lu Y, Li N, Zhang Y, Chen X, and Zhao D (2020) Pharmacokinetics, Tissue Distribution and Excretion Study of Oroxylin A, Oroxylin A 7-O-Glucuronide and Oroxylin A Sodium Sulfonate in Rats after Administration of Oroxylin A. Fitoterapia 142, 104480. [DOI] [PubMed] [Google Scholar]
- (57).Fæste CK, Ivanova L, Sayyari A, Hansen U, Sivertsen T, and Uhlig S (2018) Prediction of Deoxynivalenol Toxicokinetics in Humans by in Vitro-to-in Vivo Extrapolation and Allometric Scaling of in Vivo Animal Data. Arch. Toxicol 92 (7), 2195–2216. [DOI] [PubMed] [Google Scholar]
- (58).Ivanova L, Uhlig S, Devreese M, Croubels S, and Fæste CK (2017) Biotransformation of the Mycotoxin Enniatin B1 in Pigs: A Comparative in Vitro and in Vivo Approach. Food Chem. Toxicol 105, 506–517. [DOI] [PubMed] [Google Scholar]
- (59).Uhlig S, Ivanova L, Voorspoels P, and Fæste CK (2020) In Vitro Toxicokinetics and Phase I Biotransformation of the Mycotoxin Penitrem A in Dogs. Toxins 12, 293. [DOI] [PMC free article] [PubMed] [Google Scholar]
- (60).Quod JP, and Turquet J (1996) Ciguatera in Réunion Island (SW Indian Ocean): Epidemiology and Clinical Patterns. Toxicon 34 (7), 779–785. [DOI] [PubMed] [Google Scholar]
- (61).Tosteson TR (1995) The Diversity and Origins of Toxins in Ciguatera Fish Poisoning. P. R. Health Sci. J 14 (2), 117–129. [PubMed] [Google Scholar]
- (62).Celis JS, and Mancera Pineda JE (2015) Historical Analysis of Ciguatera Incidence in the Caribbean Islands During 31 Years: 1980–2010. Boletín Investig. Mar. y Costeras-INVEMAR 44 (1), 7–32. [Google Scholar]
- (63).Skinner MP, Brewer TD, Johnstone R, Fleming LE, and Lewis RJ (2011) Ciguatera Fish Poisoning in the Pacific Islands (1998 to 2008). PLoS Neglected Trop. Dis 5 (12), e1416. [DOI] [PMC free article] [PubMed] [Google Scholar]
- (64).Vernoux JP, and Lejeune J (1994) Ciguatera in the French West Indies. Mem. Queensl Museum 34 (3), 631–638. [Google Scholar]
- (65).Loeffler CR, Robertson A, Flores Quintana HA, Silander MC, Smith TB, and Olsen D (2018) Ciguatoxin Prevalence in 4 Commercial Fish Species Along an Oceanic Exposure Gradient in the US Virgin Islands. Environ. Toxicol. Chem 37 (7), 1852–1863. [DOI] [PubMed] [Google Scholar]
- (66).Díaz-Asencio L, Clausing RJ, Vandersea M, Chamero-Lago D, Gómez-Batista M, Hernández-Albernas JI, Chomérat N, Rojas-Abrahantes G, Litaker RW, Tester P, Diogène J, Alonso-Hernández CM, and Dechraoui Bottein M-Y (2019) Ciguatoxin Occurrence in Food-Web Components of a Cuban Coral Reef Ecosystem: Risk-Assessment Implications. Toxins 11, 722. [DOI] [PMC free article] [PubMed] [Google Scholar]
- (67).Mackenzie PI, Walter Bock K, Burchell B, Guillemette C, Ikushiro S.-i., Iyanagi T, Miners JO, Owens IS, and Nebert DW (2005) Nomenclature Update for the Mammalian UDP Glycosyltransferase (UGT) Gene Superfamily. Pharmacogenet. Genomics 15 (10), 677–685. [DOI] [PubMed] [Google Scholar]
- (68).Hossen V, Soliño L, Leroy P, David E, Velge P, Dragacci S, Krys S, Flores Quintana H, and Diogène J (2015) Contribution to the Risk Characterization of Ciguatoxins: LOAEL Estimated from Eight Ciguatera Fish Poisoning Events in Guadeloupe (French West Indies). Environ. Res 143, 100–108. [DOI] [PubMed] [Google Scholar]
- (69).de la Torre R, and Farré M (2004) Neurotoxicity of MDMA (Ecstasy): The Limitations of Scaling from Animals to Humans. Trends Pharmacol. Sci 25 (10), 505–508. [DOI] [PubMed] [Google Scholar]
- (70).Turesky RJ (2005) Interspecies Metabolism of Heterocyclic Aromatic Amines and the Uncertainties in Extrapolation of Animal Toxicity Data for Human Risk Assessment. Mol. Nutr. Food Res 49, 101–117. [DOI] [PubMed] [Google Scholar]
Associated Data
This section collects any data citations, data availability statements, or supplementary materials included in this article.