

Key Points
Question
What are the experiences of residents in general surgery programs with regard to gender discrimination and sexual harassment?
Findings
In this survey study of 6764 residents enrolled in 301 general surgery programs across the US, 80% of women and 17% of men reported experiencing gender discrimination, and 43% of women and 22% of men reported experiencing sexual harassment. The types and sources of discrimination and harassment and their associated factors varied.
Meaning
This study’s findings suggest that gender discrimination and sexual harassment are common experiences among residents in general surgery programs; these phenomena warrant multifaceted context-specific strategies for improvement.
Abstract
Importance
Mistreatment is a common experience among surgical residents and is associated with burnout. Women have been found to experience mistreatment at higher rates than men. Further characterization of surgical residents’ experiences with gender discrimination and sexual harassment may inform solutions.
Objective
To describe the types, sources, and factors associated with (1) discrimination based on gender, gender identity, or sexual orientation and (2) sexual harassment experienced by residents in general surgery programs across the US.
Design, Setting, and Participants
This cross-sectional national survey study was conducted after the 2019 American Board of Surgery In-Training Examination (ABSITE). The survey asked respondents about their experiences with gender discrimination and sexual harassment during the academic year starting July 1, 2018, through the testing date in January 2019. All clinical residents enrolled in general surgery programs accredited by the Accreditation Council for Graduate Medical Education were eligible.
Exposures
Specific types, sources, and factors associated with gender-based discrimination and sexual harassment.
Main Outcomes and Measures
Primary outcome was the prevalence of gender discrimination and sexual harassment. Secondary outcomes included sources of discrimination and harassment and associated individual- and program-level factors using gender-stratified multivariable logistic regression models.
Results
The survey was administered to 8129 eligible residents; 6956 responded (85.6% response rate)from 301 general surgery programs. Of those, 6764 residents had gender data available (3968 [58.7%] were male and 2796 [41.3%] were female individuals). In total, 1878 of 2352 female residents (79.8%) vs 562 of 3288 male residents (17.1%) reported experiencing gender discrimination (P < .001), and 1026 of 2415 female residents (42.5%) vs 721 of 3360 male residents (21.5%) reported experiencing sexual harassment (P < .001). The most common type of gender discrimination was being mistaken for a nonphysician (1943 of 5640 residents [34.5%] overall; 1813 of 2352 female residents [77.1%]; 130 of 3288 male residents [4.0%]), with patients and/or families as the most frequent source. The most common form of sexual harassment was crude, demeaning, or explicit comments (1557 of 5775 residents [27.0%] overall; 901 of 2415 female residents [37.3%]; 656 of 3360 male residents [19.5%]); among female residents, the most common source of this harassment was patients and/or families, and among male residents, the most common source was coresidents and/or fellows. Among female residents, gender discrimination was associated with pregnancy (odds ratio [OR], 1.93; 95% CI, 1.03-3.62) and higher ABSITE scores (highest vs lowest quartile: OR, 1.67; 95% CI, 1.14-2.43); among male residents, gender discrimination was associated with parenthood (OR, 1.72; 95% CI, 1.31-2.27) and lower ABSITE scores (highest vs lowest quartile: OR, 0.57; 95% CI, 0.43-0.76). Senior residents were more likely to report experiencing sexual harassment than interns (postgraduate years 4 and 5 vs postgraduate year 1: OR, 1.77 [95% CI, 1.40-2.24] among female residents; 1.31 [95% CI, 1.01-1.70] among male residents).
Conclusions and Relevance
In this study, gender discrimination and sexual harassment were common experiences among surgical residents and were frequently reported by women. These phenomena warrant multifaceted context-specific strategies for improvement.
This survey study characterizes the types, sources, and factors associated with discrimination based on gender, gender identity, or sexual orientation and sexual harassment experiences among residents in general surgery programs across the US.
Introduction
Gender discrimination, defined as unequal treatment that individuals experience based on their gender,1 is prevalent in academia, particularly in fields, such as surgery, with a predominance of men, hierarchical relationships, and substantial one-on-one time between trainees and supervisors.2,3,4 Although experts consider gender discrimination to be a type of sexual harassment,2,5 many people colloquially consider sexual harassment to be inappropriate conduct that is strictly sexual in nature.6 Among physicians, gender discrimination and sexual harassment have been associated with career dissatisfaction,3,4 decreased self-confidence,7 depression, and suicidal ideation.4 Discrimination and harassment likely have a role in the relative underrepresentation of women in full professorships8 and leadership positions in health care9,10 despite gender parity in medical school acceptances,11 which may further exacerbate the cycle of gender bias leading to discrimination.9,12,13
Because trainees are subject to a power differential, they are at increased risk of discrimination and harassment.2,4,6 A pooled meta-analysis revealed that 66.6% of residents reported experiencing gender discrimination, and 36.2% reported experiencing sexual harassment.14 In a previous study, 65.1% of female surgical residents reported experiencing gender discrimination, and 19.9% reported experiencing sexual harassment.15 No definitions of discrimination and harassment were provided,15 which may have contributed to lower mistreatment rates than previously reported,2,14,16 although those studies were limited by sample size and response rate.17,18,19 In addition to underestimating prevalence, a lack of granular detail limited the interpretation and actionability of the previous studies’ findings.
A better understanding of the nature of these experiences and the associated individual- and/or program-level factors is needed to successfully intervene. Thus, we sought to fully characterize the gender discrimination and sexual harassment experienced by residents in general surgery programs across the US by (1) querying specific behavior types, (2) identifying the sources of these specific behaviors, and (3) evaluating associated resident and program-level factors.
Methods
Participants
A confidential, optional closed-ended survey was offered to all 8907 residents in US general surgery programs accredited by the Accreditation Council for Graduate Medical Education who took the 2019 American Board of Surgery In-Training Examination (ABSITE).20 The survey was administered in January 2019 and queried respondents about the academic year starting on July 1, 2018. The American Board of Surgery deidentified survey responses before transferring the data for analysis.15,21 Residents who were not in a clinically active year of training or who did not have gender data available through the American Board of Surgery were excluded. This study was deemed exempt from review by the Northwestern University Institutional Review Board because of the use of deidentified data. The survey was prefaced by a statement explaining that its purpose was research and that responses would be deidentified. The delivery software was constructed so that participants could exit the survey at any time.
Survey Development
The survey evaluated aspects of the learning environment and respondents’ well-being. Because no single comprehensive instrument was available to evaluate gender discrimination and sexual harassment, items were developed and adapted based on a comprehensive review of the literature. Previously validated instruments22,23,24 were used when applicable. Survey items were evaluated for clarity and cohesion using a sample of research residents in general surgery programs across the US and iteratively revised until coherence consensus was achieved.20,21
Resident and Program Characteristics
Information regarding residents’ gender (obtained from the field labeled “gender” on the examination registration form, with response options of male or female) and postgraduate year (PGY-1, PGY-2/3, or PGY-4/5) were provided by the American Board of Surgery. Residents were queried regarding their relationship status (married, not married but in a relationship, not married and not in a relationship [single], divorced/separated, or widowed), number of children younger than 18 years (0, 1, 2, 3, 4, or ≥5, aggregated into any children vs no children), and whether they or their partner were pregnant, expecting a child, or adopting a child during the academic year (July 2018-January 2019). Respondents’ 2019 ABSITE scores were reported in quartiles.
Gender data were aggregated at the program level, and the proportion of each residency program that was female was reported in quartiles (with quartile 1 indicating <34.4%, quartile 2 indicating 34.4%-42.3%, quartile 3 indicating 42.5%-49.1%, and quartile 4 indicating ≥50.0%). Data on program size (based on the total number of residents in general surgery programs and reported by quartiles, with quartile 1 indicating <26, quartile 2 indicating 26-36, quartile 3 indicating 37-50, and quartile 5 indicating ≥51), program type (university, independent, or military), and program location (Northeast, Southeast, Midwest, Southwest, and West) were provided by the American Board of Surgery.
The Accreditation Council for Graduate Medical Education provided information about each program’s department chair and program director, and their genders were ascertained through a review of publicly available biographies. The Association of American Medical Colleges provided counts of active surgical faculty by gender for medical schools that participated in their faculty roster. The proportion of faculty that identified as female was calculated for each program and reported by quartiles (with quartile 1 indicating <19.5%, quartile 2 indicating 19.5%-23.6%, quartile 3 indicating 23.7%-26.9%, and quartile 4 indicating ≥27.0%). Programs with more than 1 medical school affiliation were assigned to the listed primary affiliate.
Outcome Measures
Specified types of discrimination based on gender, gender identity, and/or sexual orientation included (1) experiencing different standards of evaluation (eg, lowered expectations, need to work harder to achieve the same success as others, unfair punishment, or less respect of my opinions),18,25 (2) being denied opportunities (eg, allocation of cases, attendance at conferences, career options, opportunities for advancement, or mentorship),3,18,25,26 (3) being mistaken for a nonphysician,27 (4) being subject to slurs and/or hurtful, humiliating, negative, or uncomfortable comments, even when purported as jokes,18,24 (5) feeling socially isolated (eg, excluded from social events or malicious gossip),18 (6) being advised against having children during residency,28 and (7) feeling like my/my partner’s pregnancy or childcare needs led to negative reactions from coworkers and/or the program.28,29 If residents reported experiencing any of these feelings or behaviors within the academic year (July 2018-January 2019) before survey administration, they were considered to have experienced gender discrimination. Analyses of gender discrimination based on pregnancy and childcare needs were restricted to residents who indicated that they were pregnant, expecting a child, adopting a child, and/or had a minor child.
Specified types of sexual harassment included (1) being subject to crude, sexually demeaning, or explicit remarks, stories, or jokes18,24,26,30,31; (2) having unwanted sexual imagery or materials sent or shown to you24,30; (3) receiving unwanted verbal sexual attention (eg, comments, flirtations, or sexual advances)18,24,26,30; (4) offensive body language (eg, leering or standing too close)25,26,30; (5) receiving unwanted physical sexual attention (eg, inappropriate or uncomfortable touching or attempts to touch, fondle, or kiss)18,24,25,26,30; and (6) sexual coercion (eg, bribed or threatened to engage in sexual behavior or suggestion of better treatment if sexually cooperative).7,24,26,30 If residents reported experiencing any of these behaviors within the academic year (July 2018-January 2019) before survey administration, they were considered to have experienced sexual harassment.
For each reported behavior, residents were queried regarding the frequency (never, a few times per year, once per month or less, a few times per month, once per week, a few times per week, or every day) and source (patients and/or families [patients/families], attending physicians, administrators, coresidents and/or fellows [coresidents/fellows], or nurses and/or support staff [nurses/staff]). Frequency analyses were restricted to residents who reported experiencing any type of gender discrimination or sexual harassment. Respondents who reported experiencing a particular behavior but did not answer the source question were classified as having an unidentified source for that behavior.
Statistical Analysis
χ2 tests adjusted for program-level clustering were used to compare male and female residents regarding (1) resident and program characteristics, (2) proportion of residents reporting each type of discrimination or harassment, (3) proportion of residents reporting any behavior consistent with either discrimination or harassment, and (4) frequency of discrimination or harassment. The most common source of each behavior was reported by gender. Respondents with missing data were excluded from the analyses.
Gender-stratified multivariable logistic regression analyses with robust SEs adjusted for program-level clustering were used to estimate the association of individual- and program-level factors with gender discrimination and sexual harassment. The proportion of residents within each program who reported experiencing discrimination or harassment was calculated. Pearson correlation analysis was used to assess program-level correlations between the rates of discrimination or harassment and the proportion of female residents. All statistical analyses were 2-sided with a predetermined significance threshold of P < .05. Analyses were performed using Stata software, version 14.2 (StataCorp LLC).
Results
Among 8907 total residents in general surgery programs across the US, 778 residents were excluded because they were not clinically active. The remaining 8129 residents were eligible for inclusion, of whom 6956 responded (85.6% response rate). A total of 192 residents were excluded based on the absence of gender data, resulting in a final sample of 6764 residents from 301 general surgery programs. Of those, 3968 residents (58.7%) were male and 2796 (41.3%) were female. The proportion of female residents was higher in junior years (709 of 1687 residents [42.0%] in PGY-1 vs 1160 of 2689 residents [43.1%] in PGY-2/3 vs 927 of 2388 residents [38.8%] in PGY-4/5; P = .006). Compared with their male colleagues, female residents were less frequently married (1950 of 3920 men [49.7%] vs 886 of 2761 women [32.1%]; P < .001), had a minor child (946 of 3914 men [24.2%] vs 286 of 2758 women [10.4%]; P < .001), or were pregnant or expecting a child (568 of 3908 men [14.5%] vs 170 of 2757 women [6.2%]; P < .001). Large programs had a higher proportion of female residents (eg, largest vs smallest quartile: 717 of 1587 residents [45.2%] vs 635 of 1771 residents [35.9%]; P < .001), as did university programs (eg, 1691 of 3869 residents [43.7%] vs 1039 of 2708 residents [38.4%] in independent programs; P < .001) and programs with higher proportions of female faculty (eg, highest vs lowest quartile: 638 of 1452 residents [43.9%] vs 599 of 1529 residents [39.2%]; P = .04) (Table 1).
Table 1. Demographic Characteristics of 2019 ABSITE Respondents.
| Characteristic | Respondents, No./total No. (%) | P value | ||
|---|---|---|---|---|
| All (N = 6764) | Male individuals (n = 3968) | Female individuals (n = 2796) | ||
| Clinical postgraduate levela | ||||
| Intern (PGY-1) | 1687/6764 (24.9) | 978/1687 (58.0) | 709/1687 (42.0) | .006 |
| Junior (PGY-2/3) | 2689/6764 (39.8) | 1529/2689 (56.9) | 1160/2689 (43.1) | |
| Senior (PGY-4/5) | 2388/6764 (35.3) | 1461/2388 (61.2) | 927/2388 (38.8) | |
| Relationship statusb | ||||
| Married | 2836/6681 (42.4) | 1950/3920 (49.7) | 886/2761 (32.1) | <.001 |
| Not married but in a relationship | 2134/6681 (31.9) | 1191/3920 (30.4) | 943/2761 (34.2) | |
| Not in a relationship | 1588/6681 (23.8) | 719/3920 (18.3) | 869/2761 (31.5) | |
| Divorced or widowed | 123/6681 (1.8) | 60/3920 (1.5) | 63/2761 (2.3) | |
| Minor childc | ||||
| No | 5440/6672 (81.5) | 2968/3914 (75.8) | 2472/2758 (89.6) | <.001 |
| Yes | 1232/6672 (18.5) | 946/3914 (24.2) | 286/2758 (10.4) | |
| Pregnant or expecting a childd | ||||
| No | 5927/6665 (88.9) | 3340/3908 (85.5) | 2587/2757 (93.8) | <.001 |
| Yes | 738/6665 (11.1) | 568/3908 (14.5) | 170/2757 (6.2) | |
| 2019 ABSITE score | ||||
| Quartile 1 (lowest) | 1758/6764 (26.0) | 914/3968 (23.0) | 844/2796 (30.2) | <.001 |
| Quartile 2 | 1634/6764 (24.2) | 872/3968 (22.0) | 762/2796 (27.3) | |
| Quartile 3 | 1698/6764 (25.1) | 997/3968 (25.1) | 701/2796 (25.1) | |
| Quartile 4 (highest) | 1674/6764 (24.7) | 1185/3968 (29.9) | 489/2796 (17.5) | |
| Program sizee | ||||
| Quartile 1 (<26 residents) | 1771/6764 (26.2) | 1136/1771 (64.1) | 635/1771 (35.9) | <.001 |
| Quartile 2 (26-36 residents) | 1703/6764 (25.2) | 1004/1703 (59.0) | 699/1703 (41.0) | |
| Quartile 3 (37-50 residents) | 1703/6764 (25.2) | 958/1703 (56.3) | 745/1703 (43.7) | |
| Quartile 4 (≥51 residents) | 1587/6764 (23.5) | 870/1587 (54.8) | 717/1586 (45.2) | |
| Program typee | ||||
| University | 3869/6764 (57.2) | 2178/3869 (56.3) | 1691/3869 (43.7) | <.001 |
| Independent | 2708/6764 (40.0) | 1669/2708 (61.6) | 1039/2708 (38.4) | |
| Military | 187/6764 (2.8) | 121/187 (64.7) | 66/187 (35.3) | |
| Program locationa | ||||
| Northeast | 2259/6764 (33.4) | 1333/2259 (59.0) | 926/2259 (41.0) | .25 |
| Southeast | 1322/6764 (19.5) | 790/1322 (59.8) | 532/1322 (40.2) | |
| Midwest | 1491/6764 (22.0) | 889/1491 (59.6) | 602/1491 (40.4) | |
| Southwest | 791/6764 (11.7) | 456/791 (57.6) | 335/791 (42.4) | |
| West | 901/6764 (13.3) | 500/901 (55.5) | 401/901 (44.5) | |
| Gender of department chaire,f | ||||
| Male | 5754/6514 (88.3) | 3385/5754 (58.8) | 2369/5754 (41.2) | .05 |
| Female | 760/6514 (11.7) | 419/760 (55.1) | 341/760 (44.9) | |
| Gender of program directore,g | ||||
| Male | 4820/6225 (77.4) | 2860/4820 (59.3) | 1960/4820 (40.7) | .05 |
| Female | 1405/6225 (22.6) | 793/1405 (56.4) | 612/1405 (43.6) | |
| Female residents, % | ||||
| Quartile 1 (<34.4) | 1745/6764 (25.8) | 1282/3968 (32.3) | 463/2796 (16.6) | <.001 |
| Quartile 2 (34.4-42.3) | 1822/6764 (26.9) | 1115/3968 (28.1) | 707/2796 (25.3) | |
| Quartile 3 (42.5-49.1) | 1565/6764 (23.1) | 851/3968 (21.4) | 714/2796 (25.5) | |
| Quartile 4 (50.0-75.0) | 1632/6764 (24.1) | 720/3968 (18.1) | 912/2796 (32.6) | |
| Female faculty, %e,h | ||||
| Quartile 1 (<19.5) | 1529/5841 (26.2) | 930/1529 (60.8) | 599/1529 (39.2) | .04 |
| Quartile 2 (19.5-23.6) | 1475/5841 (25.3) | 876/1475 (59.4) | 599/1475 (40.6) | |
| Quartile 3 (23.7-26.9) | 1385/5841 (23.7) | 794/1385 (57.3) | 591/1385 (42.7) | |
| Quartile 4 (≥27.7) | 1452/5841 (24.9) | 814/1452 (56.1) | 638/1452 (43.9) | |
Abbreviations: ABSITE, American Board of Surgery In-Training Examination; PGY, postgraduate year.
Percentages in this category were calculated across rows.
Data missing for 83 respondents.
Data missing for 92 respondents.
Data missing for 99 respondents.
Percentages in this category were calculated across rows.
Data missing for 250 respondents from 20 programs.
Data missing for 539 respondents from 42 programs.
Data missing for 923 respondents from 63 programs.
Of the 5640 residents (3288 men and 2352 women) who responded to questions regarding gender discrimination, 2440 residents (43.3%) reported experiencing at least 1 of the listed discriminatory behaviors. The most common type of gender discrimination was being mistaken for a nonphysician (1943 residents [34.5%]). Compared with male residents, female residents were more likely to experience discrimination overall (562 men [17.1%] vs 1878 women [79.8%]; P < .001), including every discrimination subtype (eg, being mistaken for a nonphysician: 130 men [4.0%] vs 1813 women [77.1%]; P < .001; different standards of evaluation: 307 men [9.3%] vs 1014 women [43.1%]; P < .001). Among residents who reported experiencing gender discrimination, women had more frequent experiences (eg, weekly or greater: 1241 of 1878 women [66.1%] vs 86 of 562 men [15.3%]; P < .001) (Table 2). The most common type of discrimination among male residents was a negative reaction to pregnancy and childcare needs (104 of 1000 men [10.4%]); however, this type of discrimination was more common among female residents (131 of 328 women [39.9%]; P < .001), with coresidents/fellows reported as the most frequent source. Among female residents who reported being advised not to have children or experiencing different standards of evaluation or denial of opportunities, the most common source was attending physicians; among those who reported being mistaken for a nonphysician, the most common source was patients/families. Among women who reported feeling socially isolated or experiencing negative reactions to pregnancy and childcare needs, the most common source was coresidents/fellows (Table 3).
Table 2. Types, Prevalence, and Frequency of Gender Discrimination and Sexual Harassment.
| Category | Residents, No./total No. (%) | P value | ||
|---|---|---|---|---|
| All | Male individuals | Female individuals | ||
| Gender discrimination | ||||
| Total respondents, No. | 5640 | 3288 | 2352 | NA |
| Behavior typea | ||||
| Different standards of evaluation | 1321/5640 (23.4) | 307/3288 (9.3) | 1014/2352 (43.1) | <.001 |
| Denied opportunities | 699/5640 (12.4) | 202/3288 (6.1) | 497/2352 (21.1) | <.001 |
| Mistaken for a nonphysician | 1943/5640 (34.5) | 130/3288 (4.0) | 1813/2352 (77.1) | <.001 |
| Slurs or negative comments | 739/5640 (13.1) | 162/3288 (4.9) | 577/2352 (24.5) | <.001 |
| Socially isolated | 471/5640 (8.4) | 154/3288 (4.7) | 317/2352 (13.5) | <.001 |
| Advised not to have children | 819/5640 (14.5) | 124/3288 (3.8) | 695/2352 (29.7) | <.001 |
| Negative reactions to pregnancy or childcare needsb | 235/1328 (17.7) | 104/1000 (10.4) | 131/328 (39.9) | <.001 |
| Prevalence of any type of gender discrimination | 2440/5640 (43.3) | 562/3288 (17.1) | 1878/2352 (79.8) | <.001 |
| Frequency of any type of gender discrimination | ||||
| A few occurrences/y | 443/2440 (18.2) | 280/562 (49.8) | 163/1878 (8.7) | <.001 |
| Monthly | 249/2440 (10.2) | 103/562 (18.3) | 146/1878 (7.8) | |
| A few occurrences/mo | 421/2440 (17.3) | 93/562 (16.5) | 328/1878 (17.5) | |
| Weekly | 316/2440 (13.0) | 27/562 (4.8) | 289/1878 (15.4) | |
| A few occurrences/wk | 546/2440 (22.4) | 23/562 (4.1) | 523/1878 (27.8) | |
| Daily | 465/2440 (19.1) | 36/562 (6.4) | 429/1878 (22.8) | |
| Sexual harassment | ||||
| Total respondents, No. | 5775 | 3360 | 2415 | NA |
| Behavior typec | ||||
| Crude, demeaning, or explicit comments | 1557/5775 (27.0) | 656/3360 (19.5) | 901/2415 (37.3) | <.001 |
| Unwanted sexual imagery | 261/5775 (4.5) | 123/3360 (3.7) | 138/2415 (5.7) | .001 |
| Unwanted verbal sexual attention | 744/5775 (12.9) | 213/3360 (6.3) | 531/2415 (22.0) | <.001 |
| Offensive body language | 608/5775 (10.5) | 188/3360 (5.6) | 420/2415 (17.4) | <.001 |
| Unwanted physical sexual attention | 246/5775 (4.3) | 100/3360 (3.0) | 146/2415 (6.0) | <.001 |
| Sexual coercion | 69/5775 (1.2) | 47/3360 (1.4) | 22/2415 (0.9) | .14 |
| Prevalence of any type of sexual harassment | 1747/5775 (30.3) | 721/3360 (21.5) | 1026/2415 (42.5) | <.001 |
| Frequency of any type of sexual harassment | ||||
| A few occurrences/y | 933/1747 (53.4) | 363/721 (50.3) | 570/1026 (55.6) | .009 |
| Monthly | 303/1747 (17.3) | 114/721 (15.8) | 189/1026 (18.4) | |
| A few occurrences/mo | 265/1747 (15.2) | 120/721 (16.6) | 145/1026 (14.1) | |
| Weekly | 98/1747 (5.6) | 44/721 (6.1) | 54/1026 (5.3) | |
| A few occurrences/wk | 115/1747 (6.6) | 60/721 (8.3) | 55/1026 (5.4) | |
| Daily | 33/1747 (1.9) | 20/721 (2.8) | 13/1026 (1.3) | |
Abbreviation: NA, not applicable.
Among the 5640 respondents who answered any question regarding gender discrimination. Missing data: different standards of evaluation (n = 5), denied opportunities (n = 11), mistaken for a nonphysician (n = 31), slurs or negative comments (n = 21), socially isolated (n = 41), and advised not to have children (n = 31).
Among the 1533 respondents who reported having a minor child or expecting a child during the academic year (July 2018-January 2019), 1328 individuals responded to the question regarding childcare discrimination.
Among the 5775 respondents who answered any question regarding sexual harassment. Missing data: crude, demeaning, or explicit comments (n = 3), unwanted sexual imagery (n = 9), unwanted verbal sexual attention (n = 16), offensive body language (n = 31), unwanted physical sexual attention (n = 4), and sexual coercion (n = 5).
Table 3. Most Common Sources of Gender Discrimination and Sexual Harassment.
| Category | Source of discrimination or harassment (No./total No. [%] of respondents) | |
|---|---|---|
| Male respondents | Female respondents | |
| Gender discrimination | ||
| Behavior type | ||
| Different standards of evaluationa | Attending physicians (163/307 [53.1]) | Attending physicians (579/1014 [57.1]) |
| Denied opportunitiesa | Attending physicians (87/202 [43.1]) | Attending physicians (300/497 [60.4]) |
| Mistaken for a nonphysiciana | Patients/families (58/130 [44.6]) | Patients/families (1467/1813 [80.9]) |
| Slurs or negative commentsa | Unidentified (56/162 [34.6]) | Unidentified (222/577 [38.5%]) |
| Socially isolateda | Coresidents/fellows (72/154 [46.8]) | Coresidents/fellows (167/317 [52.7]) |
| Advised not to have childrena | Attending physicians (51/124 [41.1]) | Attending physicians (342/695 [49.2]) |
| Negative reactions to pregnancy or childcare needsb | Coresidents/fellows (47/104 [45.2]) | Coresidents/fellows (71/131 [54.2]) |
| Sexual harassment | ||
| Behavior typec | ||
| Crude, demeaning, or explicit commentsc | Coresidents/fellows (233/656 [35.5]) | Patients/families (251/900 [27.9]) |
| Unwanted sexual imageryc | Unidentified (54/123 [43.9]) | Coresidents/fellows (49/138 [35.5]) |
| Unwanted verbal sexual attentionc | Nurses/support staff (77/213 [36.2]) | Patients/families (262/531 [49.3]) |
| Offensive body languagec | Unidentified (71/188 [37.8]) | Patients/families (120/420 [28.6]) |
| Unwanted physical sexual attentionc | Unidentified (46/100 [46.0]) | Unidentified (36/146 [24.7]) |
| Sexual coercionc | Unidentified (32/47 [68.1]) | Unidentified (10/22 [45.5]) |
Analysis limited to surgical residents who reported experiencing this type of gender discrimination.
Among surgical residents with a minor child or pregnant/expecting a child during the academic year (July 2018-January 2019) who reported experiencing this type of gender discrimination.
Analysis limited to surgical residents who reported experiencing this type of sexual harassment.
Among 5775 residents (3360 men and 2415 women) who answered questions regarding sexual harassment, 1747 residents (30.3%) reported experiencing at least 1 listed behavior. The most common type of sexual harassment was crude, demeaning, or explicit comments (1557 residents [27.0%]). More female residents reported experiencing harassment overall (1026 women [42.5%] vs 721 men [21.5%]; P < .001), including most of the harassment subtypes (eg, crude, demeaning, or explicit comments: 901 women [37.3%] vs 656 men [19.5%]; P < .001; unwanted verbal sexual attention: 531 women [22.0%] vs 213 men [6.3%]; P < .001; offensive body language: 420 women [17.4%] vs 188 men [5.6%]; P < .001), with the exception of sexual coercion, for which there was no statistically significant difference (22 women [0.9%] vs 47 men [1.4%]; P = .14). Among residents who reported experiencing sexual harassment, men had more frequent experiences (eg, weekly or greater: 124 of 721 men [17.2%] vs 122 of 1026 women [11.9%]; P = .009) (Table 2). Sources of harassment varied by gender and behavior (Table 3). Among female residents who reported experiencing unwanted verbal sexual attention, offensive body language, and crude, demeaning, or explicit comments, the most common source was patients/families; among those who experienced unwanted sexual imagery, the most common source was coresidents/fellows. Among male residents who reported experiencing crude, demeaning, or explicit comments, the most common source was coresidents/fellows; among those who experienced unwanted verbal sexual attention, the most common source was nurses/staff.
After adjusting for individual- and program-level factors, women were more likely to report experiencing gender discrimination if they were pregnant or expecting a child (89.9% vs 80.1% among those not pregnant or expecting a child; odds ratio [OR], 1.93; 95% CI, 1.03-3.62) or had higher ABSITE scores (eg, highest vs lowest quartile: 84.6% vs 77.3%; OR, 1.67; 95% CI, 1.14-2.43). Men were more likely to report experiencing gender discrimination if they had lower ABSITE scores (eg, highest vs lowest quartile: 14.0% vs 21.8%; OR, 0.57; 95% CI, 0.43-0.76), had a minor child (23.9% vs 15.5% among those without a minor child; OR, 1.72; 95% CI, 1.31-2.27), or were training in the Northeast (eg, 19.7% vs 15.6% among those training in the Southeast; OR, 1.37; 95% CI, 1.00-1.88). No other factors, including gender of leadership and gender distribution of residents or faculty, were associated with discrimination (Table 4).
Table 4. Resident and Program-Level Factors Associated With Gender Discrimination and Sexual Harassment Experienced by Male and Female Surgical Residents.
| Factor | Gender discrimination | Sexual harassment | ||||||||||
|---|---|---|---|---|---|---|---|---|---|---|---|---|
| Female residents (n = 1989)a | Male residents (n = 2732)a | Female residents (n = 2040)b | Male residents (n = 2790)b | |||||||||
| Rate | OR (95% CI) | P value | Rate | OR (95% CI) | P value | Rate | OR (95% CI) | P value | Rate | OR (95% CI) | P value | |
| Resident characteristics | ||||||||||||
| Clinical postgraduate level | ||||||||||||
| Intern (PGY-1) | 77.9 | 1 [Reference] | NA | 15.7 | 1 [Reference] | NA | 35.8 | 1 [Reference] | NA | 18.8 | 1 [Reference] | NA |
| Junior (PGY-2/3) | 80.8 | 1.24 (0.93-1.63) | .14 | 17.9 | 1.15 (0.88-1.50) | .30 | 43.2 | 1.42 (1.11-1.82) | .005 | 20.7 | 1.11 (0.87-1.42) | .39 |
| Senior (PGY-4/5) | 82.4 | 1.28 (0.93-1.76) | .13 | 18.3 | 1.04 (0.79-1.36) | .78 | 48.8 | 1.77 (1.40-2.24) | <.001 | 24.4 | 1.31 (1.01-1.70) | .04 |
| Relationship status | ||||||||||||
| Married | 83.6 | 1 [Reference] | NA | 19.2 | 1 [Reference] | NA | 44.8 | 1 [Reference] | NA | 22.7 | 1 [Reference] | NA |
| Not married but in a relationship | 78.8 | 0.84 (0.61-1.13) | .25 | 15.9 | 1.04 (0.79-1.38) | .76 | 42.8 | 1.02 (0.80-1.30) | .89 | 21.6 | 1.11 (0.87-1.42) | .39 |
| Not in a relationship | 79.5 | 0.89 (0.64-1.23) | .48 | 15.8 | 1.03 (0.74-1.42) | .88 | 41.9 | 0.99 (0.78-1.25) | .93 | 18.9 | 0.96 (0.72-1.27) | .77 |
| Divorced or widowed | 83.7 | 1.16 (0.48-2.83) | .74 | 16.7 | 0.84 (0.40-1.76) | .64 | 51.9 | 1.40 (0.80-2.44) | .24 | 27.9 | 1.30 (0.69-2.46) | .41 |
| Minor child | ||||||||||||
| No | 80.3 | 1 [Reference] | NA | 15.5 | 1 [Reference] | NA | 42.9 | 1 [Reference] | NA | 20.5 | 1 [Reference] | NA |
| Yes | 84.2 | 0.97 (0.61-1.55) | .89 | 23.9 | 1.72 (1.31-2.27) | <.001 | 47.4 | 1.06 (0.77-1.47) | .71 | 25.4 | 1.25 (0.96-1.62) | .09 |
| Pregnant or expecting a childc | ||||||||||||
| No | 80.1 | 1 [Reference] | NA | 16.7 | 1 [Reference] | NA | 43.2 | 1 [Reference] | NA | 21.3 | 1 [Reference] | NA |
| Yes | 89.9 | 1.93 (1.03-3.62) | .04 | 22.6 | 1.22 (0.92-1.62) | .17 | 46.5 | 0.97 (0.64-1.47) | .87 | 24.2 | 1.05 (0.81-1.37) | .70 |
| ABSITE score | ||||||||||||
| Quartile 1 (lowest) | 77.3 | 1 [Reference] | NA | 21.8 | 1 [Reference] | NA | 41.6 | 1 [Reference] | NA | 21.0 | 1 [Reference] | NA |
| Quartile 2 | 81.7 | 1.31 (0.95-1.80) | .10 | 18.9 | 0.83 (0.63-1.10) | .19 | 43.3 | 1.09 (0.85-1.38) | .50 | 22.0 | 1.04 (0.75-1.43) | .81 |
| Quartile 3 | 80.6 | 1.26 (0.92-1.74) | .15 | 17.7 | 0.77 (0.56-1.04) | .08 | 41.5 | 1.02 (0.79-1.31) | .90 | 24.9 | 1.23 (0.93-1.61) | .14 |
| Quartile 4 (highest) | 84.6 | 1.67 (1.14-2.43) | .008 | 14.0 | 0.57 (0.43-0.76) | <.001 | 49.2 | 1.40 (1.07-1.83) | .01 | 19.6 | 0.88 (0.66-1.19) | .42 |
| Program-level characteristics | ||||||||||||
| Program size | ||||||||||||
| Quartile 1 (<26 residents) | 78.9 | 1 [Reference] | NA | 18.2 | 1 [Reference] | NA | 46.0 | 1 [Reference] | NA | 23.0 | 1 [Reference] | NA |
| Quartile 2 (26-36 residents) | 79.9 | 0.92 (0.60-1.40) | .69 | 15.7 | 0.85 (0.59-1.22) | .38 | 39.5 | 0.79 (0.56-1.13) | .19 | 21.5 | 0.93 (0.67-1.29) | .65 |
| Quartile 3 (37-50 residents) | 79.9 | 0.94 (0.60-1.46) | .78 | 19.2 | 1.16 (0.82-1.66) | .40 | 42.1 | 0.84 (0.57-1.24) | .39 | 21.9 | 0.90 (0.61-1.31) | .57 |
| Quartile 4 (≥51 residents) | 83.4 | 1.11 (0.66-1.85) | .70 | 17.3 | 1.03 (0.68-1.55) | .89 | 46.9 | 1.00 (0.67-1.50) | .99 | 20.7 | 0.81 (0.53-1.24) | .33 |
| Program type | ||||||||||||
| University | 81.8 | 1 [Reference] | NA | 17.2 | 1 [Reference] | NA | 44.0 | 1 [Reference] | NA | 21.9 | 1 [Reference] | NA |
| Independent | 78.6 | 0.87 (0.62-1.20) | .39 | 18.1 | 1.26 (0.93-1.70) | .14 | 42.0 | 0.92 (0.67-1.25) | .59 | 21.2 | 0.89 (0.66-1.21) | .47 |
| Military | 77.8 | 0.69 (0.13-3.74) | .67 | 19.2 | 1.55 (0.63-3.86) | .34 | 55.6 | 1.89 (1.02-3.48) | .04 | 30.8 | 1.57 (0.58-4.25) | .38 |
| Program location | ||||||||||||
| Southeast | 81.6 | 1 [Reference] | NA | 15.6 | 1 [Reference] | NA | 40.1 | 1 [Reference] | NA | 20.7 | 1 [Reference] | NA |
| Northeast | 78.9 | 0.84 (0.58-1.21) | .35 | 19.7 | 1.37 (1.00-1.88) | .05 | 44.7 | 1.18 (0.87-1.60) | .30 | 22.5 | 1.18 (0.89-1.56) | .25 |
| Midwest | 79.2 | 0.79 (0.54-1.17) | .24 | 16.7 | 1.13 (0.80-1.60) | .48 | 43.8 | 1.07 (0.77-1.47) | .70 | 23.3 | 1.21 (0.90-1.62) | .21 |
| Southwest | 84.8 | 1.25 (0.77-2.02) | .36 | 17.2 | 1.16 (0.79-1.68) | .45 | 42.8 | 1.08 (0.73-1.61) | .69 | 20.4 | 1.03 (0.72-1.46) | .89 |
| West | 81.7 | 0.95 (0.62-1.46) | .82 | 17.0 | 1.11 (0.74-1.67) | .60 | 45.2 | 1.17 (0.82-1.66) | .39 | 19.5 | 0.96 (0.65-1.41) | .83 |
| Gender of department chair | ||||||||||||
| Male | 80.7 | 1 [Reference] | NA | 17.1 | 1 [Reference] | NA | 43.7 | 1 [Reference] | NA | 21.7 | 1 [Reference] | NA |
| Female | 80.6 | 0.85 (0.57-1.28) | .44 | 21.5 | 1.37 (0.99-1.89) | .06 | 41.0 | 0.83 (0.62-1.10) | .19 | 22.1 | 1.09 (0.81-1.47) | .57 |
| Gender of program director | ||||||||||||
| Male | 80.3 | 1 [Reference] | NA | 17.9 | 1 [Reference] | NA | 42.8 | 1 [Reference] | NA | 21.9 | 1 [Reference] | NA |
| Female | 81.9 | 1.11 (0.80-1.54) | .54 | 16.5 | 0.86 (0.65-1.15) | .32 | 45.2 | 1.06 (0.84-1.34) | .61 | 21.1 | 0.94 (0.72-1.25) | .69 |
| Female residents, % | ||||||||||||
| Quartile 1 (<34.4) | 79.7 | 1 [Reference] | NA | 15.6 | 1 [Reference] | NA | 46.6 | 1 [Reference] | NA | 20.4 | 1 [Reference] | NA |
| Quartile 2 (34.4-42.3) | 82.6 | 1.23 (0.83-1.82) | .30 | 19.0 | 1.27 (0.96-1.68) | .10 | 46.2 | 0.97 (0.72-1.33) | .87 | 24.4 | 1.28 (0.97-1.69) | .08 |
| Quartile 3 (42.5-49.1) | 79.1 | 0.98 (0.67-1.41) | .90 | 18.5 | 1.24 (0.92-1.67) | .15 | 40.5 | 0.79 (0.58-1.09) | .16 | 20.6 | 1.00 (0.74-1.36) | .98 |
| Quartile 4 (50.0-75.0) | 81.1 | 1.06 (0.74-1.52) | .74 | 17.5 | 1.18 (0.85-1.64) | .32 | 42.3 | 0.82 (0.60-1.11) | .19 | 21.4 | 1.13 (0.84-1.54) | .41 |
| Female faculty, % | ||||||||||||
| Quartile 1 (<19.5) | 78.9 | 1 [Reference] | NA | 17.5 | 1 [Reference] | NA | 39.7 | 1 [Reference] | NA | 21.5 | 1 [Reference] | NA |
| Quartile 2 (19.5-23.6) | 80.7 | 1.07 (0.75-1.53) | .70 | 17.1 | 1.01 (0.73-1.41) | .93 | 44.9 | 1.26 (0.94-1.70) | .12 | 22.2 | 1.04 (0.76-1.42) | .80 |
| Quartile 3 (23.7-26.9) | 79.8 | 0.95 (0.68-1.34) | .78 | 16.5 | 0.99 (0.74-1.34) | .97 | 42.9 | 1.10 (0.81-1.49) | .53 | 21.1 | 1.00 (0.74-1.35) | .99 |
| Quartile 4 (≥27.7) | 83.2 | 1.19 (0.87-1.62) | .28 | 19.3 | 1.19 (0.85-1.66) | .30 | 45.7 | 1.33 (1.01-1.75) | .04 | 22.1 | 1.02 (0.70-1.47) | .94 |
Abbreviations: NA, not applicable; OR, odds ratio; PGY, postgraduate year.
Among 5640 respondents who answered any question regarding gender discrimination, 363 female residents and 556 male residents were excluded based on missing demographic or program-level data.
Among 5775 respondents who answered any question regarding sexual harassment, 375 female residents and 570 male residents were excluded based on missing demographic or program-level data.
Pregnant or expecting a child during the academic year (July 2018-January 2019).
Sexual harassment experiences were more likely to be reported by women in PGY-2/3 (43.2%) vs PGY-1 (35.8%; OR, 1.42; 95% CI, 1.11-1.82) or PGY-4/5 (48.8%; OR, 1.77; 95% CI, 1.40-2.24), women with higher ABSITE scores (eg, highest vs lowest quartile: 49.2% vs 41.6%; OR, 1.40; 95% CI, 1.07-1.83), women in military programs (eg, 55.6% vs 44.0% among those in university programs; OR, 1.89; 95% CI, 1.02-3.48), and women in programs with higher proportions of female faculty (eg, highest vs lowest quartile: 45.7% vs 39.7%; OR, 1.33; 95% CI, 1.01-1.75). Among male residents, sexual harassment was associated with seniority (eg, PGY-4/5 vs PGY-1: 24.4% vs 18.8%; OR, 1.31; 95% CI, 1.01-1.70). No other individual or programmatic factors, including the gender of leadership and gender distribution of residency programs, were associated with harassment (Table 4).
Program-level rates ranged from 0% to 88.9% for gender discrimination (median, 42.9%; interquartile range [IQR], 33.3%-52.1%) and 0% to 80.0% for sexual harassment (median, 29.8%; IQR, 20.0%-38.2%). The gender composition of residency programs was highly correlated with program-level rates of gender discrimination (r = 0.64; 95% CI, 0.56-0.70) but minimally correlated with program-level rates of sexual harassment (r = 0.17; 95% CI, 0.06-0.28) (Figure).
Figure. Program-Level Correlation of Gender Discrimination and Sexual Harassment Experiences with the Percentage of Female Residents.
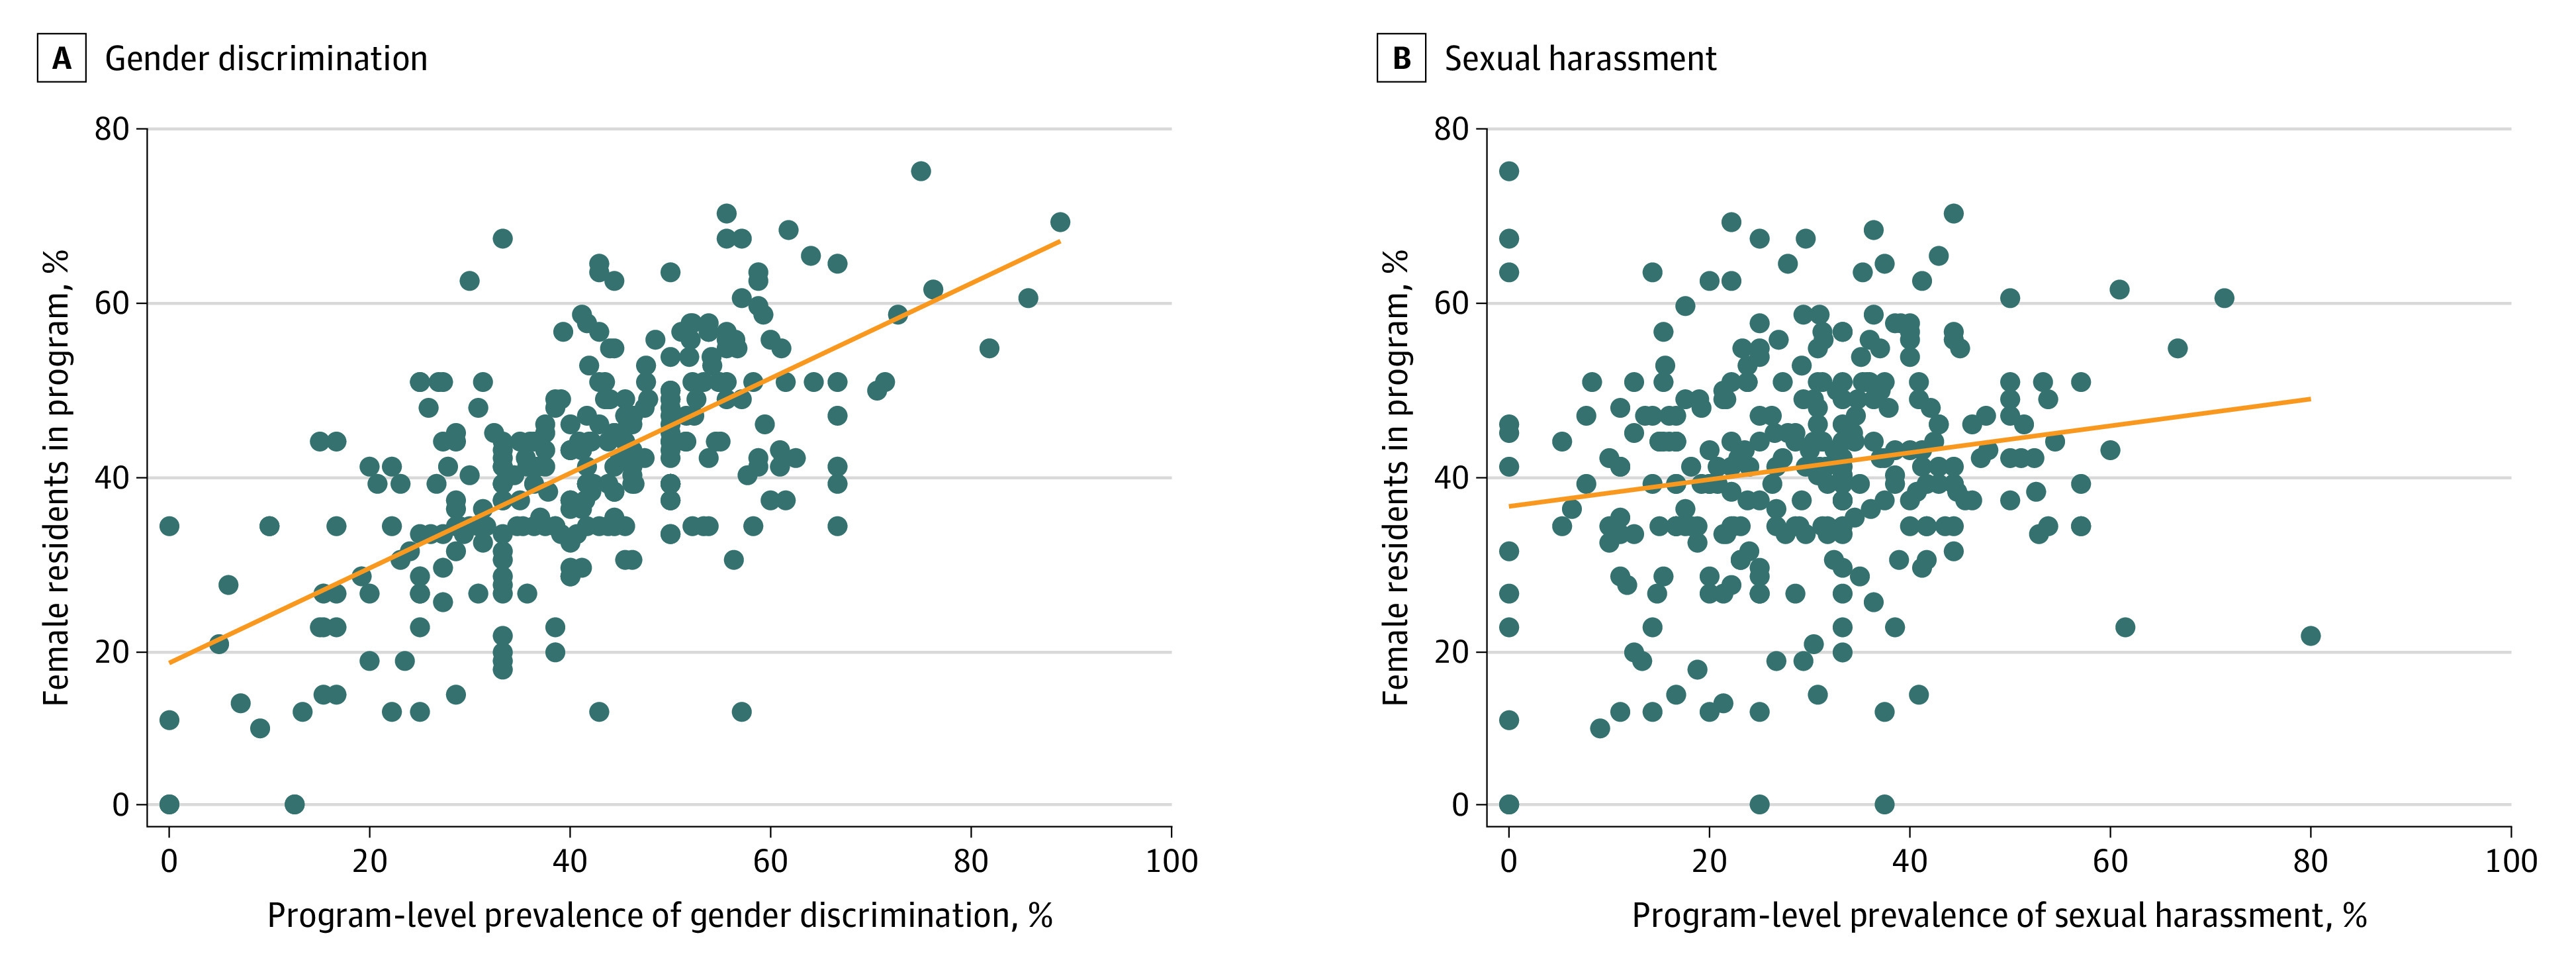
Each blue dot represents a general surgery program. The orange line represents the Pearson correlation line of best fit.
Discussion
To our knowledge, this survey study of gender discrimination and sexual harassment experiences among a large sample of residents in general surgery programs with a high response rate represents the most comprehensive analysis of gender discrimination and sexual harassment in any field of medicine. A total of 80.0% of female residents reported experiencing gender discrimination and 42.5% reported experiencing sexual harassment, with lower but substantial reporting of discrimination and harassment by male residents and wide program-level variability. Sources of gender discrimination and sexual harassment varied by behavior and residents’ gender. These data may provide insight to individuals working toward gender equity in the medical field.
The gender discrimination and sexual harassment rates identified by querying specific behaviors were higher than those calculated by pooled estimates in a meta-analysis14 and those of a previous survey study wherein respondents self-defined the terms.15 Because gender biases in the medical field are often insidious,32,33,34,35 the provision of defined terms and types of bias in the present survey may have allowed more accurate recollection. In addition to increasing the accuracy of prevalence estimates, the enumeration of specific behaviors provided a more comprehensive characterization of the experience of discrimination and harassment. The most common form of gender discrimination reported by female residents was being mistaken for a nonphysician. Consistent with findings from previous studies,36,37,38 the most common source of this microaggression was patients/families. Although less egregious than other forms of mistreatment (eg, inappropriate touching), microaggressions can negatively impact cognition39 and have substantial cumulative consequences for clinicians.32,34 Attending physicians were the most common source of gender discrimination based on opportunities and evaluation; this finding is consistent with previous studies reporting decreased opportunities for operative autonomy for female residents40 as well as more rapid progression through the Accreditation Council for Graduate Medical Education milestones41 and a greater number of awards given to male residents.42 Such gender discrimination has important potential consequences for clinical competence and career advancement.
Male residents also experience gender discrimination and sexual harassment, albeit less frequently than women.7,15 The most common harassment behavior reported by men was crude, sexually demeaning, or explicit remarks, stories, or jokes, and the most common source of this behavior was coresidents/fellows. These findings suggest that sexual humor among health care professionals, particularly among peers, is ubiquitous.38,43 Unwanted verbal sexual attention was the second most prevalent type of harassment reported by men, with nurses/staff identified as the most common source. Men may not label these behaviors as harassment, particularly given the difference in context (eg, the lack of a power differential), compared with that of their female colleagues.43 This factor may contribute to the underreporting observed in a previous study,15 in which behavioral prompts were not provided. Although some may question the utility of investigating events in which the person reporting the behavior does not feel harassed, such behaviors are clearly unprofessional.
Gender discrimination experiences were more likely to be reported by pregnant women and men with a minor child. Negative reactions to pregnancy or childcare needs were reported by 39.9% of women and were the most common type of gender discrimination reported by men. Bias against parenthood in the field of surgery, particularly toward women, has previously been reported28,29,44; however, these studies were limited by small sample sizes, incalculable response rates, and the requirement for surgeons to recall experiences over the course of their careers rather than a single academic year. Women in the field of surgery have reported being explicitly and implicitly discouraged from becoming pregnant during training; 15% of surgical program directors admit to advising against pregnancy during training, and 61% believe that parenthood negatively impacts women’s work (compared with 34% for men).28 Such discrimination may contribute to unequal personal sacrifices, which women may feel are necessary to train as physicians.45,46 Consistent with previous work,47,48,49 the present study found that female residents were less likely to be married, have a minor child, or be expecting a child compared with their male counterparts. Eliminating discrimination against parents of both genders is important because discrimination may create incentives for male physicians to take less active parenting roles44,50 and may exacerbate gender stereotyping at work.
Female residents with the highest ABSITE scores were more likely to report experiencing gender discrimination and sexual harassment, whereas male residents with low ABSITE scores were more likely to report experiencing gender discrimination. These differences may be associated with gender stereotypes. Confidence and assertiveness, which one might expect in high-performing surgical residents, are often perceived positively in men but negatively in women.51 In addition, male surgical residents may be more susceptible to stereotype threat, which is the risk of confirming negative stereotypes52; in a multi-institutional randomized study of surgical residents,52 evoking pro-male stereotypes was reported to improve engagement among men, whereas exposing men to data supporting gender neutrality was reported to worsen their technical performance. The loss of gender advantage may therefore adversely impact male performance on examinations or, alternatively, men with lower examination scores may perceive a loss of dominance as discrimination.53,54 Regardless of gender, senior residents were more likely to report experiencing sexual harassment, potentially associated with increased familiarity that blurs professional boundaries and/or increased one-on-one interactions.
At the program level, gender distribution was correlated with rates of gender discrimination. The capacity to recognize behaviors as discriminatory may improve with increasing numbers of women in the workplace. However, the correlation between the proportion of female residents and sexual harassment was minimal. Characteristics of local context (eg, organizational policies or the societal norms of the surrounding community) that were not reflected in the evaluated program variables may, at least in part, explain this finding. Nonetheless, considerable program-level variation in rates of gender discrimination and sexual harassment suggests that improvement is possible.
The Surgical Education Culture Optimization Through Targeted Interventions Based on National Comparative Data (SECOND) clinical trial,55 a cluster-randomized study of 215 general surgical residency programs across the US, was recently initiated. In this trial, residency programs in the intervention arm receive aggregated reports of their residents’ perceptions of various aspects of the learning environment (in which mistreatment is a prominent feature) compared with other programs in the country. In addition, these programs receive access to a toolkit of ready-to-implement interventions (eg, programmatic and institutional practices, policies, and infrastructure) to improve the learning environment. These data will inform protocols on recognizing, coping, and responding to gender discrimination and sexual harassment. In the interim, Sexual Harassment of Women, published by the National Academies of Sciences, Engineering, and Medicine in 2018,2 includes several chapters with action items.
Limitations
This study has several limitations. First, the data originate from surgical residents and therefore may not be generalizable to residents who are training in other specialties. Second, the survey was administered after the ABSITE examination, which may have subjected respondents to recall biases associated with either postexamination anxiety or elation. Third, despite assurances of survey confidentiality, residents may have been reluctant to report sensitive exposures, producing underestimations of prevalence. Fourth, respondents selected only 1 source for each behavior, which simplified analyses but likely underestimated the pervasiveness of mistreatment. Fifth, we inquired about discrimination based on gender, gender identity, or sexual orientation because these concepts are intricately associated56; as a consequence, it was not possible to distinguish, for example, discrimination experienced by straight cisgendered women from that experienced by lesbian cisgendered women or by individuals who identify as nonbinary.
Conclusions
This study’s results suggest that gender discrimination and sexual harassment are common among surgical residents, originate from variable sources, and are associated with different individual- and program-level factors. These data may be used to inform interventions to mitigate gender discrimination and sexual harassment, which is a necessary step toward gender equity in health care.
References
- 1.Lenhart SA. Clinical Aspects of Sexual Harassment and Gender Discrimination: Psychological Consequences and Treatment Interventions. 1st ed. Routledge; 2004. doi: 10.4324/9780203493335 [DOI] [Google Scholar]
- 2.National Academies of Sciences, Engineering, and Medicine. Sexual Harassment of Women: Climate, Culture, and Consequences in Academic Sciences, Engineering, and Medicine. The National Academies Press; 2018. doi:10.17226/24994 [PubMed] [Google Scholar]
- 3.Carr PL, Ash AS, Friedman RH, et al. Faculty perceptions of gender discrimination and sexual harassment in academic medicine. Ann Intern Med. 2000;132(11):889-896. doi: 10.7326/0003-4819-132-11-200006060-00007 [DOI] [PubMed] [Google Scholar]
- 4.Frank E, Brogan D, Schiffman M. Prevalence and correlates of harassment among US women physicians. Arch Intern Med. 1998;158(4):352-358. doi: 10.1001/archinte.158.4.352 [DOI] [PubMed] [Google Scholar]
- 5.US Equal Employment Opportunity Commission. Sexual harassment. US Equal Opportunity Employment Commission; 2020. Accessed April 15, 2020. https://www.eeoc.gov/laws/types/sexual_harassment.cfm
- 6.Dzau VJ, Johnson PA. Ending sexual harassment in academic medicine. N Engl J Med. 2018;379(17):1589-1591. doi: 10.1056/NEJMp1809846 [DOI] [PubMed] [Google Scholar]
- 7.Jagsi R, Griffith KA, Jones R, Perumalswami CR, Ubel P, Stewart A. Sexual harassment and discrimination experiences of academic medical faculty. JAMA. 2016;315(19):2120-2121. doi: 10.1001/jama.2016.2188 [DOI] [PMC free article] [PubMed] [Google Scholar]
- 8.Jena AB, Khullar D, Ho O, Olenski AR, Blumenthal DM. Sex differences in academic rank in US medical schools in 2014. JAMA. 2015;314(11):1149-1158. doi: 10.1001/jama.2015.10680 [DOI] [PMC free article] [PubMed] [Google Scholar]
- 9.D’Armiento J, Witte SS, Dutt K, Wall M, McAllister G; Columbia University Senate Commission on the Status of Women . Achieving women’s equity in academic medicine: challenging the standards. Lancet. 2019;393(10171):e15-e16. doi: 10.1016/S0140-6736(19)30234-X [DOI] [PubMed] [Google Scholar]
- 10.Lautenberger D, Raezer C, Bunton SA. The underrepresentation of women in leadership positions at U.S. medical schools: February 2015 analysis in brief. Association of American Medical Colleges; 2015. Accessed May 2020. https://www.aamc.org/data-reports/analysis-brief/report/underrepresentation-women-leadership-positions-us-medical-schools
- 11.Association of American Medical Colleges . Total U.S. medical school enrollment by race/ethnicity (alone) and sex, 2015-2016 through 2019-2020. Association of American Medical Colleges; 2020. Accessed May 2020. https://www.aamc.org/data-reports/students-residents/interactive-data/2020-facts-enrollment-graduates-and-md-phd-data
- 12.Shaw SM, Bothwell M, Furman K, et al. Advancing women in STEM: institutional transformation. Lancet. 2019;393(10171):e17-e18. doi: 10.1016/S0140-6736(19)30206-5 [DOI] [PubMed] [Google Scholar]
- 13.Choo EK, Byington CL, Johnson NL, Jagsi R. From #MeToo to #TimesUp in health care: can a culture of accountability end inequity and harassment? Lancet. 2019;393(10171):499-502. doi: 10.1016/S0140-6736(19)30251-X [DOI] [PubMed] [Google Scholar]
- 14.Fnais N, Soobiah C, Chen MH, et al. Harassment and discrimination in medical training: a systematic review and meta-analysis. Acad Med. 2014;89(5):817-827. doi: 10.1097/ACM.0000000000000200 [DOI] [PubMed] [Google Scholar]
- 15.Hu YY, Ellis RJ, Hewitt DB, et al. Discrimination, abuse, harassment, and burnout in surgical residency training. N Engl J Med. 2019;381(18):1741-1752. doi: 10.1056/NEJMsa1903759 [DOI] [PMC free article] [PubMed] [Google Scholar]
- 16.Hu YY, Ellis RJ, Bilimoria KY. Mistreatment and burnout in surgical residency training. N Engl J Med. 2020;382(6):582-583. [DOI] [PubMed] [Google Scholar]
- 17.Freedman-Weiss MR, Chiu AS, Heller DR, et al. Understanding the barriers to reporting sexual harassment in surgical training. Ann Surg. 2020;271(4):608-613. doi: 10.1097/SLA.0000000000003295 [DOI] [PubMed] [Google Scholar]
- 18.Crebbin W, Campbell G, Hillis DA, Watters DA. Prevalence of bullying, discrimination and sexual harassment in surgery in Australasia. ANZ J Surg. 2015;85(12):905-909. doi: 10.1111/ans.13363 [DOI] [PubMed] [Google Scholar]
- 19.Bruce AN, Battista A, Plankey MW, Johnson LB, Marshall MB. Perceptions of gender-based discrimination during surgical training and practice. Med Educ Online. 2015;20:25923. doi: 10.3402/meo.v20.25923 [DOI] [PMC free article] [PubMed] [Google Scholar]
- 20.Bilimoria KY, Chung JW, Hedges LV, et al. Development of the Flexibility in Duty Hour Requirements for Surgical Trainees (FIRST) trial protocol: a national cluster-randomized trial of resident duty hour policies. JAMA Surg. 2016;151(3):273-281. doi: 10.1001/jamasurg.2015.4990 [DOI] [PubMed] [Google Scholar]
- 21.Bilimoria KY, Chung JW, Hedges LV, et al. National cluster-randomized trial of duty-hour flexibility in surgical training. N Engl J Med. 2016;374(8):713-727. doi: 10.1056/NEJMoa1515724 [DOI] [PubMed] [Google Scholar]
- 22.Maslach C, Jackson SE, Leiter MP. Maslach Burnout Inventory Manual. 4th ed. Mind Garden; 2016. [Google Scholar]
- 23.McManus IC, Winder BC, Gordon D. The causal links between stress and burnout in a longitudinal study of UK doctors. Lancet. 2002;359(9323):2089-2090. doi: 10.1016/S0140-6736(02)08915-8 [DOI] [PubMed] [Google Scholar]
- 24.Stark S, Chernyshenko OS, Lancaster AR, Drasgow F, Fitzgerald LF. Toward standardized measurement of sexual harassment: shortening the SEQ-DoD using item response theory. Mil Psychol. 2002;14(1):49-72. doi: 10.1207/S15327876MP1401_03 [DOI] [Google Scholar]
- 25.Cook DJ, Liutkus JF, Risdon CL, Griffith LE, Guyatt GH, Walter SD. Residents’ experiences of abuse, discrimination and sexual harassment during residency training: McMaster University residency training programs. CMAJ. 1996;154(11):1657-1665. [PMC free article] [PubMed] [Google Scholar]
- 26.Nagata-Kobayashi S, Maeno T, Yoshizu M, Shimbo T. Universal problems during residency: abuse and harassment. Med Educ. 2009;43(7):628-636. doi: 10.1111/j.1365-2923.2009.03388.x [DOI] [PubMed] [Google Scholar]
- 27.Boge LA, Dos Santos C, Moreno-Walton LA, Cubeddu LX, Farcy DA. The relationship between physician/nurse gender and patients’ correct identification of health care professional roles in the emergency department. J Womens Health (Larchmt). 2019;28(7):961-964. doi: 10.1089/jwh.2018.7571 [DOI] [PubMed] [Google Scholar]
- 28.Sandler BJ, Tackett JJ, Longo WE, Yoo PS. Pregnancy and parenthood among surgery residents: results of the first nationwide survey of general surgery residency program directors. J Am Coll Surg. 2016;222(6):1090-1096. doi: 10.1016/j.jamcollsurg.2015.12.004 [DOI] [PubMed] [Google Scholar]
- 29.Rangel EL, Smink DS, Castillo-Angeles M, et al. Pregnancy and motherhood during surgical training. JAMA Surg. 2018;153(7):644-652. doi: 10.1001/jamasurg.2018.0153 [DOI] [PMC free article] [PubMed] [Google Scholar]
- 30.Fitzgerald LF, Gelfand MJ, Drasgow F. Measuring sexual harassment: theoretical and psychometric advances. Basic Appl Soc Psychol. 1995;17(4):425-445. doi: 10.1207/s15324834basp1704_2 [DOI] [Google Scholar]
- 31.Richman JA, Flaherty JA, Rospenda KM. Perceived workplace harassment experiences and problem drinking among physicians: broadening the stress/alienation paradigm. Addiction. 1996;91(3):391-403. doi: 10.1111/j.1360-0443.1996.tb02288.x [DOI] [PubMed] [Google Scholar]
- 32.Torres MB, Salles A, Cochran A. Recognizing and reacting to microaggressions in medicine and surgery. JAMA Surg. 2019;154(9):868-872. doi: 10.1001/jamasurg.2019.1648 [DOI] [PubMed] [Google Scholar]
- 33.Files JA, Mayer AP, Ko MG, et al. Speaker introductions at internal medicine grand rounds: forms of address reveal gender bias. J Womens Health (Larchmt). 2017;26(5):413-419. doi: 10.1089/jwh.2016.6044 [DOI] [PubMed] [Google Scholar]
- 34.Pololi LH, Jones SJ. Women faculty: an analysis of their experiences in academic medicine and their coping strategies. Gend Med. 2010;7(5):438-450. doi: 10.1016/j.genm.2010.09.006 [DOI] [PubMed] [Google Scholar]
- 35.Liang R, Dornan T, Nestel D. Why do women leave surgical training? a qualitative and feminist study. Lancet. 2019;393(10171):541-549. doi: 10.1016/S0140-6736(18)32612-6 [DOI] [PubMed] [Google Scholar]
- 36.Viglianti EM, Oliverio AL, Meeks LM. Sexual harassment and abuse: when the patient is the perpetrator. Lancet. 2018;392(10145):368-370. doi: 10.1016/S0140-6736(18)31502-2 [DOI] [PMC free article] [PubMed] [Google Scholar]
- 37.Phillips SP, Schneider MS. Sexual harassment of female doctors by patients. N Engl J Med. 1993;329(26):1936-1939. doi: 10.1056/NEJM199312233292607 [DOI] [PubMed] [Google Scholar]
- 38.Vargas EA, Brassel ST, Cortina LM, Settles IH, Johnson TRB, Jagsi R. #MedToo: a large-scale examination of the incidence and impact of sexual harassment of physicians and other faculty at an academic medical center. J Womens Health (Larchmt). 2020;29(1):13-20. doi: 10.1089/jwh.2019.7766 [DOI] [PubMed] [Google Scholar]
- 39.Dovidio JF, Gaertner SL, Kawakami K, Hodson G. Why can’t we just get along? interpersonal biases and interracial distrust. Cultur Divers Ethnic Minor Psychol. 2002;8(2):88-102. doi: 10.1037/1099-9809.8.2.88 [DOI] [PubMed] [Google Scholar]
- 40.Meyerson SL, Odell DD, Zwischenberger JB, et al. ; Procedural Learning and Safety Collaborative . The effect of gender on operative autonomy in general surgery residents. Surgery. 2019;166(5):738-743. doi: 10.1016/j.surg.2019.06.006 [DOI] [PMC free article] [PubMed] [Google Scholar]
- 41.Dayal A, O’Connor DM, Qadri U, Arora VM. Comparison of male vs female resident milestone evaluations by faculty during emergency medicine residency training. JAMA Intern Med. 2017;177(5):651-657. doi: 10.1001/jamainternmed.2016.9616 [DOI] [PMC free article] [PubMed] [Google Scholar]
- 42.Kuo LE, Lyu HG, Jarman MP, et al. Gender disparity in awards in general surgery residency programs. JAMA Surg. 2020;156(1):60-66. doi: 10.1001/jamasurg.2020.3518 [DOI] [PMC free article] [PubMed] [Google Scholar]
- 43.Farkas AH, Scholcoff C, Machen JL, et al. The experience of male physicians with sexual and gender-based harassment: a qualitative study. J Gen Intern Med. 2020;35(8):2383-2388. doi: 10.1007/s11606-020-05695-4 [DOI] [PMC free article] [PubMed] [Google Scholar]
- 44.Kin C, Yang R, Desai P, Mueller C, Girod S. Female trainees believe that having children will negatively impact their careers: results of a quantitative survey of trainees at an academic medical center. BMC Med Educ. 2018;18(1):260. doi: 10.1186/s12909-018-1373-1 [DOI] [PMC free article] [PubMed] [Google Scholar]
- 45.Stentz NC, Griffith KA, Perkins E, Jones RD, Jagsi R. Fertility and childbearing among American female physicians. J Womens Health (Larchmt). 2016;25(10):1059-1065. doi: 10.1089/jwh.2015.5638 [DOI] [PubMed] [Google Scholar]
- 46.Marshall AL, Arora VM, Salles A. Physician fertility: a call to action. Acad Med. 2020;95(5):679-681. doi: 10.1097/ACM.0000000000003079 [DOI] [PubMed] [Google Scholar]
- 47.Troppmann KM, Palis BE, Goodnight JEJ Jr, Ho HS, Troppmann C. Women surgeons in the new millennium. Arch Surg. 2009;144(7):635-642. doi: 10.1001/archsurg.2009.120 [DOI] [PubMed] [Google Scholar]
- 48.Altieri MS, Salles A, Bevilacqua LA, et al. Perceptions of surgery residents about parental leave during training. JAMA Surg. 2019;154(10):952-958. doi: 10.1001/jamasurg.2019.2985 [DOI] [PMC free article] [PubMed] [Google Scholar]
- 49.Turner PL, Lumpkins K, Gabre J, Lin MJ, Liu X, Terrin M. Pregnancy among women surgeons: trends over time. Arch Surg. 2012;147(5):474-479. doi: 10.1001/archsurg.2011.1693 [DOI] [PubMed] [Google Scholar]
- 50.Parsons WL, Duke PS, Snow P, Edwards A. Physicians as parents: parenting experiences of physicians in Newfoundland and Labrador. Can Fam Physician. 2009;55(8):808-809. [PMC free article] [PubMed] [Google Scholar]
- 51.Carnes M, Bartels CM, Kaatz A, Kolehmainen C. Why is John more likely to become department chair than Jennifer? Trans Am Clin Climatol Assoc. 2015;126:197-214. [PMC free article] [PubMed] [Google Scholar]
- 52.Myers SP, Dasari M, Brown JB, et al. Effects of gender bias and stereotypes in surgical training: a randomized clinical trial. JAMA Surg. 2020;155(7):552-560. doi: 10.1001/jamasurg.2020.1127 [DOI] [PMC free article] [PubMed] [Google Scholar]
- 53.Manzi F. Are the processes underlying discrimination the same for women and men? a critical review of congruity models of gender discrimination. Front Psychol. 2019;10:469. doi: 10.3389/fpsyg.2019.00469 [DOI] [PMC free article] [PubMed] [Google Scholar]
- 54.Dover TL, Major B, Kaiser CR. Members of high-status groups are threatened by pro-diversity organizational messages. J Exp Soc Psychol. 2016;62:58-67. doi: 10.1016/j.jesp.2015.10.006 [DOI] [Google Scholar]
- 55.The surgical education culture optimization through targeted interventions based on national comparative data—the SECOND trial. ClinicalTrials.gov identifier: NCT03739723. Updated March 22, 2021. Accessed June 14, 2021. https://www.clinicaltrials.gov/ct2/show/NCT03739723
- 56.Roselli CE. Neurobiology of gender identity and sexual orientation. J Neuroendocrinol. 2018;30(7):e12562. doi: 10.1111/jne.12562 [DOI] [PMC free article] [PubMed] [Google Scholar]