

Abstract
This paper introduces methods to estimate aspects of physical activity and sedentary behavior from three-axis accelerometer data collected with a wrist-worn device at a sampling rate of 32 [Hz] on adults with type 1 diabetes (T1D) in free-living conditions. In particular, we present two methods able to detect and grade activity based on its intensity and individual fitness as sedentary, mild, moderate or vigorous, and a method that performs activity classification in a supervised learning framework to predict specific user behaviors. Population results for activity level grading show multi-class average accuracy of 99.99%, precision of 98.0±2.2%, recall of 97.9±3.5% and F1 score of 0.9±0.0. As for the specific behavior prediction, our best performing classifier, gave population multi-class average accuracy of 92.43±10.32%, precision of 92.94±9.80%, recall of 92.20±10.16% and F1 score of 92.56±9.94%. Our investigation showed that physical activity and sedentary behavior can be detected, graded and classified with good accuracy and precision from three-axial accelerometer data collected in free-living conditions on people with T1D. This is particularly significant in the context of automated glucose control systems for diabetes, in that the methods we propose have the potential to inform changes in treatment parameters in response to the intensity of physical activity, allowing patients to meet their glycemic targets.
Keywords: Type 1 diabetes mellitus, physical activity, artificial pancreas, automated insulin delivery, wearable devices, wrist-worn accelerometer, supervised learning, free-living conditions
I. Introduction
Regular physical exercise of at least 150 minutes per week at moderate-to-vigorous intensity is recommended by the American Diabetes Association (ADA) for most people with type 1 diabetes (T1D) for various health and wellbeing reasons [1]. In addition, resistance exercise is also recommended two to three times per week [1]. Exercise can help people with T1D attain the prescribed glycemic goals and lipid profile and reach their target body composition.
The impact of exercise on blood glucose levels in T1D is influenced by the intensity, duration and type of activity [2], [3], [4]. Aerobic exercise is associated with a decrease in glycemia and hence a greater risk for low blood glucose levels (hypoglycemia) especially for longer periods of exercise duration [5], while anaerobic exercise generally increases glycemia [2]. Other factors affecting exercise-related glucose excursions are the amount of insulin in the bloodstream, glucagon and other counter-regulatory hormones concentration in the circulation, the blood glucose concentration at the start of exercise and the amount of carbohydrates ingested prior to commencement of the activity. Exercise perturbs blood glucose concentration not only during the activity itself, but also up to 15 hours post-session [2], [3], [4]. As a result, diabetes management during and after exercise is particularly difficult for both the patient and the healthcare provider, as it involves extensive education, diligent planning and preparation, and close monitoring, and is perceived as a barrier to exercise for most people with T1D [6].
The introduction of new technologies in glucose sensing and insulin infusion together with the appearance of smartphones, has recently allowed the development of artificial pancreas (AP) systems, realizing closed-loop control of blood glucose, leading to improved glycemic outcomes [7]. Within this framework, the control variable, i.e., blood glucose level, is measured by continuous glucose monitors (CGMs) with a sampling period of 5 minutes and the control input, i.e., rapid-acting insulin, is delivered via continuous subcutaneous insulin infusion (CSII) pumps every 5 to 10 minutes. The firstgeneration of such systems have been released commercially in the United States with Food and Drug Administration (FDA) approval and have proved safe and effective in lowering glycated hemoglobin (HbA1c) levels in the outpatient setting [8], [9]. However, one of the limitations of such systems is that they still require manual feedforward action introduced by the user to compensate for the blood glucose perturbations induced by, among other factors, daily activity behavior and physical exercise.
In this context, the proliferation and widespread availability of ubiquitous sensing technologies and the use of wearable devices, with the ability to monitor human behavior noninvasively and objectively, started to offer unprecedented opportunities to improve glucose management and increase exercise performance in the free-living setting. As an example, in some recent contributions, Turksoy and colleagues [10], [11], [12] used energy expenditure (EE) and galvanic skin response (GSR) measured by the SenseWear Pro3 (BodyMedia Inc., Pittsburgh, PA) sport armband in the hospital setting, to generate multi-input, multi-output models that predict future blood glucose concentration and are used in a multivariable adaptive glucose control framework; in [13] the authors developed a method based on k-nearest neighbors (k-NN) able to distinguish between circuit/intermittent vigorous to maximum intensity and continuous light to moderate intensity exercise from labeled heart-rate (HR), breathing rate (BR) and peak acceleration (PA) data collected with a Bioharness-3 (Zephyr Technologies, Annapolis, MD) device by 8 patients complying to a specific exercise protocol; Dasanayake and colleagues proposed a method to detect the onset and completion of physical activity by principal component analysis (PCA) on ActiGraph wGT3X-BT activity monitor (ActiGraph, Pensacola, FL) and its compatible Polar HR monitor (Polar Electro Inc., Lake Success, NY) data, before any significant blood glucose change occurred [14]; Jacobs et. al. used accelerometer and HR data collected by 13 adults during a hospital study with a BioPatch device (Zephyr Technologies, Annapolis, MD) as input to a validated regression model to estimate EE and grade the level of exercise accordingly [15]; in [16] the authors used five different biosignals recorded with the Empatica E4 wristband (Empatica Srl, Milano, Italy) to distinguish among five different physical states (resting, activities of daily living, running, biking, and resistance training), collected by 25 patients following the specific experimental protocol designed by the investigators, with the goal of developing suitable models able to estimate the energy expenditure (EE) of the performed activity for diabetes therapy.
Against this background, in the present work, we use three-axis accelerometer data collected with a wrist-worn device at a sampling rate of 32 [Hz] on people with T1D in the free-living setting, to estimate physical activity and sedentary behavior. Our goal is to incorporate this information in AP systems for the automation of insulin delivery around exercise. We acknowledge that other biosignals such as heart rate, galvanic skin response and skin temperature may be good indicators of physical exercise and may help the accurate estimation of exertion. However, they all require specific and dedicated devices to be collected, and the device must perfectly adhere to the skin in order for the signals recorded to possess adequate quality. Accelerometers, on the other hand, are more widely available in real life and have the potential of being incorporated in the patient’s own glucose monitoring or insulin infusion device. Moreover, it is well known that individuals with diabetes can have autonomic nervous system (ANS) dysfunction and resting elevated heart rate, referred to as cardiac autonomic neuropathy (CAN) [17], [18]. The prevalence of confirmed CAN in some studies is 20%, and increases up to 65% with increased age and diabetes duration. As such, any activity monitor that includes heart rate monitoring can be confounded in analyzing results from people with diabetes. Similarly, it is not yet understood how to characterize and account for the specific changes in electrodermal activity in people with T1D due to a dysfunctional ANS compared to the general population. The signals collected by an accelerometer, on the contrary, do not suffer from these limitations. By using data from an accelerometer only, our goal is twofold: one, we wish to establish a baseline for what can be achieved with this signal alone; two, the results obtained will be used to contextualize other biosignals which can potentially be added in the future.
Artificial intelligence methods to process accelerometer output from wearable devices have been studied in the literature in fields such as public health, medical monitoring and rehabilitation [19], [20], [21], [22], [23], [24], [25]. To the best of the authors’ knowledge, however, no one investigated the use of wrist-worn three-axial accelerometers alone for automatic detection and grading of physical activity and sedentary behavior in people with T1D, in a way that is appealing to automated glucose control systems and can therefore inform treatment decisions without feedforward user intervention. With that being said, in the current manuscript, we make the following contributions. First, we present a method able to detect activity and grade its intensity in sedentary, mild, moderate or vigorous based on the user fitness level. We aggregate the results of the grading per 5 [min] to obtain a continuous signal aligned with the CGM readings and predict the amount of time spent at different intensities. Second, we propose a method that performs activity classification in a supervised-learning framework, to recognize specific subject behaviors, discriminating between e.g., aerobic, resistance and mixed exercise, and calculate the time spent in each activity.
The remainder of the paper is organized as follows. Section II introduces clinical data acquisition and the methods for activity detection, level determination, and behavior classification; results pertaining our proposed methods are summarized in Sec. III; and finally Sec. IV concludes the paper.
II. Materials and Methods
A. Experimental conditions
The experimental protocol conformed to the policies and ethical principles described in the Declaration of Helsinki and with the standards of Good Clinical Practice. Eligible subjects were between 18 and 75 years of age with T1D for at least one year, using an insulin pump for at least three months, and were non-smokers. Key exclusion criteria were pregnancy, one or more episodes of hypoglycemia or hyperglycemia requiring an emergency room visit in the past six months, known unstable cardiac disease, uncontrolled hypertension or microvascular complications such as active proliferative retinopathy. Twenty subjects (8M/12F, age 44.9±5 years, duration of T1D of 22.9±15.8 years, HbA1c of 6.8±0.7) were recruited at 2 clinical sites (Sansum Diabetes Research Institute, Santa Barbara, CA and Mayo Clinic, Rochester, MN). Informed consent was obtained prior to all study procedures. The protocol received Institutional Review Board approval at each clinical site, and was registered at clinicaltrials.gov (NCT03307850). Study participants were grouped by fitness condition assessed by the clinical investigators during a screening visit on a scale of low, medium and high fitness.
After the screening visit, all subjects collected tri-axial accelerometer data sampled at 32 [Hz] for 5 weeks with an Empatica E4 wristband (Empatica Srl, Milano, Italy) on their non-dominat wrist, removing the device only during battery charging, data download, showering and other activities involving water. In addition to wearing the device, subjects reported on a daily basis time, duration, type and intensity of any performed sedentary, household, lifestyle, sport and gym activities along with relevant annotations, in a personal logbook. As for the intensity, subjects graded their perceived effort on a scale from 0 to 3, where 0 denoted sedentary, 1 mild, 2 moderate and 3 vigorous. Table I shows participant characteristics, fitness state and the sedentary or active behaviors annotated. We would like to highlight that in the outpatient setting considered in this contribution, no predefined protocol was followed by participants when performing activities, allowing investigators to obtain the most faithful representation of the free-living environment, since subjects continued with their standard routine and hobbies.
TABLE I.
Study population: age, gender, current fitness condition and annotated behaviors
| # | Age | Gender | Fitness | Activities |
|---|---|---|---|---|
| 1 | 50 | F | low | walk, HIIT |
| 2 | 63 | M | med | no annotations |
| 3 | 65 | F | med | laundry/paperwork |
| 4 | 33 | F | high | housework, run, jog, walk, dance, spin class, sailing |
| 5 | 73 | M | high | yardwork, tennis, nap, housework, hike, drive, deskwork |
| 6 | 44 | F | med | yoga, walk, housework |
| 7 | 57 | F | high | walk, spin class, run, hike |
| 8 | 59 | F | med | walk, yoga, pilates, hike, circuit training |
| 9 | 29 | M | med | walk, jog |
| 10 | 63 | M | high | no annotations |
| 11 | 41 | M | med | moving appliances |
| 12 | 36 | F | high | elliptical, raking pines, snow shovel, squash, thighs work |
| 13 | 39 | M | high | VO2 max, yardwork, treadmill, weight lifting |
| 14 | 36 | F | med | no annotations |
| 15 | 60 | F | low | housework |
| 16 | 28 | F | med | cardio, hike |
| 17 | 32 | F | high | hike, run, walk |
| 18 | 28 | M | high | softball, walk |
| 19 | 26 | M | high | run, jog, weight lifting |
| 20 | 30 | F | high | strength training (arms), core & cardio, treadmill |
HIIT stands for High Intensity Interval Training. Yardwork considered rake, pick, shovel in garden, water plants and mowing; housework considered washing dishes, cleaning, sweeping and pet feeding; rest considered napping, laying down and watching TV; deskwork considered reading, writing and working on a PC.
B. Features extraction and selection
Using 6th order Butterworth filters, the three-axis accelerometer data were bandpass filtered between 0.5 and 10 [Hz] to separate the dynamic component due to body motion and to eliminate noise and signal error due to unwanted hand movements, and low-pass filtered at 1 [Hz] to isolate the static component caused by gravity. Time-domain features were subsequently extracted from the filtered data (a fraction from the lowpass filtered only and another fraction from the bandpass filtered only), on a point-by-point basis, as follows. From the filtered signals, the displacement was calculated using the numerical method of forward and backward differences. Next, velocity, acceleration and jerk were derived to gain insights into the activity motion pattern and thus its type. Further, in order to eliminate artefacts of the filtering and to magnify the differences between feature points, the environment around each feature point was captured by taking consecutive central differences. In total, 66 features were extracted from the accelerometer readings. Next, seeking to increase classification performances, we followed the approach presented in [26] and to the first pool of curated features we added statisticsbased features according to the following procedure. We considered intervals of 60 seconds and for each interval we computed: mean, standard deviation, median, 1st and 3rd quartiles, maximum, minimum, slope, range, first derivative, second derivative, ratio of maximum to minimum values, sum of absolute values, mean of absolute values, interquartile range, skewness and kurtosis, of the curated features from the first pool, obtaining an additional second set of features. At this stage, the total number of extracted features was d = 1122. It is well known that while too few features may not be descriptive enough, too many features may decrease accuracy by introducing errors due to variance. Our goal, hence, was to eliminate unnecessary features and learn a model that only used k ≪ d features. Ideally, we could have tried all subsets of k out of d features and choose the subset that leads to the best performing model. However, such an exhaustive search would have been computationally expensive or even intractable. To make the problem computationally tractable, we decided to evaluate the 2 sets developed independently, since we did not expect correlation between variables of the 2 sets. As for the first set, we proceeded with the built-in feature importance test from the scikit-learn package in Python, implementing the mean decrease impurity test [27]. Only those feature with at least 1.5% of the maximum importance score were retained, cumulatively leading to 98% of model explanation. Further refining the panel by beeping only features with a larger relative importance score, led to a decrease in prediction accuracy and hence was not pursued. The complete list of these 66 features is reported in Appendix B along with the visual representation of their relative importance, in ascending order. With reference to the above mentioned list, only features from f31 to f65 were retained. For the second set, we proceeded with a greedy approach, specifically greedy selection [28]. From an initial empty set, we gradually added the statistics of the 34 features retained from the first set. The order in which we took said features, was that of decreasing order of importance. We stopped when we believed we obtained a predictor that was accurate enough. Next, we merged the features selected from their respective sets, for a total of 130 features extracted. Finally, we performed a feature importance test per each subject, with the goal of reducing the number of variables used for training the multi-class classification model to avoid the risk of overfitting. We acknowledge the fact that we might have ended up not selecting the overall ”optimal set”. However, due to ease of computation and good results, we concluded that our approach was feasible and adequate for our problem.
C. Activity intensity classification
1). Method 1:
We used a traditional machine learning method, namely, the Random Forest Classifier (RF) [27] to distinguish between target classes sedentary, mild, moderate and vigorous. Data were labeled in the target classes according to the subjects annotation in their diary, regardless of fitness condition. We trained the model on the training dataset of each subject, with the features discussed in Sec. II-B.
2). Method 2:
In addition to the classical machine learning method explained in Method 1, we developed also a threshold-based algorithm. The averaged third-order time derivative of the 3D displacement, i.e., feature f65 listed in Appendix B, was chosen after inspection of the feature importance graph, as the one providing the best discriminatory power to the purpose of activity intensity classification. Using half of the collected data from randomized time points, user-determined activity intensity thresholds were tuned to the reported low, medium and high fitness conditions. Thresholds are reported in Table II and represent the activity intensity measured by f65 used as the boundary between 2 consecutive grades of perceived effort, namely, sedentary, mild, moderate and vigorous, in accordance with the scale used by the subjects in the trial described in Sec. II-A. From Table II, we can see, for example, that a threshold value of 0.8 [a.u.] was used to distinguish between sedentary, denoted with 0, and mild activity, denoted with 1, for those subject in Group 1, i.e., with low fitness condition. Our method assigned a label (0, 1, 2, 3) to each feature point based on what threshold was crossed by that point. Last, the per-point labels were aggregated on the basis of the most predicted one during intervals of 5 minutes duration, to align the resulting activity levels signal with the blood glucose measurements obtained with CGM. Figure 1 depicts the procedure for one representative subject, while the flowchart in Fig. 2 gives the visual representation of the method.
TABLE II.
Fitness-based thresholds for activity intensity classification
| Threshold | Group 1 | Group 2 | Group 3 |
|---|---|---|---|
| Threshold 0 to 1 [a.u] | 0.8 | 0.8 | 0.8 |
| Threshold 1 to 2 [a.u] | 3.2 | 4.5 | 6 |
| Threshold 2 to 3 [a.u] | 10.7 | 13.5 | 18 |
Convention for activity level: 0 is sedentary, 1 is mild, 2 is moderate and 3 is vigorous. Group 1 represents subjects with low fitness; Group 2 subjects with medium fitness; Group 3 subjects with high fitness.
Fig. 1.

Representative subject data. Black Feature f65 [a.u.] and thresholds for activity intensity classification: Blue Threshold between level 0 and 1, Orange Threshold between level 1 and 2, Green Threshold between level 2 and 3. If the magnitude of feature f65 is below the blue threshold, it is assigned to activity level 0, if it is between the blue and the orange threshold, it is assigned activity level 1, if it is between the orange and the green thresholds it is assigned activity level 2 and finally if it is above the green threshold it is assigned level 3.
Fig. 2.
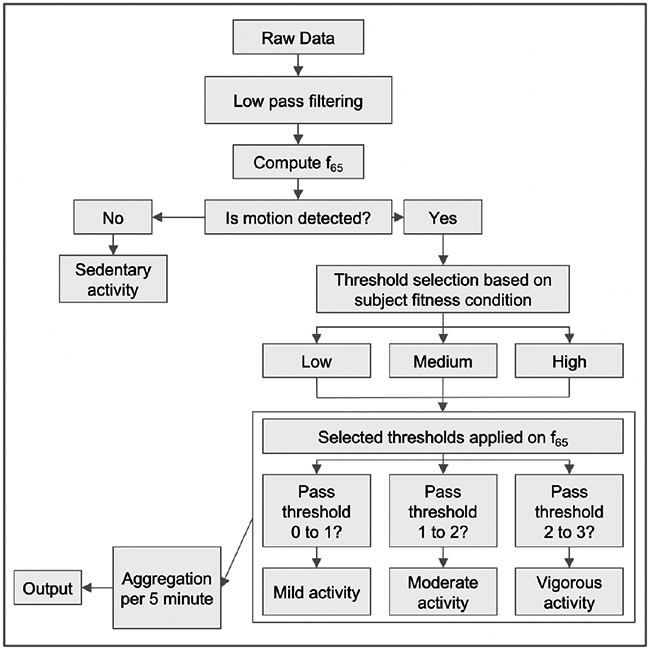
Flow chart for Method 1.
D. Behavior classification
The determination of appropriate nutritional and insulin dosing strategies in daily life depends on the sound understanding of what, or a combination of, energy systems and substrates are used to support the activities carried out. In the first place this entails being able to recognize the specific activity and exercise performed, in addition to their intensity level and duration. Prompted by this, we used pattern recognition methods [29], [30] of diverse nature to classify subject behavior. The methods we considered were linear models such as Logistic Regression (LR) [31], sparse kernel machines such as Support Vector Machine (SVM) [32], tree-based methods such as the RF [27], probabilistic classifiers as the Naive Bayes (NB) [30] and instance-based learning such as k-nearest neighbor (k-NN) [33]. We trained the models on the training dataset of each subject, with our curated best-fit features, and compared their relative performances with a 10-fold cross-validation method. In addition to the above mentioned methods, we have implemented 2 approaches based on deep learning (DL): the Multilayer Perceptron (MLP) classifier, and an artificial recurrent neural networks (RNN) model with long shortterm memory (LSTM) [34]. For the first DL-based method, we used the MLP classifier from the scikit-learn library in Python. MLP does not take into account the time-correlations inherent in the dataset and hence, we took the approach of describing each time point by the features that were crafted for the machine learning algorithms described hereinabove. We evaluated MLP classifiers with different sizes of hidden layers, and noticed an increase in accuracy of classification when increasing the number of layers. The optimized configuration consisted in 4 hidden layers activated by Rectified Linear Units (ReLu) activations. As for the second DL approach, we preprocessed the data structure to make it fit to the LSTM model such that a rolling window with 50 percent overlap was applied all along the data for each participant. This allowed the creation of a sample-wise dataset in which each sample is a window of data with length 128 timestamps (4 seconds) and width equal to the number of features we have already extracted. Using one-hot encoding, we created an output dataset corresponding to the input and adjusted to the number of activity classes for each patient, such that each input sample is assigned an output sample based on the corresponding activity the patient had at that window of time. We used Keras API for training a model containing one LSTM layer with 128 units followed by a hidden dense layer of 128 unit. In the output, a dense layer containing neurons equal to the number of activity classes for each patient is followed by a SoftMax activation function along with a categorical cross entropy loss function which for each input, outputs the probability of belonging to each class. For both MLP and LSTM we considered an 80/20% split ratio between train and test sets, respectively. For the training process, the train-set was further divided into subsets of training and validation with ratio of 80% and 20%, respectively. Details on the classifiers and parameters used are reported in Appendix A. Figure 3 outlines the step-wise procedure implemented for behavior classification.
Fig. 3.
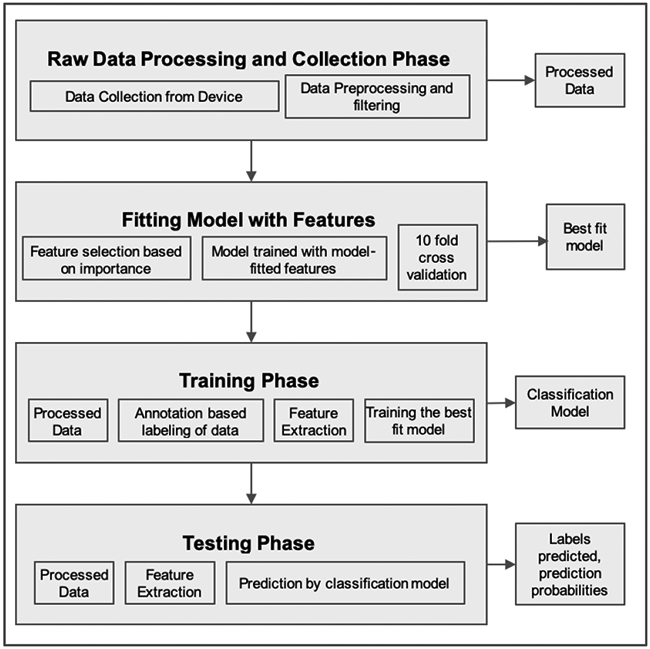
Flow chart for behavior classification.
III. Results
A. Performance Measures
For each class, the available data were equally split into training and testing set, respectively. We chose this split over a more traditional, in case of small dataset, 80-20 split to be more conservative. Thresholds and models were derived using data saved for training and were validated on the remaining data saved for testing. Performances of the methods were assessed against the subjects annotations of activity intensity and type, respectively. The percentage of correctly classified instances, i.e., accuracy, the ratio between true positives and the sum of true positives and false positives, i.e., precision, the ratio between true positives and the sum of true positives and false negatives, i.e., recall, and finally, the harmonic average of the precision and recall, i.e., the F1 score, were then calculated as performance metrics to evaluate the predictive capabilities of our proposed methods [35]. Further, confusion matrices, where each column of a matrix represents the instances in a predicted class, and each row denotes instances in the actual class, were drawn to allow visualization of the predictive capabilities in terms of true positive (in the main diagonal), false positive (row-wise off the main diagonal) and false negative (column-wise off the main diagonal).
B. Activity intensity classification
1). Method 1:
The top panel of Table III lists population results for activity intensity categorization obtained with the RF classifier. The first column reports the average accuracy to be 99.99%. Precision, recall and F1-score were computed per activity level, listed in the second column. Average values for the population were precision 98.0±2.2%, recall 97.7±3.5% and F1-score 0.9±0.0.
TABLE III.
Activity level categorization results: accuracy, precision and recall [%], F1 Score
| Accuracy | Level | Precision | Recall | F1 score | |
|---|---|---|---|---|---|
| Method 1 | |||||
| Population | 99.99 | 0 | 98.1 | 99.9 | 0.9 |
| 1 | 94.8 | 99.2 | 0.9 | ||
| 2 | 99.1 | 92.6 | 0.9 | ||
| 3 | 99.9 | 99.9 | 0.9 | ||
| average | 98.0±2.2 | 97.9±3.5 | 0.9±0.0 | ||
| Method 2 | |||||
| Group 1 | 0 | NA | NA | NA | |
| 1 | 100 | 50 | 0.7 | ||
| 2 | 77.8 | 100 | 0.8 | ||
| 3 | NA | NA | NA | ||
| Group 2 | 0 | 100 | 90 | 0.9 | |
| 1 | 94.1 | 76.2 | 0.8 | ||
| 2 | 80.7 | 100 | 0.9 | ||
| 3 | NA | NA | NA | ||
| Group 3 | 0 | 95.6 | 100 | 0.9 | |
| 1 | 62.5 | 86.9 | 0.7 | ||
| 2 | 93.2 | 82.1 | 0.8 | ||
| 3 | 100 | 86.7 | 0.9 | ||
| Population | 86.84 | 0 | 96.8 | 96.8 | 0.9 |
| 1 | 74.5 | 79.2 | 0.7 | ||
| 2 | 88.3 | 87.3 | 0.8 | ||
| 3 | 100 | 86.7 | 0.9 | ||
| average | 89.9±11.4 | 87.5±7.2 | 0.8±0.1 | ||
Convention for activity level: 0 is sedentary, 1 is mild, 2 is moderate and 3 is vigorous. Group 1 represents subjects with low fitness; Group 2 subjects with medium fitness; Group 3 subjects with high fitness. NA stands for annotations not available.
2). Method 2:
Numerical performances of the method are tabulated in the bottom panel of Table III. The table compares results obtained at the population level with those achieved when subjects are grouped by fitness condition. Precision, recall and F1 score were computed per each activity level, listed in the second column. Each set of rows in the table gathers performances by fitness condition, where Group 1 represents subjects with low fitness, Group 2 subjects with medium fitness and Group 3 subjects with high fitness. Sedentary behavior was not reported by any of the subjects with low fitness, while annotations of vigorous exercise were available only for subjects with high fitness. The last set of rows in Table III shows that at the population level, the intensity of activity can be predicted with multi-class average precision of 89.9±11.4%, recall of 87.5±7.2%, and F1 score of 0.8±0.1, irrespective of the subject fitness level. Sedentary behavior was annotated in 32 instances and predicted with 96.87% precision and 96.87% recall; mild activity level was annotated in 48 instances and predicted with 74.50% precision and 79.17% recall; moderate activity level was annotated in 95 instances and predicted with 88.29% precision and 87.36% recall and finally vigorous activity level was annotated in 15 instances and predicted with 100% precision and 86.67% recall. Highest F1 score was reported for sedentary behavior and vigorous activity level prediction. Fig. 4, top panel, reports classification results per activity intensity, at the population level, in a confusion matrix, where the main diagonal highlights true positives. The distributions of the predicted activity levels across the annotated levels are compared in Fig. 4, bottom panel. In particular, we note that activity level 3 is always predicted correctly. Finally, the evaluation of accuracy in predicting the intensity level for the most commonly performed activity across the population, regardless of the individual fitness condition, is reported in Fig. 5. The results show accuracy of 68.5±34.1% for walking, 100±0% for hiking, 90.2±15.2% for running, 83.3±23.5% for yardwork, 100±0% for housework and 50.0±70.7% for high intensity interval training. Overall, our proposed Method 2 exhibits excellent predictive performances, however, confusion between the annotated mild and predicted moderate activity levels is reported.
Fig. 4.

Population results for the activity level classification: Top Confusion matrix, where numbers in the matrix and color scale represent number of annotations; Bottom Violin plot, compares the distributions of the predicted activity levels across the actual annotated levels. The x− and y− axis show the predicted and annotated, respectively, activity level on a scale from 0 to 3, where 0 is sedentary, 1 is mild, 2 is moderate and 3 is severe.
Fig. 5.

Evaluation of accuracy [%] in predicting the level for the most common performed activities across the population, regardless of fitness condition. Compared activities were walking, hiking, running, yarwork, housework and high intensity interval training (HIIT). In each boxplot, the central mark is the median, the bottom and top edges indicate the 25th and 75th percentiles, respectively. Blue whiskers extend to the most extreme data points not considered outliers.
C. Behavior classification
We present results for all study participants who performed at least 2 different activities, each annotated in their logbook individually on at least two separate days. This choice guaranteed us with a set of diverse sedentary, household, lifestyle and sport activities, with enough data to validate the prediction results. A training dataset was built per each individual participants by selecting and subsequently concatenating the chosen individual activities. The case of participants annotating combined activities for the same time period as part of a workout (e.g., weight lifting and treadmill) was disregarded due to impossibility in procuring the training/testing set of each annotated activity. Table IV reports results of activity prediction for the estimated models across the available population. Model accuracy [%] was computed on the testing datasets over the individual-specific activities. Population average accuracy was 53.57±22.72% for SVM, 78.87±15.62% for LR, 67.76±23.84% for k-NN, 81.61±16.15% for Gaussian NB, 88.16±13.69% for RF, 87.29±12.92% for MLP and finally 92.43±10.32% for LSTM. The best performing model was the LSTM. In Table V we offer a comparison between the overall accuracy of our proposed RF, MLP and LSTM methods on behavior classification using accelerometer signals and that of similar very recent studies. We can see from the table that the performances of our proposed MLP and RF are comparable to prior reports that used the same sensor positioned on the wrist, while LSTM outperforms said prior work despite the much larger and diverse number of activities performed in the completely unsupervised free-living environment. Similar conclusions can be drawn when confronting our results with those obtained when the accelerometer is placed on the hip and the classes to distinguish between much simpler. Last, classification performances obtained with RF classifier and the LSTM model relative to individual-specific activities are reported in Table VI and Table VII, respectively, both subject-wise and as population average. At the population level, on the very rich dataset available, consisting of activities of different types and intensities, performances were 88.27±17.06% precision, 85.17±23.51% recall and 84.31±19.92% F1 score for the RF classifier, and 92.94±9.80% precision, 92.20±10.16% recall and 92.56±9.94% F1 score for the LSTM. Figure 6 provides a comparison between the RF classifier and the LSTM model for participant 4.
TABLE IV.
Behavior classification: overall accuracy [%] per subject. We compare SVM, LR, k-NN, NB, RF, MLP and LSTM. The last row gives population average (mean±σ).
| subj # | SVM | LR | k-NN | NB | RF | MLP | LSTM |
|---|---|---|---|---|---|---|---|
| 1 | 99.00 | 55.53 | 91.35 | 89.68 | 97.66 | 98.72 | 98.19 |
| 4 | 26.12 | 78.19 | 60.57 | 82.43 | 88.09 | 81.82 | 98.51 |
| 5 | 52.69 | 65.31 | 50.13 | 52.16 | 60.51 | 58.09 | 90.10 |
| 6 | 64.94 | 54.87 | 48.47 | 84.21 | 61.26 | 82.23 | 97.99 |
| 7 | 43.90 | 83.79 | 55.46 | 93.80 | 94.07 | 91.75 | 79.97 |
| 8 | 50.65 | 74.7 | 46.58 | 50.50 | 82.57 | 66.03 | 98.67 |
| 9 | 51.32 | 99.99 | 99.99 | 95.34 | 99.97 | 99.98 | 82.58 |
| 12 | 35.96 | 86.50 | 68.84 | 81.07 | 86.92 | 89.40 | 99.76 |
| 13 | 80.30 | 89.13 | 90.17 | 89.32 | 96.08 | 92.07 | 92.17 |
| 16 | 50.00 | 77.88 | 99.99 | 99.84 | 99.99 | 99.95 | 100.00 |
| 17 | 10.10 | 58.20 | 53.68 | 75.64 | 74.89 | 78.45 | 62.65 |
| 18 | 53.75 | 99.99 | 99.99 | 99.80 | 99.99 | 99.98 | 95.78 |
| 19 | 50.81 | 96.91 | 28.87 | 86.30 | 93.77 | 87.81 | 98.22 |
| 20 | 80.44 | 83.25 | 54.68 | 62.48 | 98.46 | 95.91 | 99.55 |
| mean±σ | 53.57±22.72 | 78.87±15.62 | 67.76±23.84 | 81.61±16.15 | 88.16±13.69 | 87.29±12.92 | 94.54±6.45 |
TABLE V.
Behavior classification using 3D-accelerometer: Comparison of overall accuracy between the proposed method and similar studies in the literature.
| Year | Reference | Device | Position | Activities | Algorithm | Accuracy [%] |
|---|---|---|---|---|---|---|
| 2020 | [36] | ActiGraph | hip | sedentary, household, games, walk, run | RF | 95 |
| 2020 | [37] | smartphone | hip | walk, walk upstair, walk downstair, sit, stand, lay | DL | 93 |
| 2020 | [38] | GT3X+ and GT9X | hip | walk, walk upstair, walk downstair, run, sit, stand, lay | SVM | 89 |
| 2020 | [16] | Empatica E4 | wrist | sedentary, bike, resistance, run, activities of daily life | LSTM-DL | 90 |
| 2021 | proposed | Empatica E4 | wrist | Table 1 | RF | 88 |
| 2021 | proposed | Empatica E4 | wrist | Table 1 | MLP | 87 |
| 2021 | proposed | Empatica E4 | wrist | Table 1 | LSTM | 92 |
TABLE VI.
Behavior classification with RF: precision, recall and F1 score [%] per activity. The last row gives population average (mean±σ).
| Activity | Precision | Recall | F1 score | |
|---|---|---|---|---|
| Subj 1 | walk | 95.54 | 99.98 | 93.71 |
| HIIT | 99.97 | 95.34 | 97.60 | |
| mean±σ | 97.76±3.13 | 97.66±3.28 | 97.66±0.00 | |
| Subj 4 | Housework | 83.81 | 42.47 | 56.37 |
| Run | 99.99 | 98.68 | 99.33 | |
| Jog | 95.23 | 99.99 | 97.55 | |
| Walk | 99.94 | 87.04 | 93.04 | |
| Dance | 64.84 | 99.62 | 78.55 | |
| Spin | 94.66 | 88.84 | 91.66 | |
| Sail | 89.99 | 99.94 | 94.70 | |
| mean±σ | 89.78±12.37 | 88.09±20.36 | 87.32±15.22 | |
| Subj 5 | Yardwork | 99.98 | 87.37 | 93.25 |
| Tennis | 65.58 | 50.88 | 57.30 | |
| Nap | 49.50 | 99.96 | 66.21 | |
| Housework | 31.99 | 48.41 | 38.53 | |
| Hike | 53.93 | 22.99 | 32.24 | |
| Drive | 99.86 | 77.05 | 86.99 | |
| Deskwork | 59.49 | 36.89 | 45.54 | |
| mean±σ | 65.77±25.55 | 60.51±28.15 | 60.01±23.53 | |
| Subj 6 | Yoga | 100.00 | 10.02 | 18.22 |
| Walk | 46.10 | 95.95 | 62.28 | |
| Housework | 95.06 | 77.78 | 85.55 | |
| mean±σ | 80.39±29.80 | 61.26±45.29 | 55.36±34.20 | |
| Subj 7 | Walk | 99.98 | 76.36 | 86.59 |
| Spin | 99.97 | 99.98 | 99.98 | |
| Run | 80.86 | 99.97 | 89.40 | |
| Hike | 99.99 | 99.97 | 99.98 | |
| mean±σ | 95.20±9.56 | 94.07±11.81 | 93.99±7.01 | |
| Subj 8 | Walk | 73.94 | 99.99 | 85.02 |
| Yoga | 85.97 | 95.25 | 90.37 | |
| Pilates | 75.49 | 78.20 | 76.82 | |
| Hike | 93.51 | 90.85 | 92.16 | |
| Circuit | 91.20 | 48.56 | 63.37 | |
| mean±σ | 84.03±8.94 | 82.57±20.67 | 81.55±11.78 | |
| Subj 9 | Walk | 99.97 | 99.97 | 99.97 |
| Jog | 99.97 | 99.97 | 99.97 | |
| mean±σ | 99.97±0.00 | 99.97±0.00 | 99.97±0.00 | |
| Subj 12 | Elliptical | 75.23 | 99.98 | 85.86 |
| Raking | 98.95 | 99.97 | 99.46 | |
| Shovel | 99.97 | 39.18 | 56.29 | |
| Squash | 80.36 | 95.49 | 87.27 | |
| Tighs work | 92.52 | 99.95 | 96.10 | |
| mean±σ | 89.41±11.13 | 86.92±26.76 | 85.00±17.04 | |
| Subj 13 | Vo2 max | 100.00 | 84.41 | 91.54 |
| Yardwork | 86.49 | 99.97 | 92.75 | |
| Treadmill | 99.94 | 99.96 | 99.95 | |
| Weights | 99.98 | 99.96 | 99.97 | |
| mean±σ | 96.61±6.74 | 96.08±7.78 | 96.06±4.54 | |
| Subj 16 | Cardio | 99.98 | 99.98 | 99.98 |
| Hike | 99.98 | 99.98 | 99.98 | |
| mean±σ | 99.99±0.00 | 9.99±0.00 | 9.99±0.00 | |
| Subj 17 | Hike | 92.19 | 42.61 | 58.28 |
| Run | 99.96 | 82.08 | 90.14 | |
| Walk | 58.24 | 99.97 | 73.60 | |
| mean±σ | 83.47±22.19 | 74.89±29.35 | 74.01±15.93 | |
| Subj 18 | Softball | 99.98 | 99.98 | 99.98 |
| Walk | 99.98 | 99.98 | 99.98 | |
| mean±σ | 99.99±0.00 | 99.99±0.00 | 99.99±0.00 | |
| Subj 19 | Run | 99.98 | 81.35 | 89.71 |
| Jog | 84.26 | 99.98 | 91.45 | |
| Weight | 100 | 99.97 | 99.98 | |
| mean±σ | 94.75±9.08 | 93.77±10.35 | 93.72±5.50 | |
| Subj 20 | Arm strenght | 99.98 | 99.98 | 99.98 |
| core, cardio | 99.95 | 95.41 | 97.63 | |
| treadmill | 95.62 | 99.97 | 97.75 | |
| mean±σ | 98.52±2.51 | 98.46±2.64 | 98.46±1.33 | |
| mean±σ | 88.27±17.06 | 85.17±23.51 | 84.31±19.92 |
TABLE VII.
Behavior classification with LSTM: precision, recall and F1 score per activity. The last row gives population average (mean±σ).
| Activity | Precision | Recall | F1 score | |
|---|---|---|---|---|
| Subj 1 | walk | 96.51 | 100 | 98.22 |
| HIIT | 100 | 96.39 | 98.16 | |
| mean±σ | 98.25±1.74 | 98.20±1.80 | 98.20±0.03 | |
| Subj 4 | Housework | 84.81 | 80.72 | 82.72 |
| Run | 100 | 90.96 | 95.27 | |
| Jog | 89.24 | 100.00 | 94.32 | |
| Walk | 98.74 | 94.57 | 96.61 | |
| Dance | 100.00 | 98.80 | 99.39 | |
| Spin | 80.02 | 87.95 | 84.88 | |
| Sail | 100.00 | 100.00 | 100.00 | |
| mean±σ | 93.26±7.83 | 93.29±6.70 | 93.31±6.33 | |
| Subj 5 | Yardwork | 97.07 | 100.00 | 98.51 |
| Tennis | 100.00 | 57.83 | 73.28 | |
| Nap | 100.00 | 100.00 | 100.00 | |
| Housework | 98.81 | 100.00 | 99.30 | |
| Hike | 61.25 | 95.18 | 74.52 | |
| Drive | 100.00 | 95.78 | 97.84 | |
| Deskwork | 94.45 | 81.93 | 87.74 | |
| mean±σ | 93.08±13.13 | 90.10±14.14 | 90.16±10.97 | |
| Subj 6 | Yoga | 95.34 | 98.80 | 97.04 |
| Walk | 98.75 | 95.18 | 96.93 | |
| Housework | 100.00 | 100.00 | 100.00 | |
| mean±σ | 98.03±1.97 | 98.00±2.05 | 98.00±1.42 | |
| Subj 7 | Walk | 70.42 | 100.00 | 82.39 |
| Spin | 100.00 | 89.16 | 94.26 | |
| Run | 80.65 | 75.30 | 77.88 | |
| Hike | 74.19 | 55.42 | 63.45 | |
| mean±σ | 81.31±11.39 | 79.97±16.16 | 79.50±11.03 | |
| Subj 8 | Walk | 100.00 | 100.00 | 100.00 |
| Yoga | 100.00 | 97.60 | 98.78 | |
| Pilates | 100 | 98.80 | 99.40 | |
| Hike | 99.39 | 96.99 | 98.17 | |
| Circuit | 94.32 | 100.00 | 97.07 | |
| mean±σ | 98.74±2.22 | 98.67±1.23 | 98.68±1.01 | |
| Subj 9 | Walk | 100.00 | 65.17 | 78.91 |
| Jog | 74.17 | 100.00 | 85.17 | |
| mean±σ | 87.09±12.91 | 82.58±17.41 | 82.04±3.13 | |
| Subj 12 | Elliptical | 100.00 | 100.00 | 100.00 |
| Raking | 98.80 | 100 | 99.40 | |
| Shovel | 100.00 | 98.79 | 99.40 | |
| Squash | 100.00 | 100.00 | 100.00 | |
| Tighs work | 100.00 | 100.00 | 100.00 | |
| mean±σ | 99.76±0.48 | 99.76±0.54 | 99.76±0.30 | |
| Subj 13 | Vo2 max | 100.00 | 66.67 | 81.42 |
| Yardwork | 76.85 | 100.00 | 86.91 | |
| Treadmill | 100.00 | 100.00 | 100.00 | |
| Weights | 98.80 | 100.00 | 99.40 | |
| mean±σ | 93.91±9.86 | 92.67±14.43 | 91.93±9.01 | |
| Subj 16 | Cardio | 100.00 | 100.00 | 100.00 |
| Hike | 100.00 | 100.00 | 100.00 | |
| mean±σ | 100.00±0 | 100.00±0 | 100.00±0 | |
| Subj 17 | Hike | 72.55 | 89.16 | 80.00 |
| Run | 70.83 | 51.20 | 59.44 | |
| Walk | 45.40 | 47.60 | 46.48 | |
| mean±σ | 62.92±15.20 | 62.65±23.02 | 61.98±16.90 | |
| Subj 18 | Softball | 92.23 | 100.00 | 95.95 |
| Walk | 100.00 | 91.56 | 95.60 | |
| mean±σ | 96.11±3.88 | 95.78±4.22 | 95.78±0.17 | |
| Subj 19 | Run | 100.00 | 100.00 | 100.00 |
| Jog | 98.85 | 97.43 | 98.13 | |
| Weight | 98.67 | 100.00 | 99.33 | |
| mean±σ | 99.17±0.72 | 99.14±1.21 | 99.15±0.77 | |
| Subj 20 | Arm strenght | 100.00 | 98.65 | 99.32 |
| core, cardio | 98.67 | 100.00 | 99.33 | |
| treadmill | 100.00 | 100.00 | 100.00 | |
| mean±σ | 99.56±0.63 | 99.55±0.63 | 99.55±0.32 | |
| mean±σ | 92.94±9.80 | 92.20±10.16 | 92.56±9.94 |
Fig. 6.

Comparison of performances with RF (Left) and LSTM (Right). Participant 4 confusion matrices: the x− and y− axis show the predicted and annotated, respectively; the main diagonal reports true positives, elements off the main diagonal reports false negatives column-wise and false positives row-wise. Numbers in the matrix and color scale represent percent of total time.
IV. Summary and Conclusion
This work dealt with methods to estimate aspects of physical activity and sedentary behavior from three-axis accelerometer data collected with a wrist-worn device at a sampling rate of 32 [Hz] on people with T1D in the free-living setting. Participants had diverse fitness conditions, and were performing a wide range of sedentary, household, lifestyle, sport and gym activities at different intensities for five weeks. Participants annotated activity performed and duration of exercise along with the intensity level based on their perceived effort on a scale from 0 to 3, where 0 represents sedentary, 1 mild, 2 moderate and 3 vigorous. Subjects were grouped by fitness level, which was assessed by the clinical investigators. We crafted a very unique set of features that we used both to the purpose of activity level classification and behavior classification. First, we tested a RF classifier on target classes sedentary, mild, moderate and vigorous. The algorithm achieved 99.99% accuracy. Second, we developed a threshold-based method able to take into account the individual fitness grade to classify the activity intensity. We showed that such method predicts the intensity level with multi-class average precision of 89.9±11.4% and recall of 87.5±7.2%, irrespective of the participant’s group. Although performances of this approach are slightly inferior to those of Method 1, the major advantages are that it can be used online, as data are collected, and its output is a continuous signal, i.e., the activity level (see highlighted area in Fig. 1), that can be easily incorporated in a controller for glucose regulation. When comparing predictive performances across the population, for the most commonly performed activities, accuracy was 68.5±34.1% for walking, 100±0% for hiking, 90.2±15.2% for running, 83.3±23.5% for yardwork, 100±0% for housework and 50.0±70.7% for high intensity interval training.
When considering resistance and strength exercises, which rely primarily on anaerobic energy-producing metabolism, and mixed activity, such as high intensity interval training and softball, which involve alternation between vigorous exercise and recovery, it is more beneficial to differentiate among the activities rather than their intensity level, to be able to determine the most appropriate nutritional and insulin management strategies. To this end, we proposed a method based on decision trees, namely a RF classifier, which we trained and tested on a population of 14 subjects who annotated cumulatively more than 20 different activities in the free-living setting. As for the specific activity prediction, on data left for validation, we obtained multi-class average accuracy of 88.16±13.69%, precision of 88.27±17.06% and recall of 85.17±2315%. To the best of our knowledge, this is the first time that data collected in the completely unsupervised free-living environment, without any specific protocol or request as to what activity to perform with a three axial accelerometer worn in the wrist are used to the purpose of activity intensity prediction and behavior classification.
The methods we proposed in this contribution lend themselves naturally to incorporation into an AP system for glycemia regulation to compensate for glycemic perturbations due to physical activity. Specifically, the activity intensity signal, the knowledge of the activity type i.e., aerobic vs. anaerobic, and the time spent at each level and activity, can be used to augment glucose feedback from CGM sensors to adapt insulin infusion to the patient’s lifestyle. For instance, basal rates may be reduced during and after prolonged aerobic exercise, due to increased insulin sensitivity and higher risk for hypoglycemia, while they may be increased to help treat or prevent hyperglycemia caused by high intensity short anaerobic exercise [2]. Such augmented feedback may also be used to reduce or suspend the prandial insulin doses administered at the meals after exercises, given the elevated insulin sensitivity after physical exercise. We recognize a number of limitations in our analysis. First, our study design instructed participants to keep their usual activity schedule. Participants were not requested to follow any specific protocol for data collection. As a result, the available data were not always labeled clearly, especially in the case of composite activities such as e.g., softball. Lack of accurate labels in the training dataset resulted in some confusion in the behavior classification and represent a limitation of our algorithm. Another limitation of the current work lies in the fact that the features used were picked by hand. Whether it is possible to find a mechanistic procedure to derive relevant features able to increase the prediction accuracy of the classification tasks at hand is an open question and the focus of ongoing research. The pre-processing step of our methods involved filtering out the 0.5-10 [Hz] band. However, hand tremors through which strenuous physical activities can also be detected and classified, are observed in the range 10-14 [Hz]. Hence, future work will be devoted to modifying our existing algorithms to investigate said frequency range with the purpose of improving performances. In addition, future work will be devoted to the incorporation of heart rate measurements to better distinguish aerobic vs. anaerobic exercise as well as to get an estimate of energy expenditure, paving the way to the study of safe and effective glycemic management strategies that adapt to patients lifestyle. Last, our methods have not been tested in the biking exercise due to the lack of data representative of this activity collected by study participants. For this reason, in future studies, we plan to incorporate bicycling as well.
Supplementary Material
Highlights.
Estimation of aspects of physical activity and sedentary behavior from wearable devices enables precision medicine in the treatment of type 1 diabetes
Activity intensity is classified from the averaged third-order time derivative of 3D acceleration
Pattern recognition methods classify human behavior from 3D acceleration
Acknowledgments
Funding for this project was made possible through collaboration between the Juvenile Diabetes Reasearch Foundation and The Leona M. and Harry B. Helmsley Charitable Trust (Grant 2-SRA-2017-503-M-B), and the National Institutes of Health (Grant DP3DK113511). D.C. received support from the Khorana Program for Scholars. J.P. was supported in part by a grant from the William K. Bowes Jr. Foundation (WKB-2017-22754)
Appendix
A. Classification models
1). Logistic Regression (LR):
LR models the probability that certain labels Y belong to a particular class, by using the logistic function:
| (1) |
We estimated the coefficient of the logistic function based on the available training data using the maximum likelihood criterion. Once the coefficient and were estimated, predictions for the labels of the testing data were made by computing with (1).
2). Support Vector Machines (SVM):
We assumed linear decision boundaries between classes in the features space and hence used a linear kernel. The predicted class label for a test observation x* is dependent upon only nearby (in the linear kernel sense) training observations. The distance between the observation and the decision boundaries was computed with l2 norm.
3). Random Forest (RF):
A RF classifier is a supervised learning method for probabilistic prediction of classification labels based on a collection of randomized decision trees [27]:
| (2) |
where the {θk} are independent identically distributed random vectors and x is the input. Each decision tree works as an independent classifier and is constructed from a random sample of the training dataset and a random sample of the features extracted from it. The label selected by the forest of decision trees is the one selected by the majority of the trees. In our case, we built k = 200 trees in the forest using bootstrap samples.
4). Naive Bayes (NB):
NB makes classifications using the Maximum A Posteriori (MAP) decision rule in a Bayesian setting. The goal is to determine the probability of the features occurring in each class, and to return the most likely class. In our work, we assumed that the individual probabilities followed a gaussian distribution:
| (3) |
with xj, yi denoting feature and label, respectively and σy, μy estimated from the training data with maximum likelihood.
5). k-Nearest Neighbors (k-NN):
The rule used by k-NN to make decisions at the classification stage is based on the assumptions that instances close in the input space are likely to belong to the same class. Given a test observation x* and a positive integer k, the k-NN finds the k points in the training data which are closer to x*. The conditional probability for class j is then computed:
| (4) |
where is the set of the k points previously identified, yi denotes their label and I(yi = j) in an indicator variable that evaluates to 1 if a given observation is a member of class j, and 0 otherwise. Applying Bayes rule, k-NN classifies x* to the class with the largest probability. In this work, we chose k = 7.
6). Multilayer Perceptron (MLP):
MLP is a type of deep feedforward network. The goal of the MLP is to approximate some function f*. In the case at hand, for a classifier, y = f*(x) maps an input x to a label y. A MLP defines a mapping y = f(x; θ) and learns the value of the parameters θ that result in the best function approximation via backpropagation. We used a Rectified Linear Unit (ReLu) activation function for the hidden layer and a softmax for the output layer.
B. Features
Denoting with , , the lowpass filtered and , , the bandpass filtered, respectively, x, y, z coordinate of acceleration at time point t, let us define:
The features f0, …, f65, listed in ascending order of importance according to the feature importance test (see Fig. 7), are the following, with τ, T time indexes:
Fig. 7.

Feature selection based on importance. Red Selected; Blue Discarded.
Footnotes
Conflict of interest declaration
Dr. Cescon serves on the advisory board for Diatech Diabetes, Inc.
Dr. Pinsker reports receiving grant support, provided to his institution, and consulting fees and speaker fees from Tandem Diabetes Care; grant support, provided to his institution, and advisory board fees from Medtronic; grant support, provided to his institution, and consulting fees from Eli Lilly; grant support and supplies, provided to his institution, from Insulet; and supplies, provided to his institution, from Dexcom.
Dr. Kudva reports product support from Dexcom, Roche Diabetes and Tandem.
Dr. Doyle reports equity, licensed IP and is a member of the Scientific Advisory Board of Mode AGC.
Dr. Dassau reports receiving grants from JDRF, NIH, and Helmsley Charitable Trust, personal fees from Roche and Eli Lilly, patents on artificial pancreas technology, and product support from Dexcom, Insulet, Tandem, and Roche. Dr. Dassau is currently an employee and shareholder of Eli Lilly and Company. The work presented in this manuscript was performed as part of his academic appointment and is independent of his employment with Eli Lilly and Company.
No conflicts of interest relevant to this project are reported for the rest of the authors.
Publisher's Disclaimer: This is a PDF file of an unedited manuscript that has been accepted for publication. As a service to our customers we are providing this early version of the manuscript. The manuscript will undergo copyediting, typesetting, and review of the resulting proof before it is published in its final form. Please note that during the production process errors may be discovered which could affect the content, and all legal disclaimers that apply to the journal pertain.
Contributor Information
Marzia Cescon, Harvard John A. Paulson School of Engineering and Applied Sciences, Harvard University.
Divya Choudhary, Harvard John A. Paulson School of Engineering and Applied Sciences, Harvard University.
Jordan E. Pinsker, Sansum Diabetes Research Institute, Santa Barbara, CA.
Vikash Dadlani, Mayo Clinic, Rochester, MN.
Mei Mei Church, Sansum Diabetes Research Institute, Santa Barbara, CA.
Yogish C. Kudva, Mayo Clinic, Rochester, MN
Francis J. Doyle, III, Harvard John A. Paulson School of Engineering and Applied Sciences, Harvard University.
Eyal Dassau, Harvard John A. Paulson School of Engineering and Applied Sciences, Harvard University.
References
- [1].Americ. Diabetes Assoc., “Lifestyle management: Standards of medical care in diabetes–2018,” Diabetes Care, vol. 41, no. Supplement 1, pp. S38–S50, 2018. [DOI] [PubMed] [Google Scholar]
- [2].Riddell M, Gallen I, Smart C, Taplin C, Adolfsson P, Lumb A, Kowalski A, Rabasa-Lhoret R, McCrimmon R, Hume C, Annan F, Fournier P, Graham C, Bode B, Galassetti P, Jones T, San Millan I, Heise T, Peters A, Petz A, and Laffel L, “Exercise management in type 1 diabetes: a consensus statement,” Lancet Diab. Endocrinol, vol. 5, pp. 377–390, 2017. [DOI] [PubMed] [Google Scholar]
- [3].Basu R, Johnson M, Kudva Y, and Basu A, “Exercise, hypoglycemia and type 1 diabetes,” Diab. Tech. Ther, vol. 16(6), pp. 331–337, 2014. [DOI] [PMC free article] [PubMed] [Google Scholar]
- [4].Kudva Y, Carter R, Cobelli C, Basu R, and Basu A, “Closed-loop artificial pancreas systems: Physiological input to enhance nextgeneration devices,” Diabetes Care, vol. 37, pp. 1184–1190, 2014. [DOI] [PMC free article] [PubMed] [Google Scholar]
- [5].Pinsker J, Kraus A, Gianferante D, Schoenberg B, Singh S, Ortiz H, Dassau E, and Kerr D, “Techniques for exercise preparation and management in adults with type 1 diabetes,” Can. J. Diab, vol. 40, no. 6, pp. 503–508, 2016. [DOI] [PubMed] [Google Scholar]
- [6].Brazeau A, Rabasa-Lhoret R, Strychar I, and Mircescu H, “Barriers to physical activity among patients with type 1 diabetes,” Diabetes care, vol. 31, no. 11, pp. 2108–2109, 2008. [DOI] [PMC free article] [PubMed] [Google Scholar]
- [7].Deshpande S, Pinsker J, Zavitsanou S, Shi D, Tompot R, Church M, Andre C, Doyle FJ III, and Dassau E, “Design and clinical evaluation of the interoperable artificial pancreas system (iaps) smartphone app: Interoperable components with modular design for progressive artificial pancreas research and development,” Diabetes Technol. Ther, vol. 21, no. 1, pp. 35–43, 2019. [DOI] [PMC free article] [PubMed] [Google Scholar]
- [8].Bergenstal R, Garg S, Weinzimer S, Buckingham B, Bode B, Tamborlane W, and Kaufman F, “Safety of a hybrid closed-loop insulin delivery system in patient with type 1 diabetes,” JAMA, vol. 316, pp. 1407–1408, 2016. [DOI] [PubMed] [Google Scholar]
- [9].Garg S, Weinzimer S, Tamborlane W, Buckingham B, Bode B, Bailey T, Brazg R, Ilany J, Slover R, Anderson S, Bergenstal R, Grosman B, Roy A, Cordero T, Shin J, Lee S, and Kaufman F, “Glucose outcomes with the in-home use of a hybrid closed-loop insulin delivery system in adolescents and adults with type 1 diabetes,” Diabetes Technol. Ther, vol. 19, pp. 155–163, 2017. [DOI] [PMC free article] [PubMed] [Google Scholar]
- [10].Turksoy K, Bayrak E, Quinn L, Littlejohn E, and Cinar A, “Multivariable adaptive closed-loop control of an artificial pancreas without meal and activity announcement,” Diab. Tech. Ther, vol. 15(5), pp. 386–400, 2013. [DOI] [PMC free article] [PubMed] [Google Scholar]
- [11].Turksoy K, Quinn L, Littlejohn E, and Cinar A, “Multivariable adaptive identification and control for artificial pancreas systems,” IEEE Trans. Biomed. Eng, vol. 61, no. 3, pp. 883–891, 2014. [DOI] [PubMed] [Google Scholar]
- [12].Turksoy K, Hajizadeh I, Hobbs N, Kilkus J, Littlejohn E, Samasi S, Feng J, Sevil M, Lazaro C, Ritthaler J, Hibner B, Devine N, Quinn L, and Cinar A, “Multivariable artificial pancreas for various exercise types and intensities,” Diab. Tech. Ther, vol. 20(10), pp. 662–671, 2018. [DOI] [PMC free article] [PubMed] [Google Scholar]
- [13].Turksoy K, Paulino T, Zaharieva D, Yavelberg L, Jamnik V, Ridell M, and Cinar A, “Classification of physical activity: Information to artificial pancreas control systems in real time,” J. Diabetes. Sci. Technol, vol. 9, no. 6, pp. 1200–1207, 2015. [DOI] [PMC free article] [PubMed] [Google Scholar]
- [14].Dasanayake I, Bevier W, Castorino K, Pinsker J, Seborg D, Doyle FJ III, and Dassau E, “Early detection of physical activity for people with type 1 diabetes mellitus,” J. Diabetes. Sci. Technol, vol. 9, no. 6, pp. 1236–1245, 2015. [DOI] [PMC free article] [PubMed] [Google Scholar]
- [15].Jacobs P, Resalat N, El Youssef J, Reddy R, Branigan D, Preiser N, Condon J, and Castle J, “Incorporating and exercise detection, grading, and hormone dosing algorithm into the artificial pancreas using accelerometry and heart rate,” J. Diabetes. Sci. Technol, vol. 9, no. 6, pp. 1175–1184, 2015. [DOI] [PMC free article] [PubMed] [Google Scholar]
- [16].Sevil M, Rashid M, Maloney Z, Hajizadeh I, Samadi S, Askari MR, Hobbs N, Brandt R, Park M, Quinn L, and Cinar A, “Determining physical activity characteristics from wristband data for use in automated insulin delivery systems,” IEEE Sensors, vol. 20, no. 21, pp. 12 859–12 870, 2020. [DOI] [PMC free article] [PubMed] [Google Scholar]
- [17].Verrotti A, Prezioso G, Scattoni R, and Chiarelli F, “Autonomic neuropathy in diabetes mellitus,” Frontiers in Endocrinology, vol. 5, pp. 205–, 2014. [DOI] [PMC free article] [PubMed] [Google Scholar]
- [18].Vinik A, Maser R, Mitchell B, and Freeman R, “Diabetic autonomic neuropathy,” Diabetes care, vol. 26, no. 5, pp. 1553–1579, 2003. [DOI] [PubMed] [Google Scholar]
- [19].Ermes M, Pärkkä J, Mäntyjärvi J, and Korhonrn I, “Detection of daily activities and sports with wearable sensors in controlled and uncontrolled conditions,” IEEE Trans. Inf. Tech. in Biomed, vol. 12, no. 1, pp. 20–26, 2008. [DOI] [PubMed] [Google Scholar]
- [20].Mannini A and Sabatini A, “Machine learning methods for classifying human physical activity from on-body accelerometers,” Sensors, vol. 10, pp. 1154–1175, 2010. [DOI] [PMC free article] [PubMed] [Google Scholar]
- [21].Lyden K, Kozey Keadle S, Staudenmayer J, and Freedson P, “A method to estimate free-living active and sedentary behavior from an accelerometer,” Med. Sci. Sports Exerc, vol. 46, no. 2, pp. 386–397, 2014. [DOI] [PMC free article] [PubMed] [Google Scholar]
- [22].Ellis K, Kerr J, Godbole S, Staudenmayer J, and Lanckriet G, “Hip and wrist accelerometer algorithms for free-living behavior classification,” Med. Sci. Sports Exerc, vol. 40, no. 5, pp. 933–940, 2016. [DOI] [PMC free article] [PubMed] [Google Scholar]
- [23].Staudenmayer J, He S, Hickey A, Sasaki J, and Freedson P, “Methods to estimate aspects of physical activity and sedentary behavior from high-frequency wrist accelerometer measurements,” J. Appl. Physiol, vol. 119, pp. 396–403, 2015. [DOI] [PMC free article] [PubMed] [Google Scholar]
- [24].Bharti P, Panwar A, Gopalakrishna G, and Chellappan S, “Watch-dog: Detecting self-harming activities from wrist worn accelerometers,” IEEE J. Biom. Health Inform, vol. 22, no. 3, pp. 686–696, 2018. [DOI] [PubMed] [Google Scholar]
- [25].Gupta P and Dallas T, “Feature selection and activity recognition system using a single triaxial accelerometer,” IEEE Trans. Biomed. Emg, vol. 61, no. 6, pp. 1780–1786, 2014. [DOI] [PubMed] [Google Scholar]
- [26].Sevil M, Rashid M, Askari MR, Maloney Z, Hajizadeh I, and Cinar A, “Detection and characterization of physical activity and psychological stress from wristband data,” Signals, vol. 1, no. 2, pp. 188–208, 2020. [Google Scholar]
- [27].Breiman L, “Random forests,” Machine Learning, vol. 45, pp. 5–32, 2001. [Google Scholar]
- [28].Shalev-Shwartz S and Ben-David S, Understanding Machine Learning: From Theory to Algorithms. Cambridge University Press, 2014. [Google Scholar]
- [29].James G, Witten D, Hastie T, and Tibshirani R, An Introduction to Statistical Learning. Springer, 2013. [Google Scholar]
- [30].Bishop CM, Pattern recognition and machine learning. New York, NY: Springer, 2006. [Google Scholar]
- [31].Cramer JS, “The origins of logistic regression,” Tinbergen Inst. Working Paper No. 2002-119/4, https://papers.tinbergen.nl/02119.pdf, 2002. [Google Scholar]
- [32].Christmann A, Support Vector Machines. Springer New York, 2008. [Google Scholar]
- [33].Dasarathy BV, Nearest neighbor (NN) norms : nn pattern classification techniques. IEEE Computer Society Press ; IEEE Computer Society Press Tutorial, 1991. [Google Scholar]
- [34].Goodfellow I, Bengio Y, and Courville A, Deep Learning. MIT Press, 2016, http://www.deeplearningbook.org. [Google Scholar]
- [35].Skolova M and Lapalme G, “A systematic analysis of performance measures for classification tasks,” Inf. Process. and Manag, vol. 45, pp. 427–437, 2009. [Google Scholar]
- [36].Ahmadi MN, Pfeiffer KA, and Trost SG, “Physical activity classification in youth using raw accelerometer data from the hip,” Measurement in Physical Education and Exercise Science, vol. 24, no. 2, pp. 129–136, 2020. [Google Scholar]
- [37].Sedighi H, “Classification of human activity recognition using smartphones,” 2020. [Google Scholar]
- [38].Sheng B, Moosman O, Del Pozo-Cruz B, Del Pozo-Cruz J, Alfonso-Rosa R, and Zhang Y, “A comparison of different machine learning algorithms, types and placements of activity monitors for physical activity classification,” Measurement, vol. 154, p. 107480, 2020. [Google Scholar]
Associated Data
This section collects any data citations, data availability statements, or supplementary materials included in this article.