

Abstract
Humans have suffered from a variety of infectious diseases since a long time ago, and now a new infectious disease called COVID-19 is prevalent worldwide. The ongoing COVID-19 pandemic has led to research of the effective methods of diagnosing respiratory infectious diseases, which are important to reduce infection rate and help the spread of diseases be controlled. The onset of COVID-19 has led to the further development of existing diagnostic methods such as polymerase chain reaction, reverse transcription polymerase chain reaction, and loop-mediated isothermal amplification. Furthermore, this has contributed to the further development of micro/nanotechnology-based diagnostic methods, which have advantages of high-throughput testing, effectiveness in terms of cost and space, and portability compared to conventional diagnosis methods. Micro/nanotechnology-based diagnostic methods can be largely classified into (1) nanomaterials-based, (2) micromaterials-based, and (3) micro/nanodevice-based. This review paper describes how micro/nanotechnologies have been exploited to diagnose respiratory infectious diseases in each section. The research and development of micro/nanotechnology-based diagnostics should be further explored and advanced as new infectious diseases continue to emerge. Only a handful of micro/nanotechnology-based diagnostic methods has been commercialized so far and there still are opportunities to explore.
Keywords: Respiratory infectious diseases, Micro/nanotechnology-based diagnostic methods, Nanomaterials, Micromaterials, Micro/nanodevices
Introduction
Infectious diseases are diseases infected by microorganisms, such as viruses, bacteria, and fungi, that can enter the human body [1]. Humans have suffered from multiple infectious diseases in the long history of humankind. The world is currently facing a tragic past again due to the COVID-19 pandemic and tries to overcome it. The importance of research on diagnosing respiratory infectious diseases has become more critical these days, especially with the onset of COVID-19. Respiratory infectious diseases usually result in symptoms related to the respiratory system, such as coughing or pneumonia. There have been several widespread infectious respiratory diseases in the past, but many historians have officially recognized the spread of influenza that spread from Africa to Europe in 1510 for the first time [2, 3]. In 1580, the expansion of influenza caused the first severe worldwide epidemic, which begun in Asia and spread to Africa, Europe, and America. As a result, many countries in Europe suffered for six weeks, with 9000 deaths in Rome alone [4]. Influenza pandemic has continued since 1580, but especially Spanish flu infected by influenza A (H1N1) virus from 1918 to 1920 was one of the most disastrous influenza diseases in medical history [5]. The number of people infected with Spanish flu was estimated at approximately 500 million worldwide, with deaths of about 50 to 100 million people, even more than deaths of World War I [6]. In 1968, the new influenza A (H3N2) virus started the influenza pandemic in Hongkong, and many deaths happened, but it was fewer than those in 1918 of Spanish flu [7]. However, the severity of the H3N2 virus continues to be emphasized because it currently causes about twice as much hospitalization per year than that of the H1N1 virus [8].
In the twenty-first century, respiratory infectious diseases became more prevalent in an epidemic area, and the global spread of the severe acute respiratory syndrome (SARS) infected by SARS coronavirus (SARS-CoV) began in 2002 in Guangdong Province, China [9]. The middle east respiratory syndrome (MERS) also emerged in 2012 through MERS coronavirus (MERS-CoV) [10]. Both diseases had lower infection rates than those of previous respiratory infectious diseases; however, they showed high fatality of up to 15% in SARS and 36% in MERS, respectively [11, 12]. These days, people have suffered from COVID-19, which was originated from Wuhan, China, in December 2019, with 198.34 million infections and 4.23 million deaths worldwide as of August 1, 2021, according to the ‘Our World in Data’ (https://ourworldindata.org/coronavirus-data).
With the rampancy of these respiratory infectious diseases, the necessity for rapid and accurate diagnosis has emerged to reduce infection rates and cease the epidemic. Rather than diagnosing with patients’ symptoms and medical history in the past, various diagnostic methods such as gram-stain, pathogen culturing, biochemical tests, and serology have emerged. In addition, molecular tests, such as polymerase chain reaction (PCR), reverse transcription-polymerase chain reaction (RT-PCR), loop-mediated isothermal amplification (LAMP), and nucleic acid amplification tests, have emerged and are widely used. They are still actively developed to increase efficiency. However, there are several issues: the need for extensive equipment, the possibility of false results, contamination of samples, etc. Thus, research on micro/nanotechnology-based diagnostic methods has been actively performed to tackle the shortcomings of conventional diagnostic methods.
In this paper, we rigorously review respiratory infectious diseases caused by viruses, bacteria, and fungi. Also, conventional methods for diagnosing respiratory infectious diseases and their drawbacks are briefly discussed. Then, micro/nanotechnology-based diagnostic methods, such as nanomaterials-based, micromaterials-based, and micro/nanodevice-based techniques are reviewed, and the performance of each method are summarized.
Respiratory infectious diseases
Virus-caused
The definition of a virus was defined 50 years after discovering the existence of infectious agents smaller than bacteria [13]. A virus is an infectious agent that can only replicate in a living cell. Most viruses on earth infect microorganisms such as bacteria and archaeal organisms [14, 15]. Therefore, every ecosystem that archaeal organisms can dominate is suitable for viruses to populate [16]. Viruses cause many respiratory infections in humans, and due to their ability to mutate, they can easily bring about different complications.
Severe acute respiratory syndrome (SARS)
In late 2002, SARS was reported in the Guangdong Province, China. The symptoms are mainly fever, dry cough, dyspnea, headache, and hypoxemia. The progression of respiratory failure can lead to death. SARS-CoV is the agent of this infection and can be transmitted from human to human by respiratory droplets [17, 18].
Middle east respiratory syndrome (MERS)
The first case of MERS happened in Jeddah, Saudi Arabia, in June 2012. This new coronavirus had similarities to the agent that caused an epidemic of SARS in 2002–2003. The symptoms of MERS can be fever, cough, chills, sore throat, myalgia, and arthralgia. MERS can be highly lethal due to the rapid progression of pneumonia during illness [17].
Corona virus disease-19 (COVID-19)
SARS-Cov-2, which causes COVID-19, belongs to the beta-coronaviruses, one of the seven subtypes of coronavirus. Moreover, SARS-CoV-2 is related to the cause of SARS infection. The initial symptoms of COVID-19 consist of fever, nasal congestion, fatigue, and the infection's progress can lead to severe disease with dyspnea and pneumonia [19]. The transmission rate of SARS-CoV-2 is higher than SARS-CoV [20].
Influenza
Influenza is recognized as an acute respiratory infection causing epidemics around the globe [21]. Many pandemics were caused by the influenza subtype, such as the Hong Kong pandemic in 1968 by H3N2 and the pandemic caused by H2N2 in 1957. Also, in 1918, avian influenza (H1N1) infection killed approximately 20 million people worldwide [22]. High fever, cough, headache, upper respiratory illness, transient muscle pain, pneumonia, coryza, malaise are the main symptoms of flu caused by influenza [21, 23]. Vaccination can be an effective measure against influenza. Pandemic planning and vaccination rollouts are challenging due to the rapid evolution of influenza [23].
Bronchiolitis
Respiratory syncytial virus (RSV) is the leading cause of distressing and life-threatening respiratory infection called bronchiolitis. This infection usually targets infants and young children. The infected show sign of coryza, low-grade fever, tachypnea, hyperinflation, chest retraction, and widespread crackle as well as wheezes. In most of the world, RSV bronchiolitis occurs in seasonal epidemics [24].
Rubella
The causative agent of rubella was first identified in 1962. The infection of the rubella virus may lead to mild measles-like disease. Nevertheless, rubella can result in miscarriage or congenital rubella syndrome when the rubella virus infects the fetus. The virus can infect children and young adults via the respiratory route [25].
Chickenpox (varicella)
Varicella, or Chickenpox, is a highly infectious illness that causes mild to moderate symptoms. Chickenpox is caused by the Varicella-zoster virus and, the main symptoms are the vesicular rash, followed by fever and malaise. Varicella-zoster virus can be spread by droplets and aerosols from the nasopharynx, as well as skin lesions when rashes appear. Children in the non-vaccinated population are often infected [26]. Varicella-zoster virus can be diagnosed by culture, PCR, clinical diagnosis, and differential diagnosis. The preferred specimens for the diagnosis methods are skin scrapings [26, 27].
Measles
Another highly contagious viral infection causing respiratory difficulties is measles, also known as rubeola. The virus can be transmitted through direct person to person or through sneezing and coughing. Small respiratory droplets and particles can float in the air. Symptoms of measles are fever, generalized maculopapular rash, and cough, coryza, or conjunctivitis. Small white spots on the buccal mucosa, also known as Koplik spots, are another common symptom, but they might not be present in some cases. Clinical picture and laboratory testing are the main methods of measles diagnosis [28].
Mumps
Mumps, known as a common childhood infection, is a viral infection, which can be transmitted by aerosols and respiratory droplets. Mumps is characterized by swelling of the parotid gland; however, in some cases, this characteristic is not present. The complications caused by this disease are aseptic meningitis, encephalitis, orchitis, and oophoritis. For the diagnosis of Mumps, clinical diagnosis based on the parotid swelling can be used, but it is necessary to be confirmed by laboratory diagnosis such as the serological test [29].
Croup
Croup is a benign respiratory condition with a low mortality rate. The cause of croup is usually viruses such as parainfluenza, enterovirus, human bocavirus, influenza A and B viruses, respiratory syncytial virus, rhinovirus, and adenovirus. Although bacterial cases are rare, diphtheria and mycoplasma pneumonia also can cause the infection. Viral croup symptoms are low-grade fever, coryza, barking cough and various respiratory distresses [30, 31].
Bacteria-caused
Bacteria are categorized as prokaryotes. These microscopic, single-celled organisms have a pivotal role in human lives. Although some of them are useful for humans, some are recognized as infectious disease agents.
Tuberculosis
Mycobacterium tuberculosis (MTB) causes tuberculosis. This infection is contagious and can be transmitted by respirable droplets when coughing. People may have active or latent infections. The patient shows symptoms such as cough, chest pain, fatigue, weight loss, fever, shortness of breath, and night sweats in the active disease. People who are infected but do not show any symptoms have latent infection. In this case, the infection is not contagious; however, there is a risk of developing active tuberculosis [32, 33].
Pneumococcal diseases
Streptococcus pneumoniae bacteria, also known as pneumococcus, can cause pneumonia, meningitis, and febrile bacteraemia. This agent can be transmitted by direct contact with respiratory droplets from patients and healthy carriers. Exposure to pneumococcus can cause transient nasopharyngeal colonization. Contiguous spread to the sinuses or middle ear can lead to pneumococcal meningitis. Also, the infection is caused by invasion of the bloodstream with or without seeding of secondary sites [34].
Pertussis
Whooping cough (pertussis) is caused by the bacterial pathogen Bordetella pertussis. This infection is a highly contagious acute respiratory illness. The transmission of this disease is similar to the other contagious disease. People can be infected by the respiratory droplets of an infected person [35]. The symptoms of pertussis are paroxysmal cough with whooping and vomiting [36].
Fungi-caused
Fungi can be unicellular yeasts, filamentous as well as multicellular molds [37]. Although it seems that the majority of infections are caused by viruses and bacteria, over 300 million people have suffered from fungal infections. Among the 1.5 million fungal species that exist, roughly 300 of them are pathogenic to humans [38]. Fungi grow in warm and humid conditions; therefore, they infect humans via respiratory, digestive, and reproductive tracts, as well as genital areas and other body interfaces. These areas have ideal conditions for fungi to grow [37]. Candida and Aspergillus are among the most common causes of serious diseases in humans [38].
Aspergillus niger is a filamentous fungus. When fungal spores are inhaled, their fragments may attach to the pulmonary walls [39]. Aspergillus-related diseases can cause a different variety of disorders of immunity, such as allergic forms of aspergillosis. Invasive aspergillosis can lead to infection-related death of patients with acute leukemia and recipients of allogeneic hematopoietic stem-cell transplants [40].
There are approximately 150 species of the genus Candida [41], one of which is Candida albicans. Candida albicans is a yeast-like fungus that can undergo a morphologic transition from yeast to hyphal [42]. Two major infections in humans caused by this yeast are oral or vaginal candidiasis, categorized as superficial infections, and invasive candidiasis that has high morbidity and mortality rates [43, 44]. However, candida pneumonia is caused by a rare respiratory infection [45]. Here we summarize major respiratory infectious diseases categorized with a cause in Table 1.
Table 1.
Major respiratory infectious diseases caused by virus, bacteria, and fungi
| Virus-caused | Bacteria-caused | Fungi-caused |
|---|---|---|
| SARS | Tuberculosis | Aspergillosis |
| MERS | Pneumococcal diseases | Candidiasis |
| COVID-19 | Pertussis | |
| Influenza | ||
| Bronchiolitis | ||
| Rubella | ||
| Chickenpox | ||
| Measles | ||
| Mumps | ||
| Croup |
Conventional diagnosis methods
Throughout history, humankind has encountered different known or unknown infectious diseases. The first step to confront a disease is the identification and diagnosis of the infection. In clinical diagnosis, laboratory findings play an essential role [46]. A specific sample should be taken from patients’ bodies, and then different tests are performed on the sample in laboratories. These tests are as follows: gram-stain, pathogen culturing and biochemical methods, serology, and molecular tests such as PCR, RT-PCR, LAMP, and nucleic acid amplification tests [47]. However, multiple conditions can have similar symptoms. Therefore, a clinician should use patient history and physical examination techniques, in addition to the clinical findings and patient’s symptoms to narrow down the causes of the symptoms. Afterward, a correct diagnosis can be made [48]. This method, which accompanies clinical findings, is called differential diagnosis [49]. In this chapter, two emerging and gold standard methods used for diagnosing respiratory infectious diseases, such as PCR and LAMP, are discussed.
Polymerase chain reaction (PCR)
DNA amplification using PCR was introduced in 1983 by Kary Mullis at Cetus Corporation [50–52]. This method was originally utilized to amplify human β-globin DNA and prenatal diagnosis of sickle-cell anemia [53]. The PCR is an in vitro method for enzymatic synthesis of specific DNA sequences, using two oligonucleotide primers that hybridize to opposite strands and flank the region of interest in the target DNA [53]. Put into basic terms, PCR is a method that combines a DNA sample with an oligonucleotide primer, deoxynucleotide triphosphate, and the thermostable Taq DNA polymerase in a suitable buffer. After repetitively heating and cooling the mixture for hours, the desired amount of amplification can be achieved [53]. By utilizing the PCR, a specific segment of DNA can be amplified, and up to billions of copies of that segment can be made rapidly [50, 51, 53]. Although PCR can be utilized to alter a particular template sequence due to its precision, it is typically used to make copies of DNA segments and detect the presence or absence of a specific DNA product. Therefore, PCR is basically a qualitative method [53, 54].
A newer PCR method has emerged to detect and quantify the PCR product in real-time while being synthesized [55]. This method is called quantitative real-time PCR. When quantification of the synthesized product is available, the alterations of gene expression levels in tumors, microbes, or other disease states can be analyzed [54].
Like any other method, PCR has limitations too. Considering the sensitivity and the capacity of PCR to synthesize millions of DNA copies, contamination of the sample by even a trace amount of DNA is a source of potential problems [53, 54]. Furthermore, some preliminary sequence data are required to design the primers for PCR. Additionally, the primers used for PCR can anneal non-specifically to sequences that are similar but not completely identical to target DNA. Incorporating incorrect nucleotides by the DNA polymerase into the PCR sequence can be considered as another limitation [54].
Loop-mediated isothermal amplification (LAMP)
Although PCR is praised for its sensitivity, apparent high simplicity, and other characteristics, clinical and environmental samples can have inhibitors affecting the result of the PCR reaction. Also, extensive equipment is required to perform precise temperature cycling [56, 57]. Notomi et al., in 2000, have established LAMP as a DNA detection method to overcome the low amplification efficiency and the above shortcomings of PCR. LAMP is a novel method to amplify nucleic acid using only one type of enzyme under isothermal conditions in the range of 65 °C [56, 57]. This method has been used successfully for the detection of infectious pathogens [58]. Due to the LAMP isothermal reaction, simple and cost-effective reaction equipment can be used. More importantly, since the optimal temperature of the enzyme can be maintained when conducting the reaction, extremely high amplification efficiency can be achieved. Furthermore, compared to PCR, it is less likely to observe the inhibition reaction at the later amplification stage [56].
The target DNA gathered from partially processed or non-processed samples can be amplified in the LAMP method. This advantage decreases the reaction time and eliminates the need for DNA extraction, which is a step that is prone to contamination [59]. Four primers are used to target six regions on the target nucleic acid in the LAMP method [60]. At standard LAMP conditions, reverse transcription is possible, enabling a one-step reaction for both DNA and RNA targets [57].
One of the drawbacks of LAMP is the primer design since LAMP primers need to recognize six to eight regions of the target DNA sequence. Factors such as constraints on the distances between the primers and requirements on the free energy of primer binding can lead to difficulty in identifying a suitable primer set for the desired target. Moreover, isothermal methods such as LAMP are prone to generate false positives or nonspecific amplification. Although it is necessary to screen primer sets in advance for potential interaction, false positives can occur during experimentation and carry-over contamination. Iterative primer design or careful tuning of reaction conditions can be utilized to mitigate false-positive amplification in clinical diagnosis [57].
One of the key leading ways to enhance public health is to diagnose infectious diseases at their early stages rapidly. A medical diagnosis should specify a disease with high accuracy; in other words, it should have fewer errors and false results [61]. New evolving gold standard diagnosis methods such as PCR and LAMP are establishing; these diagnosis methods, however, have shortcomings that may limit the use of the diagnosis or lead to false results. By incorporating micro/nanotechnology with medical diagnosis, the limitation of the present diagnosis methods can be overcome. Moreover, new promising diagnostic techniques are emerging [61].
In the Table 2, performance comparison between PCR and LAMP for different respiratory infectious diseases has been made.
Table 2.
Performance comparison between PCR and LAMP for diagnosis of respiratory infectious diseases
| Agent | Disease | Technique | Limit of detection (LOD) | Detection time (min) | Specificity | Sensitivity | References |
|---|---|---|---|---|---|---|---|
| Virus | MERS | LAMP | 10 copies/µL | 35 | – | – | [62] |
| PCR | 10 copies/µL | – | 100% (95% CI, 91.1–100%) | 100% (95% CI, 91.1–100%) | [63] | ||
| COVID-19 | LAMP | 6.7 copies/reaction | 60 | 100% | 95.07% (95% CI: 0.92–0.98) | [64, 65] | |
| 90 | 98.21% (95% CI: 0.96–1.00) | ||||||
| PCR | 5 copies/µL | – | 100% | 100% | [66] | ||
| Mumps | LAMP | 0.8 pfu/mL | 60 | – | > 0.1 threshold of turbidity | [67, 68] | |
| PCR | 2 pfu/mL | – | 100% (85.13%–100%) | 98.06% (93.19%–99.17%) | [69, 70] | ||
| Influenza | LAMP | 10–3 pfu/reaction | 39 | 100% | 97.5% | [71–73] | |
| PCR | 10–2 pfu/reaction | – | 95.5% | 82.9% | [72, 74, 75] | ||
| Bronchiolitis (RSV A) | LAMP | 102 copies/5 μL | 60 | – | 4–12 TCID 50/mL | [75, 76] | |
| PCR | 1.8 to 2.3 pfu/mL | 480 | – | 0.023 pfu/ml | [77, 78] | ||
| Bronchiolitis (RSV B) | LAMP | 102 copies/5 μL | 60 | – | 4–12 TCID 50/mL | [75, 76] | |
| PCR | 1.8 to 2.3 pfu/mL | 480 | – | 0.018 pfu/ml | [77, 78] | ||
| Rubella virus | LAMP | 100–1000 pfu/reaction | 60 | – | – | [79] | |
| PCR | 10 copies/reaction | – | 100% | 83–95% | [79–81] | ||
| Bacteria | Tuberculosis | LAMP | 5 pg | – | 94.2% | 100% | [82, 83] |
| PCR | 4.0 copies/μL | – | 98.2% | 79.1% | [84] | ||
| Pneumococcal | LAMP | 10 copies | 30 | 99.3% | 100% | [85, 86] | |
| PCR | 101 DNA copies/mL | – | 96% (95% CI, 86.5 to 99.5%) | 53.5% (95% CI, 40 to 67%) | [87, 88] | ||
| Fungi | Candidiasis | LAMP | 2 × 101 copies/reaction | 90 | 100% | – | [89] |
| PCR | 1 C. auris cfu/PCR | 240 | 100% | 2 cfu/mL | [90, 91] | ||
| Aspergillosis | LAMP | 10 conidia/reaction | Less than 60 | – | > 10 copies | [92, 93] | |
| PCR | 0.6 Aspergillus fumigatus genomes | – | 93.6% | 86.1% | [94, 95] |
Micro/nanotechnology-based diagnosis methods
Nanomaterials-based diagnostics
Nanodiagnostics is referred to the applications of nanotechnology in diagnosis. In recent decades, nanodiagnostics has contributed significantly to accurate and timely discrimination and diagnosis of infectious diseases via the unique physio-chemical and optical characteristics of nanomaterials [96]. Most of the causing agents of infectious diseases, such as viruses, bacteria, and fungi, may sometimes lead to an epidemic outbreak and higher morbidity and mortality [97, 98]. Therefore, the clinical applications of nanotechnology-based diagnostic methods are gaining importance these days. This is because of the capability of nanodiagnostics for rapid, accurate, robust, user-friendly, and cost-effective detection of clinical samples [99, 100].
The incorporation of nanomaterials in biosensing design led to a significant enhancement in the sensor’s performance with a lower limit of detection (LOD) due to their high surface-to-volume ratio. Moreover, because of the small size of nanomaterials, they present unique physical and chemical properties different from those of bulk materials [101]. In recent years, gold nanoparticles (AuNPs), silver nanoparticles (AgNPs), magnetic nanoparticles (MNPs) (e.g., iron oxide nanoparticles and their hybrids), carbon nanomaterials (e.g., carbon nanotubes (CNTs) and graphene), and quantum dots (QDs) have been exploited as promising nanomaterials in the diagnostic applications. These days, one of the most appropriate nanomaterials for clinical diagnosis and other biomedical applications is AuNPs due to their unique properties, such as favorable biocompatibility, nontoxicity, inert nature, and unique optical characteristics [96]. On the other hand, compared to AuNPs, AgNPs have a higher extinction coefficient, contributing to better optical sensitivity. Moreover, they have quantum characteristics (small granule diameter) [102].
Iron oxide nanoparticles are one of the naturally present nanoforms which have attracted increasing attention in nano-biomedicine and bio-imaging. They have also been used to diagnose and detect pathogens because of their facile surface functionalization with recognition moieties such as antibodies, antibiotics, and carbohydrates [96]. Carbon nanomaterials, such as CNTs and graphene, are a good choice for fabricating sensitive, selective, and low-cost biosensors for many infectious diseases due to their mechanical, electrical, and optical characteristics [102]. QDs have been widely used owing to their unique optical and physical characteristics, the ability of signal enhancement, inherent miniaturization, low detection limits, low cost, low power requirements, and excellent stability against the environment and chemicals. They also have some advantages over other fluorescence-based methods such as broad absorption spectra, narrow emission spectra, slow excited-state decay rates, and broad absorption cross-sections [103, 104].
Nanomaterials-based diagnostics for viral diseases
Middle East Respiratory Syndrome (MERS) Kim et al. have presented a label-free colorimetric assay based on a double-stranded DNA (dsDNA) shielded AuNPs under positive electrolyte (e.g., 0.1 M MgCl2) for detection of MERS-CoV. In this assay, forming disulfide bonds by hybridizing thiolated probes with a target restrained the aggregation of AuNPs by salt and limited the color change for MERS detection (Fig. 1). This assay can detect MERS-CoV within 10 min with a potential LOD of 1 pmol/μL [105]. Layqah et al. have developed an AuNPs-based electrochemical immunosensor for the diagnosis of MERS-CoV. For increasing the sensor’s sensitivity and signal response, an array of carbon electrodes coated with AuNPs has been used in this study. The MERS-CoV protein was immobilized to the AuNPs. In the presence of a fixed concentration of added antibodies in the sample, there is a competition between the immobilized MERS-CoV protein and virus particles for binding to the antibody in the sample. The binding event is detected by measuring the current changes of the square wave voltammetry (SWV) signal by adding the MERS-CoV antigen in different concentrations. In the absence of virus infection, the binding of an antibody to the immobilized MERS-CoV protein led to a decrease in the SWV peak. However, less amount of antibody binds to the immobilized viral antigen in the presence of virus particles. The immunosensor can detect MERS-CoV in 20 min with linear response in the concentrations range of 0.001–100 ng/mL. It also showed high selectivity in the presence of other non-specific proteins (Flu A and Flu B) with a low LOD of 1.0 pg/mL and acceptable stability [106].
Fig. 1.

Schematic diagram of the operation procedure for the colorimetric diagnosis of DNA based on disulfide induced self-assembly: a Salt-induced aggregation of AuNPs in the absence of targets; b preventing AuNPs from salt-induced aggregation by disulfide induced self-assembly in the presence of targets. Reprinted with permission from [105]. Copyright 2019 American Chemical Society
Furthermore, a paper-based colorimetric DNA sensor has been developed for diagnosis of MERS by using a cationic pyrrolidinyl peptide nucleic acid (acpcPNA)-induced AgNPs aggregation probe. The presence of a single positive charge from the lysine at the C-terminus in the acpcPNA probe led to the aggregation of citrate anion-stabilized AgNPs in the absence of complementary DNA. However, in the presence of the MERS-CoV, the formation of the anionic DNA-acpcPNA duplex contributed to the AgNPs dispersion because of electrostatic repulsion, causing a detectable color change. Under optimized conditions, this device showed a LOD of 1.53 nM. This assay can serve as a point-of-use diagnostic tool due to its incorporation with a paper-based analytical device [107].
COVID-19 The recent occurrence of the COVID-19 pandemic caused by the deadly virus (SARS-CoV-2) has led to the development of several indirect detection assays using nanomaterials. In this line, there are studies on using AuNPs for the detection of SARS-CoV-2. For the diagnosis of N-gene (nucleocapsid phosphoprotein) of SARS-CoV-2, a colorimetric assay has been developed based on capped AuNPs with thiol-modified antisense oligonucleotides (ASOs) [108]. Within 10 min from the isolated RNA samples, this sensor could detect positive COVID-19 cases. Selective agglomeration of the thiol-modified ASO-capped AuNPs in the presence of its target RNA sequence of SARS-CoV-2 caused a surface plasmon resonance change. Moreover, the RNA strand is cleaved from the RNA–DNA hybrid by adding RNaseH, which results in a visually detectable precipitate from the solution mediated by the additional agglomeration among the AuNPs (Fig. 2). This assay has shown a selective and naked-eye diagnosis of SARS-CoV-2 in the presence of MERS-CoV viral RNA with LOD of 0.18 ng/μL and a tested dynamic range of 0.2–3 ng/μL.
Fig. 2.
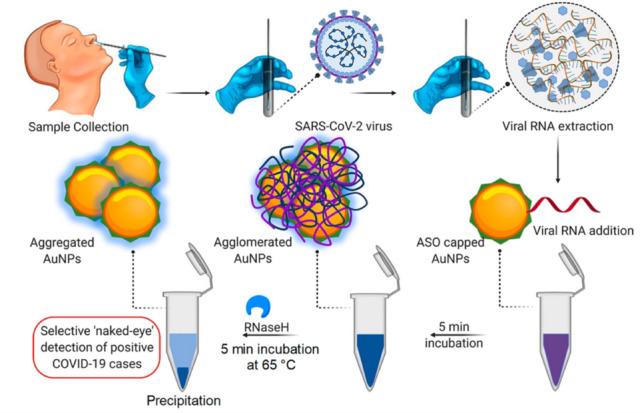
The schematic diagram for the selective and naked-eye diagnosis of SARS-CoV-2 RNA based on designed ASO-capped AuNPs. Reprinted with permission from [108]. Copyright 2020 American Chemical Society
In another study, Huang et al. have presented a colloidal gold nanoparticle-based lateral-flow (AuNP-LF) assay for on-site diagnosis of the immunoglobulin M (IgM) antibody against the SARS-CoV-2 by indirect immunochromatography method in 15 min [109]. AuNP-LF strips were prepared by using a coated analytical membrane with the SARS-CoV-2 nucleoprotein (SARS-CoV-2 NP) for sample capture and conjugated AuNPs with antihuman IgM to form the detecting reporter. The performance evaluation of this assay was done by testing serum samples of COVID-19 infected patients and healthy humans. The results were compared with the real-time PCR. AuNP-LF assay was able to achieve results within 15 min and needed only 10–20 μL serum for each test. This assay exhibited great selectivity in the diagnosis of IgM against the SARS-CoV-2 virus with a sensitivity of 100% and specificity of 93.3%. Li et al. have developed a rapid and simple point-of-care lateral flow immunoassay based on AuNPs to detect IgM and IgG antibodies simultaneously against the SARS-CoV-2 virus in human blood within 15 min for diagnosis of COVID-19 patients at different infection stages [110]. In this work, AuNPs were conjugated with anti-IgM and anti-IgG human antibodies to form reporter molecules. The applicability of this immunoassay was confirmed using blood serum samples of 397 PCR confirmed COVID-19 patients and 128 negative patients from eight different clinical sites. The sensitivity and specificity of this assay were 88.66% and 90.63%, respectively. Compared to a single IgM or IgG test, the IgM-IgG combined assay kit showed better sensitivity and utility. In a similar report, a colloidal gold-based immunochromatographic (ICG) strip targeting viral IgM or IgG antibody has been developed for detection of SARS-CoV-2 in whole blood and plasma samples [111]. The sensitivity of this assay in nucleic acid confirmed cases were 11.1% at the early stage (1–7 days after onset), 92.9% at the intermediate stage (8–14 days after onset), and 96.8% at the late stage (more than 15 days). In nucleic acid-negative suspected cases, the ICG detection capacity was 43.6%.
In another work, a combination of a dual-functional localized surface plasmon resonance (LSPR) biosensor with the plasmonic photothermal (PPT) effect has been developed for the clinical diagnosis of COVID-19 [112]. Functionalized gold nanoislands (AuNIs) with complementary DNA receptors detected the selected sequences from SARS-CoV-2 by nucleic acid hybridization. By generating the thermoplasmonic heat on the same AuNIs chip when illuminated at their plasmonic resonance frequency, better sensing performance was achieved. This biosensor showed a high sensitivity for the selected SARS-CoV-2 sequences (tested over the concentration range of 0.01 pM–50 μM) with a LOD of 0.22 pM.
Recently, graphene-based biosensors have also been developed for the diagnosis of the COVID-19 virus. A graphene sheet coated field-effect transistor (FET)-based biosensor with a specific antibody against SARS-CoV-2 spike protein was developed [113]. The sensor performance was evaluated using antigen protein, cultured virus, and nasopharyngeal swab specimens from COVID-19 patients (Fig. 3). In this work, SARS-CoV-2 was successfully detected by the fabricated FET sensor in culture medium (LOD: 1.6 × 101 pfu/mL, linear response range: 1.6 × 101–1.6 × 10⁴ pfu/mL), and clinical samples (LOD: 2.42 × 10² copies/mL). Furthermore, the device exhibited specificity towards SARS-CoV-2 in the presence of MERS-CoV proteins.
Fig. 3.

Schematic representation for the FET sensor operation procedure for the diagnosis of COVID-19 based on graphene as a sensing material. SARS-CoV-2 spike antibody is conjugated onto the graphene sheet by 1-pyrenebutyric acid N-hydroxysuccinimide ester, which is an interfacing molecule as a probe linker. Reprinted with permission from [113]. Copyright 2020 American Chemical Society
Furthermore, studies have shown the significant role of MNPs in monitoring the existence of SARS-CoV-2. In this regard, a viral RNA extraction method based on polymer-carboxyl-coated magnetic nanoparticles (pcMNPs) has been reported for the sensitive detection of the SARS-CoV-2 through RT-PCR. In the pcMNPs method, by combining RNA binding steps and the virus lysis and into one, the pcMNPs-RNA complexes were directly introduced into subsequent RT-PCR reactions (Direct RT-PCR), which gives a significantly simplified RNA extraction protocol. Due to the strong interaction between the carboxyl groups, magnetic nanoparticles efficiently absorbed the extracted viral RNA within 20 min, which results in high sensitivity (10-copy) with high linearity over 5 logs (between 10 and 105 copies) of the gradient for detection of SARS-CoV-2 with a detection limit of 10 copies. This method can be employed for developing the early diagnosis of COVID-19 with high throughput and without any laborious optimization. Moreover, this can be easily adopted in fully automated nucleic acid extraction systems [114]. Another research group also reported a viral RNA-extraction method for diagnosis of COVID-19 based on the surface-functionalized MNPs (zinc ferrite nanoparticles) with silica and carboxyl-modified polyvinyl alcohol. The extraction of the viral RNA from several specimens through an automation process may be provided by this method [115]. Ahmed et al. have proposed a bioassay for detection of Coronavirus using as-prepared Zirconium quantum dots (Zr QDs) and magneto-plasmonic nanoparticles (MPNPs) in blood media with higher sensitivity than conventional enzyme-linked immunosorbent assay (ELISA) methods. In the presence of the target analyte and anti-infectious bronchitis virus (IBV) antibodies-conjugated MPNPs, the anti-IBV antibody of coronavirus was conjugated with Zr QDs to form immuno-conjugated QD–MPNPs nanohybrids, which can be separated by an external magnet (Fig. 4). In this study, coronavirus was detected by using the fluorescence properties of these nanohybrids with a LOD of 79.15 EID/50 μL and linear response in the range of 100 EID/50 μL to 10,000 EID/50 μL [116].
Fig. 4.

Schematic illustration of sensor design: a Zr nanoparticles and reducing agent keep on the vial; b formation of Zr QDs; c antibody conjugated QDs; d the addition of antibody-conjugated MPNPs; e formation of nanostructured magnetoplasmonic-fluorescent by the addition of target, then separated (f); g dispersion of the nanohybrid-conjugated part and the optical properties measurement (h). Reprinted with permission from [116]
Recently, there is also a study on using lanthanide nanoparticles for the diagnosis of SARS-CoV-2. In this line, Chen et al. have developed a lateral flow immunoassay (LFIA) based on lanthanide-doped polystyrene nanoparticles (LPSNPs) for rapid and sensitive diagnosis of anti-SARV-CoV-2 IgG in human serum within 10 min. To form an immunocomplex in sample solutions, the anti-SARV-CoV-2 IgG interacted with the nitrocellulose membrane immobilized recombinant nucleocapsid phosphoprotein. Afterward, for the fluorescence-based diagnosis of anti-SARV-CoV-2, the labeled mouse anti-human IgG antibody with LPSNPs was added to the analyte solution. RT-PCR was used to validate the results of this assay [117].
Influenza (H1N1, H5N1, H5N2, H3N2, and H7N9) In recent years, there are many reports on the application of nanoparticles in biosensors for the detection of Influenza A virus. In this line, Karash et al. have developed an impedance aptasensor for the diagnosis of H5N1 based on AuNPs for signal amplification. Biotin-labeled H5N1 aptamer was bound to the streptavidin, which was immobilized on the gold interdigitated microelectrode surface. Then polyethylene glycol blocked the microelectrode to prevent non-specific adsorption, and the virus was captured by the bound aptamer, which caused changes in the impedance measured by an impedance analyzer. By forming a network-like gold nanoparticle/H5N1-aptamer/thiocyanuric acid, a designed nanoparticle-based amplifier was implemented to enhance impedance signal (Fig. 5). Linear relationship between impedance changes and logarithmic value of H5N1 virus concentration was observed in the range of 16–0.25 HAU/50 µL. This aptasensor provided a simple, rapid (less than 1 h), cost-effective, robust, and reliable detection method for the detection of avian H5N1 virus with LOD of 0.25 HAU [118].
Fig. 5.
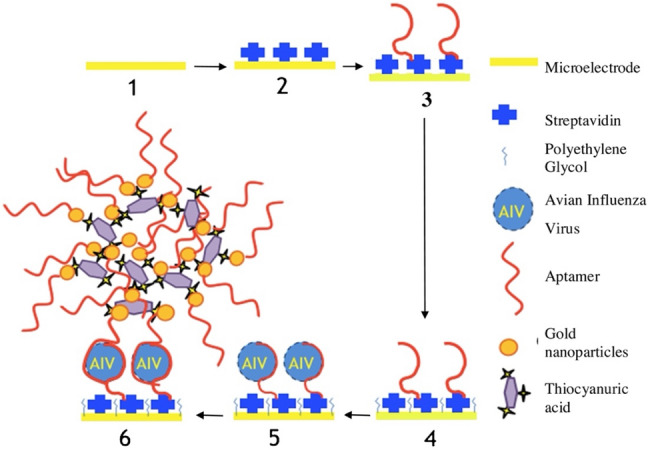
Schematic illustration of the microelectrode-based impedance assay for diagnosis of avian influenza virus H5N1. (1) Bare microelectrode; (2) Immobilization of streptavidin on the surface of microelectrode; (3) Bounding of biotinylated H5N1 aptamers to the immobilized streptavidin on the microelectrode; (4) Blocking the electrode surface with the polyethylene glycol; (5) Bounding of H5N1 viruses to the aptamers; and (6) Bounding of the gold nanoparticles-based amplifiers to the captured H5N1 viruses. Reprinted with permission from [118]
In another study, a digital single virus electrochemical enzyme-linked immunosorbent assay (digital ELISA) was demonstrated for ultrasensitive detection of H7N9 AIV based on bifunctional fluorescence magnetic nanospheres (bi-FMNs) integration with a monolayer AuNPs modified microelectrode array with digital analysis. In this study, for separating the H7N9 viruses from complex samples, bi-FMNs were synthesized by immobilizing alkaline phosphatase (ALP) enzyme and polyclonal antibody (pAb). Moreover, to make a sandwich complex (ALP-FMNs-Ab/Ag/Ab-AuNP), the target-bound bi-FMNs were added to the AuNP-bound microelectrode arrays. P-aminophenol (p-AP) was produced by phosphorylation of p-aminophenyl phosphate monohydrate. In this study, the reduction of Ag+ to Ag0 form, which was deposited over microelectrode arrays, was induced by the generated p-AP and measured by linear sweep voltammetry (LSV) (Fig. 6). There is linear relationship between the average bi-FMNs number per microelectrode and H7N9 AIV concentrations in the range of 0.01–1.5 pg/mL. This digital ELISA was applied for sensitive and accurate diagnosis of H7N9 AIV with a low LOD of 7.8 fg/mL [119]. Takemura et al. have developed a specific LSPR-induced immunofluorescence biosensor for ultrasensitive and rapid detection of H1N1 and H3N2 based on an AuNP-induced quaternary CdSeTeS QDs fluorescence signal. This biosensor involved anti-neuraminidase antibody-conjugated thiolated AuNPs and anti-hemagglutinin antibody-conjugated alloyed quaternary l-cysteine-capped CdSeTeS QDs. The displaying antigens on the surface of the influenza virus interacted with “anti-hemagglutinin antibody-conjugated QDs” and “anti-neuraminidase antibody-conjugated AuNPs” and led to induce an LSPR signal in proportion to different concentration of H1N1 virus. The detection time was ~ 5 min after the addition of the target virus. The sensor showed linear response in the concentration range of 10–100 pg/mL for H1N1 in DI water and in human serum, and for clinically isolated influenza virus (H3N2) in the concentration range of 10–100 pfu/mL. The LOD for the clinically isolated H3N2 was 10 pfu/mL, while for the H1N1 virus, the LOD was 0.03 pg/mL in deionized water and 0.4 pg/mL in human serum [120].
Fig. 6.
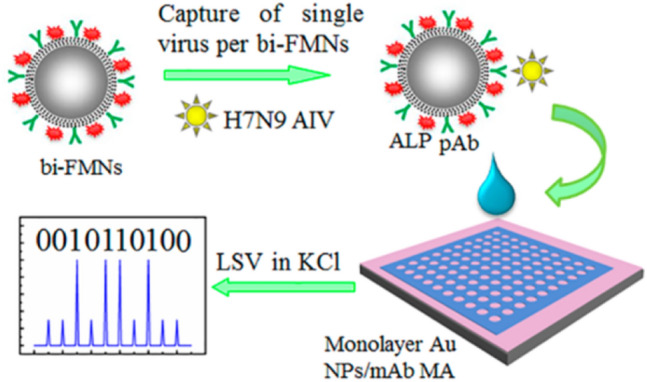
Schematic representation of the digital ELISA for diagnosis of H7N9 AIV based on bifunctional fluorescence magnetic nanospheres (bi-FMNs) integration with monolayer AuNPs modified microelectrode array: a Capture of Single Virus per bi-FMNs and Individual Separation of Target/bi-FMNs Complexes into microelectrode array; b Enzyme-Induced Metallization and Digital Analysis. Reprinted with permission from [119]. Copyright 2018 American Chemical Society
Fu et al. have also developed CNTs based-chemiresistive biosensors for label-free detection of H5N1 DNA sequences. In this sensor, individual CNT connects with the interdigitated metal electrodes. The functionalized CNTs with DNA probe sequences attached to the sidewalls non-covalently to detect complementary DNA target sequences of the H5N1 at concentrations ranging from 2 pM to 2 nM within 15 min [121]. In another work, Tran et al. have fabricated a CNTs FET-based DNA sensor to detect influenza A virus DNA [122]. This DNA sensor could detect H5N1 DNA in less than one minute with a very low LOD of 1 pM. The fabricated sensor showed linearity in a wide detection range of 1 pM to 10 nM with high reproducibility and prolonged shelf life (producing a 97% output signal after 7 months storage in pH 7.4 buffer). For label-free electrochemical diagnosis of the H1N1 virus, Devarakonda et al. have presented a handmade paper-based, label-free electrochemical immunosensor based on silica nanoparticles, single-wall carbon nanotubes (SWCNTs), and chitosan [123]. In this work, the paper was modified with a spray of hydrophobic silica nanoparticles, and stencil-printed electrodes were used. The modified stencil-printed carbon electrodes with SWCNTs and chitosan were used to improve the sensitivity of the sensor. These immunosensors selectively detected the H1N1 virus against MS2 bacteriophages and the influenza B viruses in 30 min with a high linearity in the concentration range of 10 to 104 pfu/mL, and LOD was 113 pfu/mL.
An electrochemical-based dual-sensor platform has been developed based on using methylene blue-electroadsorbed graphene oxide (GO) nanostructures modified with monoclonal antibodies to induce high electron-transfer properties for biomolecular diagnosis of H5N1 and H1N1 [124]. Bio-functional layers of bio-active molecules (chitosan and protein-A) were employed at the interface of the sensor element and antibodies, which synergistically enriched the bioactivity of immobilized antibodies for the immune complex formation. The developed immunosensor showed high sensitivity in picomolar level (25–500 pM), a rapid response time of less than 1 min, and reproducibility with LOD of 9.4 pM for H1N1 and 8.3 pM for H5N1. In another study, Kinnamon et al. have developed a textile screen-printed biosensor based on silver conductive electrodes and GO transduction film built upon both nanoporous polyamide and consumer utility textiles for impedimetric diagnosis of influenza A virus [125]. On the GO, an affinity assay was constructed to bring influenza protein-specific antibodies to the sensor surface (Fig. 7). With interactions of antigen with antibody and by using electrochemical impedance spectroscopy, H1N1 was detected in this study with a linear dynamic range from 10 ng/mL to 10 μg/mL, and LOD of 10 ng/mL.
Fig. 7.

Detailed illustration of the affinity assay for diagnosis of influenza based on graphene oxide (GO). The interaction of Pyrenebutyric acid-N-hydrosuccinimide ester (PANHS) crosslinker with the GO allows for subsequent binding of influenza protein and influenza protein antibody for detection. Reprinted with permission from [125]. Copyright 2018 American Chemical Society
Multifunctional nanohybrids have created new and valuable opportunities for biosensing applications. In this direction, a colorimetric technique has been reported based on nanohybrids composed of AuNPs and CNTs to detect the H3N2 virus [126]. The target viruses interacted with specific antibodies-conjugated Au-CNT nanohybrids after bound to the wells of a 96-well flat-bottom microtiter. The detection mechanism of this sensor was based on producing a unique blue color resulting from oxidation of the chromogenic substrate 3, 3′, 5, 5′-tetramethyl-benzidine (TMB) in the presence of H2O2. The amount of this color developed was attributed to H3N2 concentration. The dynamic range of this system for the H3N2 virus was found to be in the range of 10–50,000 pfu/mL. The fabricated sensor had a sensitivity of 500 times greater than that of commercial immunochromatography kits, with a LOD of 3.4 pfu/mL. In another study, Huang et al. have developed a highly sensitive electrochemical immunosensor with a sandwich-type immunoassay format for quantification of H7N9 AIV based on AgNPs-graphene as trace labels in clinical immunoassays [127]. In this assay, gold electrodes, which were modified with AuNP-graphene nanocomposites and labeled with modified antibodies (mAbs), were used to capture target antigens. The immunoassay was performed with H7-polyclonal antibodies (pAbs) that were attached to the AgNPs-graphene surface (pAb-AgNPs-graphene) to form a sandwich complex for LSV-based detection. This immunosensor showed high signal amplification with a low LOD of 1.6 pg/mL in a dynamic working range of 1.6 pg/mL–16 ng/mL. Lee et al. have presented a plasmon-assisted fluoro-immunoassay (PAFI) based on Au nanoparticle-decorated carbon nanotubes (AuCNTs) and cadmium telluride (CdTe) QDs for diagnosis of three types of influenza viruses: the Influenza virus A/Beijing/262/95 (H1N1), the Influenza virus/New Caledonia/20/99IvR116 (H1N1), and the clinically isolated Influenza virus A/Yokohama/110/2009 (H3N2) [128]. The AuCNTs and CdTe QDs were conjugated with specific antibodies against the influenza virus to cause changes in conductivity which were measured by LSV (Fig. 8). The LODs of this biosensor sensor against influenza viruses A/Beijing/262/95(H1N1) and New Caledonia/20/99IvR116 (H1N1) were 1 ng/mL and 0.1 pg/mL, respectively. The clinically isolated influenza viruses A/Yokohama/110/2009 (H3N2) were detected in the range of 50–10,000 pfu/mL, with a LOD of 50 pfu/mL. This developed PAFI biosensor provided robust signal production for diagnosis of influenza viruses and excellent selectivity and sensitivity.
Fig. 8.

(I) Synthetic schematic for the preparation of Au nanoparticle-decorated CNT and (II) Schematic illustration for diagnosis process of influenza virus by using PAFI [128]
Bronchiolitis Bronchiolitis caused by Respiratory syncytial virus (RSV) has been recognized as a major global health challenge, and these days, by applying nanomaterials-based detection methods, the early diagnosis of them has been possible. Zhan et al. developed a surface-enhanced Raman scattering (SERS) enzyme-catalyzed immunoassay of RSV based on peroxidase substrate 3, 3′, 5, 5′-TMB as Raman probe molecule for signal detection [129]. Oxidation of TMB by horseradish peroxidase (HRP) resulted in the production of TMB+. By electrostatic adsorption of TMB+ on the negatively charged surface of AgNPs, these nanoparticles aggregated, which caused a strong SERS signal. The LOD of RSV in this method was 0.05 pg/mL. The fabricated sensor showed a linear relationship between the Raman intensity and the amount of RSV in the range of 0.5 to 20 pg/mL. In another study, Zhan et al. have presented a colorimetric immunoassay for a highly sensitive diagnosis of RSV based on Hg2+-stimulated peroxidase-like activity of AuNPs–GO hybrids [130]. In the presence of Hg2+, the peroxidase activity of antibody conjugated AuNP-GO (Ab1/AuNP-GO) was efficiently improved owing to metallophilic interaction between Hg2+-Au (Fig. 9). The immunocomplex (Ab2/RSV/Ab1/Hg2+-AuNP-GO) formed in the presence of RSV was detected by TMB catalysis in the presence of H2O2. In this work, by using the synergistic effect between GO and AuNPs, the fabricated low-cost sensor showed high sensitivity, simplicity, and stability for detection of RSV in the range of 0.1–10 pg/mL in less than 20 min with the LOD of 0.04 pg/mL.
Fig. 9.
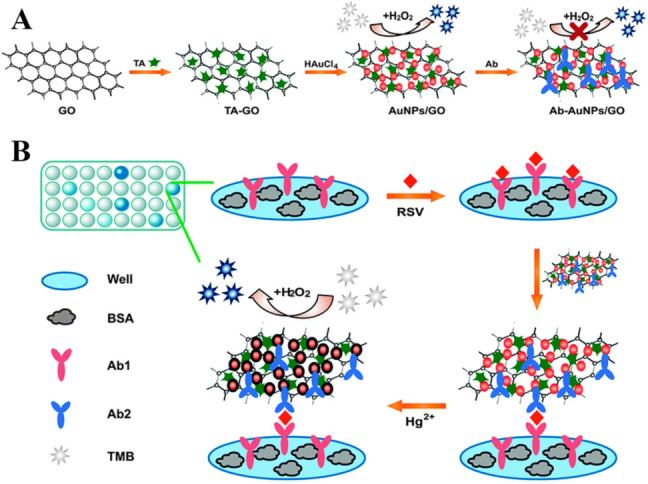
a Procedure for the preparation of Ab-AuNPs–GO conjugates; b A schematic illustration of the colorimetric immunoassay for diagnosis of RSV based on Hg2+-stimulated peroxidase-like activity of AuNPs–GO hybrids. Reprinted with permission from [130]. Copyright 2014 American Chemical Society
Rubella virus (German measles) Recently, for the detection of rubella virus (also known as German measles), nanozyme probes based on antigen-conjugated Au-Pt core/shell nanorods (Au@Pt NRs) have been reported [131]. Pt NRs have been chosen because of their high catalytic activity. Moreover, because of the easy aggregation of Pt NRs, gold nanorods (AuNRs) are used as the support for the Pt to keep them in a well-dispersed state. To provide specificity for antibody molecules, rubella antigen is conjugated on the surface of the nanozyme. This antigen-conjugated Au@Pt NRs-based ELISA showed good sensitivity because of the enhanced catalytic properties of the nanozyme probe. This sensor detected rubella IgM antibodies in the linear range from 10 to 106 ng/mL, and the LOD 10 ng/mL. The reported assay is more stable and robust but less expensive compared to antibody conjugated HRP. In another study, a multiplex plasmonic gold platform were used to detect the rubella virus in saliva, whole blood, and serum [132]. A plasmonic gold film packed with gold nanoislands was fabricated on glass slides, which had plasmon resonance in the near-infrared region and abundant nanoscale gaps. In comparison with commercial kit test results in serum, sensitivity and specificity of rubella IgG in this work in serum, whole blood, and saliva by plasmonic gold assay were 100%. Li et al. have also presented a gold magnetic nanoparticle (AuMNPs) conjugate‑based LFIA system for diagnosis of IgM antibody related to Rubella with high specificity and sensitivity [133]. To construct a probe, the AuMNPs conjugated with an anti‑human IgM antibody (μ‑chain specific) by modification with poly methacrylic acid. For evaluation of 41 seropositive and 121 seronegative serum samples, the AuMNPs‑LFIA strips were used, which showed the sensitivity of 100% (162/162) and the specificity of 100% (162/162). Furthermore, a thioglycolic acid-capped CdTe QDs based-fluorescent immunological microarrays for diagnosis of ToRCH-related antibodies, including Rubella virus, was reported [134]. In this assay, the microarrays with the five kinds of ToRCH-related antigens were fabricated by using CdTe QDs to label the secondary antibodies. Compared to glass or silicon chip-based fluorescent immunological microarrays, the results showed that these QDs labeling-based ToRCH microarrays were much easier with producing much more stable and stronger signal and shorter detection time (10–20 min). Compared with the ELISA kits, both sensitivity and specificity of this microarrays exceeded 85%.
Nanomaterials-based diagnostics for bacterial diseases
Tuberculosis For the global combating against MTB, there are still challenges in the fabrication of affordable diagnostic devices with good accuracy, specificity, and sensitivity. AuNPs coupled with biosensors can offer a feasible solution [135, 136]. In this regard, the impedimetric sensor based on gold nanorod embedded 3D graphene nanocomposite was developed for selective and rapid diagnosis of MTB. This nanocomposite-based sensor offered high-performance bio-sensing for detection of DNA in femtomolar concentration range and wide detection linear range of 10 fM to 0.1 μM. The results showed that the response time for this DNA sensor is 1 min, and the LOD is 10 fM [99]. In another study, a single tube system for detecting unamplified MTB DNA was developed using AuNPs-based fluorescence resonance energy transfer (FRET) assay [100]. In this study, a linear relationship was observed between relative fluorescence and DNA concentration from 40 to10 ng/μL with the LOD of 3 ng/μL, sensitivity of 98.6%, and specificity of 90%. Tsai et al. have also developed a colorimetric sensor based on unmodified AuNPs and a paper-based analytical platform for detection of tuberculosis with a linear dynamic range from 1.95 × 10⁻² to 1.95 × 101 ng/mL, a LOD of 1.95 × 10⁻² ng/mL, and a turnaround time of 60 min [137]. Hybridizing of single-stranded DNA probe molecules with targeted double-stranded MTB DNA caused changes in the color of a gold nanoparticle colloid which were monitored by using the surface plasmon resonance (SPR). For obtaining rapid parallel colorimetric results with low reagent utilization, this label-free gold nanoparticle solution-based MTB diagnosis method was coupled with a paper-based system that can be utilized with a smartphone without the need for sophisticated analytical equipment. In another work, Bai et al. have developed an electrochemical DNA biosensor to detect MTB IS6110 fragment within MTB [138]. To generate signal response without additional redox molecules, the nanohybrid of decorated AuNPs with fullerene nanoparticles/nitrogen-doped graphene nanosheet (Au-nano-C60/NGS) was directly used as a new signal tag. Moreover, the nanohybrid was subsequently labelled with signal probes to form a tracer label for obtaining signal amplification. The biosensor showed a broad linear range of detection (10 fM–10 nM) for MTB with a low LOD of 3 fM, with excellent specificity, reproducibility, and stability. It also distinguished mismatched DNA sequence and differentiated MTB from other pathogenic agents.
Biosensors based on carbon nanomaterials, such as graphene, GO, and CNTs, have also been used to diagnose MTB. In a recent study, Thakur et al. have developed an electrochemical DNA aptasensor for the detection of MTB antigen MPT64, based on Poly(3,4-ethylenedioxythiophene) (PEDOT) doped with functionalized CNTs hybrid platform [139]. The biotinylated aptamer was immobilized onto streptavidin attached to –COOH functionalized CNTs via streptavidin–biotin interaction. In this work, in the presence of [Fe(CN)6]3−/4− as a redox probe, differential pulse voltammetry was used for monitoring the electrochemical signal generated from the aptamer–target molecule interaction. The fabricated sensor showed linear response at a range from 1.0 × 10³ fg/mL1 to 1.0 × 10⁷ fg/mL with a LOD of 0.5 ± 0.2 fg/mL and sensitivity of 152 ± 33.9 μA fg mL−1 cm−2 within 15 min. In the mixture of other proteins, aptasensor could detect MPT64 with 95% specificity. It also showed good stability (for 27 days at 4 °C) and reusability (for 7 times after repeated regeneration with 50 mM NaOH). A graphene-based portable SPR biosensor to detect MTB DNA strain was also developed [140]. The presence of graphene layers plays a major role in the immobilization of single strain DNA (ssDNA). The gold nano urchin (GNu) was covalently bond with the ssDNA as the sensing probe (ssDNA-GNu). Using the drop casted graphene-based sensing layer contributed to simple, low cost, and time-efficient sensing with very low LOD of 28 fM for complementary ssDNA target in the salt buffer. In another study, a highly sensitive electrochemical peptide nucleic acid biosensor based on functionalized graphene oxide (NH2-GO) composited with CdS QDs has been used for the detection of MTB [141]. Under the optimal conditions, it showed a linear detection range from 1 × 10–11 to 1 × 10⁻⁷ M with a LOD of 8.948 × 10⁻¹³ M with reaction time of 50 min and excellent sensitivity and selectivity. In addition, the biosensor differentiated negative and positive samples of MT DNA sequences from real sample analysis.
Furthermore, there are studies on QDs-based biosensors to detect MTB. In this regard, a sandwich assay via antigen–antibody interaction based on silica-coated quantum dots (SiQDs) and AuNRs has been developed for MTB detection based on FRET [142]. Genetically engineered antibodies GBP-50B14 and SiBP-8B3 were bound to unmodified surfaces of AuNRs and SiQDs, respectively. The antigen–antibody interaction was revealed using M. tuberculosis-specific secretory antigen (Ag85B). In the presence of the target antigen, two biocomplexes exhibited a quenching effect through a sandwich assay (Fig. 10). In this study, a successful antigen–antibody reaction led to the quenching effect in the presence of a target antigen. The reported assay response was in the range of 1 × 10⁻³ to 1 × 10⁻¹⁰ μg/mL with a LOD of 13 pg/mL.
Fig. 10.

Schematic representation of AuNRs and SiQDs based-fluorescent analysis method for the detection of secreted antigen from MTB based on sandwich assay via antigen–antibody interaction. Reprinted with permission from [142]
In another study, Zhou et al. have presented a potential-resolved electrochemiluminescence (ECL) immunosensor for simultaneous detection of Triple Latent Tuberculosis Infection (LTBI) Markers (interferon-gamma (IFN-γ), tumor necrosis factor-alpha (TNF-α), and interleukin (IL-2) based on carbon QDs and CdS QDs [143]. In this work, these QDs were integrated onto AuNPs and magnetic beads, respectively, to fabricate ECL nanoprobes with signal amplification for detection of IFN-γ, TNF-α, and IL-2 with high sensitivity (Fig. 11). Immobilization of these three markers on the three patterned areas of indium tin oxide electrode facilitated the capture of markers easily. This sensor detected the markers at the concentration range of 1.6–200 pg/mL. Moreover, the LOD for IFN-γ, TNF-α, and IL-2 were all 1.6 pg/mL. The results showed that this multiplexed ECL immunosensor possessed good specificity, reproducibility, and stability with high sensitivity.
Fig. 11.

Schematic representation and preparation procedure of the multiplexed electrochemiluminescence immunosensor based on carbon QDs and CdS QDs for simultaneous detection of IFN-γ, TNF-α, and IL-2. Reprinted with permission from [143]
Pneumococcal Disease An electrical conductance detection of Streptococcus pneumoniae through the simple method of nanoparticle decoration was reported by Pyo et al. [144]. In this study, the pneumococcal bacteria were captured between the interdigitated electrodes by pneumococcal C-polysaccharide (PnC) antibody. Afterward, the PnC antibodies conjugated-AuNPs were bound onto an outer membrane of the bacteria. With the dense decoration, the bacteria surface became conductive due to the metal nanoparticles, and a distinctive conductance change between the electrodes was observed. Therefore, Streptococcus pneumoniae has been successfully detected in the range of 10–108 cfu/mL with a lower LOD (10 cfu/mL) compared with the commercial detection kit.
Nanomaterials-based diagnostics for fungal diseases
Candidiasis Candidiasis remains one of the most serious healthcare-associated diseases worldwide. Nanoparticle-based biosensors have been developed for the diagnosis of Candidiasis in recent years. Villamizar et al. have developed a FET biosensor based on SWCNTs for detecting Candida albicans [145]. Functionalized SWCNTs with monoclonal anti-Candida antibodies act as specific binding sites for the adsorption of fungal antigens (Fig. 12). A LOD of 50 cfu/mL has been achieved within 1 h. The results showed that this sensor could selectively detect Candida albicans at low concentrations in the presence of Cryptococcus albidus and Saccharomyces cerevisiae. In addition, this sensor could facilitate early diagnosis of sick patients, which would improve the administration of adequate drugs and treatments [42]. Furthermore, biofunctionalized upconverting CaF2:Yb,Tm nanoparticles were used for luminescence detection of Candida albicans. To reduce luminescence quenching, a multistep synthesis method was applied to homogenously distribute the doping ions within the nanoparticle’s volume. A dedicated biofunctionalization method demonstrated the suitability of the synthesized nanoparticles as bio-labels for labelling Candida albicans.
Fig. 12.
a Schematic structure of the CNT FET device. b Antigen–antibody interaction of Candida albicans with a SWCNT functionalised with anti-Candida antibodies and protected with Tween 20. Reprinted with permission from [42]
Aspergillosis Detection of invasive aspergillosis (IA) caused by Aspergillus fumigatus in the miniaturized setting is challenging. Bhatnagar et al. have developed an electrochemical nanobiosensor for sensitive detection of IA via detecting the virulent glip target gene (glip-T) in a miniaturized experimental setting [146]. The designed biosensor is systematically characterized by UV–visible spectroscopy, electrochemical impedance spectroscopy, and cyclic voltammetry. The sensor probe was fabricated on a gold electrode using 1,6-hexanedithiol, and chitosan stabilized AuNPs mediated self-assembly of glip probes (glip-P) (Fig. 13). The fabricated biosensor detected glip-T in less than 20 min with the dynamic range between 1 × 10⁻¹⁴ and 1 × 10⁻² M, the LOD of 0.32 ± 0.01 × 10⁻¹⁴ M, and the sensitivity of 93.6 ± 6.2%. The results indicated that the developed sensor is easy, rapid, cost-effective, and generic with good reusability, which makes it a potential candidate for fabricating a miniaturized hand-held device for onsite glip-T detection for patients suffering from IA. In another work, a plasmonic gold nanoparticle-based system has been developed for the diagnosis of Aspergillus fungal infections [37]. It measured the change in the shape of gold nanoparticles and generated colored solutions with distinct tonality. In suspensions of gold nanoparticles, a color change from red to blue within 2 min was observed, which is related to changes in nanoparticle shape. A decrease in the ratio when the fungi concentration increased from 1 to 16 cfu/mL was found, with a LOD of 10 cfu/mL, a sensitivity of 80% and a specificity of 95% for the diagnosis of athlete’s foot in human patients. This system would contribute to self-diagnosis and hygiene control in laboratories/hospitals with fewer resources with a naked eye.
Fig. 13.
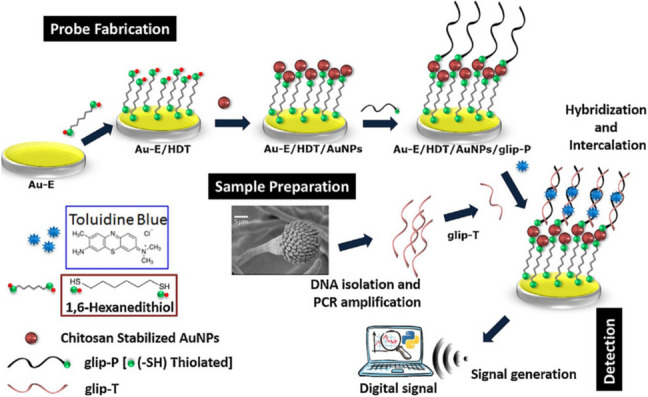
Schematic illustration detailing of the fabrication and the detection principle of glip biosensor based on AuNPs for diagnosis of invasive Aspergillosis. Reprinted with permission from [146]
SWCNTs-based sensors have also been used for the detection of Aspergillus species. Jin et al. have demonstrated a biosensor for the real-time detection of Aspergillus species using SWCNTs-integrated FETs functionalized with pentameric antibodies that specifically bind to Aspergillus species [147]. The sensor exhibited good selectivity towards Aspergillus niger with a low concentration of 0.3 pg/mL, a detection dynamic range from 0.5 pg/mL to 10 μg/mL, and high sensitivity without any response to other fungal species Alternaria alternata.
Here we summarize the performance of nanomaterials-based diagnosis methods for respiratory infectious diseases in Table 3.
Table 3.
Evaluation of nanomaterials-based diagnosis for respiratory infectious diseases
| Agent | Disease | Nanomaterial | Technique | Dynamic range | Limit of detection (LOD) | Detection time (min) | Specificity | Sensitivity | References |
|---|---|---|---|---|---|---|---|---|---|
| Virus | MERS | AuNPs | Colorimetric assay | 0.05 M–0.5 M | 1.00 pmol/μL | 10 | – | – | [105] |
| Electrochemical immunosensor | 0.001–100 ng/mL | 1.00 pg/mL | 20 | – | – | [106] | |||
| AgNPs | Paperbased colorimetric DNA sensor | – | 1.53 nM | – | – | – | [107] | ||
| COVID–19 | AuNPs | Colorimetric assay | 0.2–3 ng/µL | 0.18 ng/μL | 10 | – | – | [108] | |
| Lateral-flow assay | – | – | 15 | 93.3% | 100% | [109] | |||
| Point-of-care lateral flow immunoassay | – | – | 15 | 90.63% | 88.66% | [110] | |||
| ICG assay | – | – | – | – | 11.1% at the early stage, 92.9% at the intermediate stage, 96.8% at the late stage | [111] | |||
| AuNIs | Dual-functional LSPR biosensor | 0.01 pM–50 µM | 0.22 pM | – | – | – | [112] | ||
| Graphene | FET-based biosensor | 1.6 101–1.6 104 pfu/mL | 16.00 pfu/mL in culture medium, 242 copies/mL in clinical samples | – | – | – | [113] | ||
| pcMNPs | Viral RNA- extraction method | 10–105 copies | 10 copies | 20 | – | 10-copy | [114] | ||
| Zinc Ferrite MNPs | Viral RNA-extraction method | – | – | – | – | – | [115] | ||
| Zr QDs-MPNPs | ELISA method | 100 EDI/50 μL–10,000 EDI/50 μL | 79.15 EID/50 μL | – | – | [116] | |||
| LPSNPs | LFIA method | – | – | 10 | – | – | [117] | ||
| Influenza (H5N1) | AuNPs | Impedance aptasensor | 16–0.25 HAU/50 µL | 0.25 HAU | < 60 | – | – | [118] | |
| CNTs | Chemiresistive biosensors | 2 pM–2 nM | – | 15 | – | – | [121] | ||
| FET-based DNA sensor | 1 pM–10 nM | 1 pM | – | – | [122] | ||||
| Influenza (H7N9) | biFMNs-AuNPs | Digital ELISA | 0.01–1.5 pg/mL | 7.8 fg/mL | – | – | – | [119] | |
| AgNPs-graphene | LSV-based detection | 1.6 × 10⁻³ ∼1.6 × 10⁻¹⁰ g/mL | 1.6 pg/mL | – | – | – | [127] | ||
| Influenza (H1N1 and H3N2) | AuNPs-CdSeTe QDs | LSPR-induced immunofluorescence biosensor | H1N1: 10–100 pg/mL H3N2: 10–100 pfu/mL | H1N1: 0.03 pg/mL in deionized water and 0.4 pg/mL in human serum H3N2: 10 pfu/mL | 5 | – | – | [120] | |
| Influenza (H1N1) | Si NPs-SWCNTs-chitosan | Paper-based electrochemical immunosensor | 10–104 pfu/mL | 113 pfu/mL | 30 | – | – | [123] | |
| graphene oxide | electrochemical impedance spectroscopy | 10 ng/mL–10 μg/mL | 10 ng/mL | – | – | – | [125] | ||
| Influenza (H3N2, H1N1, and New H1N1) | AuCNTs-CdTe QDs | PAFI-base detection platform | H3N2: 50–10,000 pfu/mL | H3N2: 50 pfu/mL H1N1: 1 ng/mL New H1N1: 0.1 pg/mL | – | – | – | [128] | |
| Influenza (H5N1 and H1N1) | graphene oxide | Electrochemical-based dual-sensor | 25 500 pM | H5N1: 8.3 pM H1N1: 9.4 pM | – | – | [124] | ||
| Influenza (H3N3) | AuNPs-CNTs | Colorimetric technique | 10–50,000 pfu/mL | 3.4 pfu/mL | – | – | – | [126] | |
| Bronchiolitis | AgNPs | SERS enzyme-catalyzed immunoassay | 0.5–20 pg/mL | 0.05 pg/mL | – | – | – | [129] | |
| AuNPs–GO | Colorimetric immunoassay | 0.1–10 pg/mL | 0.04 pg/mL | – | – | [130] | |||
| Rubella virus | Au@Pt NRs | Capture enzyme-linked immunosorbent assay | 10–106 ng/mL | 10 ng/mL | – | – | – | [131] | |
| Au nanoislands | Multiplex plasmonic gold platform | – | – | – | 100% | 100% | [132] | ||
| AuMNPs | LFIA system | – | – | – | 100% | 100% | [133] | ||
| CdTe QDs | Fluorescent immunological microarrays | – | – | 10–20 | > 85% | > 85% | [134] | ||
| Bacteria | Tuberculosis | Au nanorod@3D graphene | Impedimetric sensor | 10 fM–0.1 μM | 10 fM | 1 | – | – | [135] |
| AuNPs | FRET assay | 40–10 ng/µL | 3 ng/µL | 90% | 98.6% | [136] | |||
| Colorimetric sensor | 1.95 × 10⁻²–1.95 × 101 ng/mL | 1.95 × 10⁻² ng/mL | 60 | – | – | [137] | |||
| Au-nano-C60/NGS | Electrochemical DNA biosensor | 10 fM–10 nM | 3 fM | – | – | – | [138] | ||
| PEDOT-CNTs | Electrochemical DNA aptasensor | 1.0 × 10⁷–1.0 × 10³ fg/mL | 0.5 ± 0.2 fg/mL | 15 | 152 ± 33.9 µA fg mL−1 cm−2 | 95% | [139] | ||
| Graphene | SPR biosensor | – | 28 fM | – | – | – | [140] | ||
| NH2-GO@ CdS QDs | Electrochemical peptide nucleic acid biosensor | 1 × 10–11–1 × 10⁻⁷ M | 8.948 × 10⁻¹³ M | 50 | – | – | [141] | ||
| SiQDs-AuNRs | FRET assay | 1 × 10⁻³–1 × 10⁻¹⁰ μg/mL | 13.0 pg/mL | – | – | – | [142] | ||
| Carbon QDs-CdS QDs | Potential-resolved ECL immunosensor | 1.6–200 pg/mL | 1.6 pg/mL | – | – | – | [143] | ||
| Pneumococcal | AuNPs | Electrical Conductivity sensor | 10–108 cfu/mL | 10 cfu/mL | – | – | – | [144] | |
| Fungi | Candidiasis | Functionalized SWCNTs | FET biosensor | – | 50 cfu/mL | 60 | – | – | [145] |
| CaF2:Yb,Tm NPs | Luminescence sensor | – | – | – | – | – | [42] | ||
| Aspergillosis | AuNPs | Electrochemical nanobiosensor | 1 × 10⁻¹⁴ ~ 1 × 10⁻² M | 0.32 ± 0.01 × 10⁻¹⁴ M | – | 93.6 ± 6.2% | [146] | ||
| Plasmonic gold nanoparticle-based system | 1–16 cfu/mL | 10 cfu/mL | 2 | 95% | 80% | [37] | |||
| SWCNTs | FETs sensor | 0.5 pg/mL–10 μg/mL | 0.3 pg/mL | – | – | – | [147] |
Micromaterials-based diagnostics
Micromaterials attract scientific attention due to their controlled release nature, high drug loading and entrapment capabilities, maximum therapeutic benefits, particle size, and compatibility [148]. Micromaterials-based diagnostics offer numerous advantages by improving efficacy and reducing toxicity. Due to attractive properties and wider applications, micromaterials such as chitosan microspheres [149], alginate microspheres [150], gellan-gum beads [151], poly (adipic anhydride) microspheres [152], poly(D, L-lactide-co-glycolide) microspheres [153], polypeptide microcapsules [154], albumin microspheres [155], glutamate microspheres [156], triglyceride lipospheres [157], 1,5-dioxepan-2-one (DXO) and D, L-dilactide microspheres [158] have been used vastly in medical diagnosis and drug delivery. Above mentioned micromaterials also have important potential applications in the treatment of a variety of diseases. However, in this study, we will focus on micromaterials-based diagnosis for respiratory infectious diseases.
Micromaterials-based diagnostics for viral diseases
COVID-19 As mentioned in Sect. 2.1, COVID-19 is a respiratory infectious disease caused by SARS-CoV-2, which is currently an international concern. Researchers from all over the world have come up with their new approach and method for developing new diagnosis methods to prevent this pandemic. Li et al. proposed a novel detection method for COVID-19 by using magnetic and nonmagnetic fluorescent microparticles and compared it with other existing antibody detection methods [159]. This low-cost magnetic field-induced self-assembly method has no scattering effect, relatively low magnetic resistance, and able to detect the stage of virus infection (Fig. 14). They synthesized magnetic microparticles and non-magnetic microparticles with the size of 3 μm and 5 μm from Fe3O4 and polystyrene by dispersing them into deionized water and magnetic fluid. These microparticles then were classified as original microparticles and fluorescent microparticles based on surface modifications. Using the magnetic field-induced self-assembly process, they proved fluorescent microparticles were able to represent the antibodies for SARS-CoV-2.
Fig. 14.

Schematic representation of magnetic field induced self-assembly method for detecting COVID-19 [159]. Reproduced from [Physics of Fluids 33, 042,004 (2021)], with the permission of AIP Publishing
Yamada reported the microparticles emerging roles in the diagnosis of respiratory diseases, including COVID-19 [160]. This study investigated the possible relation of extracellular vesicles based microparticles and their ability in the diagnosis and treatment of COVID-19. In addition, it showed that endothelial microparticles present in the blood could be utilized as biomarkers for better management of respiratory infectious diseases. Another study by Boukli et al. evaluated the chemiluminescent microparticle immunoassay (CLMIA) for the detection of IgG anti-SARS-COV-2 antibodies [161]. This study shows the effectiveness of the CLMIA alinity I SARS CoV-2 IgG assay over the Liaison SARS-CoV-2 assay to detect the antigen of the virus. They found clinical sensitivity of the CLMIA was comparatively better than the Liaison assay. Based on the delay from symptom onset, the clinical sensitivity of the alinity I assay was 45.2% for 1 to 7 days, 72.6% for 8 to 14 days and 84.4% after 15 days. There wasn’t a notable change in sensitivity over time after 15 days.
Several studies also showed the clinical application of CLMIA for SARS-CoV-2 infection diagnosis [161, 162]. These types of microparticles were developed on the basis of recombinant spike for detecting IgM and total antibodies (Ab) against SARS-COV-2 in human serum. Chemiluminescence microparticles-based methods have higher sensitivity and provide a flexible choice of serological immunoassays. The CLMIA delivered higher sensitivity for detecting Ab in comparison with IgM. Among 206 samples, the positive rate for Ab was 90.8%, where it was 72.3% for IgM. The specificity of Ab and IgM detection were 98.9% and 99.3%, respectively. Those studies also demonstrated that these microparticles have all the potential dominance factors in establishing a robust standard protocol and helping to enhance the accuracy and capacity in the detection of SARS-CoV-2.
Influenza Generally, nanoparticle-based detection methods for influenza are vast compared to microparticle-based methods. However, there is the potential for microparticles shown by recent reports and recognizing the possibility in the diagnosis of influenza diseases. Chen et al. developed a colorimetric platform using aptamer-functionalized magnetic microparticles to detect the influenza A virus [163]. These magnetic microparticles were synthesized by modifying glucose oxidase (GOx), concanavalin A (ConA), and AuNPs. These ConA-GOx-AuNPs were implicated in the H3N2 virus through the ConA glycan interaction. They used two different colored AuNPs to determine the H3N2 concentration. This newly developed microparticle-based colorimetric method provided high efficiency with the high sensitivity in the detection of target virus. The LOD of this method was calculated as 11.16 μg/mL and also achieved semi-quantitative determination by visual detection. A rapid method for detection of Influenza A and B virus was reported by Koskinen et al. [164]. Here, they used the ArcDia two-photon excitation (TPX) assay technique and dry chemistry reagents to form polymer microspheres. Monodisperse, carboxyl-modified microspheres with a diameter of 3.22 ± 0.08 μm made from cross-linked polystyrene were used in this diagnosis method. A reference method named time-resolved fluoroimmunoassay (TR-FIA) was used to compare the performance and effectiveness of the TPX technique. The kinetic measurement of the TPX technique provided the performance as a function of time and indicated its efficacy in clinical sensitivity as compare with TR-FIA and PCR. The precision achieved with the ArcDia TPX technique for influenza virus antigen detection can be regarded to be excellent than reference methods.
Micromaterials-based diagnostics for bacterial disease
Pneumococcal diseases Pneumococcal diseases are one of the major human respiratory pathogens that cause community-acquired pneumonia among people of all ages [165]. Microparticle-based diagnosis provides unprecedented opportunities for the treatment of these diseases. Kim et al. reported a rapid detection method of Mycoplasma Pneumonia (M. Pneumonia) using highly carboxylated polystyrene submicron latex microspheres [166]. In this study, M. Pneumonia solutions using carboxylated polystyrene particles with a diameter of 390 nm and 500 nm were formed with anti-M. Pneumonia. The concentration of the microsphere was 0.02% v/w. Then immunoagglutination assay and static light scattering were used to detect M. Pneumonia inside the Y-channel PDMS microfluidic device. Smaller particles used in this study displayed better detection capability with a wider dynamic range and reproducible manner. They showed that the combination of a microfluidic device with latex immunoagglutination improved the LOD, which was slightly less than 50 pg/mL. The detection time using this method was approximately 90 s. The key advantage of this method is that it is simple and essentially one step. Sample pretreatment, fluorescent dye, or cell cultures are not required in this study.
Here we summarize the performance of micromaterials-based diagnosis methods for respiratory infectious diseases in Table 4.
Table 4.
Evaluation of micromaterials-based diagnosis for respiratory infectious diseases
| Agent | Disease | Micromaterial | Technique | Dynamic Range | Limit of Detection (LOD) | Detection Time | Specificity | Sensitivity | References |
|---|---|---|---|---|---|---|---|---|---|
| Virus | COVID-19 | Fe3O4 & Polystyrene | Magnetic field induced self-assembly | – | – | – | 90% | 80% | [159] |
| Commercial chemiluminescent microparticle | Chemiluminescent immunoassay | – | – | – | 99% | 45.2% for 1 to 7 days, 72.6% for 8 to 14 days & 84.4% after 15 days | [167] | ||
| Influenza (H3N2) | ConA-Gox-AuNP | Colorimetric Assay | 12–240 μg/mL | 11.16 μg/mL | 1.5 h | – | – | [163] | |
| Influenza (A and B) | Carboxyl Modified microspheres | Two photon excitations | – | 50 ng/ml | 25 min | ~ 100% | 89% | [164] | |
| Bacteria | Pneumococcal | Carboxylated Polystyrene | Latex immunoagglutination assay | 5 × 10⁻⁷–5 × 10⁻² μg/mL | 50 pg/mL | < 90 s | – | – | [166] |
Micro/nanodevice-based diagnostics
As we found in Sects. 4.1 and 4.2, diagnostics based on nano/micromaterials has several advantages such as high sensitivity, rapid diagnosis time, and cost-effectiveness [168]. However, nano/micromaterials-based diagnostics require further development to become practical applications in the clinical field. Also, advanced equipment has been needed for the complicated diagnosis of infectious diseases [99]. This necessity leads to the evolution of micro/nanodevices, and many kinds of research have been performed using micro/nano-electromechanical systems (M/NEMS) and lab-on-a-chip devices with micro/nanofluidic techniques for diagnosing infectious diseases. In this section, we explore the micro/nanodevices that mainly diagnose respiratory-related infectious diseases.
Micro/nanoelectromechanical systems (M/NEMS)
The method of diagnosing respiratory infectious diseases using MEMS and NEMS is a field of micro/nanotechnology that we need to pay attention to. MEMS are integrated systems or devices that combine mechanical and electrical components of microscale (1 mm to 100 nm), and NEMS consist of nanoscale electrical and mechanical components of 100 nm or less. Both MEMS and NEMS consist of micro/nano-sensors, micro/nano-actuators, micro/nanostructures, and micro/nanoelectronics in a single integrated device [169]. In addition, micro-sized cantilever, bridge, membrane, and nanowire, nanorod, and nanotube have been widely used in MEMS and NEMS biosensors. Herein, the MEMS and NEMS-based biological sensing applications for diagnosing respiratory infectious diseases are introduced.
There are two commonly used methods for the fabrication of MEMS devices: surface micromachining and bulk micromachining [170]. In the surface micromachining, thin films of thickness 1–100 µm are deposited, patterned, and etched to produce MEMS. The substrate materials such as single-crystal silicon play an important role to form a functional component of MEMS in bulk micromachining which can shape complex 3D configurations. The fabrication process of NEMS can be divided into two methods: top-down and bottom-up methods. The top-down method starts with generating a pattern before nanostructure is made, and includes bulk-, film-, surface-, and mold-nanomachining. Also, four types of top-down nanofabrication methods can be utilized. Those are the following: (1) optical lithography with light beams to duplicate nanopatterns, (2) beam-based lithography with a beam directly to make nanopatterns, (3) scanning probe lithography using the nanoscale tip to interact with substrates, and (4) nanoimprint lithography using a nano-sized mold to press onto the resist [171]. Nanoimprint lithography, which is inexpensive and high-throughput technology, is used to pattern planar nanostructures and has been used to develop the fabrication of NEMS devices [172]. The bottom-up method first assembles atoms and molecules into nanostructures [173]. The bottom-up nanofabrication is commonly used with top-down nanofabrication because it has the disadvantages of randomly distributing nanostructures by molecule self-assembly [174]. MEMS and NEMS can integrate multiple functional devices and signal processing units on a single chip, resulting in miniaturization of size, minimization of energy and power, high throughput, and high reliability. In addition, they have the advantage of being able to manufacture in large quantities, lowering prices. Therefore, many studies have been conducted based on MEMS and NEMS, and these techniques confer unparalleled advantages to diagnose respiratory infectious disease.
Kumar et al. developed the electrochemical biosensor platform with nanostructured black phosphorus to detect myoglobin and showed a high sensitivity in the detection [175]. Choi suggested this electrochemical biosensor platform in the mini-review paper as the detection method retaining high sensitivity for SARS-CoV-2 [176]. Huang et al. proposed a rapid and direct system for detecting SARS-CoV-2 viruses without sample preparation through nanoplasmonic resonance sensor chips [177]. Besides, the onset of COVID-19 has led a company named LUMEX to invent a microchip RT-PCR system in order to detect SARS-CoV-2. The new RT-PCR system showed many advantages compared to the conventional RT-PCR procedure in terms of time/cost-efficiency, lessening space, and reducing human resources. Lee et al. found a novel diagnostic magnetic resonance (DMR) platform which contains a micro nuclear magnetic resonance (µ NMR) chip with micro-coils and a microfluidic array. They used magnetic nanoparticles for proximity assay and showed sensitive results in the detection of Staphylococcus aureus. Through this research, micro/nanotechnologies in the DMR platform were demonstrated to be a rapid and portable platform for the detection of various infectious diseases with multiplexed measurements [178]. Recently, to overcome the limitations of the multiplex molecular diagnostic methods that are currently clinically available such as solid-phase PCR, a plasmonic isothermal recombinase polymerase amplification (RPA) array chip was developed for multiplex molecular diagnosis of respiratory pathogens by Woo et al. Au nanopillars were fully covered by Au nanoparticles with high density for a plasmonic array chip. It showed highly enhanced plasmon-enhanced fluorescence with long DNA amplicons (~ 200 bp). The 4-plex plasmonic RPA array chip successfully showed highly sensitive and rapid detection of respiratory bacterial DNA and viral RNA, within 30 min and 40 min, respectively [179]. Lee et al. developed a paper-based SERS sensor coupled with PCR, which consists of silver-nanowires on the glass-fiber filter paper, for the detection of respiratory bacterial DNA. It showed flexibility and reliability even over 1000 cycles of bending. For the detection of Mycoplasma pneumoniae (M. Pne), PCR-coupled paper-based SERS diagnosis showed enhanced sensitivity with a detection limit of 3.12 pg/µL of DNA for low-cycle amplified DNAs (10 cycles). They developed a rapid kit with SERS substrate and successfully diagnosed M. Pne compared to nontarget gene [180].
Lab-on-a-chip
A lab-on-a-chip (LOC) stands for the miniaturized device that has chemical and biological processes onto it, and it was originated from MEMS. LOC technologies include sensors and arrays, which are non-fluidic small systems, as well as microfluidic chips [181]. LOC mostly relies on core technologies such as microfluidics and molecular biology and can integrate multiple analyzes from DNA sequencing, biochemical detection to disease screening. LOC devices have been used for the development of applications in the biomedical field by detecting viruses and bacteria as disease-causing organisms, analyzing immunoassays, and monitoring disease states [182].
As LOC has become increasingly popular, microfluidic techniques have made naturally significant progress [183]. The microfluidic techniques are typically incorporated with a single operation, such as transportation and mixing for fluid, detection for the product, storage for reagent, and collection [184]. Figure 15 shows the simple configuration of the microfluidic chip [185]. The overview method of how microfluidic devices diagnose virus-based respiratory infectious diseases is shown in Fig. 16 [186]. Regarding the fabrication of a microfluidic chip on LOC, conventional methods (e.g., micro/nano-sized of computer numerical control machining, laser ablation, and the technology of micro-electro-mechanical systems) can be used. Also, the state-of-the-art technologies (e.g., soft lithography, micro/nano molding, hot embossing, xerography, and printed circuit boards/paper-based methods) are useful for the fabrication of the LOC device with cost-effectiveness [184].
Fig. 15.

Configuration of the microfluidic chip. Reprinted with permission from [185]
Fig. 16.

Methods of the microfluidic chip to detect virus-based respiratory infectious diseases. Reprinted with permission from [186]
LOC platforms have great benefits in providing excellent capabilities of sensitiveness and extensive measurement in a compact format. The functions consist of sample preparation, rapid and high throughput, higher sensitivity, reduced volume of sample consumption, and multi-detection [184, 187]. In particular, microfluidic technology creates millions of microchannels with electrodes, valves, and electronics to diagnose respiratory infectious diseases. The microchannel has a great advantage in that it can manipulate biochemical reactions even in tiny amounts; hence, the patient's blood can be easily separated for disease screening. The microfluidics technique can also manage small amounts of fluid using microchannels in the tens to hundreds of micrometers in size. For this reason, there are many advantages: portability for field use, low cost, versatility in design, possibility to integrate with other small devices, and microfluidic chip-based systems for biological cell research. The microfluidic system consumes much fewer chemicals and solvents and can work faster and at a lower cost than conventional systems; hence, it is widely used in processes that happened in cell separation, manipulation, PCR amplification, DNA analysis, etc. Thus, various disciplines are connected to the microfluidics fields, such as physics, chemistry, engineering, and biotechnology [188].
Zhou et al. detected SARS-coronavirus with the developed novel platform, which is duplex PCR with a microfluidic chip and microchip [189]. It showed more sensitive results of 17/18 for positive samples than the results of 12/18 of the conventional RT-PCR. Yu et al. developed the platform of ZnO nanostructured on the microfluidic chip to detect avian influenza virus (AIV) and nanorods of ZnO made the sensitivity of the detection about 22 times higher than that of the conventional method [190]. Jia et al. presented a novel PCR platform which is nanofluidic chip digital PCR (cdPCR) to detect the African swine fever virus (ASFV) for the first time [191]. For the detection of influenza virus H1N1, a microfluidic chip with polydimethylsiloxane microchannels has been newly developed by Singh et al. using an electrochemical immunosensor based upon reduced graphene oxide [192]. Cao et al. developed a microfluidic chip using RT-PCR that makes the amplification of influenza A RNA [193]. The developed microfluidic chip combined the two processes of solid-phase extraction and molecular amplification and showed 96% of sensitivity and 100% of specificity. The image for the microfluidic chip and the sequence of the microfluidic assay are shown in Fig. 17 [193].
Fig. 17.

a and b Microfluidic chip for the detection of influenza A, c Procedure of microfluidic assay. Reprinted with permission from [193]
For COVID-19, many kinds of research on microfluidic chips have been studied to detect SARS-CoV-2. Xie et al. utilized a nano-scale RT-qPCR system on the microfluidic chip, which is one of the three-step approaches to detect SARS-CoV-2 and achieved the result of reduced False-Negative rate with low viral loads with higher sensitivity than the standard RT-PCR method [194]. Tarim et al. introduced an effective diagnostic method using microfluidic techniques to solve the problems of the existing SARS-CoV-2 detection method, which requires a skilled workforce and expensive equipment [186]. They proved that the microfluidic diagnostic device they developed is portable while using minimal sample volumes, saving time, money, and labor. Rodriguez-Moncayo et al. developed the multiplexed microfluidic device to measure IgG and IgM against four different proteins for COVID-19 using serology assay and showed high-throughput results with a sensitivity of 95% and specificity of 91% [195]. Beyond diagnosing a single infectious disease, Huang et al. [196] developed Onestart, which is a microfluidic chip-based PCR-array system to diagnose respiratory infection. The Onestart can detect 21 different respiratory pathogens in an integrated manner that processes from sample dissolution to real-time PCR at once and has the advantage of easy operation and short processing time. The micro/nanodevice-based diagnosis for respiratory infectious diseases is summarized in Table 5.
Table 5.
Evaluation of micro/nanodevice-based diagnosis for respiratory infectious diseases
| Agent | Disease | Micro/nanodevice | Technique | Dynamic range | Limit of detection (LOD) | Detection time (min) | Specificity | Sensitivity | References |
|---|---|---|---|---|---|---|---|---|---|
| Virus | COVID-19 | Nanoplasmonic resonance sensor | M/NEMS | 0 to 107 vp/mL | 370 vp/mL | 15 | – | – | [177] |
| Microchip RT-PCR | – | 2.6 × 10² copies/mL | 50 | – | – | LUMEX | |||
| Nano-scale qPCR on microfluidic chip | Microfluidic | – | < 1 copy/µL | – | – | – | [194] | ||
| Multiplexed microfluidic device | Microfluidic | – | 1.6 ng/mL | 156 | 91% | 95% | [195] | ||
| Influenza | ZnO nanorod integrated microdevice | Microfluidic | – | 3.6 × 10³ EID50/mL | 90 | – | – | [190] | |
| Microfluidic chip integrated with RGO-based electrochemical immunosensor | Microfluidic | 1 to 104 pfu/mL | 0.5 PFU/mL | – | – | – | [192] | ||
| Microfluidic chip via RT-PCR | Microfluidic | – | 103 copies/mL | 180 | 100% | 96% | [193] | ||
| SARS | Duplex PCR with a microfluidic chip and microchip | Microfluidic | 4.02 × 10⁻⁶ mol/L to 4.02 × 10⁻⁹ mol/L | 6.67 × 10⁻¹³ mol/L | 50–60 | – | – | [189] | |
| Coronavirus (CoV) 229E | Plasmonic isothermal RPA array chip | M/NEMS | – | 103 copies/rxn | 40 | – | – | [179] | |
| CoV OC43 | – | 104 copies/rxn | 40 | – | – | ||||
| CoV NL63 | – | 105 copies/rxn | 40 | – | – | ||||
| Human metapneumovirus (hMPV) | – | 103 copies/rxn | 40 | – | – | ||||
| African Swine Fever | Nanofluidic Chip Digital PCR | Nanofluidic | – | 30.1995 copies/rxn | – | 94.44% | 86.27% | [191] | |
| Bacteria | Staphylococcus aureus | DMR platform with NMR chip, micro-coils and a microfluidic array | M/NEMS | – | ∼10 bacteria/µL | 10 | – | – | [178] |
| Streptococcus pneumoniae | Plasmonic isothermal RPA array chip | M/NEMS | – | 101 copies/rxn | 30 | – | – | [179] | |
| Haemophilus influenzae | – | 104 copies/rxn | 30 | – | – | ||||
| Chlamydia pneumoniae | – | 101 copies/rxn | 30 | – | – | ||||
| Mycoplasma pneumoniae | – | 103 copies/rxn | 30 | – | – | ||||
| Mycoplasma pneumoniae | PCR-coupled paper-based SERS sensor | M/NEMS | 1 µM to 10 nM | 3.12 pg/µL | 20 | – | – | [180] |
Concluding remarks
As discussed in this review paper, micro/nanotechnologies have been successfully utilized to diagnose respiratory infectious diseases. Micro/nanotechnology-based diagnosis methods have many advantages compared to conventional diagnosis methods due to their rapid, space/cost-effectiveness, and accuracy. Micro/nanomaterials-based diagnostics have shown remarkable development in the sensitivity and performance of biosensors with a high surface-to-volume ratio of micro/nano-sized materials. Furthermore, micro/nanodevices have been developed for the complicated diagnosis of respiratory infectious diseases and applied in the clinical field. Micro/nanodevices based on LOC platforms with microfluidic techniques also show high sensitivity, high throughput, and accurate results, as well as low cost and portability in a compact format. Both micro/nanomaterials-based and micro/nanodevice-based diagnostic methods have been developed and applied for the detection of various respiratory infectious diseases. However, there is less research work using micro/nanodevices to diagnose respiratory infectious diseases than that using micro/nanomaterials. Since both fields are developing rapidly and are still in their early stages, further research is required to commercialize these technologies. In the review of nanobiosensors for diagnostics of SARS, MERS, and COVID-19, the next challenge for nanobiosensors is reported to have wearable and user-friendly features [197]. In addition, micro/nanotechnologies will need to evolve further with additive manufacturing techniques, such as 3D printing, to facilitate the fabrication of micro/nanodevices for biomedical applications. This evolution will lead to compact, low-cost, high-performance, and robust micro/nanodevices to diagnose respiratory infectious diseases.
Acknowledgements
S.H. acknowledges Alberta Graduate Excellence Scholarship – International. K.K. acknowledges the support of the Natural Sciences and Engineering Research Council of Canada (NSERC) Discovery Grant (RGPIN-04559-2020). S.K. acknowledges the support of NSERC Discovery Grant (RGPIN-03943-2020).
Conflict of interest
The authors declare that they have no conflict of interest.
Ethical statement
This article does not contain studies with human participants or animals.
Footnotes
Publisher's Note
Springer Nature remains neutral with regard to jurisdictional claims in published maps and institutional affiliations.
Setareh Homayoonnia and Yoonjung Lee have contributed equally to this work.
Contributor Information
Keekyoung Kim, Email: keekyoung.kim@ucalgary.ca.
Seonghwan Kim, Email: sskim@ucalgary.ca.
References
- 1.Procop GW, Wilson M. Infectious disease pathology. Clin Infect Dis. 2001;32(11):1589–1601. doi: 10.1086/320537. [DOI] [PubMed] [Google Scholar]
- 2.Morens DM, Taubenberger JK, Folkers GK, Fauci AS. Pandemic influenza’s 500th anniversary. Clin Infect Dis. 2010;51(12):1442–1444. doi: 10.1086/657429. [DOI] [PMC free article] [PubMed] [Google Scholar]
- 3.Potter CW. A history of influenza. J Appl Microbiol. 2008;91(4):572–579. doi: 10.1046/j.1365-2672.2001.01492.x. [DOI] [PubMed] [Google Scholar]
- 4.Beveridge WIB. The chronicle of influenza epidemics. Hist Philos Life Sci. 1991;13(2):223–234. [PubMed] [Google Scholar]
- 5.Raoult D, Drancourt M. Paleomicrobiology: past human infections; 2008.
- 6.Flecknoe D, Charles Wakefield B, Simmons A. Plagues & wars: the ‘Spanish Flu’ pandemic as a lesson from history. Med Confl Surv. 2018;34(2):61–68. doi: 10.1080/13623699.2018.1472892. [DOI] [PubMed] [Google Scholar]
- 7.Cockburn WC, Delon PJ, Ferreira W. Origin and progress of the 1968–69 Hong Kong influenza epidemic. Bull World Health Organ. 1969;41(3):345–348. [PMC free article] [PubMed] [Google Scholar]
- 8.Jester BJ, Uyeki TM, Jernigan DB. Fifty years of influenza A(H3N2) following the pandemic of 1968. Am J Public Health. 2020;110(5):669–676. doi: 10.2105/AJPH.2019.305557. [DOI] [PMC free article] [PubMed] [Google Scholar]
- 9.Xu RH, et al. Epidemiologic clues to SARS origin in China. Emerg Infect Dis. 2004;10(6):1030–1037. doi: 10.3201/eid1006.030852. [DOI] [PMC free article] [PubMed] [Google Scholar]
- 10.Fisman D, Rivers C, Lofgren E, Majumder MS. Estimation of MERS-coronavirus reproductive number and case fatality rate for the spring 2014 saudi arabia outbreak: insights from Publicly Available Data. PLoS Curr. 2014 doi: 10.1371/currents.outbreaks.98d2f8f3382d84f390736cd5f5fe133c. [DOI] [PMC free article] [PubMed] [Google Scholar]
- 11.Peiris JSM, Guan Y, Yuen KY. Severe acute respiratory syndrome. Nat Med. 2004;10(12S):S88–S97. doi: 10.1038/nm1143. [DOI] [PMC free article] [PubMed] [Google Scholar]
- 12.De Wit E, Van Doremalen N, Falzarano D, Munster VJ. SARS and MERS: recent insights into emerging coronaviruses. Nat Rev Microbiol. 2016;14(8):523–534. doi: 10.1038/nrmicro.2016.81. [DOI] [PMC free article] [PubMed] [Google Scholar]
- 13.Norrby E. Nobel Prizes and the emerging virus concept. Arch Virol. 2008;153(6):1109–1123. doi: 10.1007/s00705-008-0088-8. [DOI] [PubMed] [Google Scholar]
- 14.Williamson SJ. Viral metagenomics. Handb Mol Microb Ecol II Metagenomics Differ Habitats. 2011;3:3–13. doi: 10.1002/9781118010549.ch2. [DOI] [Google Scholar]
- 15.Breitbart M, Rohwer F. Here a virus, there a virus, everywhere the same virus? Trends Microbiol. 2005;13(6):278–284. doi: 10.1016/j.tim.2005.04.003. [DOI] [PubMed] [Google Scholar]
- 16.Lawrence CM, et al. Structural and functional studies of archaeal viruses. J Biol Chem. 2009;284(19):12599–12603. doi: 10.1074/jbc.R800078200. [DOI] [PMC free article] [PubMed] [Google Scholar]
- 17.Drosten C, et al. Identification of a novel coronavirus in patients with severe acute respiratory syndrome. N Engl J Med. 2003;348(20):1967–1976. doi: 10.1056/nejmoa030747. [DOI] [PubMed] [Google Scholar]
- 18.Rota PA, et al. Characterization of a novel coronavirus associated with severe acute respiratory syndrome. Science. 2003;300(5624):1394–1399. doi: 10.1126/science.1085952. [DOI] [PubMed] [Google Scholar]
- 19.Velavan TP, Meyer CG. The COVID-19 epidemic. Trop Med Int Heal. 2020;25(3):278–280. doi: 10.1111/tmi.13383. [DOI] [PMC free article] [PubMed] [Google Scholar]
- 20.Shereen MA, Khan S, Kazmi A, Bashir N, Siddique R. COVID-19 infection: origin, transmission, and characteristics of human coronaviruses. J Adv Res. 2020;24:91–98. doi: 10.1016/j.jare.2020.03.005. [DOI] [PMC free article] [PubMed] [Google Scholar]
- 21.Ting EEK, Sander B, Ungar WJ. Systematic review of the cost-effectiveness of influenza immunization programs. Vaccine. 2017;35(15):1828–1843. doi: 10.1016/j.vaccine.2017.02.044. [DOI] [PubMed] [Google Scholar]
- 22.Claas ECJ, et al. Human influenza A H5N1 virus related to a highly pathogenic avian influenza virus. Lancet. 1998;351(9101):472–477. doi: 10.1016/S0140-6736(97)11212-0. [DOI] [PubMed] [Google Scholar]
- 23.Taubenberger JK, Morens DM. The pathology of influenza virus infections. Annu Rev Pathol Mech Dis. 2008;3:499–522. doi: 10.1146/annurev.pathmechdis.3.121806.154316. [DOI] [PMC free article] [PubMed] [Google Scholar]
- 24.Smyth RL, Openshaw PJM. Bronchiolitis. Lancet. 2006;368:312–322. doi: 10.1016/S0140-6736(06)69077-6. [DOI] [PubMed] [Google Scholar]
- 25.Lambert N, Strebel P, Orenstein W, Icenogle J, Poland GA. Rubella. Lancet. 2015;385(9984):2297–2307. doi: 10.1016/S0140-6736(14)60539-0. [DOI] [PMC free article] [PubMed] [Google Scholar]
- 26.Heininger U, Seward JF. Varicella. Lancet. 2006;368:1365–1376. doi: 10.1016/S0140-6736(06)69561-5. [DOI] [PubMed] [Google Scholar]
- 27.Hambleton S. Chickenpox. Curr Opin Infect Dis. 2005;18:235–240. doi: 10.1097/01.qco.0000168384.31766.89. [DOI] [PubMed] [Google Scholar]
- 28.Bester JC. Measles and measles vaccination a review. JAMA Pediatr. 2016;170(12):1209–1215. doi: 10.1001/jamapediatrics.2016.1787. [DOI] [PubMed] [Google Scholar]
- 29.Hviid A, Rubin S, Mühlemann K. Mumps. Lancet. 2008;371:932–944. doi: 10.1016/S0140-6736(08)60419-5. [DOI] [PubMed] [Google Scholar]
- 30.Zoorob R, Sidani M, Murray J. Croup : an overview. Am Fam Phys. 2011;83:1067–1073. [PubMed] [Google Scholar]
- 31.Bjornson CL, Johnson DW. Croup. Lancet. 2008;371:329–339. doi: 10.1016/S0140-6736(08)60170-1. [DOI] [PMC free article] [PubMed] [Google Scholar]
- 32.Konstantinos A. Diagnostic tests: testing for tuberculosis. Aust Prescr. 2010;33(1):12–18. doi: 10.18773/austprescr.2010.005. [DOI] [Google Scholar]
- 33.Sudre P, Ten Dam G, Kochi A. Tuberculosis: a global overview of the situation today. Bull World Health Organ. 1992;70(2):149–159. [PMC free article] [PubMed] [Google Scholar]
- 34.Epidemiological W. Weekly epidemiological record Relevé épidémiologique hebdomadaire. 1997;(12):93–104. [PubMed]
- 35.Mattoo S, Cherry JD. Molecular Pathogenesis, Epidemiology, and Clinical Manifestations of Respiratory Infections Due to Bordetella pertussis and Other Bordetella Subspecies. Clin Microbiol Rev. 2005;18(2):326–382. doi: 10.1128/CMR.18.2.326. [DOI] [PMC free article] [PubMed] [Google Scholar]
- 36.Carbonetti NH. Immunomodulation in the pathogenesis of Bordetella pertussis infection and disease. Curr Opin Pharmacol. 2007;7(3):272–278. doi: 10.1016/j.coph.2006.12.004. [DOI] [PubMed] [Google Scholar]
- 37.Sojinrin T, et al. Plasmonic gold nanoparticles for detection of fungi and human cutaneous fungal infections. Anal Bioanal Chem. 2017;409(19):4647–4658. doi: 10.1007/s00216-017-0414-7. [DOI] [PubMed] [Google Scholar]
- 38.Infections F, Report G. Stop neglecting fungi. Nat Microbiol. 2017;2:17120. doi: 10.1038/nmicrobiol.2017.120. [DOI] [PubMed] [Google Scholar]
- 39.Van Dijck PWM. On the safety of Aspergillus niger: a review. Appl Microbiol Biotechnol. 2002 doi: 10.1007/s00253-002-1032-6. [DOI] [PubMed] [Google Scholar]
- 40.Singh N, Paterson DL. Aspergillus infections in transplant recipients. Clin Microbiol Rev. 2005;18:44–69. doi: 10.1128/CMR.18.1.44-69.2005. [DOI] [PMC free article] [PubMed] [Google Scholar]
- 41.Safavieh M, et al. Advances in Candida detection platforms for clinical and point-of-care applications. Crit Rev Biotechnol. 2017;37(4):441–458. doi: 10.3109/07388551.2016.1167667. [DOI] [PMC free article] [PubMed] [Google Scholar]
- 42.Villamizar RA, Maroto A, Rius FX. Improved detection of Candida albicans with carbon nanotube field-effect transistors. Sens Actuators B Chem. 2009;136(2):451–457. doi: 10.1016/j.snb.2008.10.013. [DOI] [Google Scholar]
- 43.Mylonakis E, Zacharioudakis IM, Clancy CJ, Hong Nguyen M, Pappas PG. Efficacy of T2 magnetic resonance assay in monitoring candidemia after initiation of antifungal therapy: the serial therapeutic and antifungal monitoring protocol (STAMP) trial. J Clin Microbiol. 2018;56(4):1–9. doi: 10.1128/JCM.01756-17. [DOI] [PMC free article] [PubMed] [Google Scholar]
- 44.Mayer FL, Wilson D, Hube B. Candida albicans pathogenicity mechanisms. Virulence. 2013;4(2):119–128. doi: 10.4161/viru.22913. [DOI] [PMC free article] [PubMed] [Google Scholar]
- 45.Shweihat Y, Perry J, Shah D. Isolated Candida infection of the lung. Respir Med Case Reports. 2015;16:18–19. doi: 10.1016/j.rmcr.2015.03.001. [DOI] [PMC free article] [PubMed] [Google Scholar]
- 46.Jevon P, Clinical diagnosis, ISBN: 978-1-444-33516-3 April 2011 Wiley-Blackwell.
- 47.Ritzi-Lehnert M. Development of chip-compatible sample preparation for diagnosis of infectious diseases. Expert Rev Mol Diagn. 2012;12(2):189–206. doi: 10.1586/erm.11.98. [DOI] [PubMed] [Google Scholar]
- 48.Commentary I, Circle F. Clinical diagnosis: Is there any other type ? JAMA Intern Med. 2020;180:1304–1305. doi: 10.1001/jamainternmed.2020.3048. [DOI] [PubMed] [Google Scholar]
- 49.Richardson WS, Wilson MC, Guyatt GH, Richardson WS. Users ’ guides to the medical literature XV. How to use an article about disease probability for differential diagnosis. JAMA. 1999;281(13):1214–1219. doi: 10.1001/jama.281.13.1214. [DOI] [PubMed] [Google Scholar]
- 50.Saik RK, et al. Primer-directed enzymatic amplification of DNA with a thermostable DNA polymerase. Science. 1988;239:487–491. doi: 10.1126/science.2448875. [DOI] [PubMed] [Google Scholar]
- 51.Saiki RK, et al. Enzymatic amplification of beta-globin genomic sequences and restriction site analysis for diagnosis of sickle cell anemia. Science. 1985;230:1350–1354. doi: 10.1126/science.2999980. [DOI] [PubMed] [Google Scholar]
- 52.Erlich HA. PCR technology: principles and applications fo DNA amplification. Stockton Press; 1989. [Google Scholar]
- 53.Erlich HA. Polymerase chain reaction. J Clin Immunol. 1989;9:437–447. doi: 10.1007/BF00918012. [DOI] [PubMed] [Google Scholar]
- 54.Garibyan L, Avashia N. Polymerase chain reaction. J Invest Dermatol. 2013;133(3):1–4. doi: 10.1038/jid.2013.1. [DOI] [PMC free article] [PubMed] [Google Scholar]
- 55.VanGuilder HD, Vrana KE, Freeman WM. Twenty-five years of quantitative PCR for gene expression analysis. Biotechniques. 2008;44(5):619–626. doi: 10.2144/000112776. [DOI] [PubMed] [Google Scholar]
- 56.Mori Y, Nagamine K, Tomita N, Notomi T. Detection of loop-mediated isothermal amplification reaction by turbidity derived from magnesium pyrophosphate formation. Biochem Biophys Res Commun. 2001;154:150–154. doi: 10.1006/bbrc.2001.5921. [DOI] [PubMed] [Google Scholar]
- 57.Moehling TJ, Choi G, Dugan LC, Salit M, Robert J. Expert review of molecular diagnostics LAMP Diagnostics at the point-of-care : emerging trends and perspectives for the developer community LAMP diagnostics at the point-of-care : emerging trends and perspectives for the developer community ABSTRACT. Expert Rev Mol Diagn. 2021;21(1):43–62. doi: 10.1080/14737159.2021.1873769. [DOI] [PubMed] [Google Scholar]
- 58.Patel JC, et al. Field Evaluation of a real-time fluorescence loop-mediated isothermal ampli fi cation assay, realamp, for the diagnosis of malaria in Thailand and India. J Infect Dis. 2014 doi: 10.1093/infdis/jiu252. [DOI] [PMC free article] [PubMed] [Google Scholar]
- 59.Njiru ZK. Loop-mediated isothermal amplification technology: towards point of care diagnostics. PLoS Negl Trop Dis. 2012;6(6):1–4. doi: 10.1371/journal.pntd.0001572. [DOI] [PMC free article] [PubMed] [Google Scholar]
- 60.Mori Y, Kitao M, Tomita N, Notomi T. Real-time turbidimetry of LAMP reaction for quantifying template DNA. J Biochem Biophys Methods. 2004;59:145–157. doi: 10.1016/j.jbbm.2003.12.005. [DOI] [PubMed] [Google Scholar]
- 61.Nagraik R, Sharma A, Kumar D, Mukherjee S, Sen F, Kumar AP. Amalgamation of biosensors and nanotechnology in disease diagnosis: Mini-review. Sens Int. 2021;2:100089. doi: 10.1016/j.sintl.2021.100089. [DOI] [Google Scholar]
- 62.Lee SH, Baek YH, Kim YH, Choi YK, Song MS, Ahn JY. One-pot reverse transcriptional loop-mediated isothermal amplification (RT-LAMP) for detecting MERS-CoV. Front Microbiol. 2017;7:1–13. doi: 10.3389/fmicb.2016.02166. [DOI] [PMC free article] [PubMed] [Google Scholar]
- 63.Huh HJ, et al. Performance evaluation of the PowerChek MERS (upE & ORF1a) real-time PCR kit for the detection of middle east respiratory syndrome coronavirus RNA. Ann Lab Med. 2017;37(6):494–498. doi: 10.3343/alm.2017.37.6.494. [DOI] [PMC free article] [PubMed] [Google Scholar]
- 64.Inaba M, et al. Diagnostic accuracy of LAMP versus PCR over the course of SARS-CoV-2 infection. Int J Infect Dis. 2021;107:195–200. doi: 10.1016/j.ijid.2021.04.018. [DOI] [PMC free article] [PubMed] [Google Scholar]
- 65.Chow FWN, et al. A rapid, simple, inexpensive, and mobile colorimetric assay covid-19-lamp for mass on-site screening of covid-19. Int J Mol Sci. 2020;21(15):1–10. doi: 10.3390/ijms21155380. [DOI] [PMC free article] [PubMed] [Google Scholar]
- 66.Miller TE, et al. Clinical sensitivity and interpretation of PCR and serological COVID-19 diagnostics for patients presenting to the hospital. FASEB J. 2020;34(10):13877–13884. doi: 10.1096/fj.202001700RR. [DOI] [PMC free article] [PubMed] [Google Scholar]
- 67.Fujino M, et al. A simple method for the detection of measles virus genome by loop-mediated isothermal amplification (LAMP) J Med Virol. 2005;76(3):406–413. doi: 10.1002/jmv.20371. [DOI] [PMC free article] [PubMed] [Google Scholar]
- 68.Yoshida N, Fujino M, Ota Y, Notomi T, Nakayama T. Simple differentiation method of mumps Hoshino vaccine strain from wild strains by reverse transcription loop-mediated isothermal amplification (RT-LAMP) Vaccine. 2007;25(7):1281–1286. doi: 10.1016/j.vaccine.2006.09.093. [DOI] [PubMed] [Google Scholar]
- 69.Krause CH, Eastick K, Ogilvie MM. Real-time PCR for mumps diagnosis on clinical specimens-Comparison with results of conventional methods of virus detection and nested PCR. J Clin Virol. 2006;37(3):184–189. doi: 10.1016/j.jcv.2006.07.009. [DOI] [PubMed] [Google Scholar]
- 70.Jin L, Feng Y, Parry R, Cui A, Lu Y. Real-time PCR and its application to mumps rapid diagnosis. J Med Virol. 2007;79(11):1761–1767. doi: 10.1002/jmv.20880. [DOI] [PubMed] [Google Scholar]
- 71.Shivakoti S, et al. Development of reverse transcription-loop-mediated isothermal amplification (RT-LAMP) assay for detection of avian influenza viruses in field specimens. J Vet Med Sci. 2010;72(4):519–523. doi: 10.1292/jvms.09-0473. [DOI] [PubMed] [Google Scholar]
- 72.Poon LLM, et al. Detection of human influenza A viruses by loop-mediated isothermal amplification. J Clin Microbiol. 2005;43(1):427–430. doi: 10.1128/JCM.43.1.427-430.2005. [DOI] [PMC free article] [PubMed] [Google Scholar]
- 73.Mahony J, Chong S, Bulir D, Ruyter A, Mwawasi K, Waltho D. Multiplex loop-mediated isothermal amplification (M-LAMP) assay for the detection of influenza A/H1, A/H3 and influenza B can provide a specimen-to-result diagnosis in 40min with single genome copy sensitivity. J Clin Virol. 2013;58(1):127–131. doi: 10.1016/j.jcv.2013.06.006. [DOI] [PubMed] [Google Scholar]
- 74.Stone B, et al. Rapid detection and simultaneous subtype differentiation of influenza A viruses by real time PCR. J Virol Methods. 2004;117(2):103–112. doi: 10.1016/j.jviromet.2003.12.005. [DOI] [PubMed] [Google Scholar]
- 75.Ushio M, et al. Detection of respiratory syncytial virus genome by subgroups-A, B specific reverse transcription loop-mediated isothermal amplification (RT-LAMP) J Med Virol. 2005;77(1):121–127. doi: 10.1002/jmv.20424. [DOI] [PubMed] [Google Scholar]
- 76.Shirato K, et al. Diagnosis of human respiratory syncytial virus infection using reverse transcription loop-mediated isothermal amplification. J Virol Methods. 2007;139(1):78–84. doi: 10.1016/j.jviromet.2006.09.014. [DOI] [PMC free article] [PubMed] [Google Scholar]
- 77.Huguenin A, et al. Broad respiratory virus detection in infants hospitalized for bronchiolitis by use of a multiplex RT-PCR DNA microarray system. J Med Virol. 2012;84(6):979–985. doi: 10.1002/jmv.23272. [DOI] [PMC free article] [PubMed] [Google Scholar]
- 78.Hu A, Colella M, Tam JS, Rappaport R, Cheng SM. Simultaneous detection, subgrouping, and quantitation of respiratory syncytial virus A and B by real-time PCR. J Clin Microbiol. 2003;41(1):149–154. doi: 10.1128/JCM.41.1.149-154.2003. [DOI] [PMC free article] [PubMed] [Google Scholar]
- 79.Abo H, et al. Development of an improved RT-LAMP assay for detection of currently circulating rubella viruses. J Virol Methods. 2014;207(2014):73–77. doi: 10.1016/j.jviromet.2014.06.013. [DOI] [PubMed] [Google Scholar]
- 80.Okamoto K, et al. Evaluation of sensitivity of TaqMan RT-PCR for rubella virus detection in clinical specimens. J Clin Virol. 2016;80:98–101. doi: 10.1016/j.jcv.2016.05.005. [DOI] [PubMed] [Google Scholar]
- 81.Macé M, et al. Diagnostic value of reverse transcription-PCR of amniotic fluid for prenatal diagnosis of congenital rubella infection in pregnant women with confirmed primary rubella infection. J Clin Microbiol. 2004;42(10):4818–4820. doi: 10.1128/JCM.42.10.4818-4820.2004. [DOI] [PMC free article] [PubMed] [Google Scholar]
- 82.Pooja S, Sudesh D, Poonam K, Joginder SD, Suresh KG. Loop-mediated isothermal amplification (LAMP) based detection of bacteria: a review. African J Biotechnol. 2014;13(19):1920–1928. doi: 10.5897/ajb2013.13459. [DOI] [Google Scholar]
- 83.Pandey BD, et al. Development of an in-house loop-mediated isothermal amplification (LAMP) assay for detection of Mycobacterium tuberculosis and evaluation in sputum samples of Nepalese patients. J Med Microbiol. 2008;57(4):439–443. doi: 10.1099/jmm.0.47499-0. [DOI] [PubMed] [Google Scholar]
- 84.Kim JH, Kim YJ, Ki CS, Kim JY, Lee NY. Evaluation of cobas TaqMan MTB PCR for detection of Mycobacterium tuberculosis. J Clin Microbiol. 2011;49(1):173–176. doi: 10.1128/JCM.00694-10. [DOI] [PMC free article] [PubMed] [Google Scholar]
- 85.Kim DW, et al. The enhanced pneumococcal LAMP assay: a clinical tool for the diagnosis of meningitis due to Streptococcus pneumoniae. PLoS ONE. 2012;7(8):1–8. doi: 10.1371/journal.pone.0042954. [DOI] [PMC free article] [PubMed] [Google Scholar]
- 86.de Paz HD, Brotons P, Esteva C, Muñoz-Almagro C. Validation of a loop-mediated isothermal amplification assay for rapid diagnosis of invasive pneumococcal disease. Front Cell Infect Microbiol. 2020;10(March):1–7. doi: 10.3389/fcimb.2020.00115. [DOI] [PMC free article] [PubMed] [Google Scholar]
- 87.Smith MD, et al. Diagnosis of Streptococcus pneumoniae infections in adults with bacteremia and community-acquired pneumonia: Clinical comparison of pneumococcal PCR and urinary antigen detection. J Clin Microbiol. 2009;47(4):1046–1049. doi: 10.1128/JCM.01480-08. [DOI] [PMC free article] [PubMed] [Google Scholar]
- 88.Gritzfeld JF, et al. Density and duration of experimental human pneumococcal carriage. Clin Microbiol Infect. 2014;20(12):O1145–O1151. doi: 10.1111/1469-0691.12752. [DOI] [PMC free article] [PubMed] [Google Scholar]
- 89.Yamamoto M, et al. Rapid detection of candida auris based on loop-mediated isothermal amplification (LAMP) J Clin Microbiol. 2018 doi: 10.1128/JCM.00591-18. [DOI] [PMC free article] [PubMed] [Google Scholar]
- 90.Klingspor L, Jalal S. Molecular detection and identification of Candida and Aspergillus spp. from clinical samples using real-time PCR. Clin Microbiol Infect. 2006;12(8):745–753. doi: 10.1111/j.1469-0691.2006.01498.x. [DOI] [PubMed] [Google Scholar]
- 91.Leach L, Zhu Y, Chaturvedi S. Development and validation of a real-time pcr assay for rapid detection of candida auris from surveillance samples. J Clin Microbiol. 2018 doi: 10.1128/JCM.01223-17. [DOI] [PMC free article] [PubMed] [Google Scholar]
- 92.Ferrara M, Logrieco AF, Moretti A, Susca A. A loop-mediated isothermal amplification (LAMP) assay for rapid detection of fumonisin producing Aspergillus species. Food Microbiol. 2020;90:103469. doi: 10.1016/j.fm.2020.103469. [DOI] [PubMed] [Google Scholar]
- 93.Nagamine K, Hase T, Notomi T. Accelerated reaction by loop-mediated isothermal amplification using loop primers. Mol Cell Probes. 2002;16(3):223–229. doi: 10.1006/mcpr.2002.0415. [DOI] [PubMed] [Google Scholar]
- 94.Johnson GL, Bibby DF, Wong S, Agrawal SG, Bustin SA. A MIQE-compliant real-time PCR assay for aspergillus detection. PLoS ONE. 2012 doi: 10.1371/journal.pone.0040022. [DOI] [PMC free article] [PubMed] [Google Scholar]
- 95.White PL, et al. Evaluation of Aspergillus PCR protocols for testing serum specimens. J Clin Microbiol. 2011;49(11):3842–3848. doi: 10.1128/JCM.05316-11. [DOI] [PMC free article] [PubMed] [Google Scholar]
- 96.Muthukrishnan L. Multidrug resistant tuberculosis: Diagnostic challenges and its conquering by nanotechnology approach—an overview. Chem Biol Interact. 2020;337:2021. doi: 10.1016/j.cbi.2021.109397. [DOI] [PubMed] [Google Scholar]
- 97.Nasiruddin M, Neyaz MK, Das S. Nanotechnology-based approach in tuberculosis treatment. Tuberc Res Treat. 2017;2017:1–12. doi: 10.1155/2017/4920209. [DOI] [PMC free article] [PubMed] [Google Scholar]
- 98.Xu K, et al. Nanomaterials in the prevention, diagnosis, and treatment of mycobacterium tuberculosis infections. Adv Healthc Mater. 2018;7(1):1–14. doi: 10.1002/adhm.201700509. [DOI] [PubMed] [Google Scholar]
- 99.Wang Y, Yu L, Kong X, Sun L. Application of nanodiagnostics in point-of-care tests for infectious diseases. Int J Nanomedicine. 2017;12:4789–4803. doi: 10.2147/IJN.S137338. [DOI] [PMC free article] [PubMed] [Google Scholar]
- 100.Jackson TC, Patani BO, Ekpa DE. Nanotechnology in diagnosis: a review. Adv Nanoparticles. 2017;06(03):93–102. doi: 10.4236/anp.2017.63008. [DOI] [Google Scholar]
- 101.Malhotra BD, Ali MdA. Nanomaterials for biosensors: fundamentals and applications. Elsevier. 2018 doi: 10.1016/C2015-0-04697-4. [DOI] [Google Scholar]
- 102.Rabti A, Raouafi A, Raouafi N. DNA markers and nano-biosensing approaches for tuberculosis diagnosis. Nanotechnol Based Appr Tuberculosis Treatment. 2020;21(1):207–230. doi: 10.1016/B978-0-12-819811-7.00013-8. [DOI] [Google Scholar]
- 103.Rizvi SB, Ghaderi S, Keshtgar M, Seifalian AM. Semiconductor quantum dots as fluorescent probes for in vitro and in vivo bio-molecular and cellular imaging. Nano Rev. 2010;1(1):5161. doi: 10.3402/nano.v1i0.5161. [DOI] [PMC free article] [PubMed] [Google Scholar]
- 104.Frasco MF, Chaniotakis N. Semiconductor quantum dots in chemical sensors and biosensors. Sensors. 2009;9(9):7266–7286. doi: 10.3390/s90907266. [DOI] [PMC free article] [PubMed] [Google Scholar]
- 105.Kim H, et al. Development of label-free colorimetric assay for MERS-CoV using gold nanoparticles. ACS Sens. 2019;4(5):1306–1312. doi: 10.1021/acssensors.9b00175. [DOI] [PubMed] [Google Scholar]
- 106.Layqah LA, Eissa S. An electrochemical immunosensor for the corona virus associated with the Middle East respiratory syndrome using an array of gold nanoparticle-modified carbon electrodes. Microchim Acta. 2019 doi: 10.1007/s00604-019-3345-5. [DOI] [PMC free article] [PubMed] [Google Scholar]
- 107.Teengam P, et al. Multiplex paper-based colorimetric DNA Sensor using pyrrolidinyl peptide nucleic acid-induced AgNPs aggregation for detecting MERS-CoV, MTB, and HPV oligonucleotides. Anal Chem. 2017;89:5428–5435. doi: 10.1021/acs.analchem.7b00255. [DOI] [PMC free article] [PubMed] [Google Scholar]
- 108.Moitra P, et al. Selective naked-eye detection of SARS-CoV-2 mediated by N Gene targeted antisense oligonucleotide capped plasmonic nanoparticles. ACS Nano. 2020;14(6):7617–7627. doi: 10.1021/acsnano.0c03822. [DOI] [PMC free article] [PubMed] [Google Scholar]
- 109.Huang C, Wen T, Shi FJ, Zeng XY, Jiao YJ. Rapid detection of IgM antibodies against the SARS-CoV-2 virus via colloidal gold nanoparticle-based lateral-flow assay. ACS Omega. 2020;5(21):12550–12556. doi: 10.1021/acsomega.0c01554. [DOI] [PMC free article] [PubMed] [Google Scholar]
- 110.Li Z, et al. Development and clinical application of a rapid IgM-IgG combined antibody test for SARS-CoV-2 infection diagnosis. J Med Virol. 2020;92(9):1518–1524. doi: 10.1002/jmv.25727. [DOI] [PMC free article] [PubMed] [Google Scholar]
- 111.Pan Y, et al. Serological immunochromatographic approach in diagnosis with SARS-CoV-2 infected COVID-19 patients. J Infect. 2020;81(1):e28–e32. doi: 10.1016/j.jinf.2020.03.051. [DOI] [PMC free article] [PubMed] [Google Scholar]
- 112.Qiu G, et al. Dual-functional plasmonic photothermal biosensors for highly accurate severe acute respiratory syndrome coronavirus 2 detection. ACS Nano. 2020;14(5):5268–5277. doi: 10.1021/acsnano.0c02439. [DOI] [PubMed] [Google Scholar]
- 113.Seo G, et al. Rapid detection of COVID-19 causative virus (SARS-CoV-2) in human nasopharyngeal swab specimens using field-effect transistor-based biosensor. ACS Nano. 2020;14(4):5135–5142. doi: 10.1021/acsnano.0c02823. [DOI] [PubMed] [Google Scholar]
- 114.Zhao Z, Cui H, Song W, Ru X, Zhou W, Yu X. A simple magnetic nanoparticles-based viral RNA extraction method for efficient detection of SARS-CoV-2. bioRxiv. 2020 doi: 10.1101/2020.02.22.961268. [DOI] [PMC free article] [PubMed] [Google Scholar]
- 115.Somvanshi SB, Kharat PB, Saraf TS, Somwanshi SB, Shejul SB, Jadhav KM. Multifunctional nano-magnetic particles assisted viral RNA-extraction protocol for potential detection of COVID-19. Mater Res Innov. 2020;25(3):1–6. doi: 10.1080/14328917.2020.1769350. [DOI] [Google Scholar]
- 116.Ahmed SR, Kang SW, Oh S, Lee J, Neethirajan S. Chiral zirconium quantum dots: a new class of nanocrystals for optical detection of coronavirus. Heliyon. 2018;4(8):e00766. doi: 10.1016/j.heliyon.2018.e00766. [DOI] [PMC free article] [PubMed] [Google Scholar]
- 117.Chen Z, et al. Rapid and sensitive detection of anti-SARS-CoV-2 IgG, using lanthanide-doped nanoparticles-based lateral flow immunoassay. Anal Chem. 2020;92(10):7226–7231. doi: 10.1021/acs.analchem.0c00784. [DOI] [PubMed] [Google Scholar]
- 118.Karash S, Wang R, Kelso L, Lu H, Huang TJ, Li Y. Rapid detection of avian influenza virus H5N1 in chicken tracheal samples using an impedance aptasensor with gold nanoparticles for signal amplification. J Virol Methods. 2016;236:147–156. doi: 10.1016/j.jviromet.2016.07.018. [DOI] [PubMed] [Google Scholar]
- 119.Wu Z, et al. Digital single virus electrochemical enzyme-linked immunoassay for ultrasensitive H7n9 avian influenza virus counting. Anal Chem. 2018;90(3):1683–1690. doi: 10.1021/acs.analchem.7b03281. [DOI] [PubMed] [Google Scholar]
- 120.Takemura K, et al. Versatility of a localized surface plasmon resonance-based gold nanoparticle-alloyed quantum dot nanobiosensor for immunofluorescence detection of viruses. Biosens Bioelectron. 2017;89:998–1005. doi: 10.1016/j.bios.2016.10.045. [DOI] [PubMed] [Google Scholar]
- 121.Fu Y, et al. Chemiresistive biosensors based on carbon nanotubes for label-free detection of DNA sequences derived from avian influenza virus H5N1. Sens Actuators B Chem. 2017;249:691–699. doi: 10.1016/j.snb.2017.04.080. [DOI] [Google Scholar]
- 122.Tran TL, Nguyen TT, Huyen Tran TT, Chu VT, Thinh Tran Q, Tuan Mai A. Detection of influenza A virus using carbon nanotubes field effect transistor based DNA sensor. Phys E Low-Dimensional Syst Nanostruct. 2017;93(1):83–86. doi: 10.1016/j.physe.2017.05.019. [DOI] [Google Scholar]
- 123.Devarakonda S, Singh R, Bhardwaj J, Jang J. Cost-effective and handmade paper-based immunosensing device for electrochemical detection of influenza virus. Sensors. 2017 doi: 10.3390/s17112597. [DOI] [PMC free article] [PubMed] [Google Scholar]
- 124.Veerapandian M, Hunter R, Neethirajan S. Dual immunosensor based on methylene blue-electroadsorbed graphene oxide for rapid detection of the influenza A virus antigen. Talanta. 2016;155:250–257. doi: 10.1016/j.talanta.2016.04.047. [DOI] [PubMed] [Google Scholar]
- 125.Kinnamon DS, Krishnan S, Brosler S, Sun E, Prasad S. Screen printed graphene oxide textile biosensor for applications in inexpensive and wearable point-of-exposure detection of influenza for at-risk populations. J Electrochem Soc. 2018;165(8):B3084–B3090. doi: 10.1149/2.0131808jes. [DOI] [Google Scholar]
- 126.Ahmed SR, Kim J, Suzuki T, Lee J, Park EY. Enhanced catalytic activity of gold nanoparticle-carbon nanotube hybrids for influenza virus detection. Biosens Bioelectron. 2016;85:503–508. doi: 10.1016/j.bios.2016.05.050. [DOI] [PubMed] [Google Scholar]
- 127.Huang J, et al. Silver nanoparticles coated graphene electrochemical sensor for the ultrasensitive analysis of avian influenza virus H7. Anal Chim Acta. 2016;913:121–127. doi: 10.1016/j.aca.2016.01.050. [DOI] [PubMed] [Google Scholar]
- 128.Lee J, et al. A plasmon-assisted fluoro-immunoassay using gold nanoparticle-decorated carbon nanotubes for monitoring the influenza virus. Biosens Bioelectron. 2015;64:311–317. doi: 10.1016/j.bios.2014.09.021. [DOI] [PubMed] [Google Scholar]
- 129.Zhan L, Zhen SJ, Wan XY, Gao PF, Huang CZ. A sensitive surface-enhanced Raman scattering enzyme-catalyzed immunoassay of respiratory syncytial virus. Talanta. 2016;148:308–312. doi: 10.1016/j.talanta.2015.10.081. [DOI] [PubMed] [Google Scholar]
- 130.Zhan L, Li CM, Wu WB, Huang CZ. A colorimetric immunoassay for respiratory syncytial virus detection based on gold nanoparticles-graphene oxide hybrids with mercury-enhanced peroxidase-like activity. Chem Commun. 2014;50(78):11526–11528. doi: 10.1039/c4cc05155f. [DOI] [PubMed] [Google Scholar]
- 131.Press D. Diagnosis of rubella virus using antigen- conjugated Au @ Pt nanorods as nanozyme probe. Int J Nanomedicine. 2018;13:4795–4805. doi: 10.2147/IJN.S171429. [DOI] [PMC free article] [PubMed] [Google Scholar]
- 132.Li X, et al. Plasmonic gold chips for the diagnosis of Toxoplasma gondii, CMV, and rubella infections using saliva with serum detection precision. Eur J Clin Microbiol Infect Dis. 2019;38(5):883–890. doi: 10.1007/s10096-019-03487-1. [DOI] [PubMed] [Google Scholar]
- 133.Li X, et al. Gold magnetic nanoparticle conjugate-based lateral flow assay for the detection of IgM class antibodies related to TORCH infections. Int J Mol Med. 2015;36(5):1319–1326. doi: 10.3892/ijmm.2015.2333. [DOI] [PubMed] [Google Scholar]
- 134.Yang H, et al. A quick and parallel analytical method based on quantum dots labeling for ToRCH-related antibodies. Nanoscale Res Lett. 2009;4(12):1469–1474. doi: 10.1007/s11671-009-9422-7. [DOI] [PMC free article] [PubMed] [Google Scholar]
- 135.Perumal V, et al. Gold nanorod embedded novel 3D graphene nanocomposite for selective bio-capture in rapid detection of Mycobacterium tuberculosis. Biosens Bioelectron. 2018;116:116–122. doi: 10.1016/j.bios.2018.05.042. [DOI] [PubMed] [Google Scholar]
- 136.Mansour A, Tammam S, Althani A, Azzazy HME. A single tube system for the detection of Mycobacterium tuberculosis DNA using gold nanoparticles based FRET assay. J Microbiol Methods. 2017;139:165–167. doi: 10.1016/j.mimet.2017.06.001. [DOI] [PubMed] [Google Scholar]
- 137.Tsai TT, et al. Diagnosis of tuberculosis using colorimetric gold nanoparticles on a paper-based analytical device. ACS Sensors. 2017;2(9):1345–1354. doi: 10.1021/acssensors.7b00450. [DOI] [PubMed] [Google Scholar]
- 138.Bai L, et al. Ultrasensitive electrochemical detection of Mycobacterium tuberculosis IS6110 fragment using gold nanoparticles decorated fullerene nanoparticles / nitrogen-doped graphene nanosheet as signal tags. Anal Chim Acta. 2019;1080:75–83. doi: 10.1016/j.aca.2019.06.043. [DOI] [PubMed] [Google Scholar]
- 139.Thakur H, Kaur N, Sareen D, Prabhakar N. Electrochemical determination of M. tuberculosis antigen based on Poly (3,4-ethylenedioxythiophene) and functionalized carbon nanotubes hybrid platform. Talanta. 2017;171:115–123. doi: 10.1016/j.talanta.2017.04.063. [DOI] [PubMed] [Google Scholar]
- 140.Adhi B, Alom A, Khari M. Graphene-based portable SPR sensor for the detection of Mycobacterium tuberculosis DNA strain. Procedia Eng. 2016;168:541–545. doi: 10.1016/j.proeng.2016.11.520. [DOI] [Google Scholar]
- 141.Hazani M, Zaid M, Abdullah J, Azah N, Sulaiman Y. PNA biosensor based on reduced graphene oxide/water soluble quantum dots for the detection of Mycobacterium tuberculosis. Sens Actuators B Chem. 2017;241:1024–1034. doi: 10.1016/j.snb.2016.10.045. [DOI] [Google Scholar]
- 142.Ju E, et al. An easy and sensitive sandwich assay for detection of Mycobacterium tuberculosis Ag85B antigen using quantum dots and gold nanorods. Biosens Bioelectron. 2017;87:150–156. doi: 10.1016/j.bios.2016.08.034. [DOI] [PubMed] [Google Scholar]
- 143.Zhou B, Zhu M, Hao Y, Yang P. Potential-resolved electrochemiluminescence for simultaneous determination of triple latent tuberculosis infection markers. ACS Appl Mater Interfaces. 2017;9:30536–30542. doi: 10.1021/acsami.7b10343. [DOI] [PubMed] [Google Scholar]
- 144.Pyo H, Lee CY, Kim D, Kim G, Lee S. Electrical detection of pneumococcus through the nanoparticle decoration method. Sensors. 2017;17(9):1–8. doi: 10.3390/s17092012. [DOI] [PMC free article] [PubMed] [Google Scholar]
- 145.Skowicki M, Lipi T, Kowalczyk A, Prorok K. Biofunctionalized upconverting CaF 2: Yb, Tm nanoparticles for Candida albicans detection and imaging. Nano Res. 2017;10(10):3333–3345. doi: 10.1007/s12274-017-1546-y. [DOI] [Google Scholar]
- 146.Bhatnagar I, Mahato K, Kiran K, Ealla R, Asthana A, Chandra P. International Journal of Biological Macromolecules Chitosan stabilized gold nanoparticle mediated self-assembled gliP nanobiosensor for diagnosis of Invasive Aspergillosis. Int J Biol Macromol. 2018;110:449–456. doi: 10.1016/j.ijbiomac.2017.12.084. [DOI] [PubMed] [Google Scholar]
- 147.Jin JH, et al. Real-time selective monitoring of allergenic Aspergillus molds using pentameric antibody-immobilized single-walled carbon nanotube-field effect transistors. RSC Adv. 2015;5(20):15728–15735. doi: 10.1039/c4ra15815f. [DOI] [Google Scholar]
- 148.Pulivendala G, Bale S, Godugu C. Inhalation of sustained release microparticles for the targeted treatment of respiratory diseases. Drug Deliv Transl Res. 2020;10(2):339–353. doi: 10.1007/s13346-019-00690-7. [DOI] [PubMed] [Google Scholar]
- 149.Genta I, Costantini M, Asti A, Conti B, Montanari L. Influence of glutaraldehyde on drug release and mucoadhesive properties of chitosan microspheres. Carbohydr Polym. 1998;36(2–3):81–88. doi: 10.1016/S0144-8617(98)00022-8. [DOI] [Google Scholar]
- 150.Wheatley MA, Chang M, Park E, Langer R. Coated alginate microspheres: factors influencing the controlled delivery of macromolecules. J Appl Polym Sci. 1991;43(11):2123–2135. doi: 10.1002/app.1991.070431120. [DOI] [Google Scholar]
- 151.Jansson PE, Lindberg B, Sandford PA. Structural studies of gellan gum, an extracellular polysaccharide elaborated by Pseudomonas elodea. Carbohydr Res. 1983;124(1):135–139. doi: 10.1016/0008-6215(83)88361-X. [DOI] [Google Scholar]
- 152.Albertsson AC, Carlfors J, Sturesson C. Preparation and characterisation of poly (adipic anhydride) microspheres for ocular drug delivery. J Appl Polym Sci. 1996;62(4):695–705. doi: 10.1002/(SICI)1097-4628(19961024)62:4<695::AID-APP13>3.0.CO;2-V. [DOI] [Google Scholar]
- 153.Menei P, Benoit JP, Boisdron-Celle M, Fournier D, Mercier P, Guy G. Drug targeting into the central nervous system by stereotactic implantation of biodegradable microspheres. Neurosurgery. 1994;34(6):1058–1064. doi: 10.1227/00006123-199406000-00016. [DOI] [PubMed] [Google Scholar]
- 154.Kidchob T, Kimura S, Imanishi Y. pH-responsive release from polypeptide microcapsules. J Appl Polym Sci. 1997;63(4):453–458. doi: 10.1002/(sici)1097-4628(19970124)63:4<453::aid-app6>3.0.co;2-q. [DOI] [Google Scholar]
- 155.Katti D, Krishnamurti N. Preparation of albumin microspheres by an improved process. J Microencapsul. 1999;16(2):231–242. doi: 10.1080/026520499289202. [DOI] [PubMed] [Google Scholar]
- 156.Byrd KE, Sukay MJ, Dieterle MW, Yang L, Marting TC, Teomim D, Domb AJ. Craniofacial and TMJ effects after glutamate and TRH microsphere implantation in proximity to trigeminal motoneurons of growing rats. J Dent Res. 1997;76(8):1437–1452. doi: 10.1177/00220345970760080601. [DOI] [PubMed] [Google Scholar]
- 157.Boedeker BH, Lojeski EW, Kline MD, Haynes DH. Ultra-long-duration local anesthesia produced by injection of lecithin-coated tetracaine microcrystals. J Clin Pharmacol. 1994;34(6):699–702. doi: 10.1002/j.1552-4604.1994.tb02026.x. [DOI] [PubMed] [Google Scholar]
- 158.Albertsson A, Löfgren A, Sturesson C, Sjöling M. Design of new building blocks in resorbable polymers application in drug delivery microspheres. Polymeric Drugs Drug Administ. 1994;2:172–180. doi: 10.1021/bk-1994-0545.ch014. [DOI] [Google Scholar]
- 159.Li X, et al. Effect of self-assembly on fluorescence in magnetic multiphase flows and its application on the novel detection for COVID-19. Phys Fluids. 2021;33(4):1. doi: 10.1063/5.0048123. [DOI] [PMC free article] [PubMed] [Google Scholar]
- 160.Yamada M. Extracellular vesicles: their emerging roles in the pathogenesis of respiratory diseases. Respir Investig. 2021;59(3):302–311. doi: 10.1016/j.resinv.2021.02.006. [DOI] [PubMed] [Google Scholar]
- 161.Mohit E, Rostami Z, Vahidi H. A comparative review of immunoassays for COVID-19 detection. Expert Rev Clin Immunol. 2021 doi: 10.1080/1744666x.2021.1908886. [DOI] [PubMed] [Google Scholar]
- 162.Liu W, et al. Clinical application of chemiluminescence microparticle immunoassay for SARS-CoV-2 infection diagnosis. J Clin Virol. 2020;130:1–5. doi: 10.1016/j.jcv.2020.104576. [DOI] [PMC free article] [PubMed] [Google Scholar]
- 163.Chen C, Zou Z, Chen L, Ji X, He Z. Functionalized magnetic microparticle-based colorimetric platform for influenza A virus detection. Nanotechnology. 2016 doi: 10.1088/0957-4484/27/43/435102. [DOI] [PMC free article] [PubMed] [Google Scholar]
- 164.Koskinen JO, Vainionpää R, Meltola NJ, Soukka J, Hänninen PE, Soini AE. Rapid method for detection of influenza A and B virus antigens by use of a two-photon excitation assay technique and dry-chemistry reagents. J Clin Microbiol. 2007;45(11):3581–3588. doi: 10.1128/JCM.00128-07. [DOI] [PMC free article] [PubMed] [Google Scholar]
- 165.Cools F, Delputte P, Cos P. The search for novel treatment strategies for Streptococcus pneumoniae infections. FEMS Microbiol Rev. 2021 doi: 10.1093/femsre/fuaa072. [DOI] [PMC free article] [PubMed] [Google Scholar]
- 166.Kim K, Jung HS, Song JY, Lee MR, Kim KS, Suh KY. Rapid detection of Mycoplasma pneumonia in a microfluidic device using immunoagglutination assay and static light scattering. Electrophoresis. 2009;30(18):3206–3211. doi: 10.1002/elps.200900136. [DOI] [PubMed] [Google Scholar]
- 167.Boukli N, et al. High incidence of false-positive results in patients with acute infections other than COVID-19 by the liaison SARSCoV-2 commercial chemiluminescent microparticle immunoassay for detection of IgG Anti-SARS-CoV-2 antibodies. J Clin Microbiol. 2020;58(11):19–21. doi: 10.1128/JCM.01352-20. [DOI] [PMC free article] [PubMed] [Google Scholar]
- 168.Azzazy HME, Mansour MMH. In vitro diagnostic prospects of nanoparticles. Clin Chim Acta. 2009;403(1–2):1–8. doi: 10.1016/j.cca.2009.01.016. [DOI] [PubMed] [Google Scholar]
- 169.Mishra MK, Dubey V, Mishra PM, Khan I. MEMS technology: a review. J Eng Res Reports. 2019;4(1):1–24. doi: 10.9734/jerr/2019/v4i116891. [DOI] [Google Scholar]
- 170.Judy JW. Microelectromechanical systems (MEMS): Fabrication, design and applications. Smart Mater Struct. 2001;10(6):1115–1134. doi: 10.1088/0964-1726/10/6/301. [DOI] [Google Scholar]
- 171.Li L, Wang C, Nie Y, Yao B, Hu H. Nanofabrication enabled lab-on-a-chip technology for the manipulation and detection of bacteria. TrAC Trends Anal Chem. 2020;127:115905. doi: 10.1016/j.trac.2020.115905. [DOI] [Google Scholar]
- 172.Li M, Chen L, Chou SY. Direct three-dimensional patterning using nanoimprint lithography. Appl Phys Lett. 2001;78(21):3322–3324. doi: 10.1063/1.1375006. [DOI] [Google Scholar]
- 173.Mijatovic D, Eijkel JCT, Van Den Berg A. Technologies for nanofluidic systems: top-down vs. bottom-up—A review. Lab Chip. 2005;5(5):492–500. doi: 10.1039/b416951d. [DOI] [PubMed] [Google Scholar]
- 174.Cui Z, Gu C. Nanofabrication challenges for NEMS. In: Proc. 1st IEEE Int. Conf. Nano Micro Eng. Mol. Syst. 1st IEEE-NEMS, pp. 607–610, 2006, 10.1109/NEMS.2006.334855.
- 175.Kumar V, et al. Nanostructured aptamer-functionalized black phosphorus sensing platform for label-free detection of myoglobin, a cardiovascular disease biomarker. ACS Appl Mater Interfaces. 2016;8(35):22860–22868. doi: 10.1021/acsami.6b06488. [DOI] [PubMed] [Google Scholar]
- 176.Choi JR. Development of point-of-care biosensors for COVID-19. Front Chem. 2020 doi: 10.3389/fchem.2020.00517. [DOI] [PMC free article] [PubMed] [Google Scholar]
- 177.Huang L, et al. One-step rapid quantification of SARS-CoV-2 virus particles via low-cost nanoplasmonic sensors in generic microplate reader and point-of-care device. Biosens Bioelectron. 2021;171:112685. doi: 10.1016/j.bios.2020.112685. [DOI] [PMC free article] [PubMed] [Google Scholar]
- 178.Lee H, Sun E, Ham D, Weissleder R. Chip-NMR biosensor for detection and molecular analysis of cells. Nat Med. 2008;14(8):869–874. doi: 10.1038/nm.1711. [DOI] [PMC free article] [PubMed] [Google Scholar]
- 179.Woo A, Jung HS, Kim DH, Park SG, Lee MY. Rapid and sensitive multiplex molecular diagnosis of respiratory pathogens using plasmonic isothermal RPA array chip. Biosens Bioelectron. 2021;182:113167. doi: 10.1016/j.bios.2021.113167. [DOI] [PubMed] [Google Scholar]
- 180.Lee HG, et al. PCR-coupled paper-based surface-enhanced raman scattering (SERS) sensor for rapid and sensitive detection of respiratory bacterial DNA. Sens Actuators B Chem. 2021;326:128802. doi: 10.1016/j.snb.2020.128802. [DOI] [Google Scholar]
- 181.Dittrich PS, Manz A. Lab-on-a-chip: microfluidics in drug discovery. Nat Rev Drug Discov. 2006;5(3):210–218. doi: 10.1038/nrd1985. [DOI] [PubMed] [Google Scholar]
- 182.Gorjikhah F, et al. Improving ‘lab-on-a-chip’ techniques using biomedical nanotechnology: a review. Artif Cells, Nanomed Biotechnol. 2016;44(7):1609–1614. doi: 10.3109/21691401.2015.1129619. [DOI] [PubMed] [Google Scholar]
- 183.Yi C, Li CW, Ji S, Yang M. Microfluidics technology for manipulation and analysis of biological cells. Anal Chim Acta. 2006;560(1–2):1–23. doi: 10.1016/j.aca.2005.12.037. [DOI] [PubMed] [Google Scholar]
- 184.Zhu H, Fohlerová Z, Pekárek J, Basova E, Neužil P. Recent advances in lab-on-a-chip technologies for viral diagnosis. Biosens Bioelectron. 2019;153:2020. doi: 10.1016/j.bios.2020.112041. [DOI] [PMC free article] [PubMed] [Google Scholar]
- 185.Zhang G, Zheng G, Zhang Y, Ma R, Kang X. Evaluation of a micro/nanofluidic chip platform for the high-throughput detection of bacteria and their antibiotic resistance genes in post-neurosurgical meningitis. Int J Infect Dis. 2018;70:115–120. doi: 10.1016/j.ijid.2018.03.012. [DOI] [PubMed] [Google Scholar]
- 186.Tarim EA, et al. Microfluidic-based virus detection methods for respiratory diseases. Emergent Mater. 2021;4(1):143–168. doi: 10.1007/s42247-021-00169-7. [DOI] [PMC free article] [PubMed] [Google Scholar]
- 187.Wu J, Dong M, Santos S, Rigatto C, Liu Y, Lin F. Lab-on-a-chip platforms for detection of cardiovascular disease and cancer biomarkers. Sensors. 2017;17:12. doi: 10.3390/s17122934. [DOI] [PMC free article] [PubMed] [Google Scholar]
- 188.Peter Gravesen OSJ. Microfluidics-a review. J Micromech Microeng. 1993;3(4):168–182. doi: 10.1088/0960-1317/3/4/002. [DOI] [Google Scholar]
- 189.Zhou X, et al. Determination of SARS-coronavirus by a microfluidic chip system. Electrophoresis. 2004;25(17):3032–3039. doi: 10.1002/elps.200305966. [DOI] [PMC free article] [PubMed] [Google Scholar]
- 190.Yu X, et al. A nanostructured microfluidic immunoassay platform for highly sensitive infectious pathogen detection. Small. 2017;13(24):1–12. doi: 10.1002/smll.201700425. [DOI] [PMC free article] [PubMed] [Google Scholar]
- 191.Jia R, et al. Novel application of nanofluidic chip digital PCR for detection of African swine fever virus. Front Vet Sci. 2021 doi: 10.3389/fvets.2020.621840. [DOI] [PMC free article] [PubMed] [Google Scholar]
- 192.Singh R, Hong S, Jang J. Label-free detection of influenza viruses using a reduced graphene oxide-based electrochemical immunosensor integrated with a microfluidic platform. Sci Rep. 2017 doi: 10.1038/srep42771. [DOI] [PMC free article] [PubMed] [Google Scholar]
- 193.Cao Q, et al. Microfluidic chip for molecular amplification of influenza a RNA in human respiratory specimens. PLoS ONE. 2012;7(3):1–11. doi: 10.1371/journal.pone.0033176. [DOI] [PMC free article] [PubMed] [Google Scholar]
- 194.Xie X, et al. Microfluidic nano-scale qPCR enables ultra-sensitive and quantitative detection of SARS-CoV-2. Processes. 2020;8(11):1425. doi: 10.3390/pr8111425. [DOI] [Google Scholar]
- 195.Rodriguez-Moncayo R, et al. A high-throughput multiplexed microfluidic device for COVID-19 serology assays. Lab Chip. 2021;21(1):93–104. doi: 10.1039/d0lc01068e. [DOI] [PubMed] [Google Scholar]
- 196.Huang E, Wang Y, Yang N, Shu B, Zhang G, Liu D. A fully automated microfluidic PCR-array system for rapid detection of multiple respiratory tract infection pathogens. Anal Bioanal Chem. 2021;413(7):1787–1798. doi: 10.1007/s00216-021-03171-4. [DOI] [PMC free article] [PubMed] [Google Scholar]
- 197.Antiochia R. Nanobiosensors as new diagnostic tools for SARS, MERS and COVID-19: from past to perspectives. Microchim Acta. 2020 doi: 10.1007/s00604-020-04615-x. [DOI] [PMC free article] [PubMed] [Google Scholar]