

Abstract
Aims: Culprit-plaque morphology [plaque rupture (PR) and plaque erosion (PE)] and high-risk plaques (HRP) identified by optical coherence tomography (OCT) and residual SYNTAX score (rSS) have been reported to influence clinical outcomes. Thus, in this study, we aimed to investigate the prognostic implication of culprit-plaque morphology and rSS for major adverse cardiovascular events (MACE) in patients with ST-segment elevation myocardial infarction (STEMI).
Methods: Based on plaque morphology and rSS, 274 STEMI patients were divided into 4 groups: PE/low-rSS (n=61), PE/high-rSS (n=58), PR/low-rSS (n=55), and PR/high-rSS (n=100). According to HRP and rSS, patients were stratified to non-HRP/low-rSS (n=97), non-HRP/high-rSS (n=109), HRP/low-rSS (n=19), and HRP/high-rSS (n=49). MACE was defined as the composite of all-cause death, recurrence of myocardial infarction, stroke, and unplanned revascularization of any coronary artery.
Results: During the follow-up of 2.2 years, 47 (17.2%) MACE were observed. Patients with PR/high-rSS and HRP/high-rSS presented lower survival probability on revascularization and MACE. In fully adjusted analyses, PR/high-rSS group presented higher MACE risk than PE/low-rSS (HR: 4.80, 95% CI: 1.43–16.11,P=0.025). Patients with non-HRP/high-rSS (HR: 2.90, 95% CI: 1.01–8.38,P=0.049) and HRP/high-rSS (HR: 8.67, 95% CI: 2.67–28.21,P<0.001) presented higher risk of cardiac events than non-HRP/low-rSS. Adding rSS and HRP to the risk prediction model increased the C-statistic to 0.797 (95% CI: 0.737–0.857), with ΔC-statistic of 0.066 (P=0.002) and the NRI (46.0%, 95% CI: 20.5–56.8%,P<0.001) and IDI (8.7%, 95% CI: 3.6–18.2%,P<0.001).
Conclusion: High-risk plaques in combination with rSS enhanced the predictive ability for MACE, indicating culprit-plaque features and residual atherosclerosis burden should be taken into account in risk stratification of STEMI patients.
Keywords: Plaque rupture, Residual SYNTAX score, Cardiovascular risk, ST-segment elevation myocardial infarction
Introduction
Plaque rupture (PR) and plaque erosion (PE) have been determined to be responsible for the majority of acute coronary events 1) . Previous studies reported culprit-plaque morphology identified by optical coherence tomography (OCT) influenced clinical outcomes in patients with acute myocardial infarction (AMI) 2) . In addition, the CLIMA study demonstrated that OCT-defined high-risk plaques (HRP) and simultaneous presence of the following four features, i.e., minimum lumen area (MLA) <3.5 mm2, fibrous cap thickness (FCT) <75 µm, lipid plaque with lipid arc circumferential extension >180°, and presence of macrophages, were associated with a higher risk of major coronary events 3) . Moreover, the residual Synergy Between Percutaneous Coronary Intervention with Taxus and Cardiac Surgery (SYNTAX) score (rSS) was quantitatively recalculated after revascularization to assess angiographic completeness of revascularization and residual atherosclerosis burden, which has been proved to be a predictor of cardiovascular events after percutaneous coronary intervention (PCI) 4 - 6) .
It is well known that both rSS and high-risk plaques are associated with clinical outcomes as individual parameters. Nevertheless, their combined effect on prognostic implications has not been well defined. Thus, in this study, we investigated the prognostic implication of culprit-plaque morphology and rSS for major adverse cardiovascular events (MACE) in patients with ST-segment elevation myocardial infarction (STEMI).
Methods
Study Design and Population
The study population was derived from the Optical Coherence Tomography Examination in Acute Myocardial Infarction (OCTAMI) registry (ClinicalTrials.gov: NCT03593928) from March 2017 to March 2019. The main inclusion criteria were as follows: ≥ 18 years, STEMI, and PCI and preprocedural OCT examination on culprit lesion. Meanwhile, the main exclusion criteria were as follows: cardiogenic shock, serious liver dysfunction, end-stage renal disease, left main coronary artery disease, extremely tortuous or heavily calcified vessels, and contraindication to aspirin or ticagrelor. STEMI was diagnosed as continuous chest pain lasting for >30 min, elevated biomarker level, and an electrocardiogram manifestation of ST-segment elevation >0.1 mV in at least two contiguous leads or a new left bundle-branch block 7) . The flowchart is shown in Fig.1 . For this analysis, 274 patients were consecutively enrolled and divided into 4 groups based on plaque morphology and rSS: PE/low-rSS (n=61), PE/high-rSS (n=58), PR/low-rSS (n=55), and PR/high-rSS (n=100). Furthermore, according to the presence of OCT-defined HRP and rSS, patients were stratified to four groups: non-HRP/low-rSS (n=97), non-HRP/high-rSS (n=109), HRP/low-rSS (n=19), and HRP/high-rSS (n=49). The registry complied with the principles of the Declaration of Helsinki and was approved (No. 2017-866) by the institutional review board.
Fig.1. Study flowchart.

Abbreviations: STEMI, ST-segment elevation myocardial infarction; OCT, optical coherence tomography; rSS, residual SYNTAX score, PE, plaque erosion; PR, plaque rupture; HRP, high-risk plaque.
Residual SYNTAX Score
Each lesion with a diameter stenosis ≥ 50% of vessels ≥ 1.5 mm in diameter was scored using the SYNTAX algorithm 8) . Two experienced interventional cardiologists blinded to OCT images and clinical outcomes calculated the SYNTAX score separately using the SYNTAX score calculator (www.syntaxscore.com/), and disagreements were resolved through a consensus. The rSS was determined as the SS remaining after the completion of the planned PCI, that is, if a patient underwent more than one PCI procedure because of scheduled interventional strategy, the rSS was calculated after the final procedure. The definition of complete revascularization adopt from anatomical criteria, which is defined as the treatment of all vessels ≥ 1.5 mm in diameter with ≥ 50% stenosis 9) .
Acquisition and Analysis of OCT Images
The OCT procedures and analysis have been described in detail previously 10 , 11) . The infarct-related artery was identified by at least two well-trained cardiologists according to angiographic results, electrocardiogram manifestation, and regional wall motion abnormalities observed in the echocardiogram. Thrombus aspiration and/or gentle pre-dilatation were used to reduce the thrombus burden and restore antegrade coronary flow. OCT images of the culprit were acquired immediately after flow restoration using the frequency-domain ILUMIEN OPTIS OCT system and a dragonfly catheter (St. Jude Medical, Westford, MA, USA).
All OCT images were analyzed and scrutinized on a St. Jude OCT Offline Review Workstation by three independent investigators. Definitions of OCT characteristics were based mainly on established consensus 12) , and detailed definitions for culprit-plaque characteristics were included in Supplementary Appendix and Supplementary Fig.1 . OCT-defined high-risk plaques 3) were defined as simultaneously present of the following four criteria: MLA <3.5mm2, FCT <75µm, lipid plaque with lipid arc extension >180°, and presence of macrophages clusters. The number of HRP criteria was defined as the number of HRP criteria that a patient meets; briefly, if patients simultaneously meet the four criteria, they would be defined as presence of high-risk plaques, and the number of HRP criteria was 4.
Supplementary Fig.1. Representative cross-sectional optical coherence tomography images.

a Fibrous plaque identified as a homogeneous, highly backscattering region (asterisk). b Lipid-rich plaque identified as a low-signal region with a diffuse border (asterisk) and thin-cap fibroatheroma with fibrous-cap thickness of 50 µm. c Plaque rupture identified by the discontinuous fibrous cap (arrow) and cavity formation (asterisk). d Plaque erosion identified by the presence of attached thrombus (arrow) overlying an intact plaque. e Calcification identified by the presence of a well-delineated, low-backscattering heterogeneous region (asterisk). f Micro-vessels recognized as low-signal, sharply delineated, tubule luminal structures (arrow). g Cholesterol crystal (arrow) identified by linear, highly backscattering structures without remarkable backward shadowing. h Macrophage infiltration (arrow) defined as a signal-rich, highly reflective, punctate region with backward shadowing. (Adapted from reference 11) with permission).
MACE and Follow-up
The endpoint was MACE, of which all-cause death, recurrence of myocardial infarction, stroke, and unplanned revascularization of any coronary artery were included. Outcome data was collected by outpatient visits or telephone interviews as patients were routinely followed up at 1, 6, and 12 months after discharge. For those who survived more than a year, the subsequent follow-up would be made annually.
Statistical Analysis
Continuous variables are reported as mean±standard deviation (SD) or median (interquartile ranges) and categorical variables were presented as number (percentage). One-way analysis of variance or Kruskal–Wallis tests were used for comparison of continuous variables. Categorical variables were compared using Pearson chi-square tests or Fisher’s exact test when appropriate. Patients were dichotomized based on a cutoff rSS value which is determined via Youden index, that is, patients with rSS ≥ 3 were identified in the high-rSS group and rSS< 3 were in the low-rSS group. Survival curves were constructed using Kaplan–Meier method and compared via log-rank test. Univariate and multivariable cox proportional hazards regression model was used to assess the MACE risk of the four groups, and hazard ratio (HR) and 95% confidence interval (CI) were showed. Time-dependent receiver operating characteristic (ROC) curves were used to estimate the prognostic value of different models: model 1, traditional risk factors; model 2, model 1 plus presence of OCT-defined high-risk plaque; and model 3, model 2 plus rSS, and the area under the ROC curve (AUC) was presented.
Using net reclassification improvement (NRI) and integrated discrimination improvement (IDI), we have also calculated the ability of the new models to reclassify the risk of cardiovascular events in contrast to traditional risk factors. Analyses were conducted using IBM SPSS Statistics version 26.0 (IBM SPSS Statistics, IBM Corporation, Armonk, New York) and R (http://www.r-project.org/) statistical packages. A p-value <0.05 was considered statistically significant.
Results
Baseline Characteristics and OCT Findings Based on Plaque Morphology and rSS
Table 1 presents the baseline clinical features, angiographic characteristics, and OCT findings compared between four groups based on plaque morphology and rSS. Among the 274 enrolled participants, the mean age was 57.6±11.8 years, and 80.7% were males; a history of dyslipidemia (86.1%) was most prevalent among risk factors of atherosclerotic disease, followed by hypertension (59.9%) and diabetes mellitus (29.6%). Further, 72 (26.3%) patients were performed complete revascularization, and 43 (15.7%) received additional PCI for non-culprit vessels. Patients with PR had higher BMI (P=0.026 among four groups). Patients with high-rSS had higher SYNTAX score (P<0.001 among four groups) and prevalence of triple-vessel diseases (P<0.001 among groups) but lower prevalence of complete revascularization. Moreover, a difference was noted in the distribution of culprit vessels among the four groups (P<0.001).
Table 1. Baseline characteristics and OCT findings based on plaque morphology and rSS.
| Variables | PE/low-rSS (n = 61) | PE/high-rSS (n = 58) | PR/low-rSS (n = 55) | PR/high-rSS (n = 100) | P value |
|---|---|---|---|---|---|
| Clinical information | |||||
| Age, years | 54.8±11.8 | 57.6±11.4 | 58.1±12.9 | 59.0±11.2 | 0.179 |
| Male | 52 (85.2) | 41 (70.7) | 45 (81.8) | 83 (83.0) | 0.178 |
| BMI, kg/m2 | 25.0±2.6 | 25.5±3.3 | 26.5±3.1 | 26.4±3.8 | 0.026 |
| Smoking | 46 (75.4) | 42 (72.4) | 41 (74.5) | 72 (72) | 0.962 |
| Hypertension | 30 (49.2) | 40 (69.0) | 33 (60.0) | 61 (61.0) | 0.175 |
| Dyslipidemia | 52 (85.2) | 47 (81.0) | 48 (87.3) | 89 (89.0) | 0.562 |
| DM | 12 (19.7) | 16 (27.6) | 14 (25.5) | 39 (39) | 0.053 |
| Prior PCI | 3 (4.9) | 3 (5.2) | 7 (12.7) | 9 (9.0) | 0.360 |
| LVEF, % | 54.0 (48.0-60.0) | 57.0 (53.0-60.0) | 55.0 (50.5-58.0) | 56.0 (52.0-59.0) | 0.171 |
| bSS | 12.0 (9.0-17.0) | 19.5 (15.0-25.9) | 11.0 (8.0-19.0) | 19.5 (14.0-25.2) | <0.001 |
| rSS | 0 (0-2.0) | 7.0 (5.0-11.0) | 0 (0-2.0) | 8.0 (5.0-12.2) | <0.001 |
| Killip classification | 0.800 | ||||
| I | 54 (88.5) | 53 (91.4) | 51 (92.7) | 90 (90) | |
| II | 6 (9.8) | 4 (6.9) | 4 (7.3) | 10 (10) | |
| III | 1 (1.6) | 1 (1.7) | 0 (0) | 0 (0) | |
| Laboratory tests | |||||
| Platelet, ×1000/µL | 242.0 (196.0-298.0) | 239.0 (202.2-282.5) | 210.0 (185.5-259.0) | 215.5 (189.2-270.2) | 0.052 |
| Glucose, mmol/L | 7.4 (6.5-9.3) | 7.5 (6.2-9.9) | 7.2 (6.2-8.7) | 8.4 (6.7-11.2) | 0.127 |
| Hs-CRP, mg/L | 4.4 (2.9-10.9) | 8.1 (4.0-10.8) | 5.9 (2.7-11.1) | 5.7 (2.1-10.8) | 0.341 |
| HbA1c, % | 5.8 (5.5-6.6) | 6.2 (5.7-6.9) | 5.9 (5.6-6.6) | 6.1 (5.6-7.7) | 0.169 |
| TC, mmol/L | 4.2 (3.6-4.9) | 4.5 (4.0-5.0) | 4.3 (3.7-5.0) | 4.3 (3.7-5.3) | 0.657 |
| TG, mmol/L | 1.4 (0.8-2.0) | 1.4 (1.0-2.0) | 1.4 (1.1-1.7) | 1.4 (1.0-2.3) | 0.717 |
| LDL-C, mmol/L | 2.5 (2.2-3.5) | 2.9 (2.4-3.3) | 2.8 (2.2-3.1) | 2.8 (2.1-3.4) | 0.662 |
| HDL-C, mmol/L | 1.1 (0.9-1.3) | 1.0 (1.0-1.2) | 1.1 (0.9-1.2) | 1.0 (0.9-1.2) | 0.434 |
| Lp(a), mg/L | 164.0 (64.0-375.0) | 202.0 (66.5-465.8) | 113.0 (66.5-250.5) | 159.1 (86.8-356.5) | 0.470 |
| Baseline troponin I, ng/ml | 1.6 (0.1-5.2) | 1.2 (0.2-5.1) | 0.3 (0.1-4.8) | 0.5 (0.1-4.4) | 0.228 |
| Peak troponin I, ng/ml | 27.1 (9.3-55.6) | 25.1 (12.4-44.9) | 20.9 (11.1-41.8) | 22.9 (8.6-41.2) | 0.533 |
| Discharge medications | |||||
| Aspirin, | 59 (96.7) | 57 (98.3) | 54 (98.2) | 95 (95.0) | 0.627 |
| P2Y12 inhibitor | 0.128 | ||||
| Ticagrelor | 26 (42.6) | 27 (46.6) | 35 (63.6) | 51 (51.0) | |
| Clopidogrel | 35 (57.4) | 31 (53.4) | 20 (36.4) | 49 (49.0) | |
| Statin | 61 (100.0) | 55 (94.8) | 52 (94.5) | 98 (98.0) | 0.220 |
| Dual anti-platelet therapy | 59 (96.7) | 57 (98.3) | 54 (98.2) | 95 (95.0) | 0.627 |
| Dual anti-platelet therapy duration, month | 12.0±2.9 | 12.6±3.1 | 12.0±1.9 | 12.4±4.3 | 0.737 |
| Procedural data | |||||
| Culprit vessel | <0.001 | ||||
| LAD | 40 (65.6) | 25 (43.1) | 28 (50.9) | 38 (38.0) | |
| LCX | 5 (8.2) | 12 (20.7) | 1 (1.8) | 9 (9.0) | |
| RCA | 16 (26.2) | 21 (36.2) | 26 (47.3) | 53 (53.0) | |
| No. of coronary artery narrowed | <0.001 | ||||
| 1 | 36 (59.0) | 3 (5.2) | 24 (43.6) | 3 (3.0) | |
| 2 | 18 (29.5) | 22 (37.9) | 25 (45.5) | 35 (35.0) | |
| 3 | 7 (11.5) | 33 (56.9) | 6 (10.9) | 62 (62.0) | |
| Additional PCI for non-culprit vessels | 8 (13.1) | 7 (12.1) | 10 (18.2) | 18 (18) | 0.673 |
| Complete revascularization | 40 (65.6) | 0 (0) | 32 (58.2) | 0 (0) | <0.001 |
| Pre-TIMI flow 0 | 37 (60.7) | 42 (72.4) | 39 (70.9) | 54 (54.0) | 0.064 |
| Balloon pre-dilation | 50 (82.0) | 49 (84.5) | 40 (72.7) | 78 (78.0) | 0.431 |
| Thrombus aspiration | 37 (60.7) | 36 (62.1) | 42 (76.4) | 66 (66.0) | 0.283 |
| Stent implantation | 57 (93.4) | 53 (91.4) | 53 (96.4) | 98 (98.0) | 0.242 |
| Post-TIMI flow 3 | 60 (98.4) | 58 (100.0) | 54 (98.2) | 99 (99.0) | 0.781 |
| OCT findings | |||||
| OCT-defined HRP | 4 (6.6) | 1 (1.7) | 15 (27.3) | 48 (48.0) | <0.001 |
| Numbers of HRP features | <0.001 | ||||
| ≤ 1 | 28 (45.9) | 32 (55.2) | 3 (5.5) | 9 (9.0) | |
| 2 | 21 (34.4) | 21 (36.2) | 17 (30.9) | 21 (21.0) | |
| 3 | 8 (13.1) | 4 (6.9) | 20 (36.4) | 22 (22.0) | |
| 4 | 4 (6.6) | 1 (1.7) | 15 (27.3) | 48 (48.0) | |
| Plaque type | <0.001 | ||||
| Lipid-rich plaque | 11 (18.0) | 9 (15.5) | 49 (89.1) | 91 (91.0) | |
| Fibrous plaque | 50 (82.0) | 49 (84.5) | 6 (10.9) | 9 (9.0) | |
| Calcification | 24 (39.3) | 27 (46.6) | 29 (52.7) | 60 (60.0) | 0.069 |
| Macrophage | 28 (45.9) | 18 (31.0) | 34 (61.8) | 69 (69.0) | <0.001 |
| Micro-vessels | 28 (45.9) | 18 (31.0) | 34 (61.8) | 69 (69.0) | 0.221 |
| Cholesterol crystal | 6 (9.8) | 4 (6.9) | 3 (5.5) | 9 (9.0) | 0.803 |
| Thrombus | 59 (96.7) | 57 (98.3) | 55 (100.0) | 100 (100.0) | 0.202 |
| Minimal FCT, µm | 157.7±100.3 | 164.5±100.2 | 93.6±72.1 | 86.3±45.7 | <0.001 |
| FCT<75µm | 11 (18.0) | 5 (8.6) | 23 (41.8) | 52 (52.0) | <0.001 |
| Maximal lipid arc, ° | 300.9±72.1 | 263.3±80.3 | 323.5±59.3 | 321.9±60.4 | <0.001 |
| MLA, mm2 | 1.7±0.8 | 1.7±0.5 | 2.1±0.7 | 2.0±0.7 | <0.001 |
| MLA<3.5 mm2 | 56 (91.8) | 58 (100.0) | 51 (92.7) | 97 (97.0) | 0.096 |
Continuous data are presented as mean±standard deviation or median (interquartile ranges). Categorical data are presented as number (%). OCT, optical coherence tomography; PE, plaque erosion; PR, plaque rupture; rSS, residual SYNTAX score; BMI, body mass index; DM, diabetes mellitus; PCI, percutaneous coronary intervention; LVEF, left ventricular ejection fraction; bSS, baseline SYNTAX score; Hs-CRP, high-sensitivity C-reactive protein; HbA1c, Glycated hemoglobin A1c; TC, total cholesterol; TG, triglyceride; LDL-C, low-density-lipoprotein cholesterol; HDL-C, high-density lipoprotein-cholesterol; Lp(a), lipoprotein(a); LAD, left anterior descending; LCX, left circumflex artery; RCA, right coronary artery; TIMI, Thrombolysis in myocardial infarction; HRP, high-risk plaques; FCT, fibrous cap thickness; MLA, minimal lumen area.
Furthermore, in terms of OCT findings, 24.8% STEMI patients in this study exhibited OCT-defined high-risk plaque features, whereas 56.6% exhibited plaque rupture. Notably, patients with PR/high-rSS presented higher prevalence of OCT-defined HRP (6.6% vs. 1.7% vs. 27.3% vs. 48.0%, groups 1–4, P<0.001), lipid-rich plaque (18.0% vs. 15.5% vs. 89.1% vs. 91.0%, groups 1–4, P<0.001), macrophage infiltration (45.9% vs. 31.0% vs. 61.8% vs. 69.0%, groups 1–4, P<0.001), and FCT <75 µm (18.0% vs. 8.6% vs. 41.8% vs. 52.0%, groups 1–4, P<0.001). In addition, PR/high-rSS group had more high-risk plaque features than the other three groups ( Fig.2 ) . With regard to quantitative OCT imaging, patients with PR/high-rSS exhibited lower minimal FCT, and patients with PR/high-rSS had higher maximal lipid arc and MLA (P<0.001 among the four groups).
Fig.2. Bar graphs of prevalence of high-risk plaque features via optical coherence tomography (minimum lumen area <3.5 mm2, fibrous cap thickness <75 µm, lipid arc circumferential extension >180°, and presence of macrophages) among groups .

Abbreviations: PE, plaque erosion; PR, plaque rupture; rSS, residual SYNTAX score.
Baseline Characteristics and OCT Findings Based on HRP and rSS
Patients were grouped according to HRP and rSS; their baseline clinical features, angiographic characteristics, and OCT findings are shown in Table 2 . Patients with HRP/high-rSS had higher SYNTAX score (P<0.001 among the four groups) and prevalence of diabetes (P<0.001 among the four groups) and triple-vessel diseases (P<0.001 among the four groups). Moreover, a difference was noted in the distribution of culprit vessels among the four groups (P<0.001). Notably, besides the OCT-defined HRP characteristics, patients with HRP exhibited higher prevalence of plaque rupture (41.2% vs. 47.7% vs. 78.9% vs. 98.0%, groups 1–4, P<0.001).
Table 2. Baseline characteristics and OCT findings based on HRP and rSS.
| Variables | non-HRP/low-rSS (n = 97) | non-HRP/high-rSS (n = 109) | HRP/low-rSS (n = 19) | HRP/high-rSS (n = 49) | P value |
|---|---|---|---|---|---|
| Clinical information | |||||
| Age, years | 56.2±12.6 | 57.9±11.6 | 57.4±11.3 | 59.7±10.4 | 0.376 |
| Male | 82 (84.5) | 84 (77.1) | 15 (78.9) | 40 (81.6) | 0.596 |
| BMI, kg/m2 | 25.7±3.0 | 25.9±3.7 | 26.0±2.9 | 26.4±3.8 | 0.754 |
| Smoking | 73 (75.3) | 80 (73.4) | 14 (73.7) | 34 (69.4) | 0.902 |
| Hypertension | 52 (53.6) | 71 (65.1) | 11 (57.9) | 30 (61.2) | 0.406 |
| Dyslipidemia | 84 (86.6) | 92 (84.4) | 16 (84.2) | 44 (89.8) | 0.839 |
| DM | 19 (19.6) | 33 (30.3) | 7 (36.8) | 22 (44.9) | 0.014 |
| Prior PCI | 6 (6.2) | 9 (8.3) | 4 (21.1) | 3 (6.1) | 0.190 |
| LVEF, % | 55.0 (50.0-59.0) | 57.0 (52.0-59.0) | 54.0 (47.0-58.5) | 55.0 (53.0-59.0) | 0.268 |
| bSS | 12.0 (9.0-17.5) | 19.5 (14.0-25.5) | 11.0 (8.0-16.0) | 20.0 (14.0-26.5) | <0.001 |
| rSS | 0 (0-2.0) | 7.0 (5.0-11.0) | 0 (0-2.0) | 8.0 (5.0-12.2) | <0.001 |
| Laboratory tests | |||||
| Platelet, ×1000/µL | 224.0 (190.0-286.0) | 231.0 (195.0-279.0) | 240.0 (193.5-268.5) | 212.0 (187.0-274.0) | 0.793 |
| Glucose, mmol/L | 7.3 (6.3-8.9) | 7.9 (6.4-10.5) | 7.5 (6.4-9.9) | 7.8 (6.5-11.3) | 0.234 |
| Hs-CRP, mg/L | 5.9 (3.0-11.1) | 6.2 (2.6-10.8) | 3.1 (1.6-8.9) | 6.6 (2.8-10.8) | 0.413 |
| HbA1c, % | 5.8 (5.5-6.6) | 6.2 (5.7-7.4) | 5.9 (5.8-7.3) | 6.1 (5.4-7.6) | 0.050 |
| TC, mmol/L | 4.2 (3.6-4.9) | 4.4 (3.8-5.1) | 4.3 (4.0-5.1) | 4.6 (3.7-5.3) | 0.350 |
| TG, mmol/L | 1.4 (0.9-1.8) | 1.4 (1.0-2.2) | 1.5 (1.2-1.9) | 1.5 (1.0-2.3) | 0.542 |
| LDL-C, mmol/L | 2.7±0.9 | 2.8±0.9 | 2.9±0.8 | 2.9±0.9 | 0.388 |
| HDL-C, mmol/L | 1.1 (0.9-1.3) | 1.0 (0.9-1.2) | 1.1 (0.9-1.2) | 1.1 (0.9-1.2) | 0.464 |
| Lp(a), mg/L | 136.0 (64.0-366.0) | 161.6 (76.0-408.0) | 122.0 (98.5-250.5) | 183.0 (92.0-396.8) | 0.748 |
| Baseline troponin I, ng/ml | 1.3 (0.1-5.8) | 0.9 (0.2-4.2) | 1.1 (0.1-2.2) | 0.4 (0.1-6.4) | 0.745 |
| Peak troponin I, ng/ml | 25.4 (10.0-55.4) | 25.6 (11.2-44.7) | 20.3 (11.0-31.2) | 18.2 (8.7-38.1) | 0.334 |
| Discharge medications | |||||
| Aspirin, | 94 (96.9) | 104 (95.4) | 19 (100) | 48 (98) | 0.868 |
| P2Y12 inhibitor | 0.894 | ||||
| Ticagrelor | 50 (51.5) | 53 (48.6) | 11 (57.9) | 25 (51) | |
| Clopidogrel | 47 (48.5) | 56 (51.4) | 8 (42.1) | 24 (49) | |
| Statin | 95 (97.9) | 104 (95.4) | 18 (94.7) | 49 (100) | 0.337 |
| Dual anti-platelet therapy | 94 (96.9) | 104 (95.4) | 19 (100) | 48 (98) | 0.868 |
| Dual anti-platelet therapy duration, month | 11.9±2.6 | 12.2±3.9 | 12.6±1.9 | 13.1±3.8 | 0.237 |
| Procedural data | |||||
| Culprit vessel | <0.001 | ||||
| LAD | 61 (62.9) | 46 (42.2) | 7 (36.8) | 17 (34.7) | |
| LCX | 5 (5.2) | 20 (18.3) | 1 (5.3) | 1 (2) | |
| RCA | 31 (32) | 43 (39.4) | 11 (57.9) | 31 (63.3) | |
| No. of coronary artery narrowed | <0.001 | ||||
| 1 | 55 (56.7) | 4 (3.7) | 5 (26.3) | 2 (4.1) | |
| 2 | 31 (32) | 43 (39.4) | 12 (63.2) | 14 (28.6) | |
| 3 | 11 (11.3) | 62 (56.9) | 2 (10.5) | 33 (67.3) | |
| Additional PCI for non-culprit vessels | 12 (12.4) | 18 (16.5) | 6 (31.6) | 7 (14.3) | 0.223 |
| Complete revascularization | 60 (61.9) | 0 (0) | 12 (63.2) | 0 (0) | < 0.001 |
| Pre-TIMI flow 0 | 63 (64.9) | 67 (61.5) | 13 (68.4) | 29 (59.2) | 0.848 |
| Stent implantation | 92 (94.8) | 102 (93.6) | 18 (94.7) | 49 (100) | 0.272 |
| Post-TIMI flow 3 | 95 (97.9) | 108 (99.1) | 19 (100) | 49 (100) | 0.696 |
| OCT findings | |||||
| Plaque morphology | <0.001 | ||||
| Plaque rupture | 40 (41.2) | 52 (47.7) | 15 (78.9) | 48 (98) | |
| Plaque erosion | 57 (58.8) | 57 (52.3) | 4 (21.1) | 1 (2) | |
| Plaque type | <0.001 | ||||
| Lipid-rich plaque | 41 (42.3) | 51 (46.8) | 19 (100) | 49 (100) | |
| Fibrous plaque | 56 (57.7) | 58 (53.2) | 0 | 0 | |
| Calcification | 45 (46.4) | 56 (51.4) | 8 (42.1) | 31 (63.3) | 0.223 |
| Macrophage | 43 (44.3) | 38 (34.9) | 19 (100) | 49 (100) | <0.001 |
| Micro-vessels | 20 (20.6) | 14 (12.8) | 4 (21.1) | 10 (20.4) | 0.370 |
| Cholesterol crystal | 8 (8.2) | 8 (7.3) | 1 (5.3) | 5 (10.2) | 0.925 |
| Thrombus | 95 (97.9) | 108 (99.1) | 19 (100) | 49 (100) | 0.666 |
| Minimal FCT, µm | 142.0±95.4 | 140.0±85.1 | 52.6±11.0 | 59.4±6.3 | <0.001 |
| FCT<75µm | 15 (15.5) | 8 (7.3) | 19 (100) | 49 (100) | <0.001 |
| Maximal lipid arc, ° | 304.4±69.5 | 283.5±77.4 | 348.3±35.1 | 338.2±47.1 | <0.001 |
| MLA, mm2 | 1.9±0.8 | 1.8±0.7 | 2.0±0.6 | 2.0±0.5 | 0.525 |
| MLA<3.5 mm2 | 88 (90.7) | 106 (97.2) | 19 (100) | 49 (100) | 0.040 |
Continuous data are presented as mean±standard deviation or median (interquartile ranges). Categorical data are presented as number (%). OCT, optical coherence tomography; HRP, high-risk plaques; rSS, residual SYNTAX score; BMI, body mass index; DM, diabetes mellitus; PCI, percutaneous coronary intervention; LVEF, left ventricular ejection fraction; bSS, baseline SYNTAX score; Hs-CRP, high-sensitivity C-reactive protein; HbA1c, Glycated hemoglobin A1c; TC, total cholesterol; TG, triglyceride; LDL-C, low-density-lipoprotein cholesterol; HDL-C, high-density lipoprotein- cholesterol; Lp(a), lipoprotein(a); LAD, left anterior descending; LCX, left circumflex artery; RCA, right coronary artery; TIMI, Thrombolysis in myocardial infarction; FCT, fibrous cap thickness; MLA, minimal lumen area.
Mace During Follow-Up
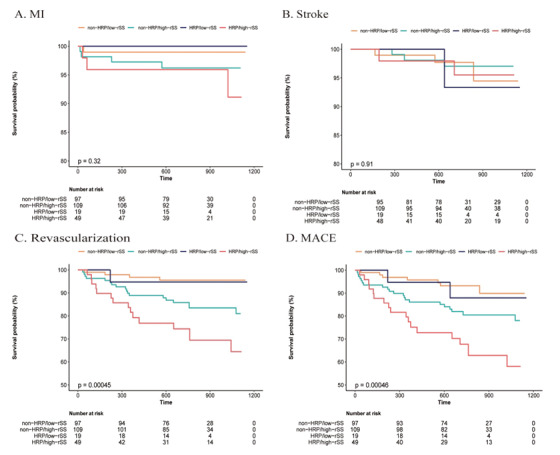
During the follow-up period of 2.2 years, in total, 47 (17.5%) MACE were observed: 8.2% (5 patients) among patients with PE/low-rSS, 15.5% (9 patients) among patients with PE/high-rSS, 7.3% (4 patients) among patients with PR/low-rSS, and 29.0% (29 patients) among patients with PR/high-rSS. Fig.3 shows the K-M curves of different endpoints among the four groups stratified by PR and rSS, indicating that patients with PR/high-rSS presented lower survival probability on revascularization (log-rank P<0.001) and MACE (log-rank P=0.001).
Fig.3. Kaplan–Meier curves for endpoints according to rSS and plaque morphology.

A) MI; B) Stroke; C) Revascularization; D) MACE. Abbreviations: PE, plaque erosion; PR, plaque rupture; rSS, residual SYNTAX score; MI, myocardial infarction; MACE, major adverse cardiac events.
In addition, MACE occurred in 7.2% (7 patients) of patients with non-HRP/low-rSS, 19.3% (21 patients) of patients with non-HRP/high-rSS, 10.5% (2 patients) of patients with HRP/low-rSS, and 34.7% (17 patients) of patients with HRP/high-rSS (log-rank P<0.001).
Fig.4 shows the K-M curves of different endpoints among the four groups stratified by HRP and rSS, suggesting that patients with HRP/high-rSS presented lower survival probability on revascularization (log-rank P<0.001) and MACE (log-rank P<0.001).
Fig.4. Kaplan–Meier curves for endpoints according to rSS and high-risk plaques.
A) MI; B) Stroke; C) Revascularization; D) MACE.
Abbreviations: HRP, high-risk plaque; rSS, residual SYNTAX score; MI, myocardial infarction; MACE, major adverse cardiac events.
As shown in Table 3 , in fully adjusted analyses, patients with high-rSS and OCT-defined high-risk plaque were associated with higher MACE risk (high-rSS, HR: 3.47, 95% CI: 1.41–8.55, P=0.007; OCT-defined HRP, HR: 2.72, 95% CI: 1.30–5.68, P=0.008). In terms of HRP criteria, FCT <75 µm was independently associated with MACE risk (HR: 2.62, 95% CI: 1.29–5.31, P=0.008), while the other criteria were not. However, no significant difference of cardiovascular risk among the number of HRP criteria was noted. Strikingly, the risk of MACE occurrence in patients with PR/high-rSS was 4.80 times greater than patients with PE/low-rSS (HR: 4.80, 95% CI: 1.43–16.11, P=0.025). Patients with non-HRP/high-rSS and HRP/high-rSS presented higher risk of cardiac events when compared to patients with non-HRP/low-rSS (non-HRP/high-rSS: HR: 2.90, 95% CI: 1.01–8.38, P=0.049; HRP/high-rSS: HR: 8.67, 95% CI: 2.67–28.21, P< 0.001). However, no significant difference of MACE risk between PR and PE was noted.
Table 3. Hazard ratio to MACE according to plaque and rSS.
| Crude HR (95% CI) | P value | Adjusted HRa (95% CI) | P value | |
|---|---|---|---|---|
| rSS ≥ 3 vs. <3 | 3.26 (1.58-6.74) | 0.001 | 3.47 (1.41-8.55) | 0.007 |
| Plaque rupture vs. plaque erosion | 1.83 (0.98-3.43) | 0.057 | 2.01 (0.96-4.22) | 0.066 |
| OCT defined HRP | 2.24 (1.25-4.00) | 0.007 | 2.72 (1.30-5.68) | 0.008 |
| HRP criteria | ||||
| Lipid plaques | 1.44 (0.79,2.64) | 0.232 | 1.13 (0.54-2.37) | 0.742 |
| FCT <75 µm | 2.05 (1.16,3.64) | 0.014 | 2.62 (1.29-5.31) | 0.008 |
| MLA<3.5 mm2 | 0.59 (0.18,1.91) | 0.381 | 0.4 (0.09-1.69) | 0.213 |
| Macrophage | 1.17 (0.66,2.09) | 0.593 | 1.34 (0.69-2.6) | 0.379 |
| Numbers of HRP criterion | ||||
| ≤ 1 | 1 (ref.) | - | 1 (ref.) | - |
| 2 | 0.77 (0.33-1.77) | 0.534 | 0.65 (0.25-1.72) | 0.39 |
| 3 | 0.66 (0.25-1.75) | 0.400 | 0.56 (0.18-1.76) | 0.319 |
| 4 | 1.83 (0.89-3.77) | 0.101 | 1.95 (0.76-5.01) | 0.166 |
| Groups of plaque rupture and rSS | ||||
| PE/low-rSS | 1 (ref.) | - | 1 (ref.) | - |
| PE/high-rSS | 1.94 (0.65-5.79) | 0.235 | 2.29 (0.63-8.3) | 0.207 |
| PR/low-rSS | 0.87 (0.23-3.24) | 0.836 | 1.16 (0.27-4.95) | 0.843 |
| PR/high-rSS | 3.73 (1.44-9.63) | 0.007 | 4.80 (1.43-16.11) | 0.011 |
| Groups of high-risk plaque and rSS | ||||
| non-HRP/low-rSS | 1 (ref.) | - | 1 (ref.) | - |
| non-HRP/high-rSS | 2.76 (1.17-6.49) | 0.02 | 2.90 (1.01-8.38) | 0.049 |
| HRP/low-rSS | 1.53 (0.32-7.39) | 0.593 | 1.75 (0.3-10.29) | 0.539 |
| HRP/high-rSS | 5.42 (2.25-13.08) | <0.001 | 8.67 (2.67-28.21) | <0.001 |
MACE, major adverse cardiovascular events (all-cause death, myocardial infarction, stroke, or unplanned revascularization of any coronary artery); rSS, residual SYNTAX score; HR, hazard ratio; CI, confidence intervals; OCT, optical coherence tomography; HRP, high-risk plaque; FCT, fibrous cap thickness; MLA, minimal lumen area; PE, plaque erosion; PR, plaque rupture.
a Adjusted for age, sex, body mass index, hypertension, diabetes mellitus, dyslipidemia, history of percutaneous coronary intervention, left ventricular ejection fraction, smoking, peak troponin I, low density lipoprotein cholesterol, high density lipoprotein cholesterol, total cholesterol, triglyceride, high-sensitivity C-reactive protein, lipoprotein(a), glycated hemoglobin A1c, baseline troponin I, platelet, glucose, use of aspirin, P2Y12 inhibitors, statin, culprit vessels, number of coronary artery narrowed, pre-TIMI flow 0, balloon pre-dilation, thrombus aspiration and stent implantation or not.
Predictive Role of rSS and Plaque Features
As shown in Fig.5A , time-dependent ROC curves were plotted to assess the diagnostic value of culprit-plaque morphology in combination with rSS for predicting 1-year MACE. Model 3 (Model 1 plus rSS and presence of OCT-defined high-risk plaque) provided a stronger estimate value compared with Model 1 via ROC analyses (AUC: 0.836, 95% CI: 0.764–0.908). The AUC of Model 1 [predictor of traditional risk factors including sex, age, body mass index, current smoking, left ventricular ejection fraction, hypertension, hyperlipidemia, diabetes mellitus, history of PCI, Killip classification, baseline troponin I, peak troponin I, low-density lipoprotein cholesterol, high-density lipoprotein cholesterol, total cholesterol, triglyceride, high-sensitivity C-reactive protein, lipoprotein(a), glycated hemoglobin A1c, platelet and glucose] was 0.714 (95% CI: 0.623–0.805). The AUC of Model 2 (model 1 plus presence of OCT-defined high-risk plaque) was 0.777 (95% CI: 0.698–0.856). The AUC time curve of different models is shown in Fig.5B , wherein Model 3 exhibited higher AUC during the whole follow-up period.
Fig.5. A. Time-dependent ROC curves of different models for predicting 1-year major adverse cardiac events B. The AUC time curve of different models.

Model 1, traditional risk factors; Model 2, Model 1 plus presence of OCT-defined high-risk plaque; and Model 3, Model 2 plus rSS.
Abbreviations: ROC curve, receiver operating characteristic curve; AUC, area under the ROC curve.
Discrimination and reclassification of 1-year MACE by different models is shown in Table 4 . The C-statistic of model 1 was 0.731 (95% CI: 0.666–0.797). Adding rSS and plaque features to the risk prediction model increased the C-statistic to 0.797 (95% CI: 0.737–0.857), with ΔC-statistic of 0.066 (P=0.002). Furthermore, the addition of rSS and plaque features to the model also resulted in a significant increase in NRI (46.0%, 95% CI: 20.5–56.8%, P<0.001) and IDI (8.7%, 95% CI: 3.6–18.2%, P<0.001). However, no significant increase in C-statistic, NRI, and IDI was noted for Model 2 when compared to Model 1.
Table 4. Discrimination and reclassification of 1-year MACE by different models.
| Models | C-statistics (95% CI) | P difference a | NRI (95% CI) | P value | IDI (95% CI) | P value |
|---|---|---|---|---|---|---|
| Model 1 | 0.731 (0.666-0.797) | - | Ref. | - | Ref. | - |
| Model 2 | 0.746 (0.681-0.811) | 0.229 | 0.234 (-0.014-0.427) | 0.060 | 0.040 (-0.003-0.093) | 0.070 |
| Model 3 | 0.797 (0.737-0.857) | 0.002 | 0.460 (0.205-0.568) | <0.001 | 0.087 (0.036-0.182) | <0.001 |
a For comparison between model 1 and other models.
Model 1, predictor of traditional risk factors including sex, age, body mass index, current smoking, left ventricular ejection fraction, hypertension, hyperlipidemia, diabetes mellitus, history of PCI, Killip classification, baseline troponin I, peak troponin I, low density lipoprotein cholesterol, high density lipoprotein cholesterol, total cholesterol, triglyceride, high-sensitivity C-reactive protein, lipoprotein(a), glycated hemoglobin A1c, platelet and glucose.
Model 2, Model 1 plus present of OCT-defined high-risk plaque. Model 3, Model 2 plus rSS.
MACE, major adverse cardiovascular events; CI, confidence interval; NRI, net reclassification index; IDI, integrated discrimination improvement.
Discussion
To the best of our knowledge, this present study is the first study to explore the prognostic value of rSS and plaque morphology via OCT for predicting cardiovascular events in patients with STEMI. The main findings of this study can be summarized as follows: (1) patients with PR/high-rSS presented more high-risk plaque features and poor prognosis; (2) patients with high-rSS and OCT-defined high-risk plaque were associated with higher MACE risk; (3) patients with non-HRP/high-rSS and HRP/high-rSS presented higher risk of cardiac events when compared to patients with non-HRP/low-rSS; (4) combining the high-risk plaque features with rSS enhanced the predictive ability for MACE.
Rupture of the atherosclerotic plaques has been identified as the most common cause of life-threatening coronary thrombosis and acute coronary events followed by plaque erosion 1 , 13 , 14) . Compared with plaque erosion, patients presenting with PR as culprit lesion were proved to have high-risk clinical characteristics and more complex angiographic features 15 , 16) . Niccoli et al. 2) demonstrated patients with PR had a worse prognosis compared with that of patients with intact fibrous cap, which highlights the need to clarify the pathological characteristics of coronary plaque for the precise treatment in AMI. However, we failed to exhibit the same association between PR and clinical outcomes. We attributed this discrepancy to small-scale population, insufficient follow-up time, and different definitions of study endpoints. In addition, pan-coronary vulnerability has attracted attention in recent years. Vergallo et al. 17) verified non-culprit-plaque ruptures were related to higher 1-year revascularization rate. This current study focused on culprit lesion and was lacking in terms of in-depth exploration in pan-coronary vulnerability, which might result in the inconsistent results.
Furthermore, Jia et al. 18) reported that patients with culprit lesions related to PR were accompanied by other high-risk plaque features, such as thin-cap fibroatheroma, large lipid core, and inflammation activity, which, in turn, was linked to an incremental rise in cardiovascular risk. Previous studies have indicated that high-risk coronary plaques detected by coronary computed tomography angiography 19 , 20) , intravascular ultrasound (IVUS) 21) , and OCT 3) were also associated with increased risk of cardiovascular events.
In this present study, 155 (56.6%) patients exhibited PR as culprit lesion, whereas 68 (24.8%) presented with OCT-defined high-risk plaques. These results illustrated that nearly one-half of STEMI patients were at very high risk and required close attention of clinical management. The risk of occurrence of MACE in this current cohort of patients with OCT-defined high-risk plaques was 2.72 times greater than patients without. This result is in line with the previous CLIMA study, which showed OCT-defined high-risk plaques were associated with a higher risk of major coronary events 3) . Nevertheless, we found that the risk of MACE was similar between PR and PE, though the incidence was determined to be higher in patients with PR (14.8% vs. 11.8%), implying the inadequacy of risk stratification based solely on plaque morphology. Therefore, we conducted this current research to verify the efficacy and accuracy of residual atherosclerotic load combined with plaque morphology in terms of identifying patients at higher risk.
Residual SYNTAX score is an objective and reliable scoring system to assess the complexity of residual atherosclerotic burden developed based on the SYNTAX score, which is a comprehensive tool to evaluate not only the number of significant stenoses but also lesion-specific characteristics. The association of high rSS with increased risk of MACE has been widely established in previous studies 4 , 22) , which were in line with our results. As a significant symbol of incomplete revascularization 6 , 23 , 24) , complex coronary lesions 4) , and plaque vulnerability 25) , rSS demonstrated excellent prognostic value. Complete revascularization has been confirmed to be the optimal strategy in patients with multi-vessel disease 26) . Barthélémy et al. 6) reported that rSS was associated with early and late mortality among patients with cardiogenic shock related to MI, suggesting a benefit of achieving complete revascularization on cardiovascular outcomes in patients with cardiogenic shock. Moreover, patients with high rSS generally exhibited a higher incidence of high-risk clinical characteristics and more severe baseline coronary complexity such as calcification, bifurcations, and tortuosity 4) . Results from Fujino et al. 25) showed that rSS was significantly correlated with plaque morphology based on IVUS and rSS, and plaque burden ≥ 70% detected by IVUS independently predicted MACE.
There has been a great deal of research interest to incorporate the rSS with other risk factors for risk assessment 23 , 25 , 27) . Braga et al. 23) demostrated that rSS added important prognostic information over GRACE score in patients with STEMI and multi-vessel disease. Gao et al. 27) reported that rSS improve the predictive ability of age, creatinine, and ejection fraction (ACEF) score for cardiac mortality in a large-scale PCI population.
Our study demonstrated that the risk of cardiovascular events in patients with PR/high-rSS was 4.80 times greater than patients with PE/low-rSS. Compared with traditional risk factors, prognostic model combined with rSS and culprit-plaque features had significantly better discrimination ability based on ROC curve analysis, net reclassification improvement, and IDI. As rSS focuses on coronary stenosis and lesion complexity but not on plaque vulnerability, adding the morphological assessment of culprit lesions by OCT to the angiographic assessment by rSS contributed to better prediction of high-risk patients.
Our study has several limitations. Firstly, this study as a single-center, small-size study with strict selection criteria might led to selection bias. Secondly, pre-OCT operation including thrombus aspiration and pre-dilatation, despite being carried out with caution, might affect the assessment of plaque morphology. Although plaque morphology was carefully analyzed by professional researchers, the potential effect must be given a serious consideration. Finally, the event rate was low due to the insufficient sample size and follow-up time. Therefore, further investigations involving a large, multicenter study population are warranted.
Conclusion
In STEMI patients, high-risk culprit-plaque morphology in combination with high-rSS were associated with higher cardiovascular risk and enhanced the predictive ability for MACE, indicating that culprit-plaque morphology and residual atherosclerosis burden should be taken into account in risk stratification and management of patients with STEMI.
Funding
This study is supported by the National Natural Science Foundation of China (81970308), Shenzhen Key Medical Discipline Construction Fund (SZXK001), the Fund of “Sanming” Project of Medicine in Shenzhen (SZSM201911017) and Chinese Academy of Medical Sciences Innovation Fund for Medical Sciences (2016-I2M-1-009).
Acknowledgements
We gratefully acknowledge all individuals who participated in this study. We are grateful to the Department of Cardiology, Cardiovascular Institute of Fuwai Hospital for its help in recruiting patients.
Trial Registration Number
This study is registered at clinical trials.gov as NCT03593928.
Disclosures
The Authors declare that there is no conflict of interest.
Supplementary Appendix
Definitions for Culprit Plaque Characteristics
According to the predominant component, plaques were distinguished as fibrous plaques and lipid-rich plaques, identified as a homogeneous, highly backscattering region ( Supplementary Fig.1a ) or as a low-signal region with a diffuse border ( Supplementary Fig.1b ) , respectively. Plaque rupture was identified by the discontinuous fibrous cap with a clear cavity formation ( Supplementary Fig.1c ) . Plaque erosion was defined by OCT evidence of thrombus, an irregular luminal surface, and no evidence of cap rupture in multiple adjacent frames ( Supplementary Fig.1d ) , probable plaque erosion was defined by: 1) irregular luminal surface with the absence of a thrombus; or 2) attenuation of underlying plaque by thrombus without superficial lipid immediately proximal or distal to the site of thrombus. Thin-cap fibroatheroma (TCFA) was defined as a lipid-rich plaque with the maximum lipid arc greater than two quadrants as well as the thinnest fibrous cap thickness (FCT) of <65 µm ( Supplementary Fig.1b ) .
Calcification within plaques was defined as the presence of well-delineated heterogeneous regions with low backscattering ( Supplementary Fig.1e ) . Micro-vessels were recognized as low-signal, sharply delineated, cavity-like structures with a diameter of 50-300µm, observed in more than three consecutive cross-sectional OCT images ( Supplementary Fig.1f ) . Cholesterol crystals were defined as high-signal, low attenuating, linear structures within the fibrous cap or plaque lipid necrosis core ( Supplementary Fig.1g ) . Macrophage infiltration was usually found at the boundaries between the fibrous cap and inner lipid core, identified as signal-rich, highly reflective, punctate or strip regions with backward shadowing ( Supplementary Fig.1h ) . Intracoronary thrombus was defined as a mass with an irregular appearance, adjacent to the luminal surface or floating within the lumen.
The quantitative OCT measurements included the following information: the length of the culprit lesion was measured from the longitudinal view; the lipid arc was measured at 1-mm intervals across the entire lesion, and the largest arc was recorded; FCT was measured at the thinnest part of fibrous cap three times, and the average value was noted; and the minimal lumen area (MLA) was evaluated along the length of the target lesion.
References
- 1).Davies MJ and Thomas A: Thrombosis and acute coronary-artery lesions in sudden cardiac ischemic death. N Engl J Med, 1984; 310: 1137-1140 [DOI] [PubMed] [Google Scholar]
- 2).Niccoli G, Montone RA, Di Vito L, Gramegna M, Refaat H, Scalone G, Leone AM, Trani C, Burzotta F, Porto I, Aurigemma C, Prati F and Crea F: Plaque rupture and intact fibrous cap assessed by optical coherence tomography portend different outcomes in patients with acute coronary syndrome. Eur Heart J, 2015; 36: 1377-1384 [DOI] [PubMed] [Google Scholar]
- 3).Prati F, Romagnoli E, Gatto L, La Manna A, Burzotta F, Ozaki Y, Marco V, Boi A, Fineschi M, Fabbiocchi F, Taglieri N, Niccoli G, Trani C, Versaci F, Calligaris G, Ruscica G, Di Giorgio A, Vergallo R, Albertucci M, Biondi-Zoccai G, Tamburino C, Crea F, Alfonso F and Arbustini E: Relationship between coronary plaque morphology of the left anterior descending artery and 12 months clinical outcome: the CLIMA study. Eur Heart J, 2020; 41: 383-391 [DOI] [PubMed] [Google Scholar]
- 4).Farooq V, Serruys PW, Bourantas CV, Zhang Y, Muramatsu T, Feldman T, Holmes DR, Mack M, Morice MC, Ståhle E, Colombo A, de Vries T, Morel MA, Dawkins KD, Kappetein AP and Mohr FW: Quantification of incomplete revascularization and its association with five-year mortality in the synergy between percutaneous coronary intervention with taxus and cardiac surgery (SYNTAX) trial validation of the residual SYNTAX score. Circulation, 2013; 128: 141-151 [DOI] [PubMed] [Google Scholar]
- 5).Song Y, Gao Z, Tang X, Jiang P, Xu J, Yao Y, Li J, Zhao X, Qiao S, Yang Y, Gao R, Xu B and Yuan J: Impact of residual SYNTAX score on clinical outcomes after incomplete revascularisation percutaneous coronary intervention: a large single-centre study. EuroIntervention, 2017; 13: 1185-1193 [DOI] [PubMed] [Google Scholar]
- 6).Barthélémy O, Rouanet S, Brugier D, Vignolles N, Bertin B, Zeitouni M, Guedeney P, Hauguel-Moreau M, Hage G, Overtchouk P, Akin I, Desch S, Vicaut E, Zeymer U, Thiele H and Montalescot G: Predictive Value of the Residual SYNTAX Score in Patients With Cardiogenic Shock. J Am Coll Cardiol, 2021; 77: 144-155 [DOI] [PubMed] [Google Scholar]
- 7).Ibanez B, James S, Agewall S, Antunes MJ, Bucciarelli-Ducci C, Bueno H, Caforio ALP, Crea F, Goudevenos JA, Halvorsen S, Hindricks G, Kastrati A, Lenzen MJ, Prescott E, Roffi M, Valgimigli M, Varenhorst C, Vranckx P and Widimský P: 2017 ESC Guidelines for the management of acute myocardial infarction in patients presenting with ST-segment elevation: The Task Force for the management of acute myocardial infarction in patients presenting with ST-segment elevation of the European Society of Cardiology (ESC). Eur Heart J, 2018; 39: 119-177 [Google Scholar]
- 8).Sianos G, Morel MA, Kappetein AP, Morice MC, Colombo A, Dawkins K, van den Brand M, Van Dyck N, Russell ME, Mohr FW and Serruys PW: The SYNTAX Score: an angiographic tool grading the complexity of coronary artery disease. EuroIntervention, 2005; 1: 219-227 [PubMed] [Google Scholar]
- 9).Kwon O, Park DW and Park SJ: Completeness of Revascularization as a Determinant of Outcome: A Contemporary Review and Clinical Perspectives. Can J Cardiol, 2019; 35: 948-958 [DOI] [PubMed] [Google Scholar]
- 10).Tan Y, Zhou J, Liu C, Zhou P, Sheng Z, Li J, Chen R, Song L, Zhao H, Xu B, Gao R and Yan H: Association Between Plasma Trimethylamine N-oxide and Neoatherosclerosis in Patients With Very Late Stent Thrombosis. Can J Cardiol, 2020; 36: 1252-1260 [DOI] [PubMed] [Google Scholar]
- 11).Sheng Z, Zhou P, Liu C, Li J, Chen R, Zhou J, Song L, Zhao H and Yan H: Relationships of coronary culprit-plaque characteristics with duration of diabetes mellitus in acute myocardial infarction: an intravascular optical coherence tomography study. Cardiovasc Diabetol, 2019; 18: 136-146 [DOI] [PMC free article] [PubMed] [Google Scholar]
- 12).Tearney GJ, Regar E, Akasaka T, Adriaenssens T, Barlis P, Bezerra HG, Bouma B, Bruining N, Cho JM, Chowdhary S, Costa MA, de Silva R, Dijkstra J, Di Mario C, Dudek D, Falk E, Feldman MD, Fitzgerald P, Garcia-Garcia HM, Gonzalo N, Granada JF, Guagliumi G, Holm NR, Honda Y, Ikeno F, Kawasaki M, Kochman J, Koltowski L, Kubo T, Kume T, Kyono H, Lam CC, Lamouche G, Lee DP, Leon MB, Maehara A, Manfrini O, Mintz GS, Mizuno K, Morel MA, Nadkarni S, Okura H, Otake H, Pietrasik A, Prati F, Räber L, Radu MD, Rieber J, Riga M, Rollins A, Rosenberg M, Sirbu V, Serruys PW, Shimada K, Shinke T, Shite J, Siegel E, Sonoda S, Suter M, Takarada S, Tanaka A, Terashima M, Thim T, Uemura S, Ughi GJ, van Beusekom HM, van der Steen AF, van Es GA, van Soest G, Virmani R, Waxman S, Weissman NJ and Weisz G: Consensus standards for acquisition, measurement, and reporting of intravascular optical coherence tomography studies: a report from the International Working Group for Intravascular Optical Coherence Tomography Standardization and Validation. J Am Coll Cardiol, 2012; 59: 1058-1072 [DOI] [PubMed] [Google Scholar]
- 13).Fuster V, Badimon L, Badimon JJ and Chesebro JH: The pathogenesis of coronary artery disease and the acute coronary syndromes (1). N Engl J Med, 1992; 326: 242-250 [DOI] [PubMed] [Google Scholar]
- 14).Narula J, Nakano M, Virmani R, Kolodgie FD, Petersen R, Newcomb R, Malik S, Fuster V and Finn AV: Histopathologic characteristics of atherosclerotic coronary disease and implications of the findings for the invasive and noninvasive detection of vulnerable plaques. J Am Coll Cardiol, 2013; 61: 1041-1051 [DOI] [PMC free article] [PubMed] [Google Scholar]
- 15).Kim HO, Kim CJ, Kurihara O, Thondapu V, Russo M, Yamamoto E, Sugiyama T, Fracassi F, Lee H, Yonetsu T and Jang IK: Angiographic features of patients with coronary plaque erosion. Int J Cardiol, 2019; 288: 12-16 [DOI] [PubMed] [Google Scholar]
- 16).Song L, Chen RZ, Zhao XX, Sheng ZX, Zhou P, Liu C, Li JN, Zhou JY, Wang Y, Zhao HJ and Yan HB: Mean Platelet Volume/Platelet Count Ratio and Culprit Plaque Morphologies: An Optical Coherence Tomography Study in Patients with ST Segment Elevation Myocardial Infarction. J Cardiovasc Transl Res, 2021 [DOI] [PubMed] [Google Scholar]
- 17).Vergallo R, Uemura S, Soeda T, Minami Y, Cho JM, Ong DS, Aguirre AD, Gao L, Biasucci LM, Crea F, Yu B, Lee H, Kim CJ and Jang IK: Prevalence and Predictors of Multiple Coronary Plaque Ruptures: In Vivo 3-Vessel Optical Coherence Tomography Imaging Study. Arterioscler Thromb Vasc Biol, 2016; 36: 2229-2238 [DOI] [PubMed] [Google Scholar]
- 18).Jia H, Abtahian F, Aguirre AD, Lee S, Chia S, Lowe H, Kato K, Yonetsu T, Vergallo R, Hu S, Tian J, Lee H, Park SJ, Jang YS, Raffel OC, Mizuno K, Uemura S, Itoh T, Kakuta T, Choi SY, Dauerman HL, Prasad A, Toma C, McNulty I, Zhang S, Yu B, Fuster V, Narula J, Virmani R and Jang IK: In vivo diagnosis of plaque erosion and calcified nodule in patients with acute coronary syndrome by intravascular optical coherence tomography. J Am Coll Cardiol, 2013; 62: 1748-1758 [DOI] [PMC free article] [PubMed] [Google Scholar]
- 19).Lee JM, Choi KH, Koo BK, Park J, Kim J, Hwang D, Rhee TM, Kim HY, Jung HW, Kim KJ, Yoshiaki K, Shin ES, Doh JH, Chang HJ, Cho YK, Yoon HJ, Nam CW, Hur SH, Wang J, Chen S, Kuramitsu S, Tanaka N, Matsuo H and Akasaka T: Prognostic Implications of Plaque Characteristics and Stenosis Severity in Patients With Coronary Artery Disease. J Am Coll Cardiol, 2019; 73: 2413-2424 [DOI] [PubMed] [Google Scholar]
- 20).Motoyama S, Ito H, Sarai M, Kondo T, Kawai H, Nagahara Y, Harigaya H, Kan S, Anno H, Takahashi H, Naruse H, Ishii J, Hecht H, Shaw LJ, Ozaki Y and Narula J: Plaque Characterization by Coronary Computed Tomography Angiography and the Likelihood of Acute Coronary Events in Mid-Term Follow-Up. J Am Coll Cardiol, 2015; 66: 337-346 [DOI] [PubMed] [Google Scholar]
- 21).Cheng JM, Garcia-Garcia HM, de Boer SP, Kardys I, Heo JH, Akkerhuis KM, Oemrawsingh RM, van Domburg RT, Ligthart J, Witberg KT, Regar E, Serruys PW, van Geuns RJ and Boersma E: In vivo detection of high-risk coronary plaques by radiofrequency intravascular ultrasound and cardiovascular outcome: results of the ATHEROREMO-IVUS study. Eur Heart J, 2014; 35: 639-647 [DOI] [PubMed] [Google Scholar]
- 22).Park KW, Kang J, Kang SH, Ahn HS, Kang HJ, Koo BK, Chae IH, Youn TJ, Oh BH, Park YB, Kandzari D and Kim HS: The impact of residual coronary lesions on clinical outcomes after percutaneous coronary intervention: Residual SYNTAX score after percutaneous coronary intervention in patients from the Efficacy of Xience/Promus versus Cypher in rEducing Late Loss after stENTing (EXCELLENT) registry. Am Heart J, 2014; 167: 384-392.e5 [DOI] [PubMed] [Google Scholar]
- 23).Braga CG, Cid-Alvarez AB, Diéguez AR, Alvarez BA, Otero DL, Sánchez RO, Pena XS, Salvado VG, Trillo-Nouche R and González-Juanatey JR: Prognostic impact of residual SYNTAX score in patients with ST-elevation myocardial infarction and multivessel disease: Analysis of an 8-year all-comers registry. Int J Cardiol, 2017; 243: 21-26 [DOI] [PubMed] [Google Scholar]
- 24).Hwang D, Kang J, Yang HM, Yang S, Park J, Han JK, Kang HJ, Koo BK and Kim HS: Better Prognosis After Complete Revascularization Using Contemporary Coronary Stents in Patients With Chronic Kidney Disease. Circ Cardiovasc Interv, 2019; 12: e007907 [DOI] [PubMed] [Google Scholar]
- 25).Fujino A, Kadohira T, Redfors B, Maehara A, Serruys PW, Mintz GS, Stone GW and Généreux P: Significant association among residual SYNTAX score, non-culprit major adverse cardiac events, and greyscale and virtual histology intravascular ultrasound findings: a substudy from the PROSPECT study. EuroIntervention, 2019; 14: 1676-1684 [DOI] [PubMed] [Google Scholar]
- 26).Garcia S, Sandoval Y, Roukoz H, Adabag S, Canoniero M, Yannopoulos D and Brilakis ES: Outcomes after complete versus incomplete revascularization of patients with multivessel coronary artery disease: a meta-analysis of 89,883 patients enrolled in randomized clinical trials and observational studies. J Am Coll Cardiol, 2013; 62: 1421-1431 [DOI] [PubMed] [Google Scholar]
- 27).Gao G, Zhang D, Song C, Xu H, Yin D, Guan C, Yang Y, Xu B and Dou K: Integrating the residual SYNTAX score to improve the predictive ability of the age, creatinine, and ejection fraction (ACEF) score for cardiac mortality in percutaneous coronary intervention patients. Catheter Cardiovasc Interv, 2020; 95 Suppl 1: 534-541 [DOI] [PubMed] [Google Scholar]