

Abstract
Background
The long‐term impact of newly discovered, asymptomatic abnormal ankle–brachial index (ABI) in patients with significant coronary artery disease is limited.
Methods and Results
Between January 2006 and December 2009, ABI was evaluated in 2424 consecutive patients with no history of claudication or peripheral artery disease who had significant coronary artery disease. We previously reported a 3‐year result; therefore, the follow‐up period was extended. The primary end point was a composite of all‐cause death, myocardial infarction (MI), and stroke over 7 years. Of the 2424 patients with significant coronary artery disease, 385 had an abnormal ABI (ABI ≤0.9 or ≥1.4). During the follow‐up period, the rate of the primary outcome was significantly higher in the abnormal ABI group than in the normal ABI group (P<0.001). The abnormal ABI group had a significantly higher risk of composite of all‐cause death/MI/stroke than the normal ABI group, after adjustment with multivariable Cox proportional hazards regression analysis (hazard ratio [HR], 2.07; 95% CI, 1.67–2.57; P<0.001) and propensity score–matched analysis (HR, 1.97; 95% CI, 1.49–2.60; P<0.001). In addition, an abnormal ABI was associated with a higher risk of all‐cause death, MI, and stroke, but not repeat revascularization.
Conclusions
Among patients with significant coronary artery disease, asymptomatic abnormal ABI was associated with sustained and increased incidence of composite of all‐cause death/MI/stroke, all‐cause death, MI, and stroke during extended follow‐up over 7 years.
Keywords: ankle–brachial index, asymptomatic diseases, atherosclerosis, coronary artery disease
Subject Categories: Coronary Artery Disease, Peripheral Vascular Disease
Nonstandard Abbreviations and Acronyms
- PSM
propensity‐score matching
- PVD
polyvascular disease
- RR
repeat revascularization
Clinical Perspective
What Is New?
-
●
This study has shown that patients with significant coronary artery disease accompanied by asymptomatic abnormal ankle–brachial index have an increased risk of death, myocardial infarction, and stroke during a long‐term follow‐up period (beyond 3 years and up to 7 years).
What Are the Clinical Implications?
-
●
Routine ankle–brachial index measurement of patients with significant coronary artery disease may provide prognostic parameters of future atherosclerotic events for adequate management.
The ankle–brachial index (ABI) is a simple, noninvasive, risk‐free, and cost‐effective diagnostic tool. 1 Observational studies 2 , 3 , 4 , 5 , 6 , 7 and meta‐analyses 8 , 9 have shown that individuals with an abnormal ABI have an increased risk of lower extremity peripheral artery disease (PAD), independent of symptoms and other cardiovascular events. In addition to patients with known cardiovascular disease, individuals in the general population with an abnormal ABI are at a higher risk of cardiovascular events than those with a normal ABI. 10 , 11 , 12 However, >50% of individuals with PAD are unaware of their disease because of atypical, vague, or nonspecific symptoms. 13 We previously reported that an abnormal, newly revealed, asymptomatic ABI among patients with significant coronary artery disease (CAD) was associated with a higher incidence of composite all‐cause death/myocardial infarction (MI)/stroke and stroke over a 3‐year period. 14 Therefore, ABI may be strongly considered not only for PAD diagnosis, but also for future cardiovascular risk prediction. To further characterize the long‐term impact of abnormal ABI on clinical outcomes in patients with significant CAD, we present the 7‐year follow‐up results of this study.
Methods
The data that support the findings of this study are available from the corresponding author upon reasonable request. The study design, method, and 3‐year outcomes were reported previously. 14 Among 2543 patients who underwent diagnostic coronary angiography, 2424 patients with significant CAD were enrolled in the present study. All patients who were admitted for diagnostic coronary angiography underwent an ABI test during the same hospitalization period. The selected patients had no history of claudication, previous assessment, or diagnosis of PAD. Patients who had never been evaluated for PAD using an ABI test, or who had never been treated for PAD, were enrolled after a detailed review of all available medical records or a dedicated claudication questionnaire. 15 The 2424 patients with significant CAD (>50% stenosis in major epicardial coronary arteries, size ≥2.5 mm) were categorized into normal ABI (n=2039, 84.1%) and abnormal ABI groups (n=385, 15.9%). All enrolled patients provided written informed consent, and the ethics committee of Asan Medical Center approved the study design and allowed the use of clinical data.
End Points, Definitions, and Follow‐Up
The primary end points were a composite of all‐cause death, MI, and stroke. The secondary end points were all‐cause death, MI, stroke, and repeat revascularization (RR). Deaths from any cause (cardiovascular or noncardiovascular) were also included. The diagnosis of MI during follow‐up was based on the universal definition of MI. 16 Stroke, represented by a new neurological deficit, was confirmed by a neurologist. 17 RR was defined as any interventional procedure using percutaneous coronary intervention or coronary artery bypass graft after the planned index procedure. All events were based on the clinical diagnosis of each patient by their physicians and were adjudicated by an independent group of clinicians.
The ABI for each leg was measured as described previously 18 using a Doppler ultrasound device (Nicolet VasoGuard; Viasys Healthcare, Conshohocken, PA). The sequence of limb pressure measurements consisted of the first arm, first posterior tibial artery, first dorsalis pedis artery, second posterior tibial artery, second dorsalis pedis artery, and second arm. Each pressure was measured twice, and the average of each pressure was used in calculations. The ABI of each leg was calculated by dividing the posterior tibial or dorsalis pedis pressure, whichever was higher, by the right or left arm systolic blood pressure, whichever was higher. The selected ABI was the lowest of the values for the left and right legs. If the ABI was between 0.80 and 1.00, the measurements were repeated. An abnormal ABI was defined as ≤0.90 or ≥1.4. 19 , 20 The ABI threshold for detecting PAD was defined as ≤0.90, based on studies showing ≈80% sensitivity and >90% specificity, 21 , 22 , 23 and a high ABI (>1.40) was defined as abnormal, because it could predict the incidence of PAD with 60% to 80% accuracy. 24 , 25 This definition includes the possibility that a low ABI (≤0.90) and a high ABI (>1.40) may be associated with increased mortality and other adverse events. 2 , 26
To validate the complete follow‐up data, information about vital status or clinical events was obtained from the National Population Registry of the Korea National Statistical Office on February 28, 2019 using a unique personal identification number. To ensure accurate assessment of clinical end points, additional information was obtained from visits or telephone interviews with living patients or family members, as well as from medical records obtained from other hospitals.
Statistical Analysis
All statistical analyses were performed using SPSS software (version 24; IBM, Armonk, NY) or R software (version 3.6.3; R Foundation for Statistical Computing, Vienna, Austria). Analyses of the baseline characteristics were reported previously. 14 Patient demographics, cardiac and other coexisting conditions, and information on medication were compared using the Student t test for continuous variables and the χ2 or Fisher exact test for categorical variables. Based on previous studies, ABI survival curves were drawn using Kaplan‐Meier analysis and compared using the log‐rank test. In addition, the univariate Cox proportional hazards model was used to estimate the effects of the variables on survival. Univariate and multivariate Cox regression analyses were used for risk factor analysis of the primary end points. All baseline characteristics were tested in a previous study, and the variables were applied to multivariate analysis if the P value was ≤0.01 in univariate analysis. The final model was obtained using a backward stepwise method. To reduce the effect of potential confounding variables in an observational study, we performed rigorous adjustments for differences in the baseline characteristics of patients using propensity‐score matching (PSM). 27 The variables and details related to PSM analysis are described in Data S1. The validity of the propensity scores was checked using the Hosmer‐Lemeshow test (P>0.2). To conduct PSM, observations within a 0.1‐caliper range were matched, and finally, 359 matched pairs of subjects were selected. Following PSM, the baseline covariates were compared between the 2 groups to check for comparability (Table S1). Statistical significance and the estimated effect of treatment on outcomes were obtained using conditional Cox regression models, with robust standard errors that accounted for the clustering of matched pairs. Likewise, in the propensity‐score matched cohort, survival curves according to the ABI were drawn using Kaplan‐Meier estimates and compared using the log‐rank test. Two‐sided P values <0.05 indicated statistical significance.
Results
Between January 2006 and December 2009, 2543 patients underwent diagnostic coronary angiography. Among them, 119 patients with no significant CAD were excluded (114 patients in the normal ABI group and 5 patients in the abnormal ABI group). The remaining 2424 patients (95.3%) with significant CAD and without clinical claudication and no previous diagnosis of PAD or intermittent claudication (including ABI) were enrolled in the study. Of the 2424 patients with significant CAD, 1973 (81.4%) had coronary revascularization, and 385 (15.9%) had abnormal ABIs, including 348 (14.4%) with ABI ≤0.90 and 37 (1.5%) with ABI ≥1.40. Among the 385 patients with abnormal ABIs who had significant CAD, 259 (67.3%) were managed with medical therapy, and 126 (32.7%) required revascularization (endovascular therapy, 101 [26.2%]; bypass surgery, 25 [6.5%]). In contrast, among the 5 patients with abnormal ABIs who had no significant CAD, 4 were managed with endovascular therapy, and one was managed with medical therapy (Figure 1).
Figure 1. Flow diagram illustrating the selection of the study population.
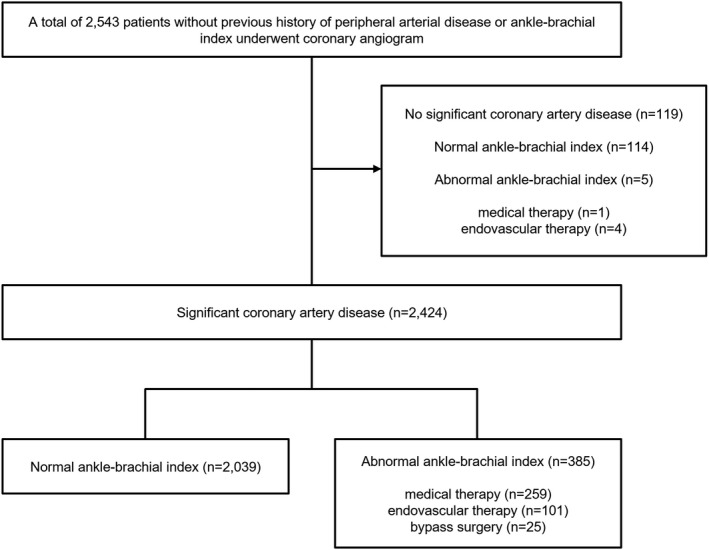
Of the 2543 patients, 390 (15.3%) had an abnormal ankle–brachial index (ABI). Of the 2424 patients with at least 1 significant stenosis (≥50%) in a major epicardial coronary artery, 385 (15.9%) had an abnormal ABI, including 348 (14.4%) with ABI ≤0.9 and 37 (1.5%) with ABI ≥1.4.
The baseline characteristics of the 2424 patients according to ABI categorization have been reported previously (Table 1). 14 In general, the abnormal ABI group was associated with higher risk profiles than the normal ABI group.
Table 1.
Baseline Clinical Characteristics of the Overall Study Population and of Patients With Normal and Abnormal ABI
| Variable | Overall, n=2424 | Abnormal ABI, n=385 | Normal ABI, n=2039 | P value |
|---|---|---|---|---|
| Demographic characteristics | ||||
| Age, y | 62.9±9.1 | 66.5±8.5 | 62.2±9.1 | <0.001 |
| Male sex | 1779 (73.4) | 317 (82.3) | 1462 (71.7) | <0.001 |
| Cardiac or coexisting conditions | ||||
| Diabetes | 1401 (57.8) | 246 (63.9) | 1155 (56.6) | 0.008 |
| Hypertension | 1644 (67.8) | 308 (80.0) | 1336 (65.5) | <0.001 |
| Hyperlipidemia | 2001 (82.5) | 284 (73.8) | 1717 (84.2) | <0.001 |
| Current smoker | 631 (26.0) | 129 (33.5) | 502 (24.6) | <0.001 |
| Previous stroke | 261 (10.8) | 91 (23.6) | 170 (8.3) | <0.001 |
| Previous PCI | 549 (22.6) | 103 (26.8) | 446 (21.9) | 0.036 |
| Previous CABG | 91 (3.8) | 22 (5.7) | 69 (3.4) | 0.023 |
| Previous MI | 192 (7.9) | 38 (9.9) | 154 (7.6) | 0.122 |
| Renal failure | 156 (6.4) | 70 (18.2) | 86 (4.2) | <0.001 |
| LM disease | 339 (14.0) | 64 (16.6) | 275 (13.5) | 0.108 |
| Multivessel disease | 1496 (61.7) | 289 (75.1) | 1207 (59.2) | <0.001 |
| Ejection fraction, % | 58.5±9.1 | 55.6±10.9 | 59.2±8.5 | <0.001 |
| Heart failure, EF <40% | 84 (5.6) | 32 (11.2) | 52 (4.3) | <0.001 |
| Coronary revascularization | 1910 (78.8) | 291 (79.0) | 1619 (79.4) | 0.103 |
| PCI | 1518 (62.6) | 192 (49.9) | 1326 (65.0) | <0.001 |
| CABG | 392 (16.2) | 99 (29.1) | 293 (14.4) | <0.001 |
| Clinical indication | 0.008 | |||
| Silent/stable angina | 1646 (67.9) | 239 (62.1) | 1407 (69.0) | |
| Unstable angina | 626 (25.8) | 111 (28.8) | 515 (25.3) | |
| NSTEMI | 97 (4.0) | 24 (6.2) | 73 (3.6) | |
| STEMI | 55 (2.3) | 11 (2.9) | 44 (2.2) | |
| Medications | ||||
| Aspirin | 2118 (87.4) | 323 (84.2) | 1794 (88.0) | 0.044 |
| Clopidogrel | 1596 (65.8) | 234 (60.8) | 1323 (66.8) | 0.022 |
| Cilostazol | 210 (8.7) | 64 (16.6) | 146 (7.2) | <0.001 |
| Statin | 1872 (77.2) | 252 (65.5) | 1620 (79.5) | <0.001 |
| ACEI/ARB | 935 (38.6) | 172 (44.7) | 763 (37.4) | 0.008 |
| β‐blocker | 1281 (52.8) | 181 (47.0) | 1100 (53.9) | 0.014 |
| CCB | 1812 (74.8) | 265 (68.8) | 1547 (75.9) | 0.002 |
| Nitrate | 1356 (55.9) | 209 (54.3) | 1147 (56.3) | 0.501 |
Data are shown as mean (SD) for continuous variables and as absolute numbers (percentages) for dichotomous variables. ABI indicates ankle–brachial index; ACEI indicates angiotensin‐converting enzyme inhibitor; ARB, angiotensin receptor blocker; CABG, coronary artery bypass graft surgery; CCB, calcium channel blocker; EF, ejection fraction; LM, left main coronary artery; MI, myocardial infarction; NSTEMI, non–ST‐segment–elevation myocardial infarction; PCI, percutaneous coronary intervention; and STEMI, ST‐segment–elevation myocardial infarction.
Of the patients with significant CAD, 359 matched pairs were selected by PSM (Table S1). After PSM, there were no significant differences in the baseline characteristics between the 2 groups, except that cilostazol was more frequently used in the abnormal ABI group.
Outcomes
Unadjusted Outcomes in the Entire Cohort
The median follow‐up time was 6.73 years (interquartile range, 4.84–8.00). During follow‐up, 346 patients died, 77 had MI, 123 had a stroke, and 264 underwent RR. Consequently, the primary composite end point was confirmed in 429 patients. The number of events increased steadily throughout the follow‐up period. Kaplan‐Meier curves showed that there was an increasing divergence between the 2 groups during the follow‐up period.
Patients with an abnormal ABI had significantly higher rates of composite all‐cause death/MI/stroke (40.8% versus 13.3%, P<0.001), all‐cause death (31.9% versus 9.2%, P<0.001), MI (6.5% versus 2.2%, P<0.001), and stroke (9.6% versus 3.4%, P<0.001) over the course of 7 years. However, the RR rate was not significantly different between the 2 groups (11.2% versus 10.3%, P=0.302) (Table 2, Figure 2). There were no significant differences in ABI values between individual clinical situations (1.08±0.19 in silent or stable angina, 1.06±0.21 in unstable angina, 1.06±0.26 in non–ST‐segment–elevation MI, and 1.05±0.25 in ST‐segment–elevation MI, respectively; P=0.26).
Table 2.
Clinical Outcomes of the Entire Cohort According to ABI
| Outcome | Outcome rates | Multivariate adjusted* | |||
|---|---|---|---|---|---|
| Normal ABI, n=2039 | Abnormal ABI, n=385 | P value † | Hazard ratio (95% CI)* | P value | |
| Primary end point | |||||
| All‐cause death, MI, or stroke | 272 (13.3) | 157 (40.8) | <0.001 | 2.07 (1.67–2.57) | <0.001 |
| Secondary end point | |||||
| All‐cause death | 187 (9.2) | 123 (31.9) | <0.001 | 1.97 (1.53–2.53) | <0.001 |
| MI | 45 (2.2) | 25 (6.5) | <0.001 | 2.40 (1.43–4.04) | 0.001 |
| Stroke | 69 (3.4) | 37 (9.6) | <0.001 | 2.17 (1.41–3.34) | <0.001 |
| Repeat revascularization | 209 (10.3) | 43 (11.2) | 0.302 | N/A | N/A |
Data are shown as the number of events (estimated cumulative incidence rate based on Kaplan‐Meier curve) over 7 years. ABI indicates ankle–brachial index; and MI, myocardial infarction.
N/A, not available.
P values are based on log‐rank tests.
Hazard ratios of patients with an abnormal ABI compared with those with a normal ABI were measured using multivariate backward stepwise Cox proportional hazard models, which included all variables listed in Table 1.
Figure 2. Kaplan‐Meier curves of the outcomes of the entire cohort of patients with normal and abnormal ankle–brachial index (ABI).

A, Outcomes for death, myocardial infarction, and stroke. B, Outcomes for event‐free survival. C, Myocardial infarction. D, Stroke. E, Repeat revascularization event‐free survival rates (at 7 years) were derived from paired Kaplan‐Meier curves.
After multivariate analysis, the primary end point was significantly higher in the abnormal ABI group (hazard ratio [HR], 2.07; 95% CI, 1.67–2.57; P<0.001). Among the secondary end points, all‐cause death (HR, 1.97; 95% CI, 1.53–2.53; P<0.001), MI (HR, 2.40; 95% CI, 1.43–4.04; P=0.001), and stroke (HR, 2.17; 95% CI, 1.41–3.34; P<0.001) were also significantly higher in the abnormal group than in the normal ABI group.
Adjusted Outcomes in the Propensity‐Matched Cohort
The incidence of clinical outcomes over the course of 7 years was analyzed in 359 propensity score–matched pairs. Compared with patients with a normal ABI, those with an abnormal ABI had a significantly higher incidence rate of composite all‐cause death/MI/stroke (38.4% versus 21.2%; HR, 1.97; 95% CI, 1.49–2.60; P<0.001), all‐cause death (29.2% versus 17.5%; HR, 1.72; 95% CI, 1.26–2.35; P=0.001), MI (6.4% versus 2.2%; HR, 3.07; 95% CI, 1.37–6.86; P=0.004), and stroke (9.7% versus 4.2%; HR, 2.45; 95% CI, 1.34–4.49, P=0.003). However, the risk of RR was not significantly different between the normal and abnormal ABI groups (11.4% versus 7.5%, P=0.058) (Table 3, Figure 3).
Table 3.
Clinical Outcomes of the Propensity‐Score Matched Cohort According to ABI
| Outcome | Normal ABI, n=359 | Abnormal ABI, n=359 | Hazard ratio (95% CI)* | P value |
|---|---|---|---|---|
| Event rate for 7‐year follow‐up | Event rate for 7‐year follow‐up | |||
| All‐cause death, MI, or stroke | 76 (21.2) | 157 (38.4) | 1.97 (1.49–2.60) | <0.001 |
| All‐cause death | 63 (17.5) | 105 (29.2) | 1.72 (1.26–2.35) | 0.001 |
| MI | 8 (2.2) | 23 (6.4) | 3.07 (1.37–6.86) | 0.004 |
| Stroke | 15 (4.2) | 35 (9.7) | 2.45 (1.34–4.49) | 0.003 |
| Repeat revascularization | 27 (7.5) | 41 (11.4) | 1.59 (0.98–2.59) | 0.058 |
Data are shown as the number of events (estimated cumulative incidence rate based on Kaplan‐Meier curve) for the 7‐year follow‐up. ABI indicates ankle–brachial index; and MI, myocardial infarction.
Hazard ratios of patients with an abnormal ABI compared with those with a normal ABI were measured using Cox proportional hazard models.
Figure 3. Kaplan‐Meier curves of the outcomes of propensity‐score matched patients with normal and abnormal ankle–brachial index (ABI).
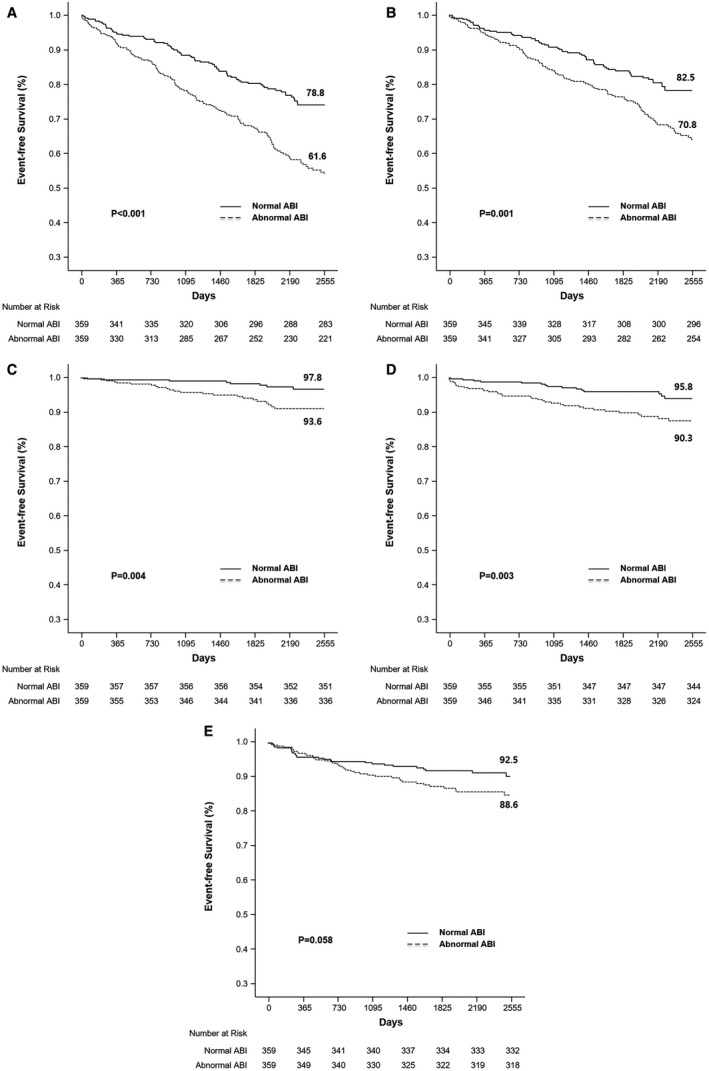
Propensity‐score matching of the entire cohort of patients yielded 359 matched pairs. A, Outcomes for all‐cause death, myocardial infarction, and stroke. B, Outcomes for event‐free survival C, Myocardial infarction. D, Stroke. E, Repeat revascularization event‐free survival rates (at 7 years) were derived from paired Kaplan–Meier curves.
Dose‐Response Gradient Between ABI Values and Adverse Events
The risk for composite all‐cause death/MI/stroke over a 7‐year follow‐up period for abnormal ABI formed a reverse J‐shaped curve according to the ABI values. For ABIs ≤0.90, the unadjusted HR increased as ABI decreased. Similarly, the HR increased in the group with ABI >1.40 (HR, 2.54; 95% CI, 1.43–4.53) (Figure S1). When the ABI groups were divided into 3 categories (low, normal, and high), there were significant differences in event rates over the 7‐year period (13.3% in normal, 32.4% in high, and 41.7% in low ABI groups; log‐rank P value <0.001) (Figure 4A). After multivariate Cox proportional hazard analysis, the low‐ABI group showed a significantly higher risk (adjusted HR, 2.19; 95% CI, 1.76–2.73; P<0.001) than the normal‐ABI group; the same result was observed in the PSM analysis (HR, 2.04; 95% CI, 1.53–2.71; P<0.001). In contrast to the low‐ABI group, the high‐ABI group showed no statistical significance in either the multivariate Cox proportional hazard analysis (adjusted HR, 1.16; 95% CI, 0.64–2.10; P=0.63) or PSM analysis (adjusted HR, 1.35; 95% CI, 0.70–2.62; P=0.37), compared with the normal‐ABI group (Figure 4B).
Figure 4. Dose‐response gradient between ankle–brachial index (ABI) values and adverse events.
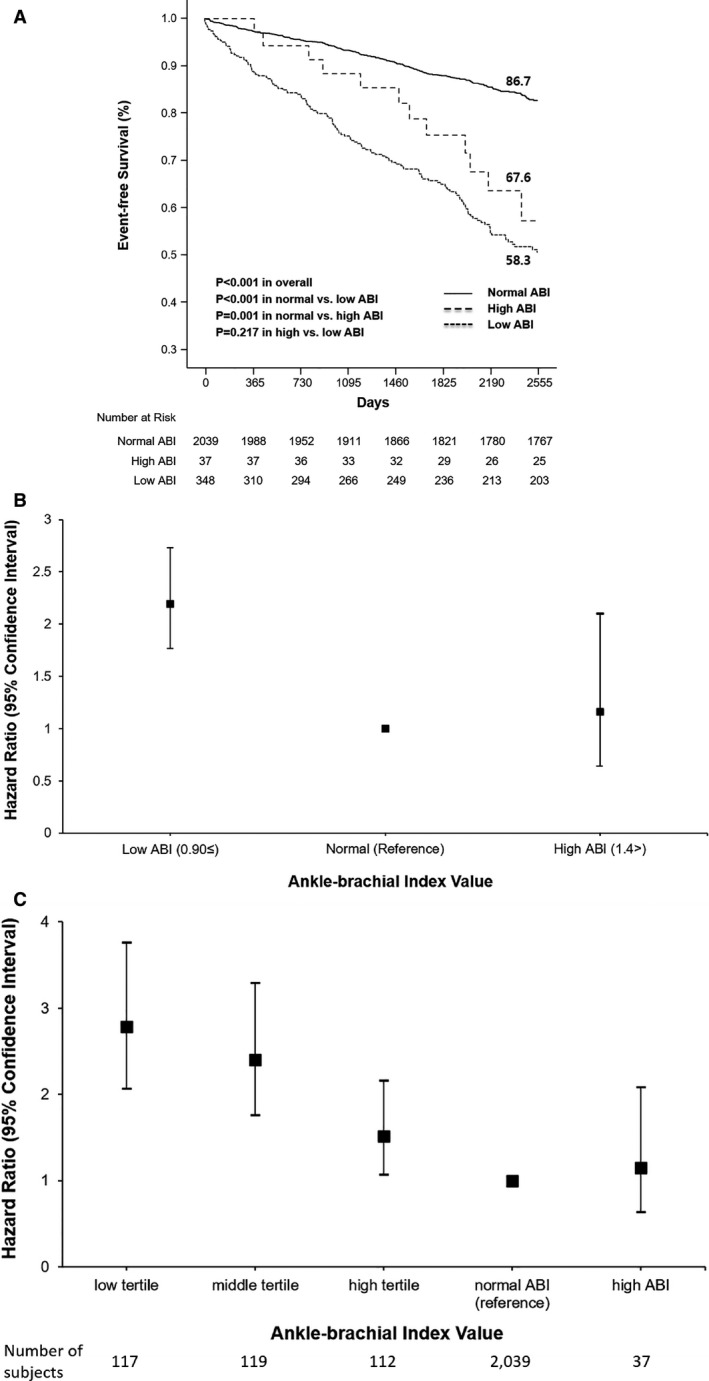
A, Kaplan‐Meier curves for all‐cause death, myocardial infarction, and stroke outcomes according to the ABI values at baseline (low, normal, and high groups). Event‐free survival rates (at 7 years) were derived from paired Kaplan‐Meier curves. B, Adjusted hazard ratios for all‐cause death, myocardial infarction, and stroke at the 7‐year follow‐up according to ABI values at baseline (low, normal, and high groups). Hazard ratios were derived from multivariate Cox proportional hazards analysis. C, Adjusted hazard ratios for all‐cause death, myocardial infarction, and stroke at the 7‐year follow‐up according to the ABI at baseline (low, middle, high tertials in low, normal, and high groups). Hazard ratios were derived from multivariate Cox proportional hazards analyses.
The low‐ABI group was classified into 3 subgroups according to ABI values, using 0.60 and 0.76 as cutoff points. We also analyzed the entire 5‐group cohort as low (≤0.60, n=117), middle (>0.60 and ≤0.76, n=119), and high tertial (>0.76 and ≤0.90, n=112) in the low‐, normal‐ (>0.90 and ≤1.40, n=2039), and high‐ABI groups (>1.40, n=37). The incidence of the primary end point at the 7‐year follow‐up was 50.4% in the low tertial (log‐rank P value <0.001), 40.3% in the middle tertial group (log‐rank P value <0.001), 33.9% in the high tertial group (log‐rank P value <0.001), 13.3% in the normal‐ABI reference group, and 32.4% in the high‐ABI group (log‐rank P=0.001). After multivariate Cox proportional hazard analysis, dose‐response gradients were found between ABI values and adverse events (HR, 2.78; 95% CI, 2.06–3.76 in the low tertial; HR, 2.40; 95% CI, 1.76–3.29 in the middle tertial; HR, 1.52; 95% CI, 1.07–2.16 in the high tertial; and HR, 1.15; 95% CI, 0.64–2.08 in the high‐ABI group), compared with the normal‐ABI group as a reference (Figure 4C).
Discussion
Our extended study clearly demonstrated that newly revealed, asymptomatic abnormal ABI was significantly associated, in a dose‐dependent manner, with long‐term adverse clinical outcomes (composite all‐cause death/MI/stroke, all‐cause death, MI, and stroke) in patients with CAD over a 7‐year follow‐up period. This was a more obvious result compared with previous research, because our previous 3‐year study showed that an abnormal ABI was related only to a composite of all‐cause death, MI, and stroke, and stroke alone. The prevalence of abnormal ABI was 15.9% among patients with significant CAD. These findings suggest that an abnormal ABI can be used as a surrogate marker for future atherosclerotic events in patients with significant CAD.
We reported that abnormal ABIs had a higher incidence of cardiovascular events, including all‐cause death/MI/stroke or stroke, than those with normal ABI, in significant CAD over 3 years. 14 The results of the current extended 7‐year follow‐up study were more apparent than the previous 3‐year study. Our previous short‐term data showed that abnormal ABI could increase cardiovascular risk significantly only in the composite end point (all‐cause death/MI/stroke) and stroke, but not in all‐cause death, MI, or RR. However, a long‐term follow‐up study showed that there was an increasing divergence between the normal and abnormal ABI groups during the entire follow‐up period. In summary, long‐term data demonstrated that an abnormal ABI was significantly associated with worse outcomes in terms of all‐cause death/MI/stroke as well as all‐cause death, MI, and stroke. Our extended follow‐up study made it clear that an abnormal ABI was able to predict future cardiovascular event risk in patients with significant CAD. This study is one of the longest follow‐up studies to investigate the association between abnormal ABI and clinical outcomes in patients with CAD.
The ABI may be the most important tool for identifying polyvascular disease (PVD). 28 Generally, the incidence of PVD is 13% to 22% in patients with CAD, and the presence of PVD in these populations appears significant in predicting interventions or exacerbations, suggesting an overall unique subtype of patients with high risks of morbidity and mortality. It confers a much higher atherothrombotic burden, which necessitates more aggressive medical management, including more potent antithrombotics or lipid‐lowering therapy. 29 , 30 , 31 , 32 Our data showed that the prevalence of an asymptomatic, latent abnormal ABI was 15.9%, which was associated with significantly worse outcomes than a normal ABI with respect to death, MI, and stroke. This phenomenon has been demonstrated using other data from Japanese patients, in which the ABI provided additional information for the prediction of future cardiovascular events in patients undergoing percutaneous coronary intervention at 4 years. 33 In addition, a recent meta‐analysis showed that an abnormal ABI can predict the incidence of major adverse cardiac events and all‐cause mortality in patients with CAD. 34 Furthermore, ABI measurement has been shown to improve the accuracy of cardiovascular risk prediction beyond the traditional Framingham Risk Score in high‐risk patients. A low ABI was associated with approximately twice the 10‐year total mortality, cardiovascular mortality, and major coronary event rates than the overall rate in each Framingham Risk Score category. 8 Despite this, recent guidelines do not encourage routine screening for PVD. We must gather newer evidence concerning the potential benefits of targeted screening and therapy for PVD. To enhance the likelihood of evaluation of PVD, routine ABI measurement should be recommended in appropriate patients for adequate risk stratification and management.
Study Limitations
The major limitation of this study is that our evaluation used observational cohort data and was not randomized. This may have led to an unintended underestimation or overestimation of the prevalence of ABI, clinical events, and hidden confounding variables, which could have resulted in a biased outcome. We attempted to minimize any errors in the estimation of incidence by standardizing the inclusion criteria using available resources, such as a detailed review of all available medical records. Next, we defined significant coronary stenosis as >50% stenosis of the epicardial coronary artery. However, the current standard definition is >50% stenosis of the left main coronary artery, >70% stenosis in a major coronary artery, or 30% to 70% stenosis with fractional flow reserve ≤0.8. This is inconsistent with the definition of our study, and another limitation is that the fractional flow reserve threshold that requires intervention for intermediate stenotic lesions has not been presented. Third, ≈38% of patients with abnormal ABI had revascularization (either endovascular therapy or bypass surgery). According to the American College of Cardiology/American Heart Association and European Society of Cardiology guidelines, asymptomatic patients with PAD are generally not indicative of revascularization. If there is damage to the lower extremity nerves because of diabetes, symptoms may not be felt properly or a patient may complain of atypical pain although the ABI value is low (ie, PAD is present). Patients with physical disability may not complain of pain because their walking performance is not enough to cause pain. In addition, even in the case of aorto‐iliac artery disease discovered by chance, the collateral artery may develop well, and symptoms may not be discovered if additional tests such as the treadmill test are not performed. However, it is known that asymptomatic PAD has a worse prognosis than intermittent claudication. 35 More than 60% of our subjects had diabetes, and there were a considerable number of elderly patients. Therefore, our study subjects may have included patients in the above example. Based on this evidence, we selected and treated PAD patients with no symptoms through a multidisciplinary approach to revascularization only when the ABI value was extremely low, there was definite aorto‐iliac artery disease, and the symptoms were ambiguous, although the peripheral circulation was poor.
From an analytical perspective, our study is an observational cohort study, which may mask confounding variables resulting in selection bias with respect to patients' symptoms and prior evaluation history. Modification of inclusion and exclusion criteria may improve the importance of the study through a better evaluation. Using multivariate analysis and PSM, a rigorous adjustment was performed to reduce unexpected bias. Nevertheless, the PSM method using the log‐rank test to compare Kaplan‐Meier survival curves may fail to account for potential variables, such as lifestyle modifications, which could have affected the results of the study. However, considering the difficulty in performing randomized trials to evaluate the impact of abnormal, asymptomatic ABI on future clinical outcomes, our analysis is meaningful.
Conclusions
Abnormal ABI in patients with significant CAD was associated with an increased incidence of major cardiovascular events, including the composite of all‐cause death/MI/stroke, all‐cause death, MI, and stroke, for long‐term follow‐up. Abnormal ABI could be a valuable tool for evaluating the prognosis of patients with significant CAD.
Sources of Funding
This study was supported by a grant from the Asan Institute for Life Sciences (2019IE7054), Asan Medical Center, Seoul, South Korea.
Disclosures
None.
Supporting information
Data S1
Figure S1
Table S1
Acknowledgments
J.‐Y.L., S.‐J.L., and S.‐W.L. conceived and designed the study. T.O.K., Y.Y., Y.J.J., H.P., J.L., J.H., J.H.K., P.H.L., S.‐J.K., Y.‐H.K., C.W.L., and S.‐W.P. contributed to the acquisition, analysis, and interpretation of data. J.‐Y.L. and S.‐J.L. wrote and revised the article. J.‐Y.L. and S.‐J.L. contributed equally to this study. S.‐W.L. is responsible for the overall contents as a corresponding author.
J. Y. Lee and S. J. Lee contributed equally.
For Sources of Funding and Disclosures, see page 11.
References
- 1. Alahdab F, Wang AT, Elraiyah TA, Malgor RD, Rizvi AZ, Lane MA, Prokop LJ, Montori VM, Conte MS, Murad MH. A systematic review for the screening for peripheral arterial disease in asymptomatic patients. J Vasc Surg. 2015;61:42S–53S. doi: 10.1016/j.jvs.2014.12.008. [DOI] [PubMed] [Google Scholar]
- 2. Criqui MH, McClelland RL, McDermott MM, Allison MA, Blumenthal RS, Aboyans V, Ix JH, Burke GL, Liu K, Shea S. The ankle‐brachial index and incident cardiovascular events in the mesa (multi‐ethnic study of atherosclerosis). J Am Coll Cardiol. 2010;56:1506–1512. doi: 10.1016/j.jacc.2010.04.060. [DOI] [PMC free article] [PubMed] [Google Scholar]
- 3. Criqui MH, Langer RD, Fronek A, Feigelson HS, Klauber MR, McCann TJ, Browner D. Mortality over a period of 10 years in patients with peripheral arterial disease. N Engl J Med. 1992;326:381–386. doi: 10.1056/NEJM199202063260605. [DOI] [PubMed] [Google Scholar]
- 4. Leng GC, Fowkes FG, Lee AJ, Dunbar J, Housley E, Ruckley CV. Use of ankle brachial pressure index to predict cardiovascular events and death: a cohort study. BMJ. 1996;313:1440–1444. doi: 10.1136/bmj.313.7070.1440. [DOI] [PMC free article] [PubMed] [Google Scholar]
- 5. Li X, Luo Y, Xu Y, Li J, Hu D. Relationship of ankle‐brachial index with all‐cause mortality and cardiovascular mortality after a 3‐year follow‐up: the China ankle‐brachial index cohort study. J Hum Hypertens. 2010;24:111–116. doi: 10.1038/jhh.2009.49. [DOI] [PubMed] [Google Scholar]
- 6. Resnick HE, Lindsay RS, McDermott MM, Devereux RB, Jones KL, Fabsitz RR, Howard BV. Relationship of high and low ankle brachial index to all‐cause and cardiovascular disease mortality: the strong heart study. Circulation. 2004;109:733–739. doi: 10.1161/01.CIR.0000112642.63927.54. [DOI] [PubMed] [Google Scholar]
- 7. Newman AB, Shemanski L, Manolio TA, Cushman M, Mittelmark M, Polak JF, Powe NR, Siscovick D. Ankle‐arm index as a predictor of cardiovascular disease and mortality in the cardiovascular health study. The cardiovascular health study group. Arterioscler Thromb Vasc Biol. 1999;19:538–545. doi: 10.1161/01.ATV.19.3.538. [DOI] [PubMed] [Google Scholar]
- 8. Ankle Brachial Index C, Fowkes FG, Murray GD, Butcher I, Heald CL, Lee RJ, Chambless LE, Folsom AR, Hirsch AT, Dramaix M, et al. Ankle brachial index combined with framingham risk score to predict cardiovascular events and mortality: a meta‐analysis. JAMA. 2008;300:197–208. doi: 10.1001/jama.300.2.197 [DOI] [PMC free article] [PubMed] [Google Scholar]
- 9. Golomb BA, Dang TT, Criqui MH. Peripheral arterial disease: morbidity and mortality implications. Circulation. 2006;114:688–699. doi: 10.1161/CIRCULATIONAHA.105.593442. [DOI] [PubMed] [Google Scholar]
- 10. Aboyans V, Lacroix P, Postil A, Guilloux J, Rolle F, Cornu E, Laskar M. Subclinical peripheral arterial disease and incompressible ankle arteries are both long‐term prognostic factors in patients undergoing coronary artery bypass grafting. J Am Coll Cardiol. 2005;46:815–820. doi: 10.1016/j.jacc.2005.05.066. [DOI] [PubMed] [Google Scholar]
- 11. Agnelli G, Cimminiello C, Meneghetti G, Urbinati S. Polyvascular Atherothrombosis Observational Survey (PATHOS) Investigators . Low ankle‐brachial index predicts an adverse 1‐year outcome after acute coronary and cerebrovascular events. J Thromb Haemost. 2006;4:2599–2606. doi: 10.1111/j.1538-7836.2006.02225.x. [DOI] [PubMed] [Google Scholar]
- 12. Purroy F, Coll B, Oró M, Setó E, Piñol‐Ripoll G, Plana A, Quílez A, Sanahuja J, Brieva L, Vega L, et al. Predictive value of ankle brachial index in patients with acute ischaemic stroke. Eur J Neurol. 2010;17:602–606. doi: 10.1111/j.1468-1331.2009.02874.x. [DOI] [PubMed] [Google Scholar]
- 13. Novo S. Classification, epidemiology, risk factors, and natural history of peripheral arterial disease. Diabetes Obes Metab. 2002;4:S1–S6. doi: 10.1046/j.1463-1326.2002.0040s20s1.x. [DOI] [PubMed] [Google Scholar]
- 14. Lee JY, Lee SW, Lee WS, Han S, Park YK, Kwon CH, Jang JY, Cho YR, Park GM, Ahn JM, et al. Prevalence and clinical implications of newly revealed, asymptomatic abnormal ankle‐brachial index in patients with significant coronary artery disease. JACC Cardiovasc Interv. 2013;6:1303–1313. doi: 10.1016/j.jcin.2013.08.008. [DOI] [PubMed] [Google Scholar]
- 15. Lend G, Fowkes F. The edinburgh claudication questionnaire: an improved version of the WHO/Rose questionnaire for use in epidemiological surveys. J Clin Epidemiol. 1992;45:1101–1109. doi: 10.1016/0895-4356(92)90150-L. [DOI] [PubMed] [Google Scholar]
- 16. Thygesen K, Alpert JS, Jaffe AS, Simoons ML, Chaitman BR, White HD, Joint ESC/ACCF/AHA/WHF Task Force for the Universal Definition of Myocardial Infarction , Katus HA, Lindahl B, Morrow DA, et al. Third universal definition of myocardial infarction. Circulation. 2012;126:2020‐2035. doi: 10.1161/CIR.0b013e31826e1058. [DOI] [PubMed] [Google Scholar]
- 17. Kappetein AP, Head SJ, Généreux P, Piazza N, van Mieghem NM, Blackstone EH, Brott TG, Cohen DJ, Cutlip DE, van Es GA, et al. Updated standardized endpoint definitions for transcatheter aortic valve implantation: the valve academic research consortium‐2 consensus document. J Am Coll Cardiol. 2012;60:1438–1454. doi: 10.1016/j.jacc.2012.09.001. [DOI] [PubMed] [Google Scholar]
- 18. Aboyans V, Criqui MH, Abraham P, Allison MA, Creager MA, Diehm C, Fowkes FGR, Hiatt WR, Jönsson B, Lacroix P, et al. Measurement and interpretation of the ankle‐brachial index: a scientific statement from the American Heart Association. Circulation. 2012;126:2890–2909. doi: 10.1161/CIR.0b013e318276fbcb. [DOI] [PubMed] [Google Scholar]
- 19. Aboyans V, Ricco J‐B, Bartelink M‐L, Björck M, Brodmann M, Cohnert T, Collet J‐P, Czerny M, De Carlo M, Debus S, et al. ESC guidelines on the diagnosis and treatment of peripheral arterial diseases, in collaboration with the European Society for Vascular Surgery (ESVS) document covering atherosclerotic disease of extracranial carotid and vertebral, mesenteric, renal, upper and lower extremity arteries endorsed by: the European Stroke Organization (ESO) the task force for the diagnosis and treatment of peripheral arterial diseases of the European Society of Cardiology (ESC) and of the European Society for Vascular Surgery (ESVS). Eur Heart J. 2017;2018:763–816. doi: 10.1093/eurheartj/ehx095. [DOI] [PubMed] [Google Scholar]
- 20. Gerhard‐Herman MD, Gornik HL, Barrett C, Barshes NR, Corriere MA, Drachman DE, Fleisher LA, Fowkes FGR, Hamburg NM, Kinlay S, et al. 2016 AHA/ACC guideline on the management of patients with lower extremity peripheral artery disease: a report of the American College of Cardiology/American Heart Association task force on clinical practice guidelines. Circulation. 2017;135:e726–e779. doi: 10.1161/CIR.0000000000000471. [DOI] [PMC free article] [PubMed] [Google Scholar]
- 21. Carter SA. Indirect systolic pressures and pulse waves in arterial occlusive diseases of the lower extremities. Circulation. 1968;37:624–637. [DOI] [PubMed] [Google Scholar]
- 22. Lijmer JG, Hunink MG, van den Dungen JJ, Loonstra J, Smit AJ. Roc analysis of noninvasive tests for peripheral arterial disease. Ultrasound Med Biol. 1996;22:391–398. doi: 10.1016/0301-5629(96)00036-1. [DOI] [PubMed] [Google Scholar]
- 23. Yao ST, Hobbs JT, Irvine WT. Ankle systolic pressure measurements in arterial disease affecting the lower extremities. Br J Surg. 1969;56:676–679. doi: 10.1002/bjs.1800560910. [DOI] [PubMed] [Google Scholar]
- 24. Suominen V, Rantanen T, Venermo M, Saarinen J, Salenius J. Prevalence and risk factors of pad among patients with elevated abi. Eur J Vasc Endovasc Surg. 2008;35:709–714. doi: 10.1016/j.ejvs.2008.01.013. [DOI] [PubMed] [Google Scholar]
- 25. Aboyans V, Ho E, Denenberg JO, Ho LA, Natarajan L, Criqui MH. The association between elevated ankle systolic pressures and peripheral occlusive arterial disease in diabetic and nondiabetic subjects. J Vasc Surg. 2008;48:1197–1203. doi: 10.1016/j.jvs.2008.06.005. [DOI] [PubMed] [Google Scholar]
- 26. Fowkes FG, Price JF, Stewart MC, Butcher I, Leng GC, Pell AC, Sandercock PA, Fox KA, Lowe GD, Murray GD, et al. Aspirin for prevention of cardiovascular events in a general population screened for a low ankle brachial index: a randomized controlled trial. JAMA. 2010;303:841–848. doi: 10.1001/jama.2010.221 [DOI] [PubMed] [Google Scholar]
- 27. Biondi‐Zoccai G, Romagnoli E, Agostoni P, Capodanno D, Castagno D, D'Ascenzo F, Sangiorgi G, Modena MG. Are propensity scores really superior to standard multivariable analysis? Contemp Clin Trials. 2011;32:731–740. doi: 10.1016/j.cct.2011.05.006. [DOI] [PubMed] [Google Scholar]
- 28. Jönelid B, Johnston N, Berglund L, Andrén B, Kragsterman B, Christersson C. Ankle brachial index most important to identify polyvascular disease in patients with non‐ST elevation or ST‐elevation myocardial infarction. Eur J Intern Med. 2016;30:55–60. doi: 10.1016/j.ejim.2015.12.016. [DOI] [PubMed] [Google Scholar]
- 29. Gutierrez JA, Mulder H, Jones WS, Rockhold FW, Baumgartner I, Berger JS, Blomster JI, Fowkes FGR, Held P, Katona BG, et al. Polyvascular disease and risk of major adverse cardiovascular events in peripheral artery disease: a secondary analysis of the EUCLID trial. JAMA Netw Open. 2018;1:e185239. doi: 10.1001/jamanetworkopen.2018.5239. [DOI] [PMC free article] [PubMed] [Google Scholar]
- 30. Eikelboom JW, Connolly SJ, Bosch J, Dagenais GR, Hart RG, Shestakovska O, Diaz R, Alings M, Lonn EM, Anand SS, et al. Rivaroxaban with or without aspirin in stable cardiovascular disease. N Engl J Med. 2017;377:1319–1330. doi: 10.1056/NEJMoa1709118. [DOI] [PubMed] [Google Scholar]
- 31. Jukema JW, Szarek M, Zijlstra LE, de Silva HA, Bhatt DL, Bittner VA, Diaz R, Edelberg JM, Goodman SG, Hanotin C, et al. Alirocumab in patients with polyvascular disease and recent acute coronary syndrome. J Am Coll Cardiol. 2019;74:1167–1176. doi: 10.1016/j.jacc.2019.03.013. [DOI] [PubMed] [Google Scholar]
- 32. Bhatt DL, Peterson ED, Harrington RA, Ou F‐S, Cannon CP, Gibson CM, Kleiman NS, Brindis RG, Peacock WF, Brener SJ, et al. Prior polyvascular disease: risk factor for adverse ischaemic outcomes in acute coronary syndromes. Eur Heart J. 2009;30:1195–1202. doi: 10.1093/eurheartj/ehp099. [DOI] [PubMed] [Google Scholar]
- 33. Hiramori S, Soga Y, Kamioka N, Miura T, Doijiri T, Shirai S, Ando K. Clinical impact of the ankle‐brachial index in patients undergoing successful percutaneous coronary intervention. Circ J. 2018;82:1675–1681. doi: 10.1253/circj.CJ-17-0663. [DOI] [PubMed] [Google Scholar]
- 34. Liu L, Sun H, Nie F, Hu X. Prognostic value of abnormal ankle‐brachial index in patients with coronary artery disease: a meta‐analysis. Angiology. 2020;71:491–497. doi: 10.1177/0003319720911582. [DOI] [PubMed] [Google Scholar]
- 35. McDermott MM, Guralnik JM, Ferrucci L, Tian LU, Liu K, Liao Y, Green D, Sufit R, Hoff F, Nishida T, et al. Asymptomatic peripheral arterial disease is associated with more adverse lower extremity characteristics than intermittent claudication. Circulation. 2008;117:2484–2491. doi: 10.1161/CIRCULATIONAHA.107.736108. [DOI] [PMC free article] [PubMed] [Google Scholar]
Associated Data
This section collects any data citations, data availability statements, or supplementary materials included in this article.
Supplementary Materials
Data S1
Figure S1
Table S1