

Abstract
Peer victimization is common and linked to maladjustment. Prior research has typically identified four peer victimization subgroups: aggressors, victims, aggressive‐victims, and uninvolved. However, findings related to sex and racial‐ethnic differences in subgroup membership have been mixed. Using data collected in September of 2002 and 2003, this study conducted confirmatory latent class analysis of a racially‐ethnically diverse sample of 5415 sixth graders (49% boys; 50.6% Black; 20.9% Hispanic) representing two cohorts from 37 schools in four U.S. communities to replicate the four subgroups and evaluate measurement invariance of latent class indicators across cohort, sex, race‐ethnicity, and study site. Results replicated the four‐class solution and illustrated that sociodemographic differences in subgroup membership were less evident after accounting for differential item functioning.
Abbreviations
- BIC
Bayesian information criterion
- CLCA
confirmatory latent class analysis
- DIF
differential item functioning
- FA
factor analysis
- GA
Georgia
- IL
Illinois
- LCA
latent class analysis
- MIMIC
multiple‐indicator‐multiple‐causes
- MVPP
Multisite Violence Prevention Project
- NASEM
National Academies of Sciences, Engineering & Medicine
- NC
North Carolina
- PBFS
Problem Behavior Frequency Scale
- VA
Virginia
Peer victimization is a significant problem for school age youth (National Academies of Sciences, Engineering & Medicine [NASEM]). Nationally representative surveys estimate that 20%–54% of adolescents are involved in verbal or physical forms of peer victimization (NASEM, 2016; Wang et al., 2009). These rates are concerning given that involvement in peer victimization is associated with a range of short and long‐term adjustment difficulties, including anxiety, depression, peer rejection, suicidality, delinquency, substance use, limited academic success, and incarceration (e.g., McDougall & Vailliancourt, 2015; NASEM, 2016).
There are multiple ways to be involved in peer victimization, and different roles in these experiences are associated with different individual characteristics and patterns of adjustment (see Schwartz et al., 2001 for a review). Prior work has typically identified four subgroups of youth who vary in their role in peer victimization (e.g., Bettencourt & Farrell, 2013; Schwartz et al., 2001). The existence of these distinct subgroups of youth involved in peer victimization has implications for interventions and evaluations of intervention effectiveness. Because existing prevention programs have largely focused on the needs of aggressive youth (e.g., Hektner et al., 2014), they may fail to address the unique difficulties of those involved in peer victimization as victims or as aggressors and victims. Accurate identification of subgroups of aggressive and victimized youth and malleable risk and protective factors predicting subgroup membership will aid school professionals in selecting and implementing appropriate interventions to meet their specific needs. Furthermore, capturing a program's effectiveness to change individual subgroup membership might better represent program impact beyond effects on specific aggressive behavior or victimization experiences. The purpose of this study was to use a large, racially‐ethnically diverse, multi‐site sample of early adolescents to (a) replicate the four subgroups identified in prior work, (b) conduct an in‐depth evaluation of measurement invariance of the aggression and victimization indicators used to determine subgroup membership across key demographic characteristics—namely cohort, sex, race‐ethnicity, and study site—which have demonstrated inconsistent relations with subgroup membership in prior work suggesting the possibility of differential item functioning (DIF), and (c) examine whether and how these subgroups differ on these demographic characteristics.
Developmental considerations in the study of peer victimization
Early adolescence reflects a particularly important developmental period in which to study peer victimization as risk for involvement peaks during this time (Cook et al., 2010; Nylund, Bellmore, et al., 2007). The increase in peer victimization during this period may, in part, be due to the increased emphasis on relationships with peers and the disruption in peer groups that coincides with the transition to larger, less structured middle schools (Nansel et al., 2003; Seidman & French, 2004). During this transition, youth engage in a range of strategies in an effort to establish their position in the broader social network; more skilled youth may use both prosocial and aggressive strategies to achieve social standing (e.g., Hawley, 2014) while less skilled youth may rely primarily on aggressive tactics or submit to being bullied by peers in an effort to gain social acceptance (Brown et al., 2008).
Typologies of peer victimization involvement
The vast majority of studies on peer victimization, whether using theoretically informed cut‐scores or empirically derived classifications, have identified three subgroups of youth involved in peer victimization—non‐victimized aggressors, non‐aggressive victims, and aggressive‐victims—along with a fourth, uninvolved subgroup (e.g., Bettencourt & Farrell, 2013; Lovegrove et al., 2012; Schwartz et al., 2001; cf. Bettencourt et al., 2017; Giang & Graham, 2008). Non‐victimized aggressors, characterized by high levels or rates of physical and non‐physical aggression and low levels or rates of peer victimization, are considered to be physically strong and intimidating, maintain high levels of popularity among peers, have more positive attitudes toward engaging in aggression, and exhibit a range of externalizing behavior problems (e.g., Bradshaw et al., 2013; Lovegrove et al., 2012). In comparison, non‐aggressive victims, characterized by low levels or rates of physical and non‐physical aggression and high levels or rates of peer victimization, are typically shy, unpopular, submissive, withdrawn, and experience internalizing behavior problems (e.g., Giang & Graham, 2008; Hess & Atkins, 1998). The third subgroup, aggressive‐victims are characterized by high levels or rates of physical and non‐physical aggression and peer victimization and tend to be the most maladjusted (Giang & Graham, 2008; Schwartz et al., 2001). They experience greater peer rejection, are more anxious and depressed than non‐victimized aggressors, but also exhibit greater emotion dysregulation and engage in more delinquent behaviors than non‐aggressive victims (Giang & Graham, 2008; Schwartz et al., 2001). Moreover, all three subgroups experience significant difficulties in school (e.g., Bradshaw et al., 2013; Lovegrove et al., 2012).
Antecedents and correlates of peer victimization involvement
Sex
Most studies examining heterogeneity in involvement in peer victimization have examined sex as a predictor of subgroup membership. The prevailing finding has been that boys are more likely than girls to be members of one of the three involved subgroups (i.e., non‐victimized aggressors, non‐aggressive victims, and aggressive‐victims; e.g., Lovegrove et al., 2012; Schwartz et al., 2001). However, several studies have found no sex differences in subgroup membership or that boys are less likely to be members of the aggressive‐victim subgroup (Bettencourt & Farrell, 2013; Bettencourt et al., 2013; Hess & Atkins, 1998). Studies that have yielded disparate findings from the larger research base are based on student samples primarily drawn from predominantly Black, urban communities. Their findings are in line with other work finding no sex differences in rates of overt aggression for Black girls and boys from urban areas (Bradshaw et al., 2010; Miller‐Johnson et al., 2005). Such inconsistencies suggest the need to further examine sex differences to identify potential sources of these differing results, including possible interactions with race‐ethnicity and geographic area.
Race‐ethnicity
There is also growing evidence of racial‐ethnic differences in peer victimization subgroup membership (e.g., Bettencourt & Farrell, 2013; Goldweber et al., 2013; Lovegrove et al., 2012; Schuster et al., 2012; Wang et al., 2009). However, the pattern of these differences varies across studies and subgroups. Some studies have found that Black youth are more likely than White youth to be involved in peer victimization (e.g., Bettencourt & Farrell, 2013; Goldweber et al., 2013; Lovegrove et al., 2012; Schuster et al., 2012), but findings diverge in terms of children's subgroup membership with some finding Black youth are more likely to be aggressive‐victims and non‐aggressive‐victims compared with White and Hispanic youth (e.g., Goldweber et al., 2013) and others finding Black youth are less likely to be non‐aggressive‐victims and aggressive‐victims compared to other ethnic groups (e.g., Bettencourt & Farrell, 2013; Lovegrove et al., 2012). Some studies have found no ethnic differences in peer victimization subgroup membership between Hispanic and White students (e.g., Lovegrove et al., 2012), and others find that Hispanic youth are more likely to perpetrate peer victimization than White youth (e.g., Wang et al., 2009).
Geographic area
One limitation of much of the work on peer victimization to date has been a focus on samples from a single geographic area (e.g., Bettencourt & Farrell, 2013; Giang & Graham, 2008). Although some studies have employed large, nationally representative samples to examine patterns of involvement in peer victimization (e.g., Lovegrove et al., 2012; Wang et al., 2009), very little research has specifically examined whether or how patterns of involvement in peer victimization differ across geographic areas despite access to information on peer victimization involvement across such areas (e.g., cities, states, rural vs. urban areas). Goldweber et al. (2013) conducted one of the few studies to specifically examine associations between geographic area (in this study they focused on urbanicity) and patterns of involvement in peer victimization. They found that youth living in urban areas were more likely to be aggressive‐victims or non‐aggressive victims and less likely to be uninvolved in peer victimization compared with youth residing in non‐urban areas. However, more research is needed to broaden our understanding of geographic variation in patterns of peer victimization involvement as such findings could inform intervention adaptations as well as city, state, and federal anti‐bullying policies (NASEM, 2016).
Sources of incongruencies
There are several potential factors that could singularly or collectively explain these disparate findings. For one, there is variability across studies with respect to target population, sampling frame, and sample size (e.g., there are clear differences in the ethnic composition of the samples). Limited diversity could preclude certain evaluations of racial‐ethnic differences and could result in underpowering comparisons that are possible within a study. Another source of the discrepancies could be differences in simultaneous consideration of sociodemographic predictors of class membership. For instance, Schuster et al. (2012) found that once other demographic factors were accounted for, racial‐ethnic differences in aggression and victimization were significantly attenuated. Finally, and most relevant to this paper, are differences in the ways peer victimization involvement is measured and modeled.
Measurement challenges in classifying peer victimization involvement
Inconsistent findings could stem from differences across studies with respect to the set of items intended to measure peer victimization involvement, the scale or informant of those items, and the specification of the analytic measurement model treating those items as manifest indicators of underlying subgroup membership. For example, studies using only latent class indicators of overt aggression and victimization (e.g., Bettencourt & Farrell, 2013) have identified slightly different peer victimization subgroups than studies using only latent class indicators of victimization (e.g., Nylund, Bellmore, et al., 2007) or those using peer‐ or teacher‐reports (i.e., Bettencourt et al., 2017; Giang & Graham, 2008) rather than self‐reports of aggression and victimization as indicators.
Studies using latent class analysis (LCA) or latent profile analysis for characterizing subgroups of peer victimization involvement have approached the measurement model of the latent subgroups in an exploratory way without a priori specification of the number or nature of latent subgroups. This “reinventing the wheel” occurs despite the clear consonance across studies with regard to the four subgroups when measured in a similar fashion (e.g., Bettencourt & Farrell, 2013; Lovegrove et al., 2012). This exclusively exploratory approach introduces the possibility that idiosyncrasies of the study target population as well as random sampling variability for a given study could become codified in the resultant latent subgroups, invalidating comparisons across studies of results of latent class regressions, which examine how covariates influence the probability of latent class membership. Furthermore, very limited attention has been paid to the possibility that the latent class indicators (a.k.a., observed measures or manifest variables) may not function in the same ways across all participants, at all times, in all places. In fact, in most cases, there is an implicit and ubiquitous assumption that the latent class indicators function exactly the same way for all persons in all contexts (cf. Kim et al., 2010). This assumption is often referred to as the condition of measurement invariance.
Measurement invariance and DIF
Measurement invariance exists when all individuals in the same subgroup have the same expected responses on latent class indicators, regardless of their values on a given predictor of class membership even when the probability of class membership differs as a function of that predictor (Masyn, 2017). To understand the ways in which the assumption of measurement invariance could become untenable in some study populations, consider an item such as “hit or bit a peer.” We intuitively understand that hitting or biting a peer at age 4 is not as indicative of externalizing problem behaviors as it would be at age 14. This means that the item functions differently as a measure of peer victimization for different developmental periods. In this case, we would refer to age as a source of DIF for that item and we would say there was measurement non‐invariance due to age.
Having construct‐irrelevant sources of variability in item responses is not unexpected—it is the “noise” in the observed measures we account for through non‐zero measurement error for each indicator, built into most every analytic measurement model. DIF becomes a problem when the source of DIF for an item is also a predictor of interest for the underlying latent variable, in this case, latent classes of peer victimization. For example, if we included age as a predictor of peer victimization subgroup membership and we did not account for age as a source of DIF for “hit or bit peer” in our measurement model, we might incorrectly infer that the prevalence of aggressive subtypes is significantly higher among 4‐year‐olds than 14‐year‐olds and that the proportion of 4‐year‐olds in the uninvolved subgroup of peer victimization is quite low.
Modeling measurement non‐invariance
Analytically, there are a variety of approaches for relaxing the measurement invariance assumption and evaluating construct predictors and correlates as potential sources of DIF in the latent variable modeling world. There is a vast literature on testing for DIF in the item response theory framework for educational testing. In the structural equation modeling framework (more closely aligned with LCA) there is also a long history of methodology for exploring evidence of measurement non‐invariance. Although a newer approach, moderated nonlinear factor analysis (Bauer, 2017) has gained traction, particularly in the area of integrated data analysis, the two most commonly used approaches for latent variable factor analysis (FA) are multiple‐group FA and multiple‐indicator‐multiple‐causes (MIMIC) modeling.
Multiple‐group FA requires that the potential sources of DIF are all categorical such that participants can be grouped according to their observed categories. The observed groupings are then analyzed simultaneously using a multiple‐group measurement model that allows the model parameters related to item functioning to be different across the group. This is a flexible approach with regard to which features of the measurement model can be varied across the observed groupings. However, it requires a sufficient sample size in each of the observed subgroups and does not allow for non‐categorical sources of DIF.
MIMIC modeling for DIF
Multiple‐indicator‐multiple‐causes modeling, on the other hand, is more accommodating to different types of variables as potential sources of DIF. With the MIMIC modeling approach, the effects of exogenous variables (“multiple causes”) on the latent variable and directly on the latent variable indicators (“multiple indicators”) are modeled simultaneously. Figure 1 provides path diagram representations of DIF specifications in a MIMIC model.
FIGURE 1.
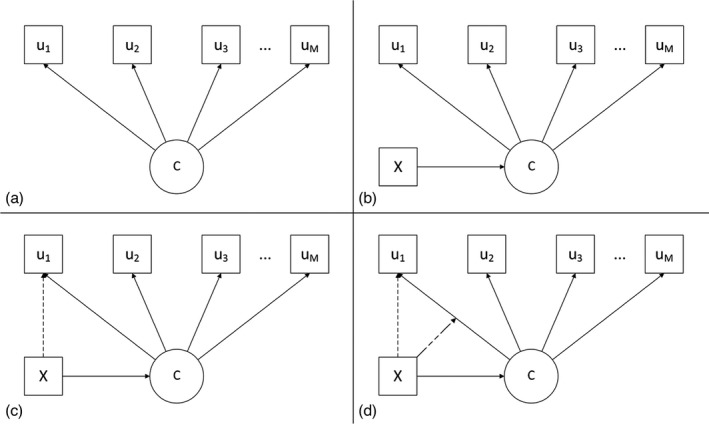
Latent class analysis path diagrams of: (a) unconditional latent class measurement model; (b) MIMIC model with measurement invariance; (c) MIMIC model with uniform DIF; and (d) MIMIC model with nonuniform DIF. DIF, differential item functioning; MIMIC, multiple‐indicator‐multiple‐causes
Figure 1a represents the unconditional measurement model for a latent class variable, c, with multiple observed indicators, uj . In Figure 1b, an exogenous variable, x, is included as a predictor of the latent class variable, as represented by the directed path from x to c. In this model, x is not a source of DIF; all individuals in the same latent class have the same expected response in all the uj s, regardless of their values on x, (i.e., there is full measurement invariance for c with respect to x). The x variable does, however, influence the probability of latent class membership; this model is often referred to as a latent class regression model since the latent class variable is regressed on the exogenous variable, x. In Figure 1c, x is a source of uniform DIF, as represented by the dashed directed path from x to u 1; individuals in the same latent class but with different values of x will have different expected responses on u 1 (i.e., there is measurement non‐invariance for c with respect to x). That is, the item u 1 functions differently as an indicator of latent class membership according to values of x. In our previous example, the variable, x, would be age and u 1 would be the item “hit or bit a peer.” With uniform DIF, 4‐ and 14‐year‐olds in an uninvolved subgroup of peer victimization would have different probabilities of endorsing u 1. If the DIF is uniform, then the difference in item endorsement rates between 4‐ and 14‐year‐olds in the uninvolved subgroup would be the same as the difference in item endorsement rates between 4‐ and 14‐year‐olds in a non‐victimized aggressor subgroup. In Figure 1d, x is a source of nonuniform DIF, as represented by the double‐dashed directed path from x to the directed path from c to u 1. As compared to the model represented in Figure 1c, the sign and magnitude of DIF (measurement non‐invariance) due to x could be different in each latent class. For example, the difference in item endorsement rates between 4‐ and 14‐year‐olds in the uninvolved subgroup could be larger than the difference in item endorsement rates between 4‐ and 14‐year‐olds in a non‐victimized aggressor subgroup.
Present study
The present study is both exploratory and confirmatory; it was not a pre‐registered report and due to its cross‐sectional nature, there are no directional hypotheses. However, several of the hypotheses are supported by prior work. The purpose of the present study was threefold. Prior research using LCA to examine the structure of self‐reported aggression and peer victimization in early adolescence has consistently identified four latent subgroups of youth who vary in reported involvement in overt aggression and victimization (e.g., Bettencourt & Farrell, 2013). The first goal of the present study was to replicate previous findings using a large, more diverse, multi‐site sample of early adolescents. As in Bettencourt and Farrell (2013), the present study used self‐reports on seven items drawn from the Problem Behavior Frequency Scale (PBFS; Farrell et al., 2016) as indicators of latent subgroup membership. Using confirmatory latent class analysis (CLCA; Schmiege et al., 2017), we hypothesized that our data would be consistent with a similar 4‐class model with the following subgroups: (1) low rates of involvement as aggressors or victims (i.e., uninvolved); (2) high rates of involvement as aggressors and victims (i.e., aggressive‐victims); (3) high rates of involvement as aggressors but low rates of involvement as victims (i.e., non‐victimized aggressors); and (4) low rates of involvement as aggressors and high rates of involvement as victims (i.e., non‐aggressive victims).
Guided by previous research revealing mixed findings related to sex and racial‐ethnic differences among subgroups of youth involved in peer victimization (e.g., Bettencourt & Farrell, 2013; Lovegrove et al., 2012; Schuster et al., 2012), the second goal was to take advantage of the size and diversity of this multi‐site sample to explore measurement invariance of the latent class indicators across cohort, sex, race‐ethnicity, and study site. Such an in‐depth evaluation of measurement invariance as it relates to these predictors of latent subgroups involved in peer victimization has not previously been conducted, thus our analyses were systematic but exploratory. We were interested in investigating sex, race‐ethnicity, cohort, and study site as potential sources of DIF for the latent class indicators for peer victimization involvement. Our third goal was to evaluate the associations of those demographic variables with latent class membership after accounting for any measurement non‐invariance uncovered in the DIF analysis. We hypothesized that some demographic differences in latent class membership prevalence would still be identified, but that the magnitude would likely be reduced once the measurement invariance assumption was relaxed in the latent class regression model. Because this in‐depth evaluation of measurement invariance in LCA is novel, this hypothesis was also exploratory.
METHOD
Setting and participants
Participants were students attending 37 schools within four communities in North Carolina (NC), Virginia (VA), Georgia (GA), and Illinois (IL) who completed measures as part of the Multisite Violence Prevention Project (MVPP). The eight schools in Richmond, VA and the eight schools in Durham, NC were middle schools in urban, public school systems. In GA, the nine schools represented all middle schools from six school districts. The 12 schools in Chicago, IL were all elementary/middle schools that were selected if they had at least 75% of their students living within school district boundaries and had enrolled more than 1100 students. All participating schools included a high percentage of students who were eligible for the federal free or reduced‐price lunch program (i.e., 42%–96% across sites). Details regarding school recruitment and community characteristics are reported elsewhere (see Henry et al., 2004). The original intervention study used a cluster‐randomized design where equal numbers of schools within each study site were randomly assigned to four conditions: universal intervention, selective intervention, combined intervention (universal and selective), and no intervention control (see MVPP, 2008, 2009, for details). Because the current study utilized pre‐intervention measures, data from students from schools across all conditions were used.
Participants were recruited in September of 2002 and 2003 from a random sample of approximately 100 students from the sixth‐grade rosters of each school or from all sixth graders in three IL schools that had <100 sixth graders. Students in self‐contained special education classrooms were not eligible to participate. Of 7364 eligible students, active parental consent and student assent were obtained from 5625 students at the beginning of the study, resulting in a recruitment rate of 76%. Due to missing data on all seven items measuring aggression and peer victimization, 210 students were excluded from this study resulting in a final sample of 5415 students. No students were excluded due to missing demographics. Relatively equal proportions of participants came from each study site except IL, which had slightly more participants (30.8% compared to 21%–24% at other study sites). Forty‐nine percent of the sample were boys, 50.6% self‐identified as Black, 20.9% as Hispanic, 18.9% as non‐Hispanic White, and 9.1% as from another racial‐ethnic group. See Appendix S1 for sample demographics by site. There were significant racial‐ethnic differences across study sites.
Procedures
Students completed measures and demographic information at schools in groups of 10–20 using a computer‐aided personal interview, with follow‐up of absent students as needed. At three study sites, students received a $5 gift card for completing measures. The present study used data from the first wave collected in the fall of the sixth‐grade school year prior to initiating the intervention. All procedures were approved by the Institutional Review Boards at the four participating universities and the Centers for Disease Control and Prevention.
Measures
Latent class indicators
Latent class indicators for peer victimization consisted of seven items drawn from the physical aggression, non‐physical aggression, and overt victimization scales of the PBFS (Farrell et al., 2016). These included two physical aggression items (i.e., “Hit or slapped someone,” “Shoved or pushed someone”), two non‐physical aggression items (i.e., “Teased someone to make them angry,” “Picked on someone”), and three items representing overt victimization (i.e., “Been hit by another kid,” “Been pushed or shoved by another kid,” “Been yelled at or called mean names by another kid.”). Students rated how frequently each item happened in the past 30 days using the following 6‐point scale: 1 = never, 2 = 1–2 times, 3 = 3–5 times, 4 = 6–9 times, 5 = 10–19 times, and 6 = 20 or more times. A prior psychometric evaluation of the PBFS found evidence of good construct validity based on significant associations between the physical aggression, non‐physical aggression, and overt victimization subscales and other relevant constructs (e.g., drug use, approval of aggression; Farrell et al., 2016). These seven items were selected because they were consistent with PBFS items previously used to construct aggressor/victim subgroups (Bettencourt & Farrell, 2013; Bettencourt et al., 2013). We opted to dichotomize these items for the present study under the assumption that any involvement in peer victimization in the prior month as opposed to the degree of involvement can have negative consequences and is grounds for preventive intervention (NASEM, 2016). This decision was further guided by data sparseness and small cell‐sizes across categories (on average, 76% [range: 71%–80%] endorsed either category 1 or 2; on average, 8% [range: 6%–12%] endorsed categories 4 or higher) as well as doubts regarding the reliability of responses delineating non‐zero frequencies. The empirical reality of the items in this sample was that the bulk of the information regarding population heterogeneity in peer victimization involvement to be captured by the latent classes was contained between the category 1 responses versus the category 2–6 responses. Furthermore, prior work by Bettencourt et al., (2013) revealed that dichotomizing these ordinal items into 0 (i.e., never engaging in the behavior in the past 30 days) and 1 (i.e., any engagement in the behavior in the past 30 days) reduced the number of parameters estimated in the model and resulted in a very similar but more interpretable latent class solution.
Latent class predictors
The sites all used a binary measure of sex that was drawn from school records with values of 1 for boys and 0 for girls. The two cohorts were defined by calendar year of data collection with values 1 for the 2002 cohort and 0 for the 2003 cohort. For race, students were asked “How do you describe yourself” and selected from six options: White, Black or African American, American Indian or Alaska Native, Asian Indian, Other Asian, and Some other race. For ethnicity, students were asked “Are you Hispanic or Latino?” and selected from five response options: No, not Hispanic or Latino; yes, Puerto Rican; Yes, Mexican, Mexican American, Chicano; yes, Cuban; Yes, other Hispanic or Latino. These items were combined into one race‐ethnicity variable with eight categories: White Non‐Hispanic, Black Non‐Hispanic, American Indian or Alaskan Native, Asian Indian, Other Asian, Hispanic, Other Race, and Multiracial. Youth selecting both Hispanic and another category were considered Multiracial. For this study, three dummy variables were created—Hispanic, Non‐Hispanic White, Other Race—with Black as the reference group. For site, three dummy variables were created—Illinois, North Carolina, and Virginia—with Georgia as the reference site.
Analytic plan
First, CLCA (see Schmiege et al., 2017, e.g., Mplus input syntax) was conducted. Similar to confirmatory FA, CLCA uses results from prior empirical work and theory to create a confirmatory latent class measurement model by specifying not only the number of latent classes (analogous to the number of factors) but also constraints on the class‐specific measurement parameters (analogous to the pattern of factor loadings). A set of alternative models for consideration and comparison to the hypothesized model are also specified a priori. As previously described, extant literature suggested a 4‐class model with classes distinguished by individual involvement as either aggressors or victims, both aggressors and victims, or neither (e.g., Bettencourt & Farrell, 2013). This model had boundary constraints placed on item thresholds corresponding to the following class‐specific item endorsement probabilities: (1) all seven‐item endorsement probabilities above .85; (2) all seven‐item endorsement probabilities below −.85; (3) asymmetric involvement with item endorsements above .85 for aggression items and below −.85 for victimization items; and (4) asymmetric involvement with item endorsements below −.85 for aggression items and above .85 for victimization items. As alternative models, we considered unconstrained 3‐, 4‐, and 5‐class models as well as a 5‐class model with four classes constrained as in the primary model and one additional unconstrained class, and a 3‐class model with constraints to match three of the four classes with the largest proportions of students in the primary model (see Table 2).
TABLE 2.
Summary of findings for either uniform or nonuniform differential item functioning (DIF) from aggression and victimization DIF analysis of sex, race‐ethnicity, and study site
| Item | Variable | ||
|---|---|---|---|
| Sex | Race‐ethnicity | Study site | |
| Pushed | Uniform DIF | Uniform DIF | ns |
| 2.06 | 2.62 | ||
| Hit or slapped | Uniform DIF | Nonuniform DIF | Uniform DIF |
| 1.44 | 1.73–3.54 | 2.03 | |
| Teased | Uniform DIF | ns | ns |
| 1.62 | |||
| Picked on | Nonuniform DIF | Nonuniform DIF | Nonuniform DIF |
| 1.12–1.80 | 2.46–4.56 | 2.43–10.02 | |
| Been hit | ns | Nonuniform DIF | Nonuniform DIF |
| 2.64–3.52 | 1.72–8.31 | ||
| Been pushed | ns | ns | ns |
| Been called names | Uniform DIF | ns | Uniform DIF |
| 1.62 | 1.62 | ||
Based on model with all covariates including cohort as predictors of latent class membership and potential sources of DIF. Cohort was not found to be a statistically significant source of DIF and does not have DIF effects to be included in the table. Uniform DIF indicates DIF effects are the same within each latent class. Nonuniform DIF indicates DIF effects are different for each latent class. Reported values represent maximum odds ratios calculated as the exponentiated largest absolute difference in item log odds within class between any two categories for each covariate. For nonuniform DIF, the range of maximum odd ratios across the four classes is given.
Abbreviation: ns, not statistically significant.
Fit statistics for all models under consideration were examined to determine the best fitting model. The Bayesian information criterion (BIC) was used to assess model relative fit (Nylund, Asparouhov, et al., 2007). In addition, properly nested candidate models (e.g., models in which the same parameters are estimated but one model has an additional parameter constraint) were compared using the scaled difference chi‐square test statistic computed with the model log likelihood values and scaling correction factors produced for robust maximum likelihood estimation in Mplus (Satorra & Bentler, 2010). Data were missing for <1% of the sample for each latent class indicator, and 99.6% of the sample had complete data on all latent class indicators. Therefore, missing data on class indicators were handled through full information maximum likelihood estimation under the missing‐at‐random assumption. Clustering within school was accounted for in all CLCA models using sandwich estimators to calculate robust standard errors. All analyses were performed in Mplus, Version 8.1.6 (Muthén & Muthén, 1998–2017).
After the final unconditional latent class model was selected, measurement invariance was evaluated following the steps prescribed in Masyn (2017). The reader is referred to the appendix of Masyn (2017) for detailed Mplus syntax for executing each step of this process. To briefly summarize, sex, race‐ethnicity, study site, and cohort were initially analyzed separately as potential sources of DIF. This evaluation began with an omnibus test comparing a null model with complete invariance for all items with respect to the covariate to a model with class‐specific (i.e., nonuniform) DIF on every item with regard to the covariate. If the omnibus test was rejected (i.e., there was evidence of DIF for at least one item), an item‐by‐item sequence of testing proceeded (with a Type I error rate adjustment for multiple testing) until we arrived at a model with some DIF that was not statistically significantly worse fitting than the full DIF model (will all items non‐invariant). During the iterative process, items were first evaluated for evidence of nonuniform DIF (wherein the direct effects from the covariate to the item were class‐specific). Then the items were evaluated for the more constrained uniform DIF (wherein DIF operated the same for an item across latent classes). For all models, the effects of the covariate on latent class membership were freely estimated. Following separate investigations for each source of DIF, a similarly iterative testing process was done using all covariates simultaneously. This process began with a model that included all previously identified DIF effects. Constraints by item and covariate were evaluated to see if any DIF effects found in separate analyses could be eliminated without a significant decrement in model fit once the other sources of DIF were included. As a final step, covariate interaction DIF effects were tested. All model comparisons were done using the scaled likelihood ratio chi‐square test of nested models estimated with robust maximum likelihood. For covariates represented by multiple dummy variables (e.g., race‐ethnicity) corresponding coefficients were tested simultaneously.
Once all statistically significant sources of DIF were identified, the practical and substantive impact of DIF was evaluated. We calculated and plotted the model‐estimated item probabilities for different levels of the covariates to make a subjective but substantively and empirically informed determination of the comparability of the classes in structure and meaning. In other words, we evaluated whether allowing for the statistically necessary measurement non‐invariance in the latent class indicators resulted in full or partial construct non‐invariance meaning that the substantive meaning of one or more of the latent classes differs across covariate values to a degree such that a one‐to‐one latent class prevalence comparison across individuals with different covariate values would not be valid. For additional evaluations of latent class comparability for different covariate values in the presence of DIF, we also compared estimates of latent class homogeneity and separation (Masyn, 2013) for the most disparate sets of covariate values. If we determined the latent classes were still comparable, we then evaluated the associations between key covariates (cohort, sex, race‐ethnicity, study site) and latent class membership based on the latent class regression results using the final MIMIC model with DIF effects included. We did not use a stepwise approach (e.g., 3‐step) to obtain the latent class regression results as such an approach was unnecessary because this approach ignores the direct covariate effects on the latent class indicators, which can yield biased estimates (Kim et al., 2016; Masyn, 2017).
RESULTS
The unconditional confirmatory latent class measurement model
See Appendix S1 for descriptive statistics for the sample and the seven items used as latent class indicators. CLCA (Schmiege et al., 2017) was conducted to evaluate whether the data were consistent with the hypothesized 4‐class model based on prior research (e.g., Bettencourt & Farrell, 2013) as compared to seven alternative models (see Table 1). The primary confirmatory model converged with replicated maximum log likelihood values across multiple sets of random start values (BIC = 43,542). However, for the two asymmetric involvement classes, the estimated values for multiple thresholds in each of the two classes were fixed at the corresponding boundary condition (i.e., −.85 and .85). Thus, we re‐specified the primary confirmatory model, retaining the boundary conditions for the two symmetric involvement classes but replacing the boundary conditions for the asymmetric involvement classes to inequality constraints. Specifically, one asymmetric class was constrained, via item threshold inequalities, to have higher item endorsement probabilities for the aggression items and lower endorsement probabilities for the victimization items relative to the other asymmetric class. We also considered one additional confirmatory 4‐class model with no boundary or inequality constraints placed but rather equality constraints such that item endorsement probabilities for the aggression items were constrained to be equal across one symmetric and one asymmetric class and the item endorsement probabilities for the victimization items were constrained to be equal across the two remaining classes (see Table 1).
TABLE 1.
Parameter constraints for each of the confirmatory latent class analysis models
| Covariates | Non‐victimized aggressor | Predominantly victimized | Aggressive‐victim | Uninvolved |
|---|---|---|---|---|
| 4 class, unconstrained (BIC = 43,443) | ||||
| 4 class, boundary constraints on item thresholds (BIC = 43,542) | ||||
| Shoved or pushed | <−0.85 | >0.85 | <−0.85 | >0.85 |
| Hit or slapped | <−0.85 | >0.85 | <−0.85 | >0.85 |
| Teased | <−0.85 | >0.85 | <−0.85 | >0.85 |
| Picked on | <−0.85 | >0.85 | <−0.85 | >0.85 |
| Been hit | >0.85 | <−0.85 | <−0.85 | >0.85 |
| Been pushed/shoved | >0.85 | <−0.85 | <−0.85 | >0.85 |
| Been called names | >0.85 | <−0.85 | <−0.85 | >0.85 |
| 4 class, boundary constraints and inequality constraints (BIC = 43,443) | ||||
| Shoved or pushed | >PV | <AG | <−0.85 | >0.85 |
| Hit or slapped | >PV | <AG | <−0.85 | >0.85 |
| Teased | >PV | <AG | <−0.85 | >0.85 |
| Picked on | >PV | <AG | <−0.85 | >0.85 |
| Been hit | <PV | >AG | <−0.85 | >0.85 |
| Been pushed/shoved | <PV | >AG | <−0.85 | >0.85 |
| Been called names | <PV | >AG | <−0.85 | >0.85 |
| 4 class, threshold equality constraints (BIC = 43,571) | ||||
| Shoved or pushed | −2.0 | 2.0 | −2.0 | 2.0 |
| Hit or slapped | −2.0 | 2.0 | −2.0 | 2.0 |
| Teased | −2.0 | 2.0 | −2.0 | 2.0 |
| Picked on | −2.0 | 2.0 | −2.0 | 2.0 |
| Been hit | 2.0 | −2.0 | −2.0 | 2.0 |
| Been pushed/shoved | 2.0 | −2.0 | −2.0 | 2.0 |
| Been called names | 2.0 | −2.0 | −2.0 | 2.0 |
| 3 class, unconstrained (BIC = 44,170) | ||||
| 3 class, thresholds constrained to exclude uninvolved class (BIC = 47,245) | ||||
| Shoved or pushed | −1.29 | 0.42 | −3.03 | |
| Hit or slapped | −0.29 | 1.31 | −1.70 | |
| Teased | −0.84 | 1.31 | −1.22 | |
| Picked on | −1.34 | 0.76 | −2.07 | |
| Been hit | 1.10 | −0.98 | −2.37 | |
| Been pushed/shoved | 0.84 | −1.71 | −3.10 | |
| Been called names | 0.34 | −1.22 | −2.07 | |
| 5 class, unconstrained (BIC = 43,405) | ||||
| 5 class, 4 classes constrained (BIC = 43,429) | ||||
| Shoved or pushed | <0.85 | >−0.85 | <0.85 | >−0.85 |
| Hit or slapped | <0.85 | >−0.85 | <0.85 | >−0.85 |
| Teased | NC | NC | <0.85 | >−0.85 |
| Picked on | NC | NC | <0.85 | >−0.85 |
| Been hit | NC | NC | <0.85 | >−0.85 |
| Been pushed/shoved | NC | NC | <0.85 | >−0.85 |
| Been called names | >−0.85 | <0.85 | <0.85 | >−0.85 |
Abbreviations: AG, non‐victimized aggressor; BIC, Bayesian information criterion; NC, no constraint; PV, predominantly victimized.
The 4‐class model with the combined inequality and boundary constraints on the item thresholds fit statistically significantly better than the other constrained 4‐class models. Most notably, the 4‐class model with combined inequality and boundary constraints yielded an identical solution to the unconstrained 4‐class model, indicating the data were fully consistent with that constrained model given a 4‐class structure. The unconstrained 3‐class model fit statistically significantly better than the other 3‐class model. Similarly, the unconstrained 5‐class model fit better than the other 5‐class model. The BIC was lowest for the unconstrained 5‐class model; however, the difference in BIC values for the 5‐class compared to the 4‐class model was notably smaller than the difference between the 4‐class and 3‐class. Furthermore, the 5‐class model yielded a similar class pattern to the 4‐class model but with the asymmetric class with higher endorsements on the aggression items split between two classes distinguished only by differences in endorsement rates of “pushed.” Therefore, we selected the unconstrained 4‐class model as the final measurement model. Because the solution for the unconstrained 4‐class model was identical to the 4‐class model with combined boundary and inequality constraints, we proceeded with the unconstrained model as translating the boundary and inequality constraints to the conditional MIMIC model with direct effects of the covariates on the latent class indicators would not be feasible without specific hypotheses about the sign and magnitude of DIF effects.
Figure 2 presents the model‐estimated item response probabilities based on the unconstrained 4‐class CLCA. Examination of item endorsement patterns revealed a uninvolved (18.5%) class marked by a low probability of reporting engagement in aggression or being the target of overt victimization in the past month; a non‐victimized aggressive (23.9%) class characterized by a high probability of reporting engagement in physical and non‐physical aggression, and a low probability of being the target of overt victimization; a predominantly victimized (19.3%) class distinguished by a lower probability of reporting engagement in aggression, and a high probability of being the target of overt victimization; and an aggressive‐victims (38.3%) class marked by a high probability of reporting engagement in both forms of aggression and being the target of overt victimization.
FIGURE 2.
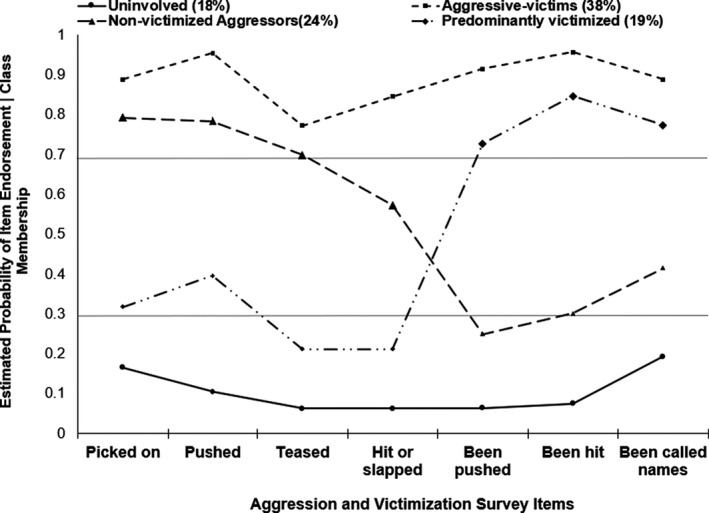
Model‐estimated item response probability plot based on 4‐class confirmatory latent class analysis with boundary constraints indicated by horizontal lines (all uninvolved class items probabilities <.30 and all aggressive‐victims class item probabilities >.70) and inequality constraints indicated by marker size (non‐victimized aggressor class aggression‐related item probabilities greater than predominantly victimized class; non‐victimized aggressor class victimization‐related item probabilities less than predominantly victimized class)
Testing sex, cohort, race‐ethnicity, and study site as separate sources of DIF
Next, we conducted separate DIF analyses for each of the four covariates (see Appendix S1 for full model comparison tables). There was no evidence of cohort as a source of DIF (χ 2 = 34.61, df = 28, p = .18). For sex, we found evidence of uniform and nonuniform DIF for all items but been hit. For race‐ethnicity, we found evidence of uniform or nonuniform DIF on five of seven items, excluding teased and been called names. For study site, we found evidence of DIF for all items but pushed and teased.
Testing sex, cohort, race‐ethnicity, and study site as combined sources of DIF
Once all covariates were included in the model, the item been pushed no longer exhibited DIF for any of the covariates. There was no statistically significant evidence of interaction effects between the covariates directly on the items or class membership so only main effects are included in the final model. Table 2 summarizes the DIF results for the final MIMIC model (with all four covariates included as predictors of class membership). Two tables of parameter estimates for the final model can be found in Appendix S1 (see Tables A6 and A7). Looking at the columns of Table 2, sex is a source of DIF for all four aggression items and one victimization item (been called names). Race‐ethnicity is a source of DIF for three aggression items (pushed, hit/slapped, and picked on) and one victimization item (been hit). Study site is a source of DIF for two aggression items (hit and picked on) and two victimization items (been hit and been called names).
Sources of DIF for the victimization items
Looking at the rows of Table 2, there is evidence of more DIF (i.e., more sources of DIF and larger magnitudes of DIF effects) for the four aggression items than the three victimization items. As previously noted, we found no statistically significant evidence of DIF for been pushed. Sex and study site were sources of uniform DIF for been called names, with girls having higher odds of reporting having been yelled at or called mean names by another kid in the past 30 days compared to boys belonging to the same latent class (Est. OR = 1.62). Students at the IL study site were more likely to endorse been called names than students at the other study sites belonging to the same latent class, with the largest difference found in comparison to students at the GA study site (Est. OR = 1.62). Race‐ethnicity and study site were both sources of nonuniform DIF for been hit. The largest racial‐ethnic difference in item functioning was found for Black students compared to Non‐Hispanic White students, with Black students in the predominantly victimized class having higher odds of reporting having been hit by another kid compared to Non‐Hispanic White students (Est. OR = 3.52). The largest site difference was found for students at the NC site compared to the GA site, with students at the NC site in the non‐victimized aggressor class having higher odds of reporting having been hit than students at the GA study site (Est. OR = 8.31).
Sources of DIF for the aggression items
For the four aggression items, teased had only one source of (uniform) DIF: sex. Boys had an estimated 1.62 times the odds of reporting having teased someone in the past 30 days. There was evidence of uniform DIF for pushed with regard to sex and race‐ethnicity. Specifically, boys had 2.06 times the odds of reporting having pushed or shoved someone in the past 30 days compared to girls in the same class (regardless of which class). Non‐Hispanic White students had lower odds of reporting having pushed or shoved someone in the past 30 days compared to others in the same class, with the largest difference found in comparison to Black students (Est. OR = 0.38).
Sex, race‐ethnicity, and site were all sources of DIF for hit or slapped and picked on. Boys were more likely to report having hit or slapped someone compared to girls in the same latent class (Est. OR = 1.44). In general, Hispanic and non‐Hispanic White students were less likely to report having hit or slapped someone compared to other students belonging to the same latent class; the largest difference was found between non‐Hispanic White students and Black students belonging to the non‐victimized aggressive class (Est. OR = 3.54). Students at the IL study site were more likely to report having hit or slapped someone compared to others in the same latent class (Est. OR = 2.03). There was evidence of nonuniform DIF for picked on with regard to sex, race‐ethnicity, and site. Boys were less likely to report having picked on someone in the past 30 days compared to girls in the same latent class with the exception of the primarily victimized class in which boys were more likely to report having picked on someone (Est. OR = 1.80). In general, Hispanic students were less likely to report having picked on someone; the largest difference was found between Hispanic and Black students in the non‐involved class (Est. OR = 0.22). In general, students at the IL study site were less likely to report having picked on someone compared to other students in the same latent class with the largest difference found between IL and NC students (Est. OR = 0.10).
Evaluating the magnitude of DIF effects
Figure 3 displays the model‐estimated item response probabilities adjusted for sex, race‐ethnicity, and study site. To fully evaluate the magnitude of the combined DIF effects, we selected two demographic subgroups for which the amount of DIF across the items and classes was the largest or nearly the largest: Black boys in GA and non‐Hispanic White girls in IL. It is clear from Figure 3 that the combined DIF effects are generally smaller for the victimization items compared to the aggression items for all classes. There was not sufficient evidence of DIF for been pushed. The DIF effects for the two subgroups on been hit and been called names appear to be operating in a compensatory manner. This is indicated by the crossing lines, meaning that the DIF effects on the two items could partially cancel each other out, lessening the bias in the prediction of class membership. For these two subgroups, the DIF impact is largest for picked on and pushed. Although the relative relations of the classes to one another are similar for the two subgroups, the DIF effects result in a somewhat higher degree of heterogeneity within non‐victimized aggressive and predominantly victimized classes with respect to the picked on and pushed items. Overall, the degree of class homogeneity, as indicated by class‐specific endorsement probabilities (Masyn, 2013), is of a comparable magnitude for all items across all classes for the two demographic subgroups, with the exceptions noted above. Overall, the degree of pairwise class separation, as indicated by odds ratios of item endorsement across each possible pair of classes (Masyn, 2013), is of a comparable magnitude for all items across all pairwise latent class comparisons, with the few exceptions expected from the difference in class homogeneity. Thus, although we believe the DIF does not change substantive meaning of the classes or compromise the overall construct validity of the latent class variables, the sensitivity and specificity of, say, picked on, as an indicator of latent class membership does differ across individuals with different covariate values (e.g., Black boys in GA vs. non‐Hispanic White girls in IL) due to non‐negligible measurement non‐invariance.
FIGURE 3.
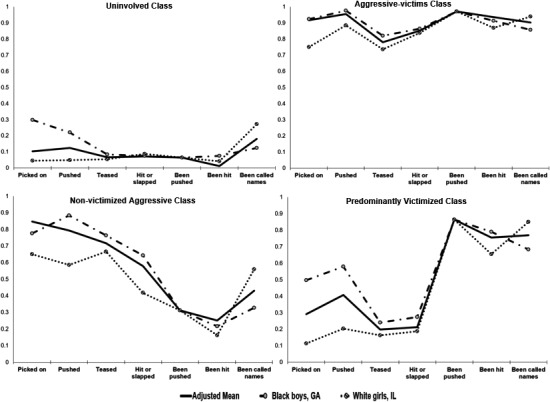
Model‐estimated item response probability plots based on 4‐class multiple‐indicator‐multiple‐causes latent class analysis with sex, race‐ethnicity, site, and cohort as predictors of class membership and with sex, race‐ethnicity, and site as sources of DIF. Item responses that make up latent classes are listed along the x‐axis. Values shown on the y‐axis indicate the estimated probability of endorsing a particular item for participants within each latent class. Lines without markers indicate classes estimated at the mean of all covariates; markers indicate classes estimated for (i) Black boys in Georgia and (ii) White girls in Illinois to illustrate the magnitude of measurement non‐invariance from the combined DIF effects of sex, race‐ethnicity, and site. DIF, differential item functioning
Latent class regression accounting for DIF
Given our assessment that the substantive meaning of the latent classes remains intact, even in the presence of DIF, we proceeded to evaluate the relations between our four covariates and latent class membership, parameterized as a multinomial logistic regression of class membership on the full set of covariates in the MIMIC model inclusive of the identified DIF effects. The overall association of each covariate with latent class membership (controlling for all other covariates and DIF effects) was tested using a robust likelihood ratio chi‐square difference test of nested models. The null model for each test was one in which all parameters in the multinomial logistic regression corresponding to the select covariate were fixed at zero while the alternative model allowed those same parameters to be freely estimated. The alternative model was the same for all four tests of association. None of the covariates were found to be individually statistically significantly associated with latent class membership (sex: χ 2 = 6.34, df = 3, p = .10; cohort: χ 2 = 6.94, df = 3, p = .07; race‐ethnicity: χ 2 = 15.69, df = 9, p = .07; site: χ 2 = 15.10, df = 9, p = .09); however, collectively there was some evidence of an overall association between latent class membership and the set of covariates (χ 2 = 44.48, df = 24, p = .007).
To better understand the role of DIF in evaluating predictors of class membership, we compared latent class regression results from our final model, allowing all previously found DIF effects, to a latent class regression model with no DIF effects. The top row of Figure 4 displays the model‐estimated probabilities of class membership in each of the four classes for boys and girls (controlling for cohort, race‐ethnicity, and study site) based on the model accounting for DIF (left panel) and ignoring DIF (right panel). Ignoring DIF can lead to attenuation, inflation, or even inversion of the estimated covariate effects on latent class membership. For example, comparing membership in the aggressive‐victims class versus the non‐involved class, boys had an estimated 2.34 times the odds of membership in the aggressive‐victims class compared to girls based on the no‐DIF model but that sex effect was 19% smaller in the model allowing for DIF (Est. OR = 1.88). Conversely, when comparing membership in the primarily victimized class to the non‐victimized‐aggressive class, boys were negligibly more likely than girls to belong to the primarily victimized class based on the no‐DIF model (Est. OR = 1.29) but that sex effect was 86% larger in the model allowing for DIF (Est. OR = 2.39).
FIGURE 4.
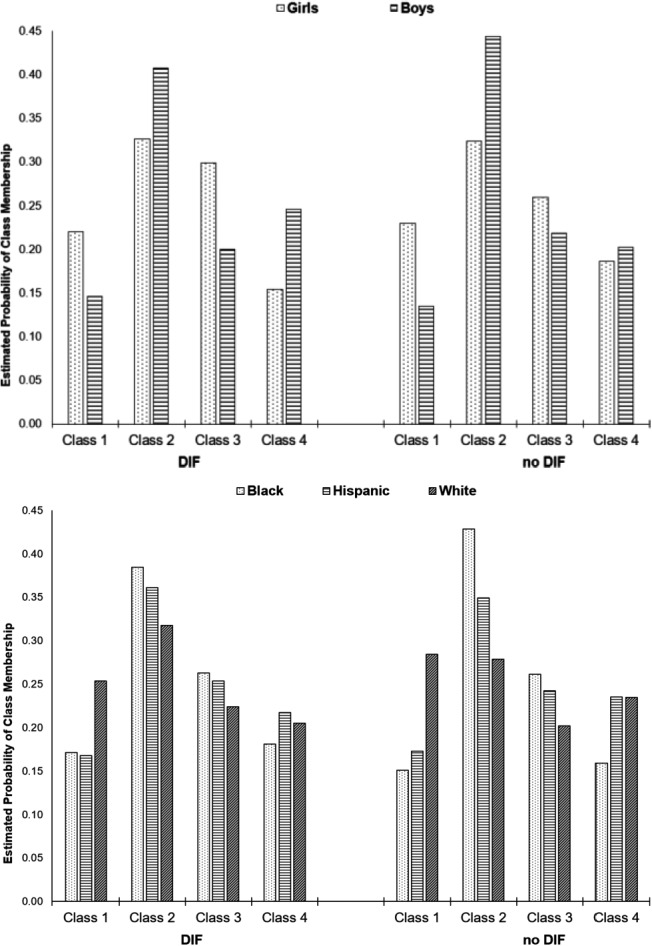
Model‐estimated probabilities of class membership for boys versus girls (top) and Black versus Hispanic versus White students (bottom) based on 4‐class multiple‐indicator‐multiple‐causes latent class analysis with sex, race‐ethnicity, site, and cohort as predictors of class membership and with sex, race‐ethnicity, and site as sources of DIF (left) and 4‐class latent class regression model with no DIF effects (right). All values are adjusted for other covariates included in the model. Class 1 = uninvolved, Class 2 = aggressive‐victims, Class 3 = non‐victimized aggressors, and Class 4 = predominantly victimized. DIF, differential item functioning
The bottom row of Figure 4 displays the model‐estimated class probabilities for Black, Hispanic, and White students (controlling for cohort, sex, and study site). Similar to the estimated sex effects, the bias presented in the estimated associations when ignoring DIF can go in different directions. For example, the odds ratio comparing membership in the aggressive‐victims class versus the uninvolved class for Black students to non‐Hispanic White students is 38% smaller in the model accounting for DIF (DIF: Est. OR = 1.79; no DIF: Est. OR = 2.90).
DISCUSSION
Peer victimization is a major public health concern (NASEM, 2016) and an increasing number of researchers are interested in exploring the heterogeneity seen in peer victimization within a latent variable framework. Previous research exploring the heterogeneity in these experiences has identified four latent subgroups: uninvolved, aggressive‐victims, non‐victimized aggressors, and predominantly victimized. The goal of this paper was to use CLCA to replicate these four latent subgroups within a large geographically and racially diverse sample. Then, steps were taken to explore measurement invariance of the latent class indicators across cohort, sex, race‐ethnicity, and study site to illuminate whether inconsistent findings in the previous literature could be solely attributed to model misspecification and measurement non‐invariance rather than true associations between sex, race‐ethnicity, and location with latent subgroup membership.
Confirmatory latent class analysis provided confirmation of the four subgroups of youth involved in peer victimization which have been identified in previous theoretical and empirical studies (NASEM, 2016; Schwartz et al., 2001). Measurement invariance testing of cohort, sex, race‐ethnicity, and study site indicated evidence of DIF. Ignoring these DIF effects impacts the estimated predictive relation with the latent class variable. The resultant biases can lead to attenuation, inflation, or inversion of effects on class membership. This kind of discrepancy is key as research exploring the heterogeneity in aggression and peer victimization is used to inform prevention and intervention efforts.
These results identify an important gap in the literature, in which a majority of studies modeling heterogeneity in aggression and peer victimization (e.g., Bettencourt & Farrell, 2013; Giang & Graham, 2008; Nylund, Bellmore, et al., 2007) and other complex school‐based behaviors, fail to adequately explore and account for measurement non‐invariance (or DIF). By ignoring potential measurement issues, study results must be interpreted with caution. Although potentially time‐consuming, adequately exploring and controlling for DIF, as done in this study, can reduce bias in the associations of primary interest, (i.e., correlates of latent class membership).
Use of CLCA is relatively novel. To date, only a handful of studies have utilized CLCA methodology in general (e.g., Chen et al., 2020; Finch & Bronk, 2011; Schmiege et al., 2017), and the present study is the first to apply this methodology to the study of latent classes of youth involved in peer victimization. With an increasing number of existing studies utilizing mixture modeling, it is critical that the field turn toward more confirmatory, out‐of‐sample replication and validation of latent class measurement, utilizing the extant literature to inform the number and composition of latent classes specified in the CLCA.
Implications of study findings for measurement development and revisions
With greater emphasis on public mental health, researchers, practitioners, and policy makers are thinking more about how best to measure, address, and prevent aggression and peer victimization. We have shown that not accounting for DIF can distort estimated associations between covariates and latent classes. However, the implications of DIF results are something to be contemplated directly. Results of measurement invariance analysis could inform revisions to existing items or creation of new items. In the case of the dichotomized aggression and victimization items, we can think of item functioning in terms of sensitivity and specificity as indicators of latent class membership. For example, picked on someone was the item that exhibited the greatest amount of DIF. In terms of study site, this item is much more sensitive for indicating membership in one of the two latent subgroups characterized by high rates of aggression (aggressive‐victims, non‐victimized aggressors) for students in GA compared to IL: class‐specific item probabilities of .92 and .82 compared to .83 and .63. That is, there was an estimated 82% of students belonging to the non‐victimized‐aggressor class in GA who endorsed picked on while only 63% belonging to this same class in IL endorsed the item.
The picked on item has a similarly wide range of specificity for indicating membership in one of the two latent subgroups characterized by low rates of aggression (e.g., there was an estimated 22% of students belonging to the uninvolved class in GA who endorsed picked on while only 4% of IL student in that same class endorsed the item). We could further interrogate what it is about the wording or interpretation of this item that results in variable levels of sensitivity and specificity. Perhaps is it the lack of specificity or clarity in what it means to have picked on someone; but why would that cause DIF with respect to study site? We could even design a study in which we randomized different versions of this item to ascertain whether revising item wording to increase specificity (e.g., picked on someone by calling them names) might result in less DIF. Similar reflection could be undertaken for the other items exhibiting DIF.
Youth who are involved in peer victimization across childhood and adolescence often experience myriad long‐term negative outcomes including low academic and financial achievement, internalizing and externalizing behavior problems, and incarceration (McDougall & Vailliancourt, 2015; NASEM, 2016). By accounting for measurement issues related to sex, race‐ethnicity, and study site, we are able to appropriately model complex behaviors to give a clearer perspective on what peer victimization subgroups look like to better inform treatment and prevention. Past research has indicated potential sex differences in peer victimization subgroups, particularly among predominantly White or mixed‐race samples (e.g., Lovegrove et al., 2012; Schwartz et al., 2001). However, there have been discrepant findings in predominantly Black samples.
Limitations
The findings presented here offer a key step forward in peer victimization research, but this study is not without limitations. First, there is some concern that self‐report measures of aggression and peer victimization may be biased. Previous research has suggested that peers may be better reporters of others’ aggressive behaviors (NASEM, 2016). Although peer nominations may be a gold standard, they do require extensive time and funding, are heavily influenced by the social context, and increase in complexity with the broadening of social networks as children move into adolescence. Moreover, latent subgroup findings from studies using other informants (peers, teachers) have identified slightly different subgroups (Bettencourt et al., 2017; Giang & Graham, 2008) than the four subgroups commonly identified in prior research. Self‐report measures also have important advantages over teacher or independent observer reports as some peer victimization events, particularly in adolescence, may be too brief to observe or intentionally occur in low traffic areas outside of view from adults, and the presence of adults may actually reduce the chance that such incidents will occur (Pelligrini, 2001). Thus, future research should consider the role of DIF in peer and teacher‐reported measures of aggression and peer victimization. Second, by using a MIMIC modeling framework to evaluate DIF, we assumed configural invariance (i.e., there were the same number of latent subgroups across different levels of the covariates examined in this study and that the general class‐specific patterns of item endorsement were consistent across covariate values) in all DIF analyses. Such an assumption is common in measurement invariance work in the context of FA (Jorgensen et al., 2017; Sass, 2011) and is in line with a robust literature supporting the existence of four subgroups of youth involved in peer victimization (e.g., Bettencourt et al., 2013; Schwartz et al., 2001). However, future work should consider evaluating the configural invariance of latent subgroups of youth involved in peer victimization across observed subgroups using a multiple‐group LCA approach, if sample size allows.
Third, there are a number of previous studies suggesting a change in peer victimization involvement across development (e.g., Bettencourt et al., 2013; Ettekal & Ladd, 2017). However, the present study was cross‐sectional and therefore we were unable to examine how DIF might impact these measures over time. Relatedly, this study focused intentionally on early adolescence, a period when peer victimization involvement peaks (Nansel et al., 2003). However, aggression and victimization as constructs and the measurement of these constructs can look different during different developmental periods (Casper et al., 2015). In light of these issues, it is recommended that future research consider the role of DIF in the measurement of aggression and victimization during different development periods as well as in the context of longitudinal studies within a single developmental period. Fourth, although we did explore the impact of study site in relation to measurement invariance, we did not explore other possible sources of DIF at the school level (e.g., norms supporting aggression, racial‐ethnic diversity of the school) or other contextual sources of DIF (e.g., family factors). It is important to acknowledge that the complexity of the current analytic approach provides both an opportunity to consider these additional contextual sources of DIF and a challenge to researchers working with small samples or who may lack the statistical expertise to implement this approach.
Fifth, the majority of schools in the present study were specifically selected for having low resources, high rates of violence, and being located in significantly disadvantaged environments. This is consistent with the fact that 81% of youth in this study were members of one of the involved subgroups, which is notably higher than other studies (e.g., Bettencourt & Farrell, 2013; Lovegrove et al., 2012). Finally, these data were collected nearly 20 years ago. Although verbal and physical aggression and victimization remain relevant problems, this study excludes relational forms of aggression and victimization which tend to be more common in girls and measures of aggression and victimization occurring in the electronic context, both of which are significant problems in the present historical context (NASEM, 2016). Given these unique contexts, our findings may not generalize to other populations not exposed to such contextual risk factors or to those experiencing other forms and contexts for peer victimization not captured in this study. However, the measurement issues identified in this study remain relevant regardless of the age of the data.
Strengths and conclusions
The number of strengths of this study, however, far outweigh the weaknesses. First and foremost, the MVPP sample consists of a large diverse multi‐site sample. The inclusion of large proportions of different race‐ethnicities as well as semi‐rural and urban environments is incredibly unique and an asset to research on aggression and victimization. Although this diversity of race‐ethnicities and study sites is a strength, it is also important to acknowledge that race‐ethnicity is confounded with study site in the present study. Therefore, we took care to explore the impact of each of these variables on class indicators and class membership while controlling for the other to isolate the unique effects. Second, the relatively large sample with detailed aggression and victimization questions is essential for the complex modeling involved with measurement invariance.
In conclusion, the findings offer a strong step forward and a template for future studies on aggression and victimization, with an emphasis on probing and accounting for DIF in relation to key demographic variables. Exploration of DIF in peer victimization research is not common, but as the findings from this study suggest there may be crucial findings missed or misinterpreted without it. As the field moves forward, incorporation of DIF into peer victimization models will be necessary to reduce bias in results. Furthermore, with advances in latent variable modeling, the field has the tools and knowledge to incorporate key model testing within analytic protocols.
Supporting information
Appendix S1
ACKNOWLEDGMENTS
The authors are grateful to the members of the Multi‐Site Violence Prevention Project for permission to use the data for this study: Centers for Disease Control and Prevention, Atlanta GA: Thomas R. Simon, Robin M. Ikeda, Emilie Smith (Penn State University); Le’Roy E. Reese (Morehouse School of Medicine); Duke University, Durham NC: David L. Rabiner, Shari Miller (Research Triangle Institute), Donna‐Marie Winn (University of North Carolina—Chapel Hill), Kenneth A. Dodge, Steven R. Asher; University of Georgia, Athens GA: Arthur M. Horne, Pamela Orpinas, Roy Martin, William H. Quinn (Clemson University); University of Illinois at Chicago, Chicago IL: Patrick H. Tolan (University of Virginia), Deborah Gorman‐Smith (University of Chicago), David B. Henry, Franklin N. Gay (University of Chicago), Michael Schoeny (University of Chicago), Virginia Commonwealth University, Richmond VA: Albert D. Farrell, Aleta L. Meyer (Administration for Children and Families, Washington, DC); Terri N. Sullivan, Kevin W. Allison.
Bettencourt, A. F. , Musci, R. J. , Masyn, K. E. , & Farrell, A. D. (2022). Latent classes of aggression and peer victimization: Measurement invariance and differential item functioning across sex, race‐ethnicity, cohort, and study site. Child Development, 93, e117–e134. 10.1111/cdev.13691
REFERENCES
- Bauer, D. J. (2017). A more general model for testing measurement invariance and differential item functioning. Psychological Methods, 22, 507. 10.1037/met0000077 [DOI] [PMC free article] [PubMed] [Google Scholar]
- Bettencourt, A. F. , & Farrell, A. D. (2013). Individual and contextual factors associated with patterns of aggression and peer victimization during middle school. Journal of Youth and Adolescence, 42, 285–302. 10.1007/s10964-012-9854-8 [DOI] [PubMed] [Google Scholar]
- Bettencourt, A. , Farrell, A. , Liu, W. , & Sullivan, T. (2013). Stability and change in patterns of peer victimization and aggression during adolescence. Journal of Clinical Child and Adolescent Psychology, 42, 429–441. 10.1080/15374416.2012.738455 [DOI] [PubMed] [Google Scholar]
- Bettencourt, A. F. , Musci, R. , Clemans, K. , Carinci, J. , & Ialongo, N. (2017). Patterns of peer‐ and teacher‐rated aggression, victimization, and prosocial behavior in an urban, predominantly African American preadolescent sample: Associations with peer perceived characteristics. Journal of School Psychology, 65, 83–101. 10.1016/j.jsp.2017.07.003 [DOI] [PubMed] [Google Scholar]
- Bradshaw, C. P. , Schaeffer, C. M. , Petras, H. , & Ialongo, N. (2010). Predicting negative life outcomes from early aggressive‐disruptive behavior trajectories: Gender differences in maladaptation across life domains. Journal of Youth and Adolescence, 39, 953–966. 10.1007/s10964-009-9442-8 [DOI] [PubMed] [Google Scholar]
- Bradshaw, C. P. , Waasdorp, T. E. , Goldweber, A. , & Johnson, S. L. (2013). Bullies, gangs, drugs, and school: Understanding the overlap and the role of ethnicity and urbanicity. Journal of Youth and Adolescence, 42, 220–234. 10.1007/s10964-012-9863-7 [DOI] [PubMed] [Google Scholar]
- Brown, B. B. , Bakken, J. P. , Ameringer, S. W. , & Mahon, S. D. (2008). A comprehensive conceptualization of the peer influence process in adolescence. In Prinstein M. J. & Dodge K. A. (Eds.), Understanding peer influence in children and adolescents (pp. 17–44). Guilford Press. [Google Scholar]
- Casper, D. M. , Meter, D. J. , & Card, N. A. (2015). Addressing measurement issues related to bullying involvement. School Psychology Review, 44, 353–371. 10.17105/spr-15-0036.1 [DOI] [Google Scholar]
- Chen, C. M. , Harford, T. C. , Grant, B. F. , & Chou, S. P. (2020). Association between aggressive and non‐fatal suicidal behaviors among U.S. high school students. Journal of Affective Disorders, 277, 649–657. 10.1016/j.jad.2020.08.061 [DOI] [PMC free article] [PubMed] [Google Scholar]
- Cook, C. R. , Williams, K. R. , Guerra, N. G. , Kim, T. E. , & Sadek, S. (2010). Predictors of bullying and victimization in childhood and adolescence: A meta‐analytic investigation. School Psychology Quarterly, 25, 65–83. 10.1037/a0020149 [DOI] [Google Scholar]
- Ettekal, I. , & Ladd, G. W. (2017). Developmental continuity and change in physical, verbal, and relational aggression and peer victimization from childhood to adolescence. Developmental Psychology, 53, 1709–1721. 10.1037/dev0000357 [DOI] [PMC free article] [PubMed] [Google Scholar]
- Farrell, A. D. , Sullivan, T. N. , Goncy, E. A. , & Le, A. H. (2016). Assessment of adolescents’ victimization, aggression, and problem behaviors: Evaluation of the Problem Behavior Frequency Scale. Psychological Assessment, 28, 702–714. 10.1037/pas0000225 [DOI] [PMC free article] [PubMed] [Google Scholar]
- Finch, W. H. , & Bronk, K. C. (2011). Conducting confirmatory latent class analysis using M plus. Structural Equation Modeling, 18, 132–151. [Google Scholar]
- Giang, M. T. , & Graham, S. (2008). Using latent class analysis to identify aggressors and victims of peer harassment. Aggressive Behavior, 34, 203–213. 10.1002/ab.20233 [DOI] [PubMed] [Google Scholar]
- Goldweber, A. , Waasdorp, T. E. , & Bradshaw, C. P. (2013). Examining associations between race, urbanicity, and patterns of bullying involvement. Journal of Youth and Adolescence, 42, 206–219. 10.1007/s10964-012-9843-y [DOI] [PubMed] [Google Scholar]
- Hawley, P. H. (2014). The duality of human nature: Coercion and prosociality in youths’ hierarchy ascension and social success. Current Directions in Psychological Science, 23, 433–438. 10.1177/0963721414548417 [DOI] [Google Scholar]
- Hektner, J. M. , August, G. J. , Bloomquist, M. L. , Lee, S. , & Klimes‐Dougan, B. (2014). A 10‐year randomized controlled trial of the Early Risers conduct problems preventive intervention: Effects on externalizing and internalizing in late high school. Journal of Consulting and Clinical Psychology, 82, 355–360. 10.1037/a0035678 [DOI] [PubMed] [Google Scholar]
- Henry, D. B. , Farrell, A. D. ; the Multisite Violence Prevention Project . (2004). The study designed by a committee: Design of the multisite violence prevention project. American Journal of Preventive Medicine, 26, 12–19. 10.1016/j.amepre.2003.09.027 [DOI] [PMC free article] [PubMed] [Google Scholar]
- Hess, L. E. , & Atkins, M. S. (1998). Victims and aggressors at school: Teacher, self, and peer perceptions of psychosocial functioning. Applied Developmental Science, 2, 75–89. 10.1207/s1532480xads0202_2 [DOI] [Google Scholar]
- Jorgensen, T. D. , Kite, B. A. , Chen, P. Y. , & Short, S. D. (2017) Finally! A valid test of configural invariance using permutation in multigroup CFA. In van der Ark L. A., Wiberg M., Culpepper S. A., Douglas J. A., & Wang W. C. (Eds.), Quantitative psychology. IMPS 2016. Springer proceedings in mathematics & statistics (Vol. 196). Springer. 10.1007/978-3-319-56294-0_9 [DOI] [Google Scholar]
- Kim, M. , Vermunt, J. , Bakk, Z. , Jaki, T. , Van Horn, M. L. , & Kim, M. (2016). Modeling predictors of latent classes in regression mixture models. Structural Equation Modeling, 23, 601–614. 10.1080/10705511.2016.1158655 [DOI] [PMC free article] [PubMed] [Google Scholar]
- Kim, S. , Kim, S. H. , & Kamphaus, R. W. (2010). Is aggression the same for boys and girls? Assessing measurement invariance with confirmatory factor analysis and item response theory. School Psychology Quarterly, 25, 45. 10.1037/a0018768 [DOI] [Google Scholar]
- Lovegrove, P. J. , Henry, K. L. , & Slater, M. D. (2012). Examination of the predictors of latent class typologies of bullying involvement among middle school students. Journal of School Violence, 11, 75–93. 10.1080/15388220.2011.631447 [DOI] [PMC free article] [PubMed] [Google Scholar]
- Masyn, K. (2013). Latent class analysis and finite mixture modeling. In Little T. D. (Ed.), The Oxford handbook of quantitative methods in psychology (Vol. 2, pp. 551–611). Oxford University Press. [Google Scholar]
- Masyn, K. (2017). Measurement invariance and differential item functioning in latent class analysis with stepwise multiple indicator multiple cause modeling. Structural Equation Modeling, 24, 180–197. 10.1080/10705511.2016.1254049 [DOI] [Google Scholar]
- McDougall, P. , & Vailliancourt, T. (2015). Long‐term adult outcomes of peer victimization in childhood and adolescence: Pathways to adjustment and maladjustment. American Psychologist, 70, 300–310. 10.1037/a0039174 [DOI] [PubMed] [Google Scholar]
- Miller‐Johnson, S. , Moore, B. L. , Underwood, M. K. , & Coie, J. D. (2005). African‐American girls and physical aggression: Does stability of childhood aggression predict later negative outcomes? In Pepler D. J., Madsen K. C., Webster C., & Levene K. S. (Eds.), The development and treatment of girlhood aggression (pp. 75–95). Lawrence Erlbaum Associates. [Google Scholar]
- Multisite Violence Prevention Project . (2008). The Multisite Violence Prevention Project: Impact of a universal school‐based violence prevention program on social‐cognitive outcomes. Prevention Science, 9, 231–244. 10.1007/s11121-008-0101-1 [DOI] [PMC free article] [PubMed] [Google Scholar]
- Multisite Violence Prevention Project . (2009). The ecological effects of universal and selective violence prevention programs for middle school students: A randomized trial. Journal of Consulting and Clinical Psychology, 77, 526–542. 10.1037/a0014395 [DOI] [PMC free article] [PubMed] [Google Scholar]
- Muthén, L. K. , & Muthén, B. O. (1998–2017). Mplus user’s guide (8th ed.). Muthén & Muthén. [Google Scholar]
- Nansel, T. R. , Haynie, D. L. , & Simons‐Morton, B. G. (2003). The association of bullying and victimization with middle school adjustment. Journal of Applied School Psychology, 19, 45–61. 10.1300/J008v19n02_04 [DOI] [Google Scholar]
- National Academies of Sciences, Engineering & Medicine . (2016). Preventing bullying through science, policy, and practice. The National Academies Press. 10.17226/23482 [DOI] [PubMed] [Google Scholar]
- Nylund, K. L. , Asparouhov, T. , & Muthén, B. O. (2007). Deciding on the number of classes in latent class analysis and growth mixture modeling: A Monte Carlo simulation study. Structural Equation Modeling, 14, 535–569. 10.1080/10705510701575396 [DOI] [Google Scholar]
- Nylund, K. , Bellmore, A. , Nishina, A. , & Graham, S. (2007). Subtypes, severity, and structural stability of peer victimization: What does latent class analysis say? Child Development, 78, 1706–1722. 10.1111/j.1467-8624.2007.01097.x [DOI] [PubMed] [Google Scholar]
- Pelligrini, A. D. (2001). Sampling instances of victimization in middle school: A methodological comparison. In Juvonen J. & Graham S. (Eds.), Peer harassment in school: The plight of the vulnerable and victimized (pp. 147–174). Guilford Press. [Google Scholar]
- Sass, D. A. (2011). Testing measurement invariance and comparing latent factor means within a confirmatory factor analysis framework. Journal of Psychoeducational Assessment, 29, 347–363. 10.1177/0734282911406661 [DOI] [Google Scholar]
- Satorra, A. , & Bentler, P. M. (2010). Ensuring positiveness of the scaled difference chi‐square test statistic. Psychometrika, 75, 243–248. 10.1007/s11336-009-9135-y [DOI] [PMC free article] [PubMed] [Google Scholar]
- Schmiege, S. J. , Masyn, K. E. , & Bryan, A. D. (2017). Confirmatory latent class analysis: Illustrations of empirically driven and theoretically driven model constraints. Organizational Research Methods, 21, 983–1001. 10.1177/1094428117747689 [DOI] [Google Scholar]
- Schuster, M. A. , Elliott, M. N. , Kanouse, D. E. , Wallander, J. L. , Tortolero, S. R. , Ratner, J. A. , Klein, D. J. , Cuccaro, P. M. , Davies, S. L. , & Banspach, S. W. (2012). Racial and ethnic health disparities among fifth‐graders in three cities. The New England Journal of Medicine, 367, 735–745. 10.1056/NEJMsa1114353 [DOI] [PubMed] [Google Scholar]
- Schwartz, D. , Proctor, L. , & Chien, D. (2001). The aggressive victim of bullying: Emotional and behavioral dysregulation as a pathway to victimization by peers. In Juvonen J. & Graham S. (Eds.), Peer harassment in school: The plight of the vulnerable and victimized (pp. 147–174). The Guilford Press. [Google Scholar]
- Seidman, E. , & French, S. E. (2004). Developmental trajectories and ecological transitions: A two‐step procedure to aid in the choice of prevention and promotion interventions. Development and Psychopathology, 16, 1141–1159. 10.1017/S0954579404040179 [DOI] [PubMed] [Google Scholar]
- Wang, J. , Iannotti, R. J. , & Nansel, T. R. (2009). School bullying among adolescents in the United States: Physical, verbal, relational, and cyber. Journal of Adolescent Health, 45, 368–375. 10.1016/j.jadohealth.2009.03.021 [DOI] [PMC free article] [PubMed] [Google Scholar]
Associated Data
This section collects any data citations, data availability statements, or supplementary materials included in this article.
Supplementary Materials
Appendix S1