

Summary
Failure to reorganize the endoplasmic reticulum (ER) in mitosis results in chromosome missegregation. Here, we show that accurate chromosome segregation in human cells requires cell cycle regulated ER membrane production. Excess ER membranes increase the viscosity of the mitotic cytoplasm to physically restrict chromosome movements, which impedes the correction of mitotic errors leading to formation of micronuclei. Mechanistically, we demonstrate that the protein phosphatase CTDNEP1 counteracts mTOR kinase to establish a dephosphorylated pool of the phosphatidic acid phosphatase lipin 1 in interphase. CTDNEP1 control of lipin 1 limits the synthesis of fatty acids for ER membrane biogenesis in interphase that then protects against chromosome missegregation in mitosis. Thus, regulation of ER size can dictate the biophysical properties of mitotic cells, providing an explanation for why ER reorganization is necessary for mitotic fidelity. Our data further suggest that dysregulated lipid metabolism is a potential source of aneuploidy in cancer cells.
Keywords: CTDNEP1, lipin, mTOR, lipid homeostasis, micronuclei, aneuploidy, nuclear assembly, mitosis, medulloblastoma
Graphical Abstract

eTOC Blurb
Restructuring of the endoplasmic reticulum (ER) is required for mitotic fidelity. Merta, Carrasquillo Rodriguez et al. show that cell cycle regulation of a lipid synthesis enzyme restricts ER proliferation, thus protecting against mitotic errors. Excess ER membranes can alter the biophysical properties of mitotic cells to cause chromosome missegregation.
Introduction
The endoplasmic reticulum (ER) is a large membrane-bound organelle composed of interconnected membrane sheets and tubules that are continuous with the nuclear envelope (NE) (Baumann and Walz, 2001; Friedman and Voeltz, 2011). In animal cells, ER membranes are spread throughout the cytoplasm extending from the NE along the microtubule (MT) cytoskeleton to the cell periphery (English and Voeltz, 2013). The ER loses most of its interactions with MTs in mitosis (Smyth et al., 2012; Wang et al., 2013), and NE/ER membranes undergo extensive remodeling to become excluded from the region occupied by the mitotic spindle in metaphase (Champion et al., 2017; Liu and Pellman, 2020; Lu et al., 2011; Puhka et al., 2012; Puhka et al., 2007). The mechanisms that drive ER membrane exclusion from mitotic spindle MTs are not fully understood; however, both active mechanisms, mediated by the minus-end MT motor dynein (Turgay et al., 2014) and by the ER tubule shaping proteins REEP3/4 (Kumar et al., 2019; Schlaitz et al., 2013), and passive mechanisms, resulting from loss of MT-ER interactions, are involved (Liu and Pellman, 2020).
Little is known about the significance of the spatial reorganization of ER membranes in mitosis. The remodeling of ER membranes and their location away from the mitotic spindle may facilitate equal partitioning of the ER to daughter cells (Champion et al., 2017). Some evidence also suggests that the ER surrounding spindle MTs serves as part of an organelle-exclusion ‘spindle envelope’ that spatially confines mitotic proteins to the spindle region (Schweizer et al., 2015). Importantly, persistent ER membrane contacts with mitotic chromosomes, but not with spindle MTs, have been associated with higher incidences of chromosome missegregation (Champion et al., 2019; Luithle et al., 2020; Schlaitz et al., 2013; Smyth et al., 2012).
The need for ER membranes to be excluded from the spindle region may be met by restricting the production of ER membranes prior to cell entry into mitosis. The accumulation of membrane glycerophospholipids increases in interphase (Habenicht et al., 1985; Jackowski, 1994), but whether ER membrane synthesis is coupled to ER membrane reorganization in mitosis has not been tested.
To understand if there is a role for cell cycle regulation of ER membrane biogenesis to ensure its mitotic reorganization, we focused on the highly conserved but understudied human serine/threonine (S/T) protein phosphatase CTDNEP1 (C-Terminal Domain Nuclear Envelope Phosphatase 1), which forms a complex with CNEP1R1 (Spo7p in budding yeast/NEPR-1 in C. elegans) to dephosphorylate a key enzyme in lipid synthesis, lipin 1 (Pah1p in budding yeast/Ned1 in fission yeast/LPIN-1 in C. elegans) (Han et al., 2012; Kim et al., 2007). Work in non-mammalian model systems demonstrated that CTDNEP1 (Nem1p in fission and budding yeasts/CNEP-1 in C. elegans) regulation of lipin impacts mitotic processes (Bahmanyar et al., 2014; Han et al., 2012; O’Hara et al., 2006; Siniossoglou et al., 1998; Tange et al., 2002; Zhang and Reue, 2017). CTDNEP1Nem1 control of lipin has a role in expansion of the NE necessary to accommodate the elongating mitotic spindle in closed mitosis of budding and fission yeasts (Makarova et al., 2016; Witkin et al., 2012). In C. elegans embryos, CTDNEP1cnep-1 restricts ER expansion through regulation of lipin to facilitate the breakdown and fusion of pronuclear membranes (Bahmanyar et al., 2014). Some evidence also suggests that lipid signaling by CTDNEP1/lipin facilitates NE breakdown in open mitosis of human cells (Mall et al., 2012). However, a role for CTDNEP1/lipin in mitotic ER reorganization in mammalian cells has not been shown, although the fact that CTDNEP1 qualifies as a candidate for the long sought-after tumor suppressor in Group 3/4 medulloblastomas (Jones et al., 2012; Northcott et al., 2012) further motivated its functional analysis in human cells.
Human CTDNEP1 with its binding partner CNEP1R1 dephosphorylates lipin proteins when overexpressed (Han et al., 2012), but a direct link to endogenous lipin 1 dephosphorylation and how this relates to ER lipid synthesis has not been shown. Lipin proteins are peripheral membrane binding, Mg2+-dependent phosphatidic acid phosphatases (PAPs) that catalyze the conversion of phosphatidic acid (PA) to diacylglycerol (DAG) on the outer leaflet of the ER (Zhang and Reue, 2017). PA and DAG are precursors for the production of the membrane glycerolipids, (phosphatidylcholine (PC), phosphatidylethanolamine (PE), and phosphatidylinositol (PI)), as well as triglycerides (Fagone and Jackowski, 2009). There are three lipins in mammalian cells, and lipin 1 (expressed as isoforms α, β, and γ) has the highest phosphatic acid phosphatase (PAP) activity (Donkor et al., 2007). Lipin 1 is phosphorylated at multiple S/T sites, at least 19 of which are known to increase its catalytic activity in vitro when mutated to alanine (Eaton et al., 2013). The relevance of lipin 1 phosphorylation to its local activity towards PA within cells is not well-understood (Zhang and Reue, 2017).
Lipin 1 can also translocate into the nucleus to control the expression of genes required for lipid metabolism (Finck et al., 2006; Harris and Finck, 2011; Peterfy et al., 2005; Peterson et al., 2011; Zhang and Reue, 2017). Direct phosphorylation of lipin 1 by the nutrient sensing kinase mTORC1 promotes its enrichment in the cytoplasm to allow the transcription of genes encoding for fatty acid (FA) enzymes by Sterol Regulatory Element Binding Protein 1 (SREBP1) (Peterson et al., 2011). It has been predicted that CTDNEP1/CNEP1R1 complex dephosphorylates a mTORC1-directed phosphorylation site on lipin 1 (Wu et al., 2011); however, a direct demonstration of counteracting activities for CTDNEP1 phosphatase and mTOR kinase on lipin 1 is lacking. Lipin 1 is also hyperphosphorylated in mitosis, when mTORC1 is inactive (Odle et al., 2020), on consensus sites for cyclin dependent kinase 1 (Cdk1) (Grimsey et al., 2008). The Mg2+-dependent PAP activity is lower in mitotic cells (Grimsey et al., 2008); however, the significance of the mitotic phosphorylation of lipin 1 is not well-understood.
Here, we show that human CTDNEP1 regulation of lipin 1 limits de novo FA synthesis to restrict ER membrane biogenesis specifically in interphase. When CTDNEP1 is absent, prometaphase cells inherit expanded ER membranes, which increase the viscosity of the mitotic cytoplasm and slow chromosome movements. The slower mobility of chromosomes impairs the correction of mitotic errors and increases the incidence of cells that contain micronuclei. We demonstrate that CTDNEP1 counteracts mTOR-mediated phosphorylation of lipin 1 to establish and maintain a dephosphorylated pool of lipin 1 in interphase. The absence of this dephosphorylated pool makes lipin 1 less stable and corresponds to an increase in de novo FA synthesis. Inhibition of a rate-limiting enzyme for FA synthesis upregulated in CTDNEP1 knockout cells suppresses both the expansion of the ER in interphase cells and the formation of micronuclei. Thus, the regulation of ER membrane production in interphase by CTDNEP1/lipin 1 is required for mitotic fidelity.
Results
CTDNEP1 regulation of lipin 1 restricts ER membrane proliferation
The conserved integral membrane protein phosphatase CTDNEP1 dephosphorylates lipin in all organisms tested (Bahmanyar et al., 2014; Kim et al., 2007; O’Hara et al., 2006); however, almost nothing is known about CTDNEP1–s role in regulation of lipin 1 to control ER membrane biogenesis in mammalian cells (Figure 1A). We found that a genome-edited homozygous clonal U2OS knockout cell line for CTDNEP1 as well as cells subjected to RNAi-mediated depletion of CTDNEP1 contain reduced levels of lipin 1 protein as well as the absence of a faster migrating product (Figures 1B and S1A–S1C). Treatment with exogenous lambda phosphatase resulted in an electrophoretic mobility shift of lipin 1 to a faster migrating species in both wild type and knockout cells (Figure S1D), indicating that lipin 1 is in a mostly phosphorylated form in CTDNEP1 knockout cells. Stable expression of wild type (WT) CTDNEP1, but not a catalytically inactive version (PD, phosphatase dead) (Kim et al., 2007; Seifried et al., 2013), restored both lipin 1 levels and phosphorylation states (Figure 1B). Thus, catalytically active human CTDNEP1 is required to maintain a dephosphorylated pool of lipin 1 and may be required to stabilize lipin 1 protein levels.
Figure 1. ER membrane expansion and formation of micronuclei in the absence of CTDNEP1.
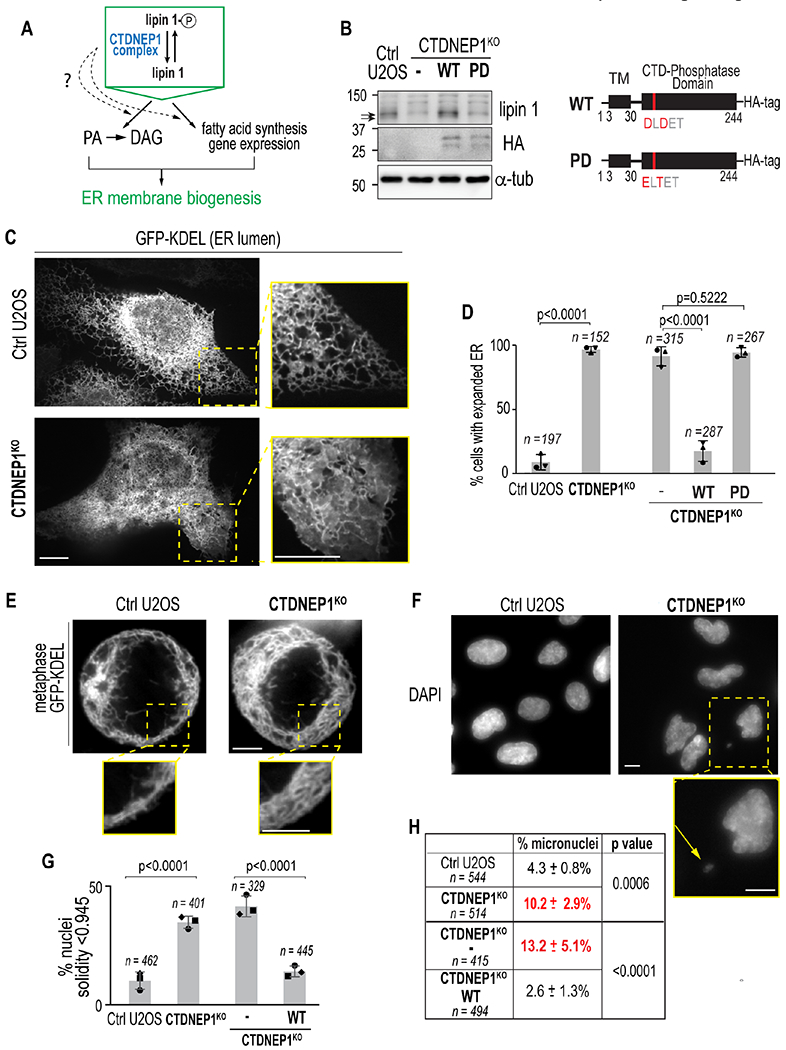
(A) Schematic of CTDNEP1 regulation of lipin 1. (B) Immunoblot of whole cell lysate of indicated conditions. Arrows, lipin 1 phospho-species. Right: schematic of wild type (WT) and phosphatase dead (PD) human CTDNEP1. (C) Spinning disk confocal images in indicated cells. (D) Plot, % of cells with indicated phenotypes analyzed live with GFP-KDEL (left two) or in fixed cells with calnexin staining (right three). (E) Spinning disk confocal images in indicated metaphase cells. (F) Epifluorescence images of nuclei in indicated cells. Inset: micronucleus (arrow). (G) Plot, incidence of nuclei with solidity value < 1 SD from control mean solidity. Data in right two and left two bars are from separate experiments. (H) Incidence of micronuclei in indicated cells. For all: scale bars, 10 μm. Mean ± SDs shown (N = 3 experimental repeats). p values, Fisher’s exact tests. See also Figures S1–S2.
The ER phenotype following a penetrant RNAi-depletion of lipin 1 was distinct from CTDNEP1 knockout cells (Figures 1C and S1E–S1F). The morphology of the peripheral ER was severely altered without lipin 1 – instead of a uniform tubular network, ER membranes formed sparse tubules and interspersed sheet-like structures (Figure S1F). In contrast, there was an overabundance of ER membranes in interphase and mitotic CTDNEP1 knockout cells, which was confirmed by lipid mass spectrometry analysis of asynchronous cells as an increase in the levels of the major membrane glycerophospholipids (PC and PE) (Figure 1C–1E and S1G–S1H, Table S1). This expansion of the ER membrane network was also observed with an endogenous ER marker in fixed CTDNEP1 knockout cells (Figure S2A) and in U2OS and RPE-1 cells RNAi-depleted for CTDNEP1, but not U2OS cells depleted of lipin 1 (Figures S2B–S2E).
In agreement with the importance of dephosphorylating lipin 1 to control ER membrane biogenesis, overexpression of a catalytically active mouse lipin 1β with 19 S/T sites mutated to alanine (Peterson et al., 2011) was sufficient to suppress the expanded ER phenotype resulting from loss of CTDNEP1 (Figure S2F), whereas overexpression of wild type lipin 1β only partially restored the altered ER appearance (Figure S2F). This result combined with the fact that a penetrant RNAi-depletion of lipin 1 results in a distinct phenotype from CTDNEP1 knockout cells suggested that regulation of the phosphorylation state of lipin 1 by CTDNEP1 controls ER membrane biogenesis in mammalian cells. In line with this, in vitro measurements showed that lipin 1 retains enzyme activity in CTDNEP1 knockout cells (Figure S2G–S2H), albeit at a lower level than control cells. Furthermore, increased incorporation of radiolabeled acetate into lipids in CTDNEP1 knockout cells suggests increased synthesis of membrane lipids made from de novo synthesized FAs (Figure S2I). Thus, an increased flux of FAs into glycerophospholipid synthesis may override the partial reduction in overall lipin 1 levels and activity in CTDNEP1 knockout cells to lead to ER membrane expansion.
CTDNEP1 knockout cells contain micronuclei
We found a conserved requirement for human CTDNEP1 in maintenance of nuclear structure (Figure 1F and 1G) (Bahmanyar et al., 2014; Fonseca et al., 2019; Siniossoglou et al., 1998); while measuring nuclear morphology, we frequently observed primary nuclei with micronuclei in interphase CTDNEP1 knockout cells, and this phenotype was also restored by stable expression of CTDNEP1-HA (Figure 1F, inset, and 1H). Micronuclei form because of improper attachment of spindle MTs to kinetochores that lead to lagging chromosomes in anaphase (Cimini, 2008; Liu and Pellman, 2020). Thus, the increased incidence of micronuclei in CTDNEP1 knockout cells may be related to excessive ER membranes interfering with some aspect of mitotic chromosomes and their ability to attach to spindle MTs.
Expanded ER membranes of CTDNEP1 knockout cells increase the viscosity of the mitotic cytoplasm and slow chromosome motions
Live imaging to monitor ER occupancy from anaphase onset to mitotic exit revealed that a consistently greater percentage of the cell diameter was taken up by ER membranes in CTDNEP1 RNAi-depleted or knockout cells (Figure 2A–2B, S3A–S3C; Movie S1), and this corresponded to a smaller region occupied by mitotic chromosomes (Figure 2A–2B). We next imaged synchronized cells in prometaphase to assess the spatial organization of ER membranes in relation to unaligned chromosomes (Figure 2C, arrows; Movie S2). In both control U2OS and CTDNEP1 knockout cells in prometaphase, an unaligned chromosome was observed within the peripheral ER network before moving towards the metaphase plate (Figure 2C, arrows; Movie S2); however, unlike control U2OS cells, CTDNEP1 knockout cells contained some ER membranes mislocalized to the spindle region (Figure 2C; Movie S2). To quantify the incidence of ER membranes invading the spindle region, we enriched for prometaphase and metaphase cells by performing a drugless mitotic shake off directly followed by live imaging (Figure 2D). Our phenotypic scoring of control and CTDNEP1 knockout cells revealed a significant proportion of CTDNEP1 knockout cells with ER membranes in the region occupied by mitotic chromosomes as assessed by DIC (Figure 2D). Thus, when CTDNEP1 is absent, excessive ER membranes occupy a larger area of the peripheral mitotic cytoplasm and aberrantly invade the region where mitotic chromosomes are located.
Figure 2. Expanded ER membranes, increased effective viscosity, and diminished chromosome dynamics of CTDNEP1 deleted mitotic cells.
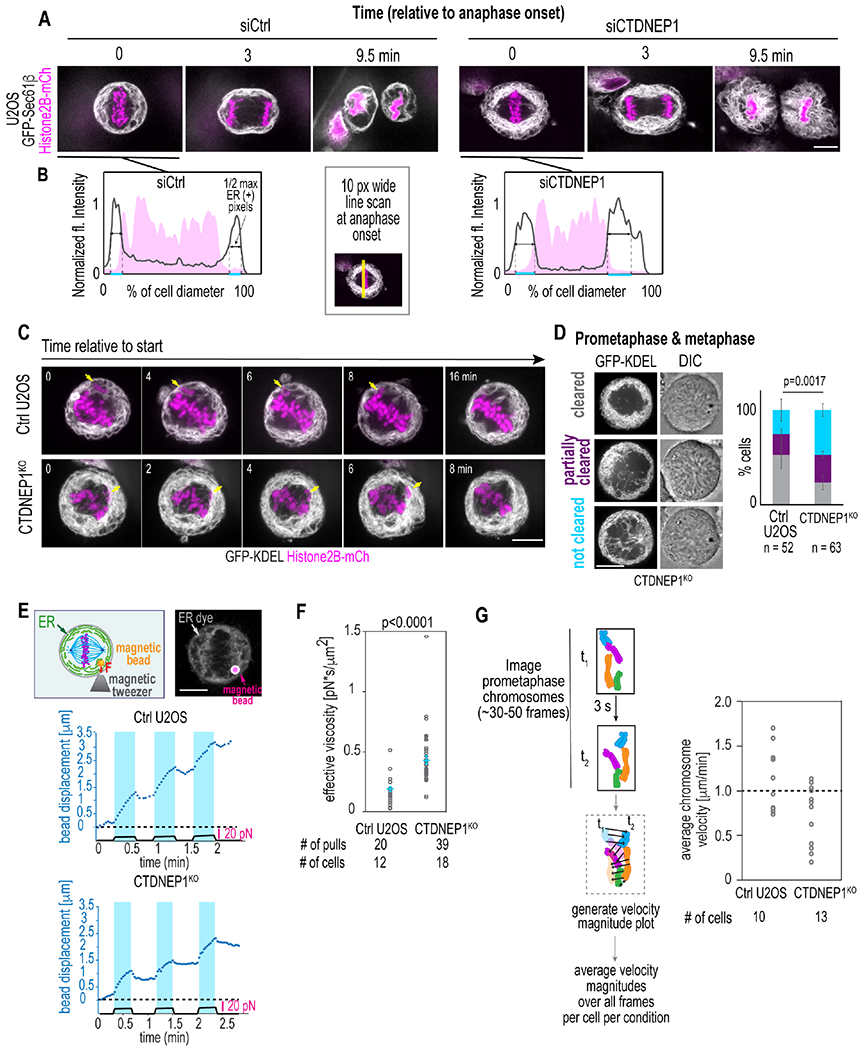
(A) Selected spinning disk confocal time lapse images in cells treated as indicated. (B) Plots, line profiles of fluorescent intensities along region shown. (C) Selected spinning disk confocal time lapse images in indicated cells after recovery from Cdk1i. Arrows, unaligned chromosomes. (D) Center plane spinning disk confocal images of mitotic cells. Plot, incidence of phenotypes. Means ± SDs shown. N = 3 experimental repeats. p value, χ2test. (E) Top: Schematic of experiment setup and confocal image of ER (gray) and magnetic bead (magenta) in a mitotic U2OS cell. Plots, applied force (black solid line) and bead displacement (blue dotted line). (F) Plot of effective cytoplasmic viscosity in indicated cells. Means ± SEM shown. p value, unpaired t test with Welch’s correction. (G) Schematic (left) for quantifying average velocity magnitudes for chromosomes for indicated cells in plot (right). Scale bars, 10 μm. See also Figure S3.
We hypothesized that the expanded occupancy of the ER in prometaphase of CTDNEP1 knockout cells contributes to viscous forces exerted on mitotic chromosomes. This idea predicts that mitotic chromosomes entrapped by the peripheral ER network would have slower short-range movements, which could impede the proper attachment of dynamic spindle MTs to kinetochores (Cimini et al., 2003). To test this idea, we monitored the displacement of magnetic beads approximately the size of a mitotic chromosome (~2-3 μm) in the periphery of mitotic cells in response to a constant force applied with magnetic tweezers (Figure 2E; Movie S3). In control U2OS cells, the displacement of a magnetic bead in response to a constant force of ~10 μN for ~20 seconds was ~1.5 μm (Figure 2E, top plot). In contrast, in CTDNEP1 knockout cells a similar force regime resulted in bead displacement of less than 1 μm (Figure 2E, bottom). These data revealed a two-fold increase in the effective viscosity of the mitotic cytoplasm of CTDNEP1 knockout cells compared to control U2OS cells (Figure 2F; 0.43 ± 0.04 pN * s / μm2 in CTDNEP1 knockout compared to 0.19 ± 0.02 pN * s / μm2 in control U2OS cells). High temporal resolution imaging of fluorescently-labeled prometaphase chromosomes revealed a greater proportion of CTDNEP1 knockout cells with an average chromosome velocity of less than 1 μm/ min (10/13 CTDNEP1 knockout cells compared to 5/10 control U2OS cells having an average magnitude velocity of <1 μm/ min; Figures 2G and S3D; Movie S4). The reduction in the displacements of mitotic chromosomes in CTDNEP1 knockout cells also suggests an explanation for the more compact occupancy of mitotic chromosomes at anaphase onset (Figure 2B). We conclude that when ER membrane are in excess they are more prone to persist in the area occupied by prometaphase chromosomes, effectively increasing the surrounding viscosity to cause slower chromosome motions.
Micronucleation in CTDNEP1 knockout cells results from a reduction in mitotic error correction
The slow motions of mitotic chromosomes in prometaphase might increase errors in MT-chromosome attachments, which would account for the increased incidence of micronuclei formation we observed in CTDNEP1-deleted cells. Inhibition of the spindle assembly checkpoint (SAC) serves as a readout for the rate of attachment errors because cells enter anaphase without resolving improperly attached or unattached kinetochores (Liu and Pellman, 2020). This results in a substantial increase in the frequency of chromosome missegregation events and micronucleation. To test if loss of CTDNEP1 enhances the frequency of erroneous attachments, we released cells synchronized in G2/M phase in the presence of an inhibitor to MPS1 (MPS1i), the mitotic kinase that activates the SAC (Figure 3A, “SAC override”; (Liu et al., 2018)). 39.9 % ± 1.9 % of control cells were micronucleated, reflecting the rate of unresolved errors in attachment prior to entry into anaphase, while 43.3 % ± 4.9 % of CTDNEP1 knockout cells were micronucleated (Figures 3B–3C). Although this increase was significant, the difference in the percentage of micronuclei between wild type and knockout cells is small, suggesting that an increased incidence of errors in MT attachments to kinetochores may not be the major source of increased micronucleation observed in CTDNEP1-deleted cells.
Figure 3. Loss of CTDNEP1 exacerbates the frequency of micronucleation upon transient spindle disassembly.
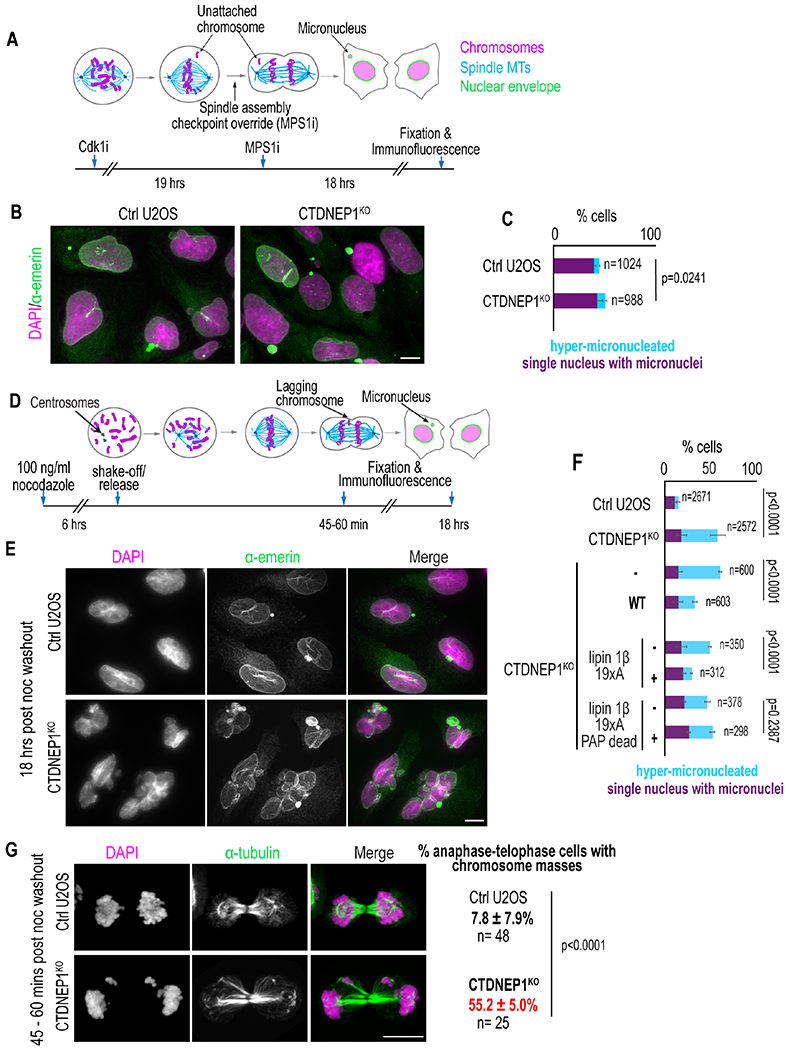
(A) Experimental setup for SAC inhibition. (B) Max projection of confocal images in cells treated as in (A). (C) Incidence of indicated phenotypes in indicated cells. (D) Experimental setup for transient spindle disassembly. (E) Max projection of confocal images in indicated cells after treatment as in (D). (F) Plot of phenotypic incidences in cells treated as indicated. (G) Max projection of confocal images of cells treated as indicated and incidences of indicated phenotypes. For all: Scale bars, 10 μm. Means ± SDs shown and N = 3 experimental repeats; p values, χ2 (C, F) or Fisher’s exact (G) test. See also Figure S4.
Another possibility is that dampened mitotic chromosome dynamics resulting from an increased viscosity of the cytoplasm in CTDNEP1 knockout cells impedes the correction of errors in MT and kinetochore attachments to cause chromosome missegregation and formation of micronuclei. Transient spindle disassembly by washout from nocodazole treatment increases the frequency of merotelic attachments in which a single kinetochore is attached to MTs from both spindle poles instead of just one (Cimini et al., 2003) (Figure 3D). Unlike other mis-attachments, merotelic attachments are not detected by the SAC; however, MT dynamics and chromosomal movements that promote biorientation substantially reduce these improper attachments prior to anaphase onset resulting in a modest, albeit significant, increase in lagging chromosomes and micronucleation after nocodazole-washout (Cimini, 2008; Cimini et al., 2003) (Figure 3D). Transient spindle disassembly led to the expected increase in micronucleation in control U2OS cells (Figures 3E–3F; compare 10.6 % ± 2.0 % in Figure 3F to 4.3 % ± 0.8 % in Figure 1H) (Cimini et al., 2003; Liu et al., 2018), whereas a significant percentage of CTDNEP1 knockout cells were severely micronucleated - in addition to one or two small micronuclei, these cells contained multiple severely multilobed nuclei (hereafter referred to as “hyper-micronucleation”; 40.0 ± 8.5 % in CTDNEP1 knockout compared to 4.3 ±1.2 % in control, Figures 3E–3F). We also observed more instances of chromosomes separated from the main mass after recovery from nocodazole treatment in telophase of CTDNEP1 knockout cells when compared to control (Figure 3G), consistent with the hyper-micronucleation phenotype resulting from errors in chromosome segregation. Importantly, the hyper-micronucleation phenotype was suppressed upon stable expression of CTDNEP1-HA (Figure 3F) and was also observed in RPE-1 cells RNAi-depleted for CTDNEP1 (Figures S4A–S4B). Taken together, these data suggest that merotelic attachments go uncorrected in CTDNEP1 knockout cells, leading to lagging chromosomes in anaphase that form micronuclei.
Micronucleation in CTDNEP1 knockout cells is suppressed by expression of a constitutively dephosphorylated lipin 1
We reasoned that if the hyper-micronucleation phenotype in CTDNEP1 knockout cells results from expanded ER membranes impairing chromosome movements, then expression of a constitutively dephosphorylated form of lipin 1 that suppresses ER expansion in these cells (Figure S2F) should also suppress hyper-micronucleation. Overexpression of a catalytically active mouse lipin 1β with 19 S/T sites mutated to alanine suppressed the hyper-micronucleation phenotype resulting from loss of CTDNEP1 (8.7 ± 1.0 % with FLAG-lipin 1β 19xA compared to 30.7 ± 1.4 % in control; 26.2 ± 2.8 % with phosphatase-dead FLAG-lipin 1β 19xA compared to 25.3 ± 3.4 % in control, Figure 3F). These data suggested that CTDNEP1 restricts ER membrane biogenesis through dephosphorylation of catalytically active lipin 1 so that mitotic cells inherit a less dense ER network, which allows mitotic error correction and prevents formation of micronuclei.
CTDNEP1 is necessary to establish and maintain a stable, dephosphorylated pool of lipin 1 in interphase by counteracting mTOR
Our data demonstrating that expression of lipin 1β with 19 S/T phosphorylation sites mutated to alanine, which includes the sites targeted by mTOR complex 1 (Peterson et al., 2011), is sufficient to restore the ER expansion (Figure S2F) and hyper-micronucleation (Figure 3F) phenotypes of CTDNEP1 knockout cells prompted us to test if CTDNEP1 maintains a dephosphorylated pool of lipin 1 by counteracting its phosphorylation by mTOR kinase. mTOR-mediated phosphorylation of lipin 1 controls lipid homeostasis by limiting its nuclear localization, which allows SREBPI-dependent expression of genes encoding for enzymes in the de novo FA synthesis pathway (Lamming and Sabatini, 2013; Peterson et al., 2011; Shimizu et al., 2017). Evidence also suggests that mTOR regulates lipin 1 protein stability through the proteasomal degradation pathway (Shimizu et al., 2017).
We first monitored the phosphorylation state of lipin 1 in a time course of asynchronous control and CTDNEP1 knockout cells treated with the mTOR kinase inhibitor Torin 1 (Peterson et al., 2011). Control U2OS cells showed a doublet of endogenous lipin 1 representing its distinct phosphorylation states (Figure 4A). Treating U2OS cells with Torin 1 for 30 minutes and after up to 12 hours caused a shift in the electrophoretic mobility of lipin 1 to the faster migrating, dephosphorylated product consistent with rapid dephosphorylation of lipin 1 in the absence of mTOR kinase activity (Figure 4A). In contrast, the dephosphorylated species of lipin 1 did not appear until 2 hours of Torin 1 treatment in CTDNEP1 knockout cells and was present at much lower levels throughout the time course of the experiment when compared to control U2OS cells (Figure 4A). These data suggested that the majority of lipin 1 that becomes dephosphorylated upon inhibition of mTOR kinase activity depends on CTDNEP1.
Figure 4. CTDNEP1 counteracts mTOR phosphorylation of lipin 1 in interphase.
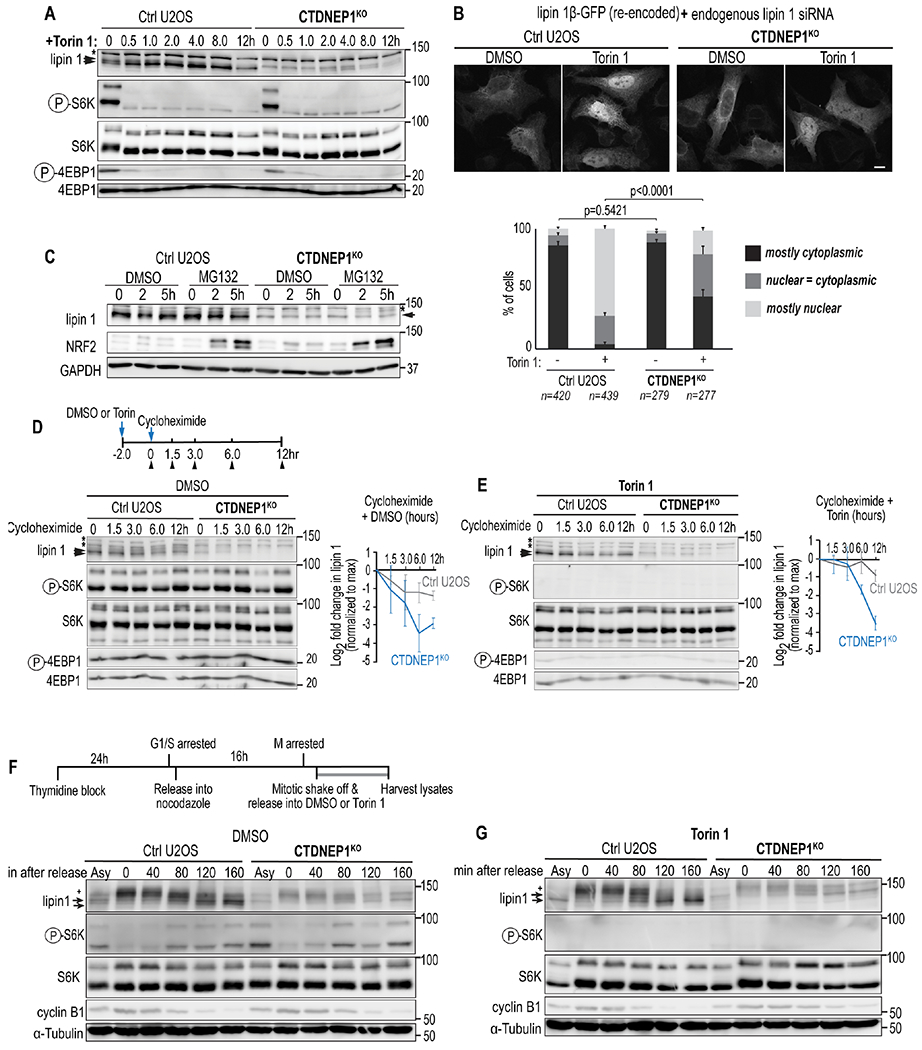
(A) Immunoblot of lipin 1 from whole cell lysates treated as indicated. (B) Top: Confocal images of fixed cells per indicated conditions. Scale bar, 10μm. Bottom: Plot of nuclear versus cytoplasmic localization of lipin 1 per indicated conditions. p values, χ2 test. (C-E) Immunoblot of whole cell lysates from cells treated as indicated. Plots: Normalized lipin 1 band intensities in indicated conditions. (F, G) Above: Schematic of mitotic synchronization protocol. Below: Immunoblots of whole cell lysates from synchronized cells treated as indicated. Plus signs, lipin 1 mitotic species. Arrowheads, lipin 1 interphase phospho-species; asterisks, non-specific bands. N = 3 experimental repeats. Means ± SDs shown.
Inhibition of mTOR kinase by Torin 1 results in translocation of lipin 1 from the cytoplasm to the nucleus (Peterson et al., 2011). Consistent with this, human lipin 1β fused to GFP localized to the nucleus in the majority of Torin 1-treated control U2OS cells that were selectively RNAi-depleted for endogenous lipin 1 (Figure 4B; (Sołtysik et al., 2021)). In contrast, lipin 1β-GFP remained mostly cytoplasmic or only partially translocated to the nucleus in Torin 1-treated CTDNEP1 knockout cells (Figure 4B). These data further indicated that CTDNEP1 counteracts mTOR-mediated regulation of lipin 1.
We next tested if CTDNEP1 has a role in stabilizing the levels of lipin 1 protein. Small molecule inhibition of the proteasome with MG132 resulted in the accumulation of a slower-migrating lipin 1 product in CTDNEP1 knockout cells that is likely a hyperphosphorylated species of lipin 1 readily degraded by the proteasome in these cells (Figure 4C). Cycloheximide treatment to prevent new protein translation showed that lipin 1 protein levels are less stable in CTDNEP1 knockout cells (Figure 4D). Torin 1 treatment of CTDNEP1 knockout cells did not fully restore the stability of lipin 1 (Figure 4E). Thus, CTDNEP1 protects lipin 1 protein from proteasomal degradation and it does so by counteracting signals aside from those mediated by mTOR.
To test whether CTDNEP1 is necessary in interphase and/or mitosis to establish a stable, dephosphorylated pool of lipin 1, we monitored the phosphorylation state of endogenous lipin 1 in a time course of control and CTDNEP1 knockout cells released from mitotic arrest. The prominent form of lipin 1 in mitosis is a slow-migrating, hyperphosphorylated species, hereafter referred to as “mitotic lipin 1” (Grimsey et al., 2008) (Figure 4F and 4G). The electrophoretic mobility of mitotic lipin 1 does not depend on the presence of CTDNEP1 (Figure 4F). As cells exited mitosis, the prominent mitotic lipin 1 form transitioned into several faster migrating bands (Figure 4F). When the majority of control cells entered early interphase (~160 minutes following mitotic release; Figure 4F) lipin 1 protein resolved into two bands resembling the distinct phosphorylation states that were also observed in asynchronous cells (Figure 4F). In contrast, lipin 1 resolved into a single band in CTDNEP1 knockout cells in early interphase that corresponded to the predominant phosphorylated species observed in the asynchronous population of these cells (Figures 4F). Consistent with previous observations that mTORC1 is inactive in mitosis (Odle et al., 2020), inhibition of mTOR kinase activity by Torin 1 did not affect the electrophoretic mobility of mitotic lipin 1 (“0 min”, Figure 4G) but resulted in the collapse of lipin 1 into a single dephosphorylated species when the majority of cells had entered interphase (Figure 4G). The emergence of the dephosphorylated lipin 1 species upon mitotic exit in Torin 1-treated cells depended on the presence of CTDNEP1, as in asynchronous cells (Figure 4F and 4G). Thus, CTDNEP1 is necessary to establish a dephosphorylated pool of lipin 1 as cells transition from mitosis to interphase at least in part by counteracting mTOR-mediated phosphorylation of lipin 1. The fact that CTDNEP1 establishes a dephosphorylated pool of lipin 1 in interphase cells but does not impact lipin 1’s electrophoretic mobility in mitosis suggested that CTDNEP1 regulates lipin 1 to control ER membrane biogenesis primarily in interphase.
Expanded ER membranes resulting from increased de novo FA synthesis during interphase lead to the emergence of micronuclei in CTDNEP1 knockout cells
The interphase state of lipin 1 depends on CTDNEP1 and so we wanted to better understand how this regulatory network might control ER membrane biogenesis as cells progress through the cell cycle. The increased flux of acetate into total lipids in these cells (Figure S2I) as well as the higher transcript levels of acetyl-CoA carboxylase alpha (ACACA), which catalyzes the committing step for FA synthesis (Figure 5A and S1G), prompted us to test if inhibition of upregulated FA synthesis occurring in these cells would suppress ER expansion. We scored ER morphology of control and knockout cells treated with a small molecule inhibitor that targets ACAC (TOFA, 5’(Tetradecyloxy)-2-furoic acid) (McCune and Harris, 1979), which abolishes de novo FA synthesis within 5 hours but does not substantially affect the cell cycle even after longer periods of treatment (Figures 5B, S5A and S5B). In control U2OS cells treated with TOFA, ER area was reduced in the majority of cells (Figures 5C–5D and S5C–S5D). The addition of exogenous Fas did not alter the morphology of the ER on its own (Figure S5E) but suppressed the altered ER morphology in control U2OS cells treated with TOFA, indicating that the “reduced” ER phenotype results from a reduction in FA synthesis (Figures 5C–5D and S5C). TOFA treatment of CTDNEP1 knockout cells suppressed ER expansion resulting in a normal appearance of the ER network, but not with the addition of exogenous FAs (Figures 5C and 5D and S5C–S5D). TOFA treatment also suppressed abnormal nuclear structure of CTDNEP1 knockout cells (Figure 5E). Thus, the expanded ER phenotype and altered nuclear morphology in CTDNEP1 knockout cells result from excessive incorporation of FAs into ER membrane lipids.
Figure 5. CTDNEP1 controls de novo FA synthesis to limit ER membrane biogenesis.
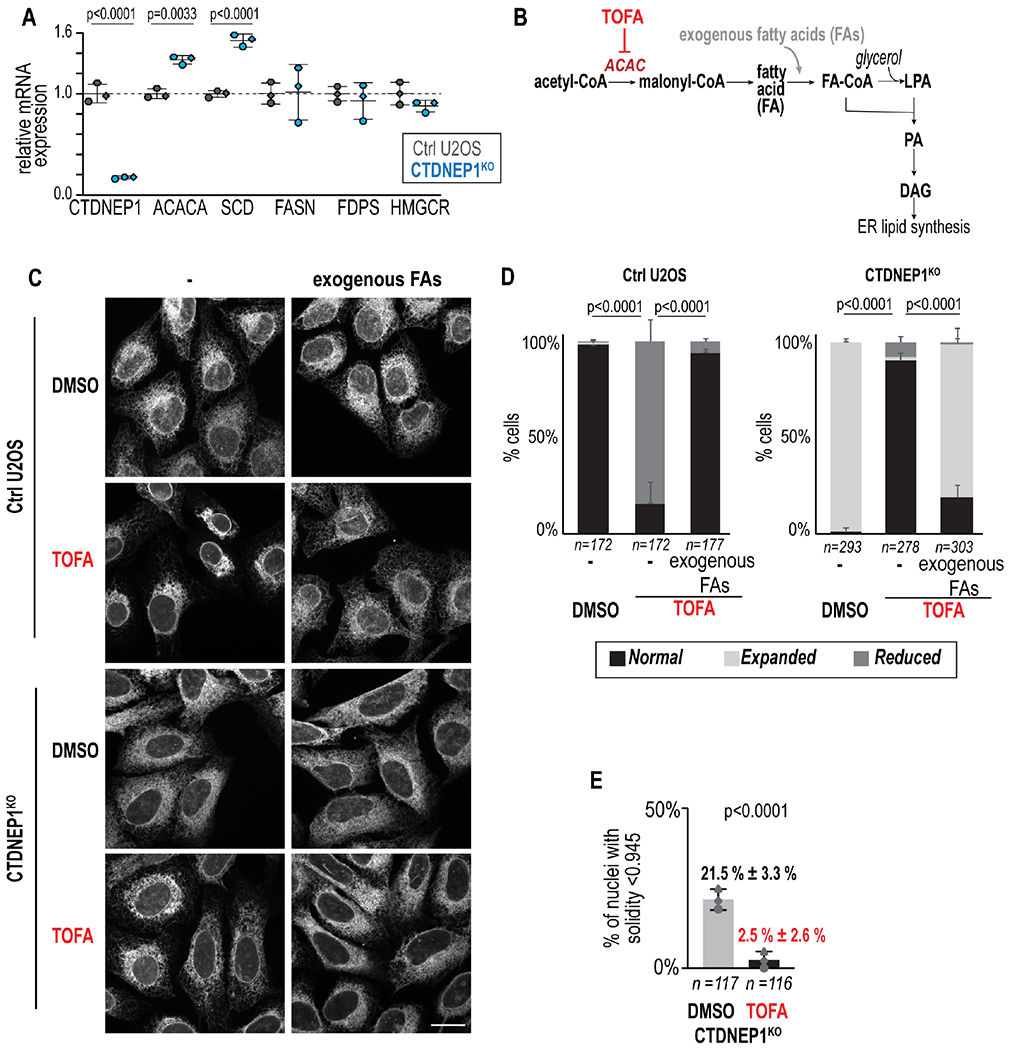
(A) qRT-PCR of indicated cells for genes indicated, shown as fold change in expression relative to mean control values. (B) Schematic representing target for inhibition by TOFA bypassed by addition of exogenous FAs. (C) Max projections of confocal images in indicated cell lines under indicated conditions. Scale bar, 20 μm. (D) Plot of incidences of indicated phenotypes. (E) Incidence of nuclei with solidity < 1 SD from mean solidity of control U2OS cells per indicated condition. For all: p value, unpaired t (A), χ2 (D), or Fisher’s exact (E) tests. N = 3 experimental repeats and means ± SDs shown. See also Figures S5 and S6.
To understand how flux of FAs in the lipid synthesis pathway contributes to ER membrane biogenesis as cells progress through the cell cycle, we determined ER size in cells of different cell cycle stages (Figure S6A). In asynchronous cells, ER area is significantly larger in CTDNEP1 knockout cells than in control cells in S and G2 phases of the cell cycle (Figure S6B–S6C). We synchronized cells in G2/M or G1/S and released them into media containing TOFA to inhibit FA synthesis in either M/G1 phase or S-phase (Figure 6A). The ER area was not significantly altered in cells in G1 phase that were released from synchronization in G2/M into media containing TOFA (Figure 6A–6C and S7A–S7B). This suggests that ER size is not majorly impacted by FA synthesis during mitosis and early G1. In contrast, inhibition of FA synthesis significantly reduced the area of the ER in both control and CTDNEP1 knockout cells in S-phase cells that were released from synchronization in G1/S into media containing TOFA (Figure 6A–6C and S7A–S7B). Inhibition of FA synthesis did not affect cell size, excluding the possibility that the reduction in ER area is caused by a reduction in cell size (Figure S7C). These data indicate that FA synthesis contributes to ER membrane biogenesis in S-phase. Interestingly, when analyzed cells at different stages of interphase on a population level, the phosphorylation state of lipin 1 was similar to that determined in early interphase; however, our single cell analysis showed more cells with cytoplasmic enrichment of lipin 1 in G1 and S phase in CTDNEP1 knockout cells (Figures S7D–S7E). Together, these data suggest that the extent of ER membrane expansion controlled by CTDNEP1/lipin 1 is established in early interphase and may be related to the nuclear versus cytoplasmic pool of lipin 1 (Figure 4F and S7D).
Figure 6: Inhibition of FA synthesis in interphase suppresses the expanded ER phenotype of CTDNEP1 knockout cells and the increased incidence of micronuclei.
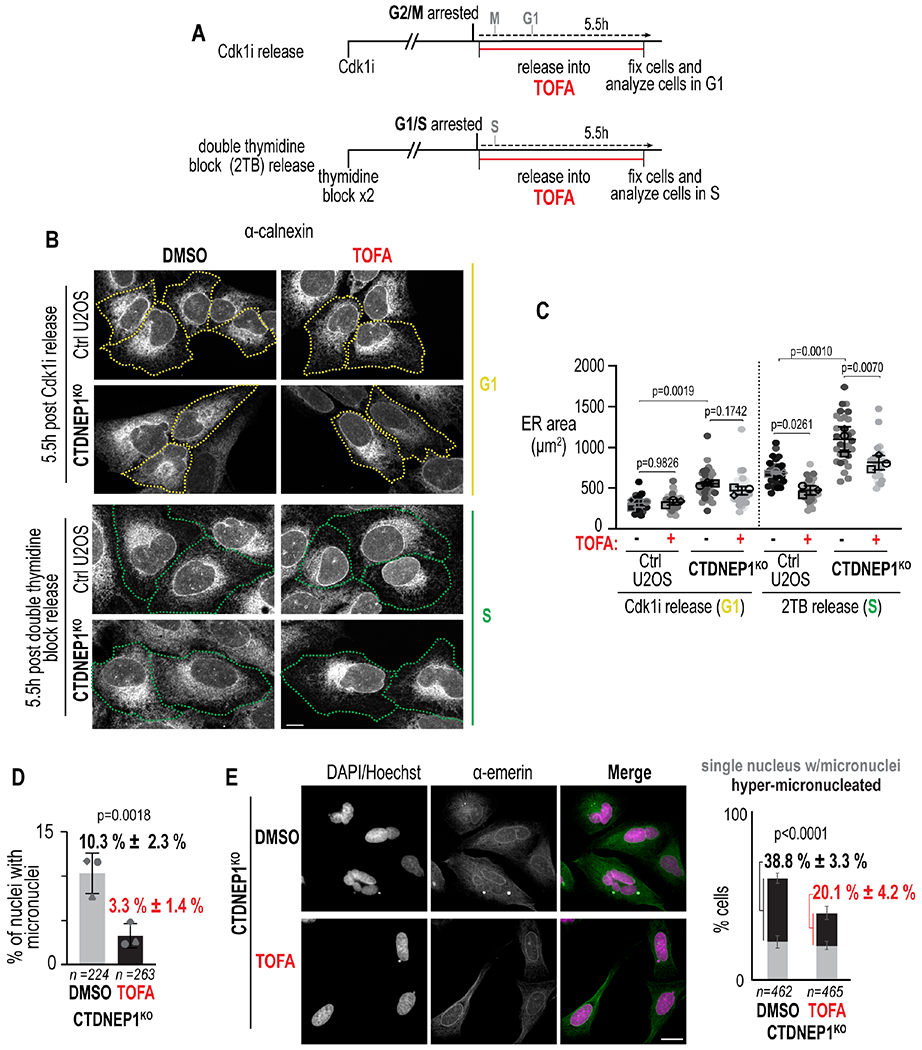
(A) Schematic of experimental setup. (B) Max projections of confocal images of cells treated as indicated. Borders: cells in distinct cell cycle stages as determined by markers (see Figure S7A). Scale bar, 10 μm. (C) Plots of ER area in cells in specified stages treated as indicated. p values, one-way repeated measures ANOVA with Šidák’s test. (D) Plot of incidence of micronuclei in cells treated as indicated. p values, Fisher’s exact test. (E) Confocal images of indicated cell lines per condition following nocodazole washout. Scale bar, 20 μm. Plot: Incidence of specified phenotypes. p value, χ2 test. For all: N = 3 experimental repeats; means ± SDs shown. See also Figure S7.
We predicted that if chromosome segregation errors result from expansion of the ER inherited by mitotic CTDNEP1 knockout cells, then inhibition of FA synthesis would additionally suppress formation of micronuclei. Small molecule inhibition of ACAC with TOFA in CTDNEP1 knockout cells suppressed the increased incidence of micronuclei (Figure 6D) as well as the hyper-micronucleation phenotype that occurs after transient spindle disassembly (Figure 6E,). Thus, limiting the production of ER membranes during interphase through downregulation of de novo FA synthesis by CTDNEP1 control of lipin is necessary for mitotic fidelity.
Discussion
Our data indicate that ER membranes inherited from interphase dictate the biophysical properties of the cytoplasm of mitotic cells and that limiting their production protects against errors in chromosome segregation (Figure 7). CTDNEP1’s role in dephosphorylation of lipin 1 in interphase prevents errors in mitosis by restricting excessive ER membrane proliferation, which allows the timely clearance of membranes from the spindle region in prometaphase. The cytoplasm is shared by membrane-bound organelles and mitotic chromosomes upon NE breakdown in animal cells, necessitating ER membrane reorganization away from the spindle region (Liu and Pellman, 2020). In human cells, the breakdown of the NE and the assembly of the mitotic spindle occurs simultaneously; in lower eukaryotes, these events are temporally uncoupled, which provides an explanation for why excess ER membranes do not invade mitotic chromosomes during prometaphase in those systems (e.g. the metaphase plate forms prior to completion of retraction and fusion of permeabilized pronuclear membranes in C. elegans embryos) (Bahmanyar et al., 2014; Barger et al., 2021; Dey and Baum, 2021; Dey et al., 2020; Makarova et al., 2016; Webster et al., 2009). Thus, restricting ER membrane biogenesis in interphase may be a crucial feature that helps prevent mitotic errors in animal cells that have evolved to undergo open mitosis.
Figure 7: Cell cycle-regulated ER membrane biogenesis by CTDNEP1 dephosphorylation of lipin 1 allows chromosome movements necessary for biorientation.
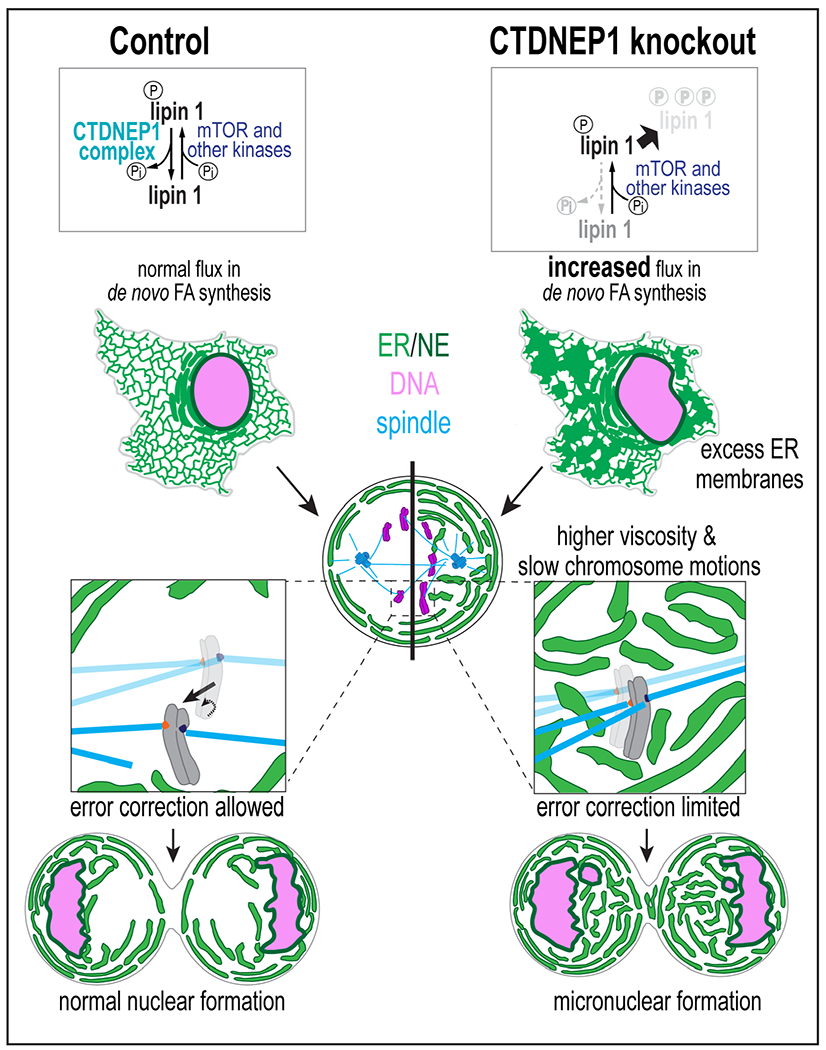
When CTDNEP1 is absent, phosphorylation of lipin 1 by mTOR and other kinases prevails and leads to decreased lipin 1 stability and an increased flux in de novo FA synthesis towards ER membrane biogenesis in interphase. Excess ER membranes inherited by mitotic cells contribute to higher cytoplasmic viscosity and dampened chromosome motions. The lack of chromosome motions limits mitotic error correction, leading to micronuclei formation.
Our data showing that the frequency of lagging chromosomes and formation of micronuclei upon transient spindle disassembly is increased under conditions when ER membranes are expanded suggests that dampened chromosome dynamics resulting from the increase in the effective viscosity of the mitotic cytoplasm impedes the correction of merotelic orientations (Figure 7) (Cimini et al., 2003). In agreement with this idea, mitotic chromosomes induced to persist in the peripheral ER are more likely to missegregate (Ferrandiz et al., 2021). Merotelic attachments go unnoticed by the SAC (Cimini, 2008) and are a major source of aneuploidy in cancer cells (Cimini, 2008; Cimini et al., 2002; Cimini et al., 2001). In a merotelically-oriented kinetochore, loss of attachment from one pole can allow the chromosome to biorient - forces from MTs on the attached kinetochore promote the chromosome to move so that the unattached kinetochore faces the proper spindle pole (Cimini, 2008; Cimini et al., 2003) (Figure 7). We propose that slower chromosome mobilities resulting from the increase in viscosity of the surrounding thickened ER network impedes error correction by slowing chromosome biorientation, resulting in re-attachment of the kinetochore to the incorrect pole (Figure 7).
Our data suggests that regulation of the phosphorylation state of lipin 1 in interphase as determined by CTDNEP1 controls the flux of de novo FAs towards glycerophospholipid synthesis to restrict ER size prior to cell entry into mitosis. While we cannot exclude the possibility that lipin 1 may have a more local role in PA to DAG conversion, its PAP activity is reduced in CTDNEP1-deleted cells. This together with the fact that there is less lipin 1 in the nucleus of CTDNEP1-deleted cells in early interphase suggests that SREBP1-target genes ACACA and SCD may be upregulated because of more lipin 1 in the cytoplasm to increase de novo FA synthesis in these cells, as has been proposed for cytoplasmic retention of lipin 1 by mTORC1 (Peterson et al., 2011). We suggest that lipin 1 activity may well exceed the amount of PA in ER membranes under normal conditions allowing for lipin 1 to maintain low PA levels in ER/NE membranes and at the same time be a target of regulation in response to different signals. Future work is required to understand how the lack of dephosphorylation of lipin 1 by CTDNEP1 affects other aspects of its regulation to control ER membrane biogenesis (Bahmanyar and Schlieker, 2020; Gu et al., 2021; Kwiatek and Carman, 2020; Zhang and Reue, 2017; Zhang et al., 2014).
Prior work in vitro suggested that CTDNEP1 dephosphorylates a site on lipin 1 later confirmed to be targeted by mTOR (Wu et al., 2011). Work in budding yeast showed the dephosphorylation of Pah1 upon inhibition of Tor requires the presence of the Nem1/Spo7 complex (Dubots et al., 2014). We demonstrate that human CTDNEP1 counteracts phosphorylation of lipin 1 by mTOR to establish a dephosphorylated pool of lipin 1 in early interphase. We also show that the hyperphosphorylated lipin 1 species in mitotic cells does not depend on CTDNEP1. CTDNEP1 requires its binding partner CNEP1R1 to dephosphorylate lipin 1 (Han et al., 2012) and so one possibility is that this association, which could involve other factors (Jacquemyn et al., 2021; Papagiannidis et al., 2021), is regulated in a cell cycle-dependent manner. In other systems it has been shown that lipin is a target of Cdk1 (Makarova et al., 2016) and so it is also possible that Cdk1 activity in mitosis overrides the phosphatase activity of CTDNEP1 towards lipin 1. Other phosphatases are known to dephosphorylate lipin (Kok et al., 2014; Okuno et al., 2019) and so CTDNEP1 may target phospho-sites on lipin 1 specific to regulation of ER lipid synthesis in interphase. Human lipin 1 has ~30 predicted phosphorylation sites (Boroda et al., 2017) and so future work will be required to understand the relationship between CTDNEP1 targeting of lipin 1 phospho-sites and the regulation of FA flux towards ER membrane biogenesis.
The fact that loss of human CTDNEP1 contributes to chromosome instability through dysregulation of lipid metabolism is highly relevant to the fact that Group 3/4 medulloblastomas with high levels of genome instability frequently carry truncation mutations in CTDNEP1 (Jones et al., 2012; Northcott et al., 2012). Micronuclei occur frequently in cancer, and their membranes are prone to rupture, causing cancer-relevant chromosome rearrangements and activation of proinflammatory pathways (Hatch et al., 2013; Liu and Pellman, 2020; Ly and Cleveland, 2017; Mackenzie et al., 2017; Zhang et al., 2013). Increased de novo FA synthesis is also a hallmark of many cancers; however, why this is an advantage to tumor cells is not fully understood (Currie et al., 2013). Our data links increased FA synthesis to formation of micronuclei and defines the mechanistic relationship between these processes. This work additionally suggests that aneuploidy in the context of oncogenic mTOR signaling may be mediated by misregulated lipid biosynthesis (Lamming and Sabatini, 2013). Together, these findings suggest that the use of inhibitors of enzymes in the de novo lipid synthesis pathway may be a potential therapeutic strategy in cancers with chromosomal instability. Uncovering the significance of CTDNEP1 regulation of ER lipid synthesis in the context of chromosomal instability in cancer will be an exciting and important avenue of future research.
Limitations of this study
The mechanism by which CTDNEP1-lipin 1 limit FA synthesis to restrict ER membrane biogenesis in early interphase remains unclear. Previous work showed that the nuclear translocation of lipin 1 upon inhibition of mTOR inhibits SREBP1 target gene expression (Peterson et al., 2011). We show that CTDNEP1 promotes nuclear translocation of lipin 1 upon mTOR inhibition (Figure 4B) and in the absence of CTDNEP1 SREBP1 target genes are modestly elevated (Figure 5A). Furthermore, while lipin 1 is mainly cytoplasmic in control and CTDNEP1 knockout cells under steady state conditions (Figure 4B), there are fewer CTDNEP1 knockout cells in early interphase with nuclear-localized lipin 1 (Figure S7E). Together, our results suggest that CTDNEP1 dephosphorylation of a pool of lipin 1 ensures that lipid synthesis is not aberrantly upregulated in early interphase to cause over-proliferation of ER membranes; however, the mechanisms for how phospho-regulation of lipin 1 controls its nuclear localization and how nuclear lipin 1 controls gene transcription are not fully understood. Therefore, how lipin 1 regulation by CTDNEP1 is mechanistically related to its nuclear versus cytoplasmic localization to in turn regulate of FA synthesis remains unclear.
STAR Methods
RESOURCE AVAILABILITY
Lead Contact
Further information and requests for resources and reagents should be directed to and will be fulfilled by the Lead Contact, Shirin Bahmanyar (shirin.bahmanyar@yale.edu).
Materials Availability
Unique materials generated in this study are available from the Lead Contact without restriction.
Data and Code Availability
All original data reported in this paper will be shared by the Lead Contact upon request.
All original code generated in this study is available from the Lead Contact upon request.
Any additional information required to reanalyze the data reported in this paper is available from the lead contact upon request.
EXPERIMENTAL MODEL AND SUBJECT DETAILS
Mammalian cell lines
U2OS, HEK293, and RPE-1 cells and derived cell lines (see Key Resource Table) were obtained from the source specified. U2OS Sec61β-GFP cells were obtained from the Rapoport lab. Cells were grown at 37°C in 5% CO2 in DMEM low glucose (Gibco 11885) (U2OS), DMEM high glucose (Gibco 11965), or DMEM:F12+HEPES (Gibco 113300) supplemented with 2 mM L-glutamine (Sigma 59202C) (RPE-1), all supplemented with 10% heat inactivated FBS (F4135) and 1% antibiotic-antimycotic (Gibco 15240112) or 50 IU/ml penicillin/streptomycin (Gibco 15140). Cells were used for experiments before passage 30 (20 for RPE-1). Cells were tested for mycoplasma upon initial thaw and generation of new cell lines (Southern Biotech 13100-01), and untreated cells were continuously profiled for contamination by assessment of extranuclear DAPI/Hoechst 33258 staining.
Key Resources Table
| REAGENT or RESOURCE | SOURCE | IDENTIFIER |
|---|---|---|
| Antibodies | ||
| Rabbit α calnexin | Abcam | Cat#ab22595; RRID: AB_2069006 |
| Rabbit α emerin | Proteintech | Cat#10351; RRID: AB_2100056 |
| Mouse α tubulin DM1A | Millipore Sigma | Cat#05-829; RRID: AB_310035 |
| Mouse α FLAG | Sigma | Cat#F3165; RRID: AB_259529 |
| Rabbit α HA | Cell Signaling Technologies | Cat#3724; RRID: AB_1549585 |
| Rhodamine RedX Donkey α mouse IgG | Jackson Immuno | Cat#715-295-150; RRID: AB_2340831 |
| FITC Goat α mouse IgG | Jackson Immuno | Cat#115-095-146; RRID: AB_2338599 |
| FITC Goat α rabbit IgG | Jackson Immuno | Cat#111-095-003; RRID: AB_2337972 |
| FITC Donkey α Goat IgG | Jackson Immuno | Cat#705-095-147; RRID: AB_2340401 |
| Rhodamine RedX goat α rabbit IgG | Jackson Immuno | Cat#111-295-003; RRID: AB_2338022 |
| Alexa Fluor 488 Donkey α mouse IgG | Jackson Immuno | Cat#715-545-150; RRID: AB_2340846 |
| Alexa Fluor 647 goat α mouse IgG | Jackson Immuno | Cat#115-605-003; RRID: AB_2338902 |
| Alexa Fluor 647 donkey α rabbit IgG | Jackson Immuno | Cat#711-605-152; RRID: AB_2492288 |
| Rabbit α lipin-1 | Millipore Sigma | Cat#ABS400 (discontinued) |
| Rabbit α lipin-1 | Proteintech | Cat# 27026-1-AP; RRID: AB_2880727 |
| Rabbit α Phospho-p70 S6 Kinase (Thr389) (108D2) | Cell Signaling Technology | Cat#9234; RRID: AB_2269803 |
| Rabbit α p70 S6 kinase | Cell Signaling Technology | Cat#9202; RRID: AB_331676 |
| Rabbit α Phospho 4E-BP1 (Ser65) | Cell Signaling Technology | Cat#9451; RRID: AB_330947 |
| Rabbit α 4E-BP1 | Cell Signaling Technology | Cat#9452; RRID: AB_331692 |
| Rabbit α NRF2 | Abcam | Cat#ab62352; RRID: AB_944418 |
| Goat α mouse IgG-HRP | Thermo Fisher | Cat#31430; RRID: AB_228307 |
| Goat α rabbit IgG-HRP | Thermo Fisher | Cat#31460; RRID: AB_228341 |
| Mouse α cyclin A2 | Proteintech | Cat#66391; RRID: AB_2881767 |
| Mouse α BrdU | Santa Cruz | Cat#sc-32323; RRID: AB_626766 |
| Mouse α cyclin B1 (GNS1) | Santa Cruz | Cat#sc-245; RRID: AB_627338 |
| Mouse α cyclin E1 (HE12) | Cell Signaling Technology | Cat#4129; RRID: AB_2071200 |
| Chemicals, peptides, and recombinant proteins | ||
| Torin 1 | ApexBio | Cat#A8312 |
| Cycloheximide | Cell Signaling | Cat#2112 |
| MG132 z-Leu-Leu-Leu-Al | Fisher Scientific | Cat#AAJ63250LB0 |
| Nocodazole | Sigma | Cat#M1404 |
| RO-3306 | EMD Millipore | Cat#217699 |
| TOFA | Cayman Chemicals | Cat#10005263 |
| NMS-P715 | EMD Millipore | Cat#475949 |
| SiR-DNA | Cytoskeleton, Inc. | Cat#CY-SC007 |
| ER Tracker Green | Invitrogen | Cat#E34251 |
| Puromycin HCl | Thermo Fisher | Cat#A1113803 |
| G418 | EMD Millipore | Cat#345810 |
| Blasticidin | Sigma | Cat#R21001 |
| Palmitic acid | Sigma | Cat#P0500 |
| Oleic acid | Sigma | Cat#O1008 |
| Linoleic acid | Sigma | Cat#L5900 |
| 1,2-C14-acetic acid sodium salt | Perkin-Elmer | Cat#NEC553 |
| ProMag™ 3 Series - Streptavadin beads | Bangslabs | Cat#PMS3N |
| 1,2-Dioleoyl-sn-glycerol | Avanti Polar Lipids | Cat#800811 |
| 1,2-Dioleoyl-sn-glycero-3-phosphate | Avanti Polar Lipids | Cat#840875 |
| Triton X-100 | Sigma-Aldrich | Cat# T9284 |
| [γ-32P] ATP (6000 Ci/mmol, 150 mCi/mL) | Perkin-Elmer | Cat# NEG035C005MC |
| Escherichia coli DAG kinase, 1 mg/mL, 2 U/mg | Sigma-Aldrich | Cat# D3065 |
| 5’ethynyl-2’-deoxyuridine (EdU) | Lumiprobe | Cat#10540 |
| Sulfo-Cyanine 5 Azide | Lumiprobe | Cat#A3330 |
| Bromodeoxyuridine (BrdU) | BioLegend | Cat#423401 |
| Sodium tetraborate decahydrate | Sigma | Cat#S9640 |
| RNAse A | Sigma | Cat#AB12023-00100 |
| Propidium Iodide | BioLegend | Cat#421301 |
| Thymidine | Sigma | T1895 |
| 2’ deoxycytidine | Sigma | D3897 |
| Critical commercial assays | ||
| Zymopure II plasmid Midi prep kit | Zymogen | Cat#D4200 |
| Pierce BCA Protein Assay kit | Thermo Scientific | Cat#23225 |
| Experimental models: Cell lines | ||
| U2OS | Slack lab (Harvard Medical School) | N/A |
| RPE-1 | Breslow lab (Yale University) | N/A |
| HEK293 | Breslow lab (Yale University) | N/A |
| U2OS GFP-Sec61β | Rapoport lab (Harvard Medical School) | N/A |
| U2OS GFP-Sec61β H2B-mCherry | This study | N/A |
| U2OS CTDNEP1KO | This study | N/A |
| U2OS CTDNEP1KO CTDNEP1-HAstable | This study | N/A |
| U2OS CTDNEP1KO CTDNEP1-HAstable PD (D67E D69T) | This study | N/A |
| Oligonucleotides | ||
| siRNA targeting sequence: CTDNEP1 custom single siRNA FWD, no modifications: AGGCAGAUCCGCACGGUAA | Dharmacon | N/A |
| siRNA targeting sequence: Lipin 1 custom single siRNA, no modifications: GAAUGGAAUGCCAGCUGAA | (Brohée, 2015) (Sołtysik et al., 2021), Dharmacon | N/A |
| siRNA targeting sequence: CTDNEP1 SMARTpool siRNA | Dharmacon | Cat#M-017869-00-0005 |
| siRNA targeting sequence: siGENOME Non-targeting siRNA Pool #2 | Dharmacon | Cat#D-001206-14-05 |
| Silencer Negative control siRNA #1 | Invitrogen | Cat#AM4611 |
| Silencer Select negative control siRNA #1 | Life Technologies | Cat#4390843 |
| qPCR primer: Hs GAPDH forward: GTCTCCTCTGACTTCAACAGCG | (Nabokina et al., 2014) | N/A |
| qPCR primer: Hs GAPDH reverse: ACCACCCTGTTGCTGTAGCCAA | (Nabokina et al., 2014) | N/A |
| qPCR primer: Hs CTDNEP1 forward: CATTTACCTTCTGCGGAGGC | This study | N/A |
| qPCR primer: Hs CTDNEP1 reverse: CACCTGGGCTAGCCGATTC | This study | N/A |
| qPCR primer: Hs ACACA forward: TCACACCTGAAGACCTTAAAGCC | (Shimizu et al., 2017) | N/A |
| qPCR primer: Hs ACACA reverse: AGCCCACACTGCTTGTACTG | (Shimizu et al., 2017) | N/A |
| qPCR primer: Hs FDPS forward: TGTGACCGGCAAAATTGGC | (Shimizu et al., 2017) | N/A |
| qPCR primer: Hs FDPS reverse: GCCCGTTGCAGACACTGAA | (Shimizu et al., 2017) | N/A |
| qPCR primer: Hs SCD forward: TCTAGCTCCTATACCACCACCA | (Shimizu et al., 2017) | N/A |
| qPCR primer: Hs SCD reverse: TCGTCTCCAACTTATCTCCTCC | (Shimizu et al., 2017) | N/A |
| qPCR primer: Hs HMGCR forward: GGACCCCTTTGCTTAGATGAAA | (Bertolio et al., 2019) | N/A |
| qPCR primer: Hs HMGCR reverse: CCACCAAGACCTATTGCTCTG | (Bertolio et al., 2019) | N/A |
| qPCR primer: Hs FASN forward: CATCCAGATAGGCCTCATAGA | (Bertolio et al., 2019) | N/A |
| qPCR primer: Hs FASN reverse: CTCCATGAAGTAGGAGTGGAA | (Bertolio et al., 2019) | N/A |
| qPCR primer: Hs 36B4 forward: AACATGCTCAACATCTCCCC | (Neuhaus et al., 2011) | N/A |
| qPCR primer: Hs 36B4 reverse: CCGACTCCTCCGACTCTTC | (Neuhaus et al., 2011) | N/A |
| Recombinant DNA | ||
| pSPCas9(BB)-2A-Puro (PX459) v2.0 | (Ran et al., 2013) | Cat#62988; RRID: Addgene_62988 |
| pH2B_mCherry_IRES_puro2 | (Steigemann et al., 2009) | Cat#21045; RRID: Addgene_21045 |
| GFP-KDEL | This study | N/A |
| pRK5 FLAG-lipin1β (Mm) | (Peterson et al., 2011) | RRID: Addgene_32005 |
| pRK5 FLAG-lipin1β 19xA | (Peterson et al., 2011) | RRID: Addgene_32007 |
| pRK5 FLAG-lipin1β 19xA PAP dead (D712E, D714E) | This study | N/A |
| Human lipin 1β-GFP | (Sołtysik et al., 2021) | N/A |
| pcDNA CTDNEP1-HA | This study | N/A |
| pcDNA CTDNEP1 D67E-HA | This study | N/A |
| pcDNA CTDNEP1 D67ED69T-HA | This study | N/A |
| FLAG-CNEP1R1 | This study | N/A |
| pMRX CTDNEP1 D67E-HA | This study | N/A |
| pMRX CTDNEP1 D67ED69T-HA | This study | N/A |
| pMRX_EGFP_Blast | H. Arai lab (University of Tokyo) | N/A |
| Software and algorithms | ||
| FIJI | (Schindelin et al., 2012) | https://imagej.net/Fiji |
| GraphPad Prism 8/9 | GraphPad Software | https://www.graphpad.com/scientific-software/prism/ |
| MATLAB | MathWorks | https://www.mathworks.com/products/matlab.html |
| PIVlab | (Thielicke, 2014; Thielicke and Stamhuis, 2014) | https://www.mathworks.com/matlabcentral/fileexchan |
| FlowJo 10 | FlowJo, LLC | https://www.flowjo.com/solutions/flowjo |
| Image Lab Software | Bio-Rad | https://www.bio-rad.com/en-us/product/image-lab-software |
| ImageJ Filename_Randomizer | Tiago Ferreira (EMBL) | https://imagej.nih.gov/ij/macros/Filename_Randomizer.txt |
CRISPR/Cas9 genome editing
All guide RNA sequences were designed using the online CRISPR tool http://crispr.mit.edu and reported no off-target matches. CTDNEP1KO: ATGAAGTCAGGAGGCGTACC. The guide RNA sequences were synthesized as two oligos with Bbsl overhangs and an additional guanidine base 5’ to the protospacer sequence, and the oligos were phosphorylated with calf alkaline intestine phosphatase (New England BioLabs #M0290) and annealed by heating to 95°C and cooling to room temperature. The annealed oligos were cloned into pSPCas9(BB)-2A-Puro (PX459) v2.0 (a gift from Feng Zhang, Addgene plasmid #62988; (Ran et al., 2013)) that had been digested with Bbsl-HF (New England BioLabs #R3539). The vector was transfected into U2OS cells using Lipofectamine 2000 and selected with 3 μg/ml puromycin (Invitrogen) for 48 hours. The remaining cells were grown up and gDNA isolated from the bulk population using a QiaAmp DNA Mini kit (Qiagen 51304). Genotyping was performed by sequencing and screening for indels using TIDE deconvolution (https://www.deskgen.com/landing/tide.html; (Brinkman et al., 2014). Once indels were detected in the bulk population, the cells were plated at <100 cells/ml into 96 well plates and grown in antibiotic-free DM EM with 10% FBS for 2 weeks. Colonies were grown in 24-well plates until more than 10,000 cells could be harvested for gDNA sequencing and TIDE analysis to genotype for frameshift mutations. The CTDNEP1KO clonal cell line used in experiments showed to have +1 insertions in >80% of alleles and 0% WT alleles as determined by TIDE deconvolution of sequencing data.
Stable Cell Line Generation
To generate U2OS GFP-Sec61β H2B-mCherry, U2OS GFP-Sec61β were transfected with H2B-mCherry-IRES-puro2v2.0 (Steigemann et al., 2009) for 48 hours, then plated into 10 cm dishes at <100 cells/ml and selected with 0.5 μg/ml puromycin for 2 weeks. Colonies were trypsinized and picked with 1/8 in sterile cloning discs (Bel-Art F37847-0001) and grown to confluence in a T25 flask before imaging confirmation of marker expression.
U2OS CTDNEP1KO+CTDNEP1-HA stable cell lines were generated by retroviral transduction, and bulk populations of cells were used for experiments. Retroviruses were generated by transfecting HEK293T cells with pCG-gag-pol, pCG-VSVG and either pMRX-CTDNEP1-HA or pMRX-CTDNEP1-D67ED69T-HA using Lipofectamine 2000. The retroviruses were used to transduce U2OS CTDNEP1KO cells and placed under 7.5 μg/mL blasticidin selection for 2 weeks, then frozen and/or used for experiments. Cells were continuously cultured in 7.5 μg/mL blasticidin.
METHOD DETAILS
Transfection and RNAi
Most transfections were performed with Lipofectamine 2000 (Thermo Fisher Scientific 11668) in Opti-MEM (Gibco 31985) using a 1:2 ratio of DNA:lipofectamine with DNA concentrations ranging from 0.05-0.3 μg DNA per cm2 of growth surface. Briefly, DNA and lipofectamine were added to 10 μl OptiMEM per cm2 of growth surface in separate borosilicate glass tubes (Thermo Fisher Scientific STT-13100-S). After 5 minutes of incubation, DNA solution was added to lipofectamine solution. After 15 minutes, DNA:lipofectamine mix was added dropwise to cells plated 16-24 hrs prior to transfection in fresh antibiotic-free media (1 ml/9.6 cm2 growth surface). Media was exchanged for antibiotic-free media after 6 hours. Cells were imaged or processed after 24-48 hours. To increase transfection efficiency, plasmids used for live imaging were purified using the Zymopure II Plasmid Midi Prep kit, including a 10 min final elution at 56°C and use of the Zymopure endotoxin removal columns. Unless listed as stably expressed, fluorescent markers were transiently transfected.
Transfections for lipin 1 overexpression were performed using PolyJet in vitro DNA transfection reagent (Signagen SL100688) using a 1:3 ratio of DNA:Polyjet using 0.1 μg DNA per cm2 of growth surface. Protocol is identical to previous transfection protocol except for using 5 μl High glucose DMEM per cm2 of growth surface for mixes and no incubation before mixing reagents.
For experiments involving phenotype rescue with transient FLAG-lipin 1β construct overexpression, GFP-KDEL was used as a co-transfection marker, and untransfected cells within the same experiment were used as a negative control for effects of lipin 1β overexpression.
RNAi was performed using Dharmafect 1 (Horizon Discovery T-2001) in Opti-MEM according to the manufacturer’s protocol at the indicated concentrations and durations. RNAi knockdown efficiency was determined with qRT-PCR or immunoblot analysis. For CTDNEP1 knockdown, U2OS Sec61β/H2B-mCherry were treated with 40 nM CTDNEP1 custom single siRNA or Ambion Silencer negative control 1 for 48 hours; all others were treated with 20 nM CTDNEP1 siGENOME SMARTpool or control pool siRNA for 72 hours. For lipin 1 knockdown, cells were treated with 20 nM Silencer Select Control #1 siRNA (Ambion) or lipin 1 custom single siRNA for 72 hours.
For quantification of lipin 1 localization, endogenous lipin 1 was depleted with RNAi (Brohée, 2015); cells were then transfected with siRNA-resistant human lipin 1β-GFP (Sołtysik et al., 2021).
Plasmid generation
GFP-KDEL was modified from pDsRed2-ER (Clontech), which contains a signal peptide and ER retention sequence (KDEL), by PCR of GFP with Agel and Hindi 11 sites, digestion of the insert and pDsRed2 with Agel/Hindlll (NEB R0552, R3104), and ligation. CTDNEP1-HA was modified from CTDNEP1-v5-His (Han et al., 2012), and Quikchange Mutagenesis (Agilent) was used to make the D67E and D69T mutations. pRK5 FLAG-lipin 1β 19xA PAP dead was modified from pRK5 FLAG-lipin 1β 19xA using Quikchange Mutagenesis to make the following mutations: D712E, D714E. pMRX_CTDNEP1-HA_Blast was modified from pMRX_EGFP_Blast (Matsudaira et al., 2017).
Lipidomics
Early-passage cells were counted by hemocytometer, suspended in PBS at a concentration of 3x10⁶ cells/ml, and flash frozen in liquid nitrogen. Triplicate samples were submitted for each condition, and corresponding triplicate samples were lysed and protein extracted and protein concentration determined by Pierce BCA assay. Sample processing and lipidomics were performed and obtained at Lipotype GmbH. Samples were spiked with lipid class internal standards, and lipids were extracted using chloroform-methanol extraction using a Hamilton Robotics STARIet. Samples were infused using an Advion Triversa Nanomate automated nano-flow electrospray ion source with positive and negative ion mode utilized. Mass spectra were acquired using a Thermo Scientific Q-Exactive hybrid quadruple/Orbitrap mass spectrometer in MS-only or MSMS mode. Lipid species were identified using LipotypeXplorer, and data was processed using Lipotype LIMS and LipotypeZoom. Lipid class pmols/μg protein was determined using protein concentration and sample volume analyzed from each replicate.
Measurement of Lipin PAP Activity
PAP activity was measured by release of phosphate from [32P]PA using Triton X-100 micelles with cell lysates as previously reported (Boroda et al., 2017). Briefly, radiolabeled [32P]PA substrate was prepared by phosphorylating 1,2-Dioleoyl-sn--glycerol with E. coli diacylglycerol kinase and [γ-32]ATP and purified by thin-layer chromatography as described by Han and Carman (Han, 2004). To prepare the micelles, Triton X-100 was mixed with buffer A (50 mM Tris-HCl, 10 mM 2-mercaptoethanol, pH 7.4) to a final concentration of 10 mM. Next, 1 μmol of unlabeled 1,2-Dioleoyl-sn-glycero-3-phosphate was dissolved in chloroform and mixed with [32P]PA (3,000 cpm/nmol) in a glass tube, dried to a thin film under N2 gas, and resuspended with 1 mL of 10 mM Triton X-100. Lysates prepared from U2OS cells containing 10 μg of total protein, radioactive micelles, and buffer A were combined to a final volume of 100 μL, and the reactions were allowed to proceed for 20 min at 30 °C with gentle agitation and were terminated with the addition of 500 μL of acidified methanol (MeOH·0.1N HCl). The final concentrations for all reactions were as follows: 50 mM Tris-HCl, 10 mM 2-mercaptoethanol, and 0.2 mM PA. Free phosphate was extracted with the addition of 1 mL chloroform followed by 1 mL 1M MgCl2. The organic extraction was vortexed and 500 μL of the aqueous phase was transferred to a scintillation vial to measure the removal of 32P from PA by a scintillation counter. The measurement of PAP activity was determined by following the release of the radiolabeled phosphate from [32P]PA. Total PAP activity was measured by including 0.5 mM MgCl2. PAP activity for Mg2+-independent enzymes was measured by instead including 1 mM EDTA. The activity from assays containing lysate was normalized to activity in assays without enzymes present. Mg2+-dependent PAP activity was calculated by subtracting the mean Mg2+-independent activity from the total PAP activity.
14C acetate labeling and lipid extraction
U2OS cells were plated in 24 well plates at a density of 60,000 cells/well and cultured in low-glucose DMEM (Gibco, 11885-084) with 10% FBS (Gemini Bio-products, 900-108) and 1% antibiotic-antimycotic (Gibco, 15240-062). Cells were labeled with 14C acetate and lipids extracted to determine acetate incorporation into neutral lipids (Liebergall et al., 2020). 16-18 hours after plating, cells were labeled with 500 μl fresh media containing 1 μCi/mL (19.23 μM) 1,2-14C-acetate (Perkin-Elmer, NEC553) for 5 hours. Cells were then washed with PBS 2x on ice, lysed with 250 μL of 0.1% Triton X-100, 0.5 mM DTT, and a protease inhibitor cocktail (10 μg/mL leupeptin, 10 μg/mL pepstatin A, and 1 mM phenylmethylsulfonyl fluoride) in PBS, pH 7.2, and homogenized by pushing through a 22G needle 6x. 200 μl of lysate was added to 500 μl 0.1 N HCl·methanol, then 250 μl chloroform was added. The extract was vortexed and incubated for 1-2 min at room temp. Another 250 μl of chloroform was added, followed by 250 μl of 0.2M NaCl. The extract was vortexed and centrifuged at 1000xg for 1 min. The aqueous phase was then aspirated, and 250 μl of the organic phase was used for quantification of 14C by a Beckman-Coulter scintillation counter. To calibrate counts per minute per nmol 14C-acetate, 250 μ media containing 1 μCi/ml 14C acetate was counted. Remaining cell lysates were used for BCA protein quantification for normalizing to protein concentration. To account for background 14C quantification, a control set of cells was treated with 10 μM 5-(tetradecyloxy)-2-furoic acid (TOFA) in DMSO 30 min before and during 14C labeling, and these values were subtracted from final values and shown separately. Results were expressed as nmol14C acetate incorporated into lipids per mg of protein.
FA supplementation
Cells were plated at a density of 200,000 cells/ml in 6 well plates. Stocks of oleic acid, linoleic acid, and palmitic acid were made in methanol and pipetted into a 50 ml conical vial, then dried with an ambient air stream. Pre-warmed DMEM containing 0.5% FA-free BSA (Sigma Cat#A8806) was added to a final concentration of 25 μM palmitic acid, 50 μM oleic acid, and 25 μM linoleic acid (100 μM total FA concentration; 1:2:1 ratio of palmitic:oleic:linoleic acid). The solution was incubated at 37°C for 30 min, then held to the bottom of a sonicating bath for 30 s, then incubated at 37°C for 10 min until solution was clear. FBS was added to a final concentration of 10% v/v. Cells were treated with DMEM with 10% FBS and 0.5% BSA alone or DMEM with 10% FBS 0.5% BSA, and 100 μM FAs with DMSO or 10 μM TOFA in DMSO for 24 hrs prior to immunofluorescence processing.
Mitotic and micronuclei enrichment and drug treatments
For mitotic shake off to enrich for M phase cells, cells were grown to at least 50% confluence in 75 cm2 flasks. Cells were washed with PBS or antibiotic-free media to clear debris, then flasks were whacked repeatedly on all sides and tapped on the bottom surface with a reflex hammer (DR Instruments S72118) until at least 50% of mitotic cells were dislodged. The cell media was collected and centrifuged at 300xg for 5 min, then cells were additionally washed or plated.
For imaging intracellular ER membranes in prometaphase-metaphase cells, whole 75 cm2 flasks of cells were transfected with GFP-KDEL and imaged 48 hours later after mitotic shake off and plating into 1 well of an ibidi 8-well imaging chamber per flask. Cells expressing GFP-KDEL in prometaphase up until metaphase (determined by DIC chromatin appearance) were imaged with 0.5 μm z stacks for 20 pm total z height.
For enrichment of cells at the G2-M phase transition by Cdk1 inhibition, cells were treated with 9 μM RO-3306 for 17-20 hours (Vassilev, 2006). On the microscope stage for live imaging of ER membrane (transiently-expressed GFP-KDEL) dynamics relative to chromosomes (transiently-expressed H2B-mCherry), media was exchanged for Fluorobrite DMEM with 10% FBS and 1 mM L-glutamine 7 times, then imaging was initiated within 5-10 min of the first wash. For RO-3306/MPS1i micronuclei enrichment, cells were treated with 9 μM RO-3306 (Calbiochem 217699) for 19 hours, then with 1 μM NMS-P715 (MPS1i) (Calbiochem 475949) for 18 hours before processing for immunofluorescence (Liu et al., 2018). For release of G2/M cells into TOFA, cells were synchronized for 19 hours with 9 μM RO-3306 and then released (after 7 media washes) into media containing 10 μM TOFA or DMSO for 5.5 hours.
For micronuclei enrichment using nocodazole washout, cells at 50-80% confluence in 75 cm2 flasks were washed with 37°C PBS to clear debris and then treated with 100 ng/ml nocodazole (Sigma M1404) in antibiotic-free media for 6 hours (Liu et al., 2018). Cells were subject to mitotic shake off without washing, then washed 3x with 37°C PBS. After the final wash, cells were plated onto acid-washed coverslips (coated with 1 μg/ml poly-D-lysine (Sigma P7886) for short-term washout) and incubated for 45 min-60 min (short-term) or 18-20 hours (long-term) before immunofluorescence processing. Cells treated with 10 μM TOFA or DMSO were treated during the 6 hour nocodazole treatment and during the 18 hour recovery period for 24 hours total treatment.
For synchronization of cells at the G1/S transition for immunofluorescence or detection of lipin 1 phosphorylation state after 5.5h of release, cells were treated with 2 mM thymidine for 23 hours, then washed with media 3 times, then treated with 10 μM 2’-deoxycytidine for 8 hours. Cells were then treated with 2 mM thymidine for 16 hours followed by 3 media washes to release cells from G1/S, then incubated in media containing 10 μM 2’deoxycytidine. For release of G1/S cells into TOFA, cells were released into media containing 10 μM 2’ deoxycytidine and 10 μM TOFA or DMSO for 5.5 hours. For immunoblot detection of G1/S-S enrichment, a cyclin E1 antibody was used.
For mitotic release in nocodazole-arrested cells to detect the phosphorylation state of lipin 1 upon mitotic exit., 2.0x10⁶ cells plated in T75 flasks were treated with 2.5 mM thymidine (Sigma T1895) for 24 hrs. After 24 hrs, cells were released from thymidine and treated with 40 ng/ml nocodazole for 18 hrs. Cells were then subjected to mitotic shake off and lysates were collected every 40 min.
When indicated, cells were treated with the following concentrations of drugs for the indicated times: Torin 1, 250 nM; MG132, 30 μM; Cycloheximide, 100 μg/ml; TOFA, 10 μM. Torin 1 treatment was for 4 hours unless otherwise indicated. Cells treated with cycloheximide were pretreated with DMSO or Torin 1 for 2 hours prior to treatment with cycloheximide combined with either DMSO or Torin 1. TOFA treatment was for 24 hours (analysis of asynchronous cell ER or nuclear solidity), 48 hours (analysis of incidence of micronuclei), or other times as mentioned above.
Quantitative real-time PCR
RNA was harvested using the RNeasy Mini kit (Qiagen 74104) using the manufacturer’s protocol, using Qiashredders (Qiagen 79654) for tissue homogenization and with additional RNase-free DNase (Qiagen 79254) treatment after the first RW1 wash and subsequently adding another RW1 wash. RNA was eluted with RNAse-free water and diluted to 50 ng/μl. RNA was subject to reverse transcription using the iScript Reverse Transcription Supermix (Bio-Rad 1708840) with 400 ng RNA per reaction. The subsequent cDNA was diluted 1:5 for RT-qPCR. cDNA was analyzed for RT-qPCR using the iTaq universal SYBR Green Supermix (Bio-Rad 1725120). Cycle threshold values were analyzed using the ΔΔCt method. Values were normalized to expression of GAPDH (testing CTDNEP1 expression in U2OS/RPE-1 depleted of CTDNEP1 and CTDNEP1KO U2OS) (Nabokina et al., 2014) or 36B4 (testing expression of SREBP target genes and CTDNEP1 in CTDNEP1KO U2OS cells) (Neuhaus et al., 2011). SREBP target gene primer sequences were obtained from previous studies in human cells (Bertolio et al., 2019; Shimizu et al., 2017). Results are expressed as fold change in expression relative to mean of control values. Statistical testing was performed on ΔCt values.
Immunofluorescence
Cells were washed 2x with warm PBS and fixed in 4% paraformaldehyde (+0.1% glutaraldehyde for ER structure analyses) in PBS for 15 min, permeabilized in 0.5% Triton X-100 for 5 min, then washed 3 times with PBS and blocked in 3% BSA in PBS for 30 min. Samples were transferred to a humidity chamber and incubated with primary antibodies in 3% BSA in PBS for 1 hour at room temperature with rocking. Samples were washed with PBS 3 times for 5 min, then incubated with secondary antibodies in 3% BSA in PBS for 1 hour at room temperature in the dark with rocking. Samples were then washed with PBS 3 times for 5 min in the dark. For experiments visualizing nuclear structure and/or micronuclei, cells were additionally stained with 1 pg/ml Hoechst 33258 (Thermo Fisher Scientific H3569) in PBS for 1 min followed by one PBS wash. Coverslips were mounted with ProLong Gold Antifade reagent + DAPI (Thermo Fisher P36935) and sealed with clear nail polish. For samples treated with goat primary antibodies, 5% normal donkey serum (Sigma D9663) was used in place of 3% BSA.
For determination of interphase cell cycle staging, cells were treated with 20 μM 5-ethynyl-2’-deoxyuridine (EdU) (Lumiprobe 10540) in media for 30 minutes before fixation. Between fixation and permeabilization, fixation was quenched with 100 mM Tris pH 7.5 for 5 minutes. After permeabilization and washing with PBS, coverslips were incubated for 30 minutes with freshly-prepared Cy5-azide mix consisting of 2 mM copper II sulfate pentahydrate (Sigma 209198), 8 μM sulfo-Cy5 azide (Lumiprobe), and 20 mg/ml freshly dissolved ascorbic acid (added last) in PBS. After Cy5-azide coupling, coverslips were washed briefly with PBS 2-3x, then washed for 5 minutes with PBS 3x. Immunofluorescence then proceeded as in the previous protocol starting with the blocking step.
When indicated, cells were fixed and stained to visualize kinetochore MTs (Thompson and Compton, 2011) by extracting in 100 mM PIPES, 1 mM MgCl2, 1 mM CaCl2, 0.5% Triton X-100, pH 6.8 for 4 min, then fixing in 1% glutaraldehyde in PBS for 10 min and quenched 2 times with 0.1% NaBH4 in TBS for 10 min each. Cells were washed twice with 10 mM Tris, 150 mM NaCl, 10% BSA and then stained with tubulin antibody for 1.5 hours, washed with PBS, then stained with secondary antibody for 1 hour, washed with PBS, then mounted with ProLong Gold + DAPI.
Antibody concentrations used were: Rabbit anti-calnexin 1:1000; Rabbit anti-emerin 1:200; Mouse anti-α tubulin DM1A 1:1000; Mouse anti-cyclin A2 1:750; Goat anti-GFP 1:1000; all secondaries, 1:200-1:250.
Immunoblot
Lysis buffer used was: 0.1% Triton X-100, 50 mM NaF, 1mM EDTA, 1 mM EGTA, 10 mM Na2HPO4, 50 mM β-glycerophosphate, 1 tablet/50 ml cOmplete protease inhibitor cocktail, pH 7.4. Cell lysates were removed from growth surfaces by scraping with a rubber policeman after incubation in lysis buffer or by adding lysis buffer to cell pellets collected by trypsinization and centrifugation at 300xg for 5 min followed by 1-2 PBS washes. Lysates were homogenized by pushing through a 23G needle 30 times and then centrifuged at >20,000xg for 10 min at 4°C, then protein concentration was determined using the Pierce BCA Protein assay kit (Thermo Scientific 23225). 10-30 μg of whole cell lysates/lane were run on 8-15% polyacrylamide gels dependent on target size, and protein was wet transferred to 0.22 μm nitrocellulose. Ponceau S staining was used to visualize transfer efficiency, then washed with TBS or DI water; then, membranes were blocked in 5% nonfat dry milk or BSA in TBS for 1 hour. Membranes were then incubated with primary antibodies in 5% milk or BSA for 1-2 hours at room temperature or overnight at 4°C with rocking. Membranes were washed 3 times for 5 min in TBS-T, then incubated with anti-HRP secondary antibodies in 5% milk or BSA in TBS-T for 1 hour at room temperature with rocking. Membranes were washed 3 times for 5 min in TBS-T. Clarity or Clarity Max ECL reagent (Bio-Rad 1705060S, 1705062S) was used to visualize chemiluminescence, and images were taken with a Bio-Rad ChemiDoc or ChemiDoc XRS+ system. Exposure times of images used for analysis or presentation were maximum exposure before saturation of pixels around or within target bands.
Antibody concentrations used were: Mouse anti-α tubulin DM1A 1:5000; Mouse anti-FLAG 1:4000; Rabbit anti-HA 1:1000; Rabbit anti-lipin 1 1:1000; Rabbit anti-Phospho-p70 S6 Kinase (Thr389) (108D2) 1:1000; Rabbit anti-p70 S6 kinase 1:1000; Rabbit anti-Phospho 4E-BP1 (Ser65) 1:1000; Rabbit anti-4E-BP1 1:1000; mouse anti-cyclin B1, 1:1000; mouse anti-cyclin E1 1:1000, all secondaries 1:10000
Live cell imaging
For live imaging, cells were plated in Willco Wells 35 mm dishes (Willco Wells HBST-3522), ibidi 2 well imaging chambers (ibidi 80287) with DIC lid (ibidi 80055); or ibidi 8 well imaging chambers (ibidi 80827). Samples were imaged in a CO2-, temperature-, and humidity-controlled Tokai Hit Stage Top Incubator. Objectives were also heated to 37°C. For CO2-controlled imaging, the imaging media used was Fluorobrite DMEM (Gibco A1896701) supplemented with 10% FBS. U2OS GFP-Sec61β/H2B-mCherry mitotic cells were imaged using a custom aluminum stage insert heated to 37°C with heating tape and temperature monitored using a Physitemp thermistor (BAT7001H) and probe (IT-18), with objective heating and using 140 mM NaCl, 2.5 mM KC, 1.8 mM CaCl2, 1.0 mM MgCl2, 20 mM HEPES, 15 mM glucose, pH 7.4 as the live cell imaging solution. When indicated, cells were treated with 1 μM SiR-DNA (Cytoskeleton, Inc. CY-SC007) for 1 hour prior to imaging and kept in SiR-DNA-containing live imaging media during imaging. When indicated, cells were treated with 1 μM ER Tracker Green (Invitrogen E34251) for 30 min and washed out prior to imaging, and cells were imaged for a maximum of 2 hours after treatment.
Cytoplasmic viscosity measurements
To prepare for cytoplasmic viscosity measurements, 2.75+/−0.219 μm diameter streptavidin-functionalized superparamagnetic beads (Bangslabs PMS3N) were incubated with 1 μM 647 fluorophore (Atto647N Biotin, Sigma 93606) for 2 hours at 4 C, shaking at 400 RPM. Cells were plated with beads during passaging and left to grow for 2-3 days until 75-80% confluent. Cells were passaged in this way for 3-4 cycles until visual inspection of cells shows approximately 40% of mitotic cells contain a single bead. Cells were grown in 35 mm Desag 263 glass-bottomed culture dish (0.17 mm thick glass black DeltaT, 04200417B, Bioptechs) to 75-80% confluency. Prior to experiments, cell medium was switched to an imaging medium (FluoroBrite DMEM, Gibco) supplemented with 10 mM HEPES and left to equilibrate for 10-20 minutes. Then a layer of 1 mL white mineral oil (VWR) was added on top of the imaging medium, and the dishes were mounted in a temperature control system and kept at 37 °C (DeltaT Culture Dish System, Bioptechs). Only metaphase cells displaying proper chromosome alignment, no significant blebbing or morphological issues, and a high expression level of the expected tags, and having a single bead were selected for experiments.
The cylindrical magnetic tweezer core was made of ¼” wide, 6” long HyMu80 alloy (EFI Alloy 79, Ed Fagan Inc.) and sharpened at one end to a cone with a tip width of 5 μm. The solenoid frame was a steel cylinder 1” wide, 3” long, and has a hole for the core to fit through. The frame was held onto the core using 2 set screws. The solenoid was made using sheathed, 24-gauge copper wire (7588K77, McMaster-Carr) and wound 400 times. The solenoid and core were mounted on a micromanipulator (NMN-21, Narishige), which was mounted on a custom-built base using ThorLabs components. The solenoid was connected to a programmable power supply (PSP-603, GW Instek).
To analyze cytoplasmic viscosity measurements, we built a custom MATLAB pipeline. Briefly, we used featuretrack, an open-source MATLAB package by Maria Kilfoil, modified with a 3D Gaussian fit to localize the bead each frame and calculate displacement between successive frames. Once we found the full trajectory of the bead, we fit the velocity, bootstrapping using 50% of the data, repeated 10 times. We had previously calibrated the magnetic tweezer system using the same beads suspended in glycerol as described (Kollmannsberger and Fabry, 2007) to produce a 2D map of the force exerted on the bead based on the location relative to the tweezer tip. To calculate cytoplasmic viscosity, we rearranged Stokes’ Law, which defines the drag force on a sphere moving through a viscous fluid:
where Fd is the drag force, R is the bead radius, ν is the bead velocity, and η is the effective cytoplasmic viscosity for particles similar in size to the magnetic bead. Final reported data points represent a calculation of cytoplasmic viscosity per pull across multiple cells. Errors were calculated taking into account tweezer calibration, bead localization, and the velocity fit.
Microscopy
Samples were imaged on an inverted Nikon Ti microscope equipped with a Yokogawa CSU-X1 confocal scanner unit with solid state 100-mW488-nm and 50-mW561-nm lasers, using a 60×1.4 NA plan Apo oil immersion objective lens, and a Hamamatsu ORCA R-2 Digital CCD Camera.
Samples with SiR-DNA/GFP-KDEL, FLAG-lipin/calnexin staining, cyclin A2/EdU staining, or telophase nocodazole washout cells were imaged on an inverted Nikon Ti Eclipse microscope equipped with a Yokogawa CSU-W1 confocal scanner unit with solid state 100 mW 405, 488, 514, 594, 561, 594, and 640 nm lasers, using a 60x 1.4 NA plan Apo oil immersion objective lens and/or 20x plan Fluor 0.75 NA multi-immersion objective lens, and a prime BSI sCMOS camera.
Samples for magnetic tweezer experiments and chromosome velocity measurements were imaged on an inverted Nikon Ti Eclipse equipped with a manual rotation stage. Multi-dimensional time-series images were acquired with a Yokogawa CSU-X1 spinning disk unit with a 1.2X camera mount magnifier, Coherent Obis lasers (488, 5660, 640 nm), a motor-driven filter wheel (filters: 514/60, 593/40, 647 LP; Ludl), an objective z-piezo stage (Physik Instrumente), a 60x 1.4 NA plan Apo oil immersion objective lens, and a sCMOS camera (Flash LT+, Hamamatsu).
Flow Cytometry
Cells were plated into 2 wells of a 6-well plate per experimental measure with 250,000 cells/well. When indicated, cells were treated with 10 μM TOFA or DMSO for 24-48 hrs. Cells were labeled with 10 μM bromodeoxyuridine (BrdU) for 30 min, then washed twice with PBS and once with 3 mM EDTA in PBS, then incubated in 3 mM EDTA in PBS for 5-10 min before harvest by cell scraping and centrifugation. Pellets were resuspended in 100 μl in PBS and fixed with dropwise addition of 95% ethanol while vortexing. Samples were centrifuged and ethanol aspirated; samples were then incubated in 2N HCl with 0.5% Triton X-100 for 30 min, then centrifuged and supernatant decanted. Samples were incubated in 0.1 M sodium tetraborate decahydrate, pH 8.5 for 30 min, then centrifuged and decanted. Samples were stained with 1:200 mouse α BrdU in 1% BSA 0.2 % Tween-20 in PBS for 30 min, then centrifuged and decanted, then washed with 1% BSA in PBS. Samples were stained with 1:200 FITC goat a mouse in 1% BSA 0.2 % Tween-20 in PBS, then centrifuged and decanted and washed with 1% BSA 0.2 % Tween-20 in PBS. Cells were resuspended in 100 μl of 100 μg/ml RNAse A in PBS and incubated for 5 min before addition of 400 μl 50 μg/ml propidium iodide in PBS. Samples were stored at 4 °C and analyzed within 24 hours. Samples were pushed through mesh filters just before analysis. All centrifugation steps were performed at 500 x g for 5 min, and all staining steps were performed on an orbital shaker.
Samples were analyzed on a Becton Dickinson LSR Fortessa using FACS DiVA software. Voltage settings used were: FSC 10, SSC 160, FITC 420, PE Texas Red, 300. 5000 events per experimental measure were recorded. Unstained and minus-one controls were included. Compensation between PE Texas Red and FITC channels was determined using FlowJo 10 using the traditional spillover algorithm.
To quantify the percentage of cells in G1, S, and G2 phase using FlowJo 10, singlet cells were first separated by gating the range from 2N-4N peaks in propidium iodide signal (Cecchini et al., 2012). The FITC-BrdU-positive (S) population gate was drawn using the minus-propidium iodide control, and the G1 and G2 populations were gated by drawing boxes around the 2N and 4N FITC-negative populations (Cecchini et al., 2012). Percentages are expressed as percentage of the singlet population.
Image analysis
Image analysis was performed using FIJI/ImageJ (Schindelin et al., 2012) unless otherwise noted. All images with multiple markers in the same image are composites (multiple markers shown as different colors in composites).
All data of ER phenotypes quantified by categorization were scored blindly. Images were blinded for analysis using the ImageJ Macro ImageJ Filename_Randomizer. For scoring of ER phenotypes, cells expressing moderate levels of GFP-KDEL with no overexpression artifacts (dense fluorescent clumps in ER or nuclei) were included for analysis. For scoring of interphase ER expansion, cells with a network of peripheral ER tubules visualized with GFP-KDEL or calnexin staining were considered “normal”, while cells with ER sheets and tubules extending into the periphery with a lack of any tubular network were considered to have “expanded ER”. Additionally, cells with the appearance of thin ER tubules, large gaps between tubules, and a smaller cluster of perinuclear ER were considered to have “reduced ER” with TOFA treatment. In cells knocked down of lipin 1, the presence of ER sheets in the cell periphery was additionally blindly scored, where cells having multiple small, bright sheets within the tubular peripheral network were considered to have the “abnormal sheets” phenotype.
ER phenotypes were additionally quantified with percent abundance of cytoplasmic KDEL/calnexin signal or total ER area (cell cycle analyses of ER size). For cells with the entire ER captured within 0.3-0.5 μm interval z stacks, 8-bit maximum intensity projections were made of the whole field of view. To ensure the different ER morphologies were all accounted for after thresholding, the 8-bit max projections were subject to unsharp masking with a radius of 2 and mask of 0.6. The max intensity projection was thresholded using the Huang threshold of object fuzziness (Huang and Wang, 1995). The cell border and nuclear border for each cell were manually traced using ER fluorescent signal. For percent occupancy of the cytoplasm by ER membranes, the percent of pixels within the nucleus-free cell area which were GFP-KDEL(+) or calnexin(+) was measured. For ER area, the total area of calnexin signal in the nucleus-free cell area was measured. For calculation of cell area, the area within the cell border described above was used. For cell cycle staging, cells containing EdU punctae in the nucleus were considered to be in S phase. Cells with no EdU staining and nuclear cyclin A2 < cytoplasmic cyclin A2 were considered to be in G1 phase, whereas cells with no EdU staining and nuclear cyclin A2 ≤ cytoplasmic cyclin A2 were considered to be in G2 phase.
For quantification of micronuclei, images taken at 60x were scored for presence of micronuclei (DNA fragments encased in an emerin or calnexin-positive rim apart from main nucleus <~20% in size of the main nucleus). Severely lobulated/partitioned “hypermicronucleated” nuclei (DNA fragments/lobes apart from the main nucleus >~20% in size of the main nucleus) and micronuclei were scored through oculars or in 60x images of cells with nuclear envelope staining. Nuclei with both lobes/partitions and micronuclei were considered hypermicronucleated. For quantification of peripheral chromosome/tubulin masses in cells subjected to short-term nocodazole washout, 60x images of cells processed for immunofluorescence without non-kinetochore MT depolymerization were scored for the presence of chromosome masses with MTs extending to them that were away to the cell periphery compared to the primary nuclei chromosome masses.
Nuclear solidity was quantified as described (Fonseca et al., 2019). Briefly, DAPI/Hoechst images were thresholded with the ImageJ default setting, then the magic wand tool was used to select segmented nuclei. Nuclei that were unable to be segmented due to poor signal:noise, adjacent nuclei touching, or presence of a micronucleus touching the main nucleus were not included in the analysis. Segmented and selected nuclei were measured using the ImageJ shape descriptors measurement metric, which includes object solidity (the area fraction of a convex hull for an object). Data were expressed as % of nuclei with a solidity value less than the control U2OS average minus 1 standard deviation (Fonseca et al., 2019).
To quantify the percent of mitotic cell diameter that is occupied by ER membranes in cells expressing GFP-Sec61β/H2B-mCherry or GFP-KDEL/SiR-DNA, 60x image stacks of cells at anaphase onset (determined by first frame of visible chromatid separation) were obtained. Image background was subtracted using the average value of 3 boxes from surrounding the cell (but not within adjacent cells). A 10-pixel thick line was drawn encompassing the cell diameter along the metaphase plate (in the center of the dividing chromatin masses, along the division plane), and a profile plot was generated. The local maxima of the Sec61β/KDEL peaks for each side of the cell was determined, and the width of the half maxima for each of the 2 Sec61β/KDEL peaks was quantified and added together. This value was divided by the diameter of the cell (determined by the bounds of the Sec61β/KDEL half maxima) to determine the % of the cell diameter occupied by ER signal. For representation, plot profiles shown are normalized to minimum and maximum of ER (stably expressed GFP-Sec61β/transiently expressed GFP-KDEL and DNA (stably expressed H2B-mCherry, when applicable) signal.
For quantification of intracellular ER membranes in prometaphase-metaphase cells (determined by DIC chromosome appearance), 90x images of cells expressing GFP-KDEL and subject to mitotic shakeoff were blindly scored for presence of a) no intracellular ER membranes (“cleared”), (b) few ER tubules within the cell interior (“partially cleared”); or c) large (>2 μm length) sheets and/or several tubules within the cell interior (“not cleared”).
To analyze average chromosome velocity in prometaphase cells, we used PIVlab, an open-source MATLAB toolbox for particle image velocimetry (Thielicke, 2014; Thielicke and Stamhuis, 2014), to generate velocity fields of chromosome movement within the chromosome mass. We then used MATLAB to filter and analyze velocity information. Final reported chromosome movements correspond to the average velocity magnitude of the chromosome mass deformation per frame averaged over time.
To measure nuclear localization of lipin, cells were blindly scored for localization of lipin 1 in 3 categories: mostly nuclear lipin 1, nuclear lipin 1 = cytoplasmic lipin 1, and mostly cytoplasmic lipin 1. Cell cycle staging was determined using cyclin A2 nuclear staining and EdU staining. For determining the cell cycle-specific localization of lipin 1, data was expressed as percentage of cells with nuclear lipin 1 (including both categories “mostly nuclear lipin 1” and “nuclear lipin 1 = cytoplasmic lipin 1”).
Quantification and Statistical Analysis
GraphPad Prism 8 was used for all statistical analysis. Continuous data was tested for normality using a Shapiro-Wilk test. In imaging experiments where phenotypes of individual cells are scored, n refers to individual cells, unless otherwise defined. All N refer to experimental repeats. For experimental setups in which > 10 samples (n) per experimental replicate (N) were able to be collected consistently, continuous data was measured with paired t tests of experimental replicate means. Superplot format (Lord et al., 2020) was used for representing percent of ER-positive pixels in cytoplasm area and ER area. Experimental replicates of discrete data were plotted with shapes indicating separate replicates to display reproducibility, and incidences between groups (replicates pooled) were tested for significance using Fisher’s exact test (2 categories) or Chi square test (>2 categories). Statistical tests used, sample sizes, definitions of n and N, and p values (p<0.05 as significance cutoff) are reported in figures and/or figure legends. For quantification of all data where >10 samples could be gathered within an experimental repeat, sample size calculations using the online tool (https://clincalc.com/stats/samplesize.aspx) determined the adequate sample size for number of cells to analyze for sufficient (80%) power.
Supplementary Material
Movie S1. ER membrane clearance and dynamics during anaphase and mitotic exit, pertaining to Figure 2.
Confocal time lapse images of GFP-Sec61β (gray)/H2B-mCherry (magenta) in stably-expressing U2OS cells treated with control (left) or CTDNEP1 (right) siRNA. Time stamp (min:sec). Scale bar 10 μm.
Movie S2. Unaligned chromosomes entrapped in peripheral ER membranes during prometaphase, pertaining to Figure 2.
Confocal time lapse images of GFP-KDEL (gray) and H2B-mCherry (magenta) in transiently-expressing control (left) and CTDNEP1KO (right) U2OS cells taken after Cdk1i washout. Arrows point to unaligned chromosomes during prometaphase. Scale bar 10 μm.
Movie S3, Mitotic cytoplasm viscosity measurements taken from displacement of beads upon application of constant force with magnetic tweezers, pertaining to Figure 2.
Confocal time lapse images of ER Tracker Green staining (gray) in indicated U2OS cells cultured with Alexa Fluor 647-conjugated 2.75 μm magnetic beads (magenta). Beads are pulled through the cytoplasm using magnetic tweezers. Time stamp (min:sec). Scale bar 10 μm.
Movie S4, Prometaphase chromosome movements, pertaining to Figure 2
Confocal time lapse images of SiR-DNA staining in control (left) and CTDNEP1KO (right) U2OS cells. Time stamp (min:sec). Scale bar 10 μm.
Table S1: Raw and normalized lipidomics data from control U2OS and CTDNEP1 knockout cells, pertaining to Figure 1 and S1. Table of data generated from lipidomic analysis, as pmol per sample (tab “Raw data_pmol per sample”) or normalized to pmol/mg protein (tab “normalized_pmol per mg protein”). Feature, class, structural category, functional category, total length, total number of double bonds, and total number of hydroxyl groups are shown. STE = Sterol Ester; GL = Glycerolipid; GPL = Glycerophospholipid; STO = Storage Lipid; MEM = Membrane Lipid.
Highlights.
Increased fatty acid synthesis can lead to ER expansion and micronuclei formation.
CTDNEP1 regulation of lipin 1 in interphase limits ER expansion and micronuclei
CTDNEP1 counteracts mTOR phosphorylation of lipin 1 in interphase
Excess ER membranes inherited by mitotic cells impede error correction
Acknowledgements
We thank M. Deline, L.K. Schroeder, C. Hu, S. Lee, P. Forscher and G. Celma (Yale University) for guiding aspects of these studies; T. Fujimoto (Juntendo University) for human lipin 1 constructs; and I. Cheeseman (Whitehead Institute MIT) for helpful discussion. This work was supported by: NIH R01 (GM131004) to S.B., NSF MRI (DBI-1919834) to D.J. N., NIH R01 (GM136900) to T.E.H. Additional support is by NIH (T32s GM100884 and GM007499) and the Gruber Foundation to H.M., NIH (T32 GM722345) to J.W.C.R., NSF Quantitative Biology Student Fellowship (1764269) to M. A-D., and an American Heart Association Fellowship (20PRE35210847) to M.E.G.
Footnotes
Publisher's Disclaimer: This is a PDF file of an unedited manuscript that has been accepted for publication. As a service to our customers we are providing this early version of the manuscript. The manuscript will undergo copyediting, typesetting, and review of the resulting proof before it is published in its final form. Please note that during the production process errors may be discovered which could affect the content, and all legal disclaimers that apply to the journal pertain.
Declaration of Interests
The authors declare no competing interests.
Inclusion and Diversity
One or more of the authors of this paper self-identifies as an underrepresented ethnic minority in science. One or more of the authors of this paper self-identifies as part of the LGBTQ+ community.
References
- Bahmanyar S, Biggs R, Schuh AL, Desai A, Muller-Reichert T, Audhya A, Dixon JE, and Oegema K (2014). Spatial control of phospholipid flux restricts endoplasmic reticulum sheet formation to allow nuclear envelope breakdown. Genes Dev 28, 121–126. [DOI] [PMC free article] [PubMed] [Google Scholar]
- Bahmanyar S, and Schlieker C (2020). Lipid and protein dynamics that shape nuclear envelope identity. Mol Biol Cell 31, 1315–1323. [DOI] [PMC free article] [PubMed] [Google Scholar]
- Barger SR, Penfield L, and Bahmanyar S (2021). Coupling lipid synthesis with nuclear envelope remodeling. Trends Biochem Sci. [DOI] [PMC free article] [PubMed] [Google Scholar]
- Baumann O, and Walz B (2001). Endoplasmic reticulum of animal cells and its organization into structural and functional domains. Int Rev Cytol 205, 149–214. [DOI] [PubMed] [Google Scholar]
- Bertolio R, Napoletano F, Mano M, Maurer-Stroh S, Fantuz M, Zannini A, Bicciato S, Sorrentino G, and Del Sal G (2019). Sterol regulatory element binding protein 1 couples mechanical cues and lipid metabolism. Nat Commun 10, 1326. [DOI] [PMC free article] [PubMed] [Google Scholar]
- Boroda S, Takkellapati S, Lawrence RT, Entwisle SW, Pearson JM, Granade ME, Mullins GR, Eaton JM, Villen J, and Harris TE (2017). The phosphatidic acid-binding, polybasic domain is responsible for the differences in the phosphoregulation of lipins 1 and 3. J Biol Chem 292, 20481–20493. [DOI] [PMC free article] [PubMed] [Google Scholar]
- Brinkman EK, Chen T, Amendola M, and van Steensel B (2014). Easy quantitative assessment of genome editing by sequence trace decomposition. Nucleic Acids Res 42, e168. [DOI] [PMC free article] [PubMed] [Google Scholar]
- Brohée LD, S., Willems J; Arnould T,;Alain CC; Deroanne CF (2015). Lipin-1 regulates cancer cell phenotype and is a potential target to potentiate rapamycin treatment. Oncotarget 6, 11264–11280. [DOI] [PMC free article] [PubMed] [Google Scholar]
- Cecchini MJ, Amiri M, and Dick FA (2012). Analysis of cell cycle position in mammalian cells. J Vis Exp. [DOI] [PMC free article] [PubMed] [Google Scholar]
- Champion L, Linder MI, and Kutay U (2017). Cellular Reorganization during Mitotic Entry. Trends Cell Biol 27, 26–41. [DOI] [PubMed] [Google Scholar]
- Champion L, Pawar S, Luithle N, Ungricht R, and Kutay U (2019). Dissociation of membrane-chromatin contacts is required for proper chromosome segregation in mitosis. Mol Biol Cell 30, 427–440. [DOI] [PMC free article] [PubMed] [Google Scholar]
- Cimini D (2008). Merotelic kinetochore orientation, aneuploidy, and cancer. Biochim Biophys Acta 1786, 32–40. [DOI] [PubMed] [Google Scholar]
- Cimini D, Fioravanti D, Salmon ED, and Degrassi F (2002). Merotelic kinetochore orientation versus chromosome mono-orientation in the origin of lagging chromosomes in human primary cells. J Cell Sci 115, 507–515. [DOI] [PubMed] [Google Scholar]
- Cimini D, Howell B, Maddox P, Khodjakov A, Degrassi F, and Salmon ED (2001). Merotelic kinetochore orientation is a major mechanism of aneuploidy in mitotic mammalian tissue cells. J Cell Biol 153, 517–527. [DOI] [PMC free article] [PubMed] [Google Scholar]
- Cimini D, Moree B, Canman JC, and Salmon ED (2003). Merotelic kinetochore orientation occurs frequently during early mitosis in mammalian tissue cells and error correction is achieved by two different mechanisms. J Cell Sci 116, 4213–4225. [DOI] [PubMed] [Google Scholar]
- Currie E, Schulze A, Zechner R, Walther TC, and Farese RV Jr. (2013). Cellular fatty acid metabolism and cancer. Cell Metab 18, 153–161. [DOI] [PMC free article] [PubMed] [Google Scholar]
- Dey G, and Baum B (2021). Nuclear envelope remodelling during mitosis. Curr Opin Cell Biol 70, 67–74. [DOI] [PMC free article] [PubMed] [Google Scholar]
- Dey G, Culley S, Curran S, Schmidt U, Henriques R, Kukulski W, and Baum B (2020). Closed mitosis requires local disassembly of the nuclear envelope. Nature 585, 119–123. [DOI] [PMC free article] [PubMed] [Google Scholar]
- Donkor J, Sariahmetoglu M, Dewald J, Brindley DN, and Reue K (2007). Three mammalian lipins act as phosphatidate phosphatases with distinct tissue expression patterns. J Biol Chem 282, 3450–3457. [DOI] [PubMed] [Google Scholar]
- Dubots E, Cottier S, Peli-Gulli MP, Jaquenoud M, Bontron S, Schneiter R, and De Virgilio C (2014). TORC1 regulates Pah1 phosphatidate phosphatase activity via the Nem1/Spo7 protein phosphatase complex. PLoS One 9, e104194. [DOI] [PMC free article] [PubMed] [Google Scholar]
- Eaton JM, Mullins GR, Brindley DN, and Harris TE (2013). Phosphorylation of lipin 1 and charge on the phosphatidic acid head group control its phosphatidic acid phosphatase activity and membrane association. J Biol Chem 288, 9933–9945. [DOI] [PMC free article] [PubMed] [Google Scholar]
- English AR, and Voeltz GK (2013). Endoplasmic reticulum structure and interconnections with other organelles. Cold Spring Harb Perspect Biol 5, a013227. [DOI] [PMC free article] [PubMed] [Google Scholar]
- Fagone P, and Jackowski S (2009). Membrane phospholipid synthesis and endoplasmic reticulum function. J Lipid Res 50 Suppl, S311–316. [DOI] [PMC free article] [PubMed] [Google Scholar]
- Ferrandiz N, Downie L, Starling GP, and Royle SJ (2021). Endomembranes promote chromosome missegregation by ensheathing misaligned chromosomes. bioRxiv, 2021.2004.2023.441091. [DOI] [PMC free article] [PubMed] [Google Scholar]
- Finck BN, Gropler MC, Chen Z, Leone TC, Croce MA, Harris TE, Lawrence JC Jr., and Kelly DP (2006). Lipin 1 is an inducible amplifier of the hepatic PGC-1alpha/PPARalpha regulatory pathway. Cell Metab 4, 199–210. [DOI] [PubMed] [Google Scholar]
- Fonseca CL, Malaby HLH, Sepaniac LA, Martin W, Byers C, Czechanski A, Messinger D, Tang M, Ohi R, Reinholdt LG, et al. (2019). Mitotic chromosome alignment ensures mitotic fidelity by promoting interchromosomal compaction during anaphase. J Cell Biol 218, 1148–1163. [DOI] [PMC free article] [PubMed] [Google Scholar]
- Friedman JR, and Voeltz GK (2011). The ER in 3D: a multifunctional dynamic membrane network. Trends Cell Biol 21, 709–717. [DOI] [PMC free article] [PubMed] [Google Scholar]
- Grimsey N, Han GS, O’Hara L, Rochford JJ, Carman GM, and Siniossoglou S (2008). Temporal and spatial regulation of the phosphatidate phosphatases lipin 1 and 2. J Biol Chem 283, 29166–29174. [DOI] [PMC free article] [PubMed] [Google Scholar]
- Gu W, Gao S, Wang H, Fleming KD, Hoffmann RM, Yang JW, Patel NM, Choi YM, Burke JE, Reue K, et al. (2021). The middle lipin domain adopts a membrane-binding dimeric protein fold. Nature Communications 12, 4718. [DOI] [PMC free article] [PubMed] [Google Scholar]
- Habenicht AJ, Glomset JA, Goerig M, Gronwald R, Grulich J, Loth U, and Schettler G (1985). Cell cycle-dependent changes in arachidonic acid and glycerol metabolism in Swiss 3T3 cells stimulated by platelet-derived growth factor. Journal of Biological Chemistry 260, 1370–1373. [PubMed] [Google Scholar]
- Han GC, G. M (2004). Assaying Lipid Phosphate Phosphatase Activities. In Signal Transduction Protocols Methods in Molecular Biology, M.M.D. Dickson RC, ed. (Humana Press; ). [DOI] [PubMed] [Google Scholar]
- Han S, Bahmanyar S, Zhang P, Grishin N, Oegema K, Crooke R, Graham M, Reue K, Dixon JE, and Goodman JM (2012). Nuclear envelope phosphatase 1-regulatory subunit 1 (formerly TMEM188) is the metazoan Spo7p ortholog and functions in the lipin activation pathway. J Biol Chem 287, 3123–3137. [DOI] [PMC free article] [PubMed] [Google Scholar]
- Harris TE, and Finck BN (2011). Dual function lipin proteins and glycerolipid metabolism. Trends Endocrinol Metab 22, 226–233. [DOI] [PMC free article] [PubMed] [Google Scholar]
- Hatch EM, Fischer AH, Deerinck TJ, and Hetzer MW (2013). Catastrophic nuclear envelope collapse in cancer cell micronuclei. Cell 154, 47–60. [DOI] [PMC free article] [PubMed] [Google Scholar]
- Huang L-K, and Wang M-JJ (1995). Image thresholding by minimizing the measures of fuzziness. Pattern Recognition 28, 41–51. [Google Scholar]
- Jackowski S (1994). Coordination of membrane phospholipid synthesis with the cell cycle. J Biol Chem 269, 3858–3867. [PubMed] [Google Scholar]
- Jacquemyn J, Foroozandeh J, Vints K, Swerts J, Verstreken P, Gounko NV, Gallego SF, and Goodchild R (2021). Torsin and NEP1R1-CTDNEP1 phosphatase affect interphase nuclear pore complex insertion by lipid-dependent and lipid-independent mechanisms. EMBO J, e106914. [DOI] [PMC free article] [PubMed] [Google Scholar]
- Jones DT, Jager N, Kool M, Zichner T, Hutter B, Sultan M, Cho YJ, Pugh TJ, Hovestadt V, Stutz AM, et al. (2012). Dissecting the genomic complexity underlying medulloblastoma. Nature 488, 100–105. [DOI] [PMC free article] [PubMed] [Google Scholar]
- Kim Y, Gentry MS, Harris TE, Wiley SE, Lawrence JC Jr., and Dixon JE (2007). A conserved phosphatase cascade that regulates nuclear membrane biogenesis. Proc Natl Acad Sci U S A 104, 6596–6601. [DOI] [PMC free article] [PubMed] [Google Scholar]
- Kok BPC, Skene-Arnold TD, Ling J, Benesch MGK, Dewald J, Harris TE, Holmes CFB, and Brindley DN (2014). Conserved residues in the N terminus of lipin-1 are required for binding to protein phosphatase-1c, nuclear translocation, and phosphatidate phosphatase activity. J Biol Chem 289, 10876–10886. [DOI] [PMC free article] [PubMed] [Google Scholar]
- Kollmannsberger P, and Fabry B (2007). High-force magnetic tweezers with force feedback for biological applications. Rev Sci Instrum 78, 114301. [DOI] [PubMed] [Google Scholar]
- Kumar D, Golchoubian B, Belevich I, Jokitalo E, and Schlaitz AL (2019). REEP3 and REEP4 determine the tubular morphology of the endoplasmic reticulum during mitosis. Mol Biol Cell 30, 1377–1389. [DOI] [PMC free article] [PubMed] [Google Scholar]
- Kwiatek JM, and Carman GM (2020). Yeast phosphatidic acid phosphatase Pah1 hops and scoots along the membrane phospholipid bilayer. J Lipid Res 61, 1232–1243. [DOI] [PMC free article] [PubMed] [Google Scholar]
- Lamming DW, and Sabatini DM (2013). A Central role for mTOR in lipid homeostasis. Cell Metab 18, 465–469. [DOI] [PMC free article] [PubMed] [Google Scholar]
- Liebergall SR, Angdisen J, Chan SH, Chang Y, Osborne TF, Koeppel AF, Turner SD, and Schulman IG (2020). Inflammation Triggers Liver X Receptor-Dependent Lipogenesis. Mol Cell Biol 40. [DOI] [PMC free article] [PubMed] [Google Scholar]
- Liu S, Kwon M, Mannino M, Yang N, Renda F, Khodjakov A, and Pellman D (2018). Nuclear envelope assembly defects link mitotic errors to chromothripsis. Nature 561, 551–555. [DOI] [PMC free article] [PubMed] [Google Scholar]
- Liu S, and Pellman D (2020). The coordination of nuclear envelope assembly and chromosome segregation in metazoans. Nucleus 11, 35–52. [DOI] [PMC free article] [PubMed] [Google Scholar]
- Lord SJ, Velle KB, Mullins RD, and Fritz-Laylin LK (2020). SuperPlots: Communicating reproducibility and variability in cell biology. J Cell Biol 219. [DOI] [PMC free article] [PubMed] [Google Scholar]
- Lu L, Ladinsky MS, and Kirchhausen T (2011). Formation of the postmitotic nuclear envelope from extended ER cisternae precedes nuclear pore assembly. J Cell Biol 194, 425–440. [DOI] [PMC free article] [PubMed] [Google Scholar]
- Luithle N, Uit de Bos J, Hovius R, Maslennikova D, Lewis RT, Ungricht R, Fierz B, and Kutay U (2020). Torsin ATPases influence chromatin interaction of the Torsin regulator LAP1. Elife 9. [DOI] [PMC free article] [PubMed] [Google Scholar]
- Ly P, and Cleveland DW (2017). Rebuilding Chromosomes After Catastrophe: Emerging Mechanisms of Chromothripsis. Trends Cell Biol 27, 917–930. [DOI] [PMC free article] [PubMed] [Google Scholar]
- Mackenzie KJ, Carroll P, Martin CA, Murina O, Fluteau A, Simpson DJ, Olova N, Sutcliffe H, Rainger JK, Leitch A, et al. (2017). cGAS surveillance of micronuclei links genome instability to innate immunity. Nature 548, 461–465. [DOI] [PMC free article] [PubMed] [Google Scholar]
- Makarova M, Gu Y, Chen JS, Beckley JR, Gould KL, and Oliferenko S (2016). Temporal Regulation of Lipin Activity Diverged to Account for Differences in Mitotic Programs. Curr Biol 26, 237–243. [DOI] [PMC free article] [PubMed] [Google Scholar]
- Mall M, Walter T, Gorjanacz M, Davidson IF, Nga Ly-Hartig TB, Ellenberg J, and Mattaj IW (2012). Mitotic lamin disassembly is triggered by lipid-mediated signaling. J Cell Biol 198, 981–990. [DOI] [PMC free article] [PubMed] [Google Scholar]
- Matsudaira T, Mukai K, Noguchi T, Hasegawa J, Hatta T, Iemura SI, Natsume T, Miyamura N, Nishina H, Nakayama J, et al. (2017). Endosomal phosphatidylserine is critical for the YAP signalling pathway in proliferating cells. Nat Commun 8, 1246. [DOI] [PMC free article] [PubMed] [Google Scholar]
- McCune SA, and Harris RA (1979). Mechanism responsible for 5-(tetradecyloxy)-2-furoic acid inhibition of hepatic lipogenesis. J Biol Chem 254, 10095–10101. [PubMed] [Google Scholar]
- Nabokina SM, Inoue K, Subramanian VS, Valle JE, Yuasa H, and Said HM (2014). Molecular identification and functional characterization of the human colonic thiamine pyrophosphate transporter. J Biol Chem 289, 4405–4416. [DOI] [PMC free article] [PubMed] [Google Scholar]
- Neuhaus J, Schwalenberg T, Horn LC, Alexander H, and Stolzenburg JU (2011). New aspects in the differential diagnosis and therapy of bladder pain syndrome/interstitial cystitis. Adv Urol 2011, 639479. [DOI] [PMC free article] [PubMed] [Google Scholar]
- Northcott PA, Jones DT, Kool M, Robinson GW, Gilbertson RJ, Cho YJ, Pomeroy SL, Korshunov A, Lichter P, Taylor MD, et al. (2012). Medulloblastomics: the end of the beginning. Nat Rev Cancer 12, 818–834. [DOI] [PMC free article] [PubMed] [Google Scholar]
- O’Hara L, Han GS, Peak-Chew S, Grimsey N, Carman GM, and Siniossoglou S (2006). Control of phospholipid synthesis by phosphorylation of the yeast lipin Pah1p/Smp2p Mg2+-dependent phosphatidate phosphatase. J Biol Chem 281, 34537–34548. [DOI] [PMC free article] [PubMed] [Google Scholar]
- Odle RI, Walker SA, Oxley D, Kidger AM, Balmanno K, Gilley R, Okkenhaug H, Florey O, Ktistakis NT, and Cook SJ (2020). An mTORC1-to-CDK1 Switch Maintains Autophagy Suppression during Mitosis. Mol Cell 77, 228–240 e227. [DOI] [PMC free article] [PubMed] [Google Scholar]
- Okuno H, Okuzono H, Hayase A, Kumagai F, Tanii S, Hino N, Okada Y, Tachibana K, Doi T, and Ishimoto K (2019). Lipin-1 is a novel substrate of protein phosphatase PGAM5. Biochem Biophys Res Commun 509, 886–891. [DOI] [PubMed] [Google Scholar]
- Papagiannidis D, Bircham PW, Luchtenborg C, Pajonk O, Ruffini G, Brugger B, and Schuck S (2021). Ice2 promotes ER membrane biogenesis in yeast by inhibiting the conserved lipin phosphatase complex. EMBO J e107958, e107958. [DOI] [PMC free article] [PubMed] [Google Scholar]
- Peterfy M, Phan J, and Reue K (2005). Alternatively spliced lipin isoforms exhibit distinct expression pattern, subcellular localization, and role in adipogenesis. J Biol Chem 280, 32883–32889. [DOI] [PubMed] [Google Scholar]
- Peterson TR, Sengupta SS, Harris TE, Carmack AE, Kang SA, Balderas E, Guertin DA, Madden KL, Carpenter AE, Finck BN, et al. (2011). mTOR complex 1 regulates lipin 1 localization to control the SREBP pathway. Cell 146, 408–420. [DOI] [PMC free article] [PubMed] [Google Scholar]
- Puhka M, Joensuu M, Vihinen H, Belevich I, and Jokitalo E (2012). Progressive sheet-to-tubule transformation is a general mechanism for endoplasmic reticulum partitioning in dividing mammalian cells. Mol Biol Cell 23, 2424–2432. [DOI] [PMC free article] [PubMed] [Google Scholar]
- Puhka M, Vihinen H, Joensuu M, and Jokitalo E (2007). Endoplasmic reticulum remains continuous and undergoes sheet-to-tubule transformation during cell division in mammalian cells. J Cell Biol 179, 895–909. [DOI] [PMC free article] [PubMed] [Google Scholar]
- Ran FA, Hsu PD, Wright J, Agarwala V, Scott DA, and Zhang F (2013). Genome engineering using the CRISPR-Cas9 system. Nature Protocols 8, 2281–2308. [DOI] [PMC free article] [PubMed] [Google Scholar]
- Schindelin J, Arganda-Carreras I, Frise E, Kaynig V, Longair M, Pietzsch T, Preibisch S, Rueden C, Saalfeld S, Schmid B, et al. (2012). Fiji: an open-source platform for biological-image analysis. Nat Methods 9, 676–682. [DOI] [PMC free article] [PubMed] [Google Scholar]
- Schlaitz AL, Thompson J, Wong CC, Yates JR 3rd, and Heald R (2013). REEP3/4 ensure endoplasmic reticulum clearance from metaphase chromatin and proper nuclear envelope architecture. Dev Cell 26, 315–323. [DOI] [PMC free article] [PubMed] [Google Scholar]
- Schweizer N, Pawar N, Weiss M, and Maiato H (2015). An organelle-exclusion envelope assists mitosis and underlies distinct molecular crowding in the spindle region. J Cell Biol 210, 695–704. [DOI] [PMC free article] [PubMed] [Google Scholar]
- Seifried A, Schultz J, and Gohla A (2013). Human HAD phosphatases: structure, mechanism, and roles in health and disease. FEBS J 280, 549–571. [DOI] [PubMed] [Google Scholar]
- Shimizu K, Fukushima H, Ogura K, Lien EC, Nihira NT, Zhang J, North BJ, Guo A, Nagashima K, Nakagawa T, et al. (2017). The SCFbeta-TRCP E3 ubiquitin ligase complex targets Lipin1 for ubiquitination and degradation to promote hepatic lipogenesis. Sci Signal 10. [DOI] [PMC free article] [PubMed] [Google Scholar]
- Siniossoglou S, Santos-Rosa H, Rappsilber J, Mann M, and Hurt E (1998). A novel complex of membrane proteins required for formation of a spherical nucleus. EMBO J 17, 6449–6464. [DOI] [PMC free article] [PubMed] [Google Scholar]
- Smyth JT, Beg AM, Wu S, Putney JW Jr., and Rusan NM (2012). Phosphoregulation of STIM1 leads to exclusion of the endoplasmic reticulum from the mitotic spindle. Curr Biol 22, 1487–1493. [DOI] [PMC free article] [PubMed] [Google Scholar]
- Sołtysik K, Ohsaki Y, Tatematsu T, Cheng J, Maeda A, Morita SY, and Fujimoto T (2021). Nuclear lipid droplets form in the inner nuclear membrane in a seipin-independent manner. J Cell Biol 220. [DOI] [PMC free article] [PubMed] [Google Scholar]
- Steigemann P, Wurzenberger C, Schmitz MH, Held M, Guizetti J, Maar S, and Gerlich DW (2009). Aurora B-mediated abscission checkpoint protects against tetraploidization. Cell 136, 473–484. [DOI] [PubMed] [Google Scholar]
- Tange Y, Hirata A, and Niwa O (2002). An evolutionarily conserved fission yeast protein, Ned1, implicated in normal nuclear morphology and chromosome stability, interacts with Dis3, Pim1/RCC1 and an essential nucleoporin. J Cell Sci 115, 4375–4385. [DOI] [PubMed] [Google Scholar]
- Thielicke W (2014). The flapping flight of birds: Analysis and application. In Ocean Ecosystems (Groningen, NL: University of Groningen; ). [Google Scholar]
- Thielicke W, and Stamhuis EJ (2014). PIVlab – Towards User-friendly, Affordable and Accurate Digital Particle Image Velocimetry in MATLAB. Journal of Open Research Software 2. [Google Scholar]
- Thompson SL, and Compton DA (2011). Chromosome missegregation in human cells arises through specific types of kinetochore-microtubule attachment errors. Proc Natl Acad Sci U S A 108, 17974–17978. [DOI] [PMC free article] [PubMed] [Google Scholar]
- Turgay Y, Champion L, Balazs C, Held M, Toso A, Gerlich DW, Meraldi P, and Kutay U (2014). SUN proteins facilitate the removal of membranes from chromatin during nuclear envelope breakdown. J Cell Biol 204, 1099–1109. [DOI] [PMC free article] [PubMed] [Google Scholar]
- Vassilev LT (2006). Cell cycle synchronization at the G2/M phase border by reversible inhibition of CDK1. Cell Cycle 5, 2555–2556. [DOI] [PubMed] [Google Scholar]
- Wang S, Romano FB, Field CM, Mitchison TJ, and Rapoport TA (2013). Multiple mechanisms determine ER network morphology during the cell cycle in Xenopus egg extracts. J Cell Biol 203, 801–814. [DOI] [PMC free article] [PubMed] [Google Scholar]
- Webster M, Witkin KL, and Cohen-Fix O (2009). Sizing up the nucleus: nuclear shape, size and nuclear-envelope assembly. J Cell Sci 122, 1477–1486. [DOI] [PMC free article] [PubMed] [Google Scholar]
- Witkin KL, Chong Y, Shao S, Webster MT, Lahiri S, Walters AD, Lee B, Koh JL, Prinz WA, Andrews BJ, et al. (2012). The budding yeast nuclear envelope adjacent to the nucleolus serves as a membrane sink during mitotic delay. Curr Biol 22, 1128–1133. [DOI] [PMC free article] [PubMed] [Google Scholar]
- Wu R, Garland M, Dunaway-Mariano D, and Allen KN (2011). Homo sapiens dullard protein phosphatase shows a preference for the insulin-dependent phosphorylation site of lipin1. Biochemistry 50, 3045–3047. [DOI] [PMC free article] [PubMed] [Google Scholar]
- Zhang CZ, Leibowitz ML, and Pellman D (2013). Chromothripsis and beyond: rapid genome evolution from complex chromosomal rearrangements. Genes Dev 27, 2513–2530. [DOI] [PMC free article] [PubMed] [Google Scholar]
- Zhang P, and Reue K (2017). Lipin proteins and glycerolipid metabolism: Roles at the ER membrane and beyond. Biochimica et Biophysica Acta (BBA) - Biomembranes 1859, 1583–1595. [DOI] [PMC free article] [PubMed] [Google Scholar]
- Zhang P, Verity MA, and Reue K (2014). Lipin-1 regulates autophagy clearance and intersects with statin drug effects in skeletal muscle. Cell Metab 20, 267–279. [DOI] [PMC free article] [PubMed] [Google Scholar]
Associated Data
This section collects any data citations, data availability statements, or supplementary materials included in this article.
Supplementary Materials
Movie S1. ER membrane clearance and dynamics during anaphase and mitotic exit, pertaining to Figure 2.
Confocal time lapse images of GFP-Sec61β (gray)/H2B-mCherry (magenta) in stably-expressing U2OS cells treated with control (left) or CTDNEP1 (right) siRNA. Time stamp (min:sec). Scale bar 10 μm.
Movie S2. Unaligned chromosomes entrapped in peripheral ER membranes during prometaphase, pertaining to Figure 2.
Confocal time lapse images of GFP-KDEL (gray) and H2B-mCherry (magenta) in transiently-expressing control (left) and CTDNEP1KO (right) U2OS cells taken after Cdk1i washout. Arrows point to unaligned chromosomes during prometaphase. Scale bar 10 μm.
Movie S3, Mitotic cytoplasm viscosity measurements taken from displacement of beads upon application of constant force with magnetic tweezers, pertaining to Figure 2.
Confocal time lapse images of ER Tracker Green staining (gray) in indicated U2OS cells cultured with Alexa Fluor 647-conjugated 2.75 μm magnetic beads (magenta). Beads are pulled through the cytoplasm using magnetic tweezers. Time stamp (min:sec). Scale bar 10 μm.
Movie S4, Prometaphase chromosome movements, pertaining to Figure 2
Confocal time lapse images of SiR-DNA staining in control (left) and CTDNEP1KO (right) U2OS cells. Time stamp (min:sec). Scale bar 10 μm.
Table S1: Raw and normalized lipidomics data from control U2OS and CTDNEP1 knockout cells, pertaining to Figure 1 and S1. Table of data generated from lipidomic analysis, as pmol per sample (tab “Raw data_pmol per sample”) or normalized to pmol/mg protein (tab “normalized_pmol per mg protein”). Feature, class, structural category, functional category, total length, total number of double bonds, and total number of hydroxyl groups are shown. STE = Sterol Ester; GL = Glycerolipid; GPL = Glycerophospholipid; STO = Storage Lipid; MEM = Membrane Lipid.
Data Availability Statement
All original data reported in this paper will be shared by the Lead Contact upon request.
All original code generated in this study is available from the Lead Contact upon request.
Any additional information required to reanalyze the data reported in this paper is available from the lead contact upon request.