

Abstract
During the COVID-19 pandemic, infection of farmed mink has become not only an economic issue but also a widespread public health concern. International agencies have advised the use of strict molecular and serosurveillance methods for monitoring the SARS-CoV2 status on mink farms. We developed 2 ELISAs and a duplex protein microarray immunoassay (MI), all in a double-recognition format (DR), to detect SARS-CoV2 antibodies specific to the receptor-binding domain (RBD) of the spike protein and to the full-length nucleoprotein (N) in mink sera. We collected 264 mink serum samples and 126 oropharyngeal samples from 5 Spanish mink farms. In both of the ELISAs and the MI, RBD performed better than N protein for serologic differentiation of mink from SARS-CoV2–positive and –negative farms. Therefore, RBD was the optimal antigenic target for serosurveillance of mink farms.
Keywords: COVID-19, ELISA, mink, protein microarray, RBD, SARS-CoV2, serosurveillance
Coronavirus disease (COVID-19), an acute viral respiratory disease, was declared a public health emergency outbreak of international concern by the WHO in January 2020. 40 COVID-19 is caused by severe acute respiratory syndrome coronavirus 2 (SARS-CoV2), a novel zoonotic betacoronavirus,35,44 whose genome encodes 4 principal structural proteins: nucleoprotein (N), spike (S), membrane (M), and envelope (E). 30 S protein is the major transmembrane glycoprotein that mediates attachment to host cells and virion entry. S protein contains the receptor-binding domain (RBD), which is sufficient to mediate binding to the angiotensin-converting enzyme 2 (ACE2) cellular receptor. 39 Full N and S proteins, as well as different S domains and fragments, have been used commonly as antigens for testing the SARS-CoV2 immune response. 19 Nonetheless, S protein is the main target for neutralizing antibodies, and RBD potentially leads to more specific tests, given its low conservation between the different pathogenic human coronaviruses.4,24,34
It has been proposed that SARS-CoV2 originated from bats, 43 but neither direct parent nor intermediate host have been confirmed.1,42 Experimental infections and early human-to-animal transmission cases have been reported, confirming that SARS-CoV2 can infect different mammalian orders, particularly members of the order Carnivora. 17 In particular, experimental infections showed that monkeys, hamsters, ferrets, cats, dogs, tree shrews, transgenic mice, and fruit bats are susceptible to infection by SARS-CoV2 and can suffer a wide range of clinical signs, from none to very severe signs; in contrast, pigs and poultry were resistant to infection. 14
American mink (Neovison vison) are among the species susceptible to SARS-CoV2. 23 A wide variation in clinical signs, morbidity, and mortality have been reported in infected farmed mink, 20 also suggesting that outbreaks can be so mild that they could easily go unnoticed. Since the first detection of infection of farmed mink by SARS-CoV2 in the Netherlands in April 2020, 23 a remarkable number of farms with infected mink have been detected in Europe and the United States. 3 In addition, new variants of the virus genome have been identified and sequenced in both mink and humans, supporting human-to-animal, animal-to-animal, and animal-to-human transmission.12,21 Those concerns led some governments to cull millions of mink in Europe in the last year,3,18 and threaten the future of the mink farming industry. 38 The European Food Safety Authority (EFSA) formulated instructions for strict monitoring of mink farms, including not only passive but also active monitoring systems for mink and farm staff. The EFSA called for frequent testing, early monitoring by reverse-transcription real-time PCR (RT-rtPCR) analysis, tracking virus evolution by genetic sequencing analysis, and detection by serologic assays of past asymptomatic exposure to SARS-CoV2. 11 The European Union (EU) laid down rules for the monitoring and detection of the SARS-CoV2 virus genome and reporting of infections in mustelids and raccoon dogs. 10 Regarding immunoassays used in veterinary medicine, an indirect ELISA has been used for serosurveillance in cats and dogs29,41; a multi-species ELISA has been proposed for use in mustelid sera.8,37
Taking advantage of multiplex and miniaturization features, microarray immunoassays (MIs) have been used extensively for human antibody response to SARS-CoV2 proteins7,16,26,36 and for serosurveillance.6,27,31 However, to our knowledge, a microarray format for testing of SARS-CoV2–specific antibody has not been reported in veterinary medicine. We developed 2 ELISAs and a duplex protein MI, all based on a double-recognition (DR) format, specifically for mink serum, to detect antibodies to the N protein and RBD. This format uses the same antigen as the capture molecule, immobilized on a solid phase, and conjugated to an enzyme as the detector molecule, 32 which allows detection of all antibody subtypes in a given sample. The performance of these 2 antigenic targets was compared in both platforms.
Materials and methods
Mink serum and oropharyngeal samples
We collected 264 mink serum samples and 126 oropharyngeal samples from 5 Spanish mink farms (Table 1). Farms 1 and 2 were sampled after an official declaration of SARS-CoV2 infection in 2020. Oropharyngeal and serum samples were collected on farm 1 in July 2020 from 71 mink, 16 days after an official analysis detected RT-rtPCR–positive cases in 78 of 90 mink (87% positivity). Farm 2 was sampled only for serologic testing (n = 30) in January 2021, 32 days after an official analysis detected RT-rtPCR–positive cases in 7 of 30 mink (23% positivity). Farm 3 (n = 25) was tested in December 2020 by our in-house RT-rtPCR and immunoassays; SARS-CoV2 infection was not suspected given that no infected workers were detected, and no clinical or epidemiologic data raised suspicion. Farm 4 oropharyngeal and serum samples (n = 30) were collected in November 2020, at the time of an official control by a competent veterinary authority, caused by clinical suspicion. The mink sampled for the official tests and for our assays were different. However, oropharyngeal and serum samples analyzed by our in-house RT-rtPCR and serologic tests came from the same mink. Historical serum samples (n = 108) collected from a Spanish farm (farm 5) during August 2019 for other testing purposes were categorized as pre-COVID pandemic samples. Positive and negative control sera for immunoassay development were obtained by pooling sera from farm 1 and pre-COVID pandemic samples, respectively.
Table 1.
Summary of the RT-rtPCR and RBD-based SARS-CoV2 immunoassay results.
| Farm 1* | Farm 2* | Farm 3 | Farm 4† | Farm 5 | |
|---|---|---|---|---|---|
| Positive samples/samples analyzed by official RT-rtPCR test | 78/90 | 7/30 | ND | 0/30 | ND |
| Positive samples/samples analyzed by in-house RT-rtPCR | 1/71 | ND | 0/25 | 0/30 | ND |
| Positive samples/samples analyzed by RBD-based ELISA | 71/71 | ND | 0/25 | 0/30 | 0/108 |
| Positive samples/samples analyzed by RBD-based MI | 71/71 | 30/30 | 0/25 | 0/30 | 0/108 |
MI = microarray immunoassay; ND = not done; RBD = receptor-binding domain; RT-rtPCR = reverse-transcription real-time PCR; SARS-CoV2 = severe acute respiratory syndrome coronavirus 2.
Samples for in-house tests were collected from farms 1 and 2, 16 d and 32 d, respectively, after the official collection for RT-rtPCR.
Farm 4 sampling for official and in-house tests were at the same time but taken from different mink; samples for in-house serologic and RT-rtPCR analysis were taken from the same mink in every farm.
Sample collection
In all cases, the animals were anesthetized with ketamine–xylazine prior to sampling. Oropharyngeal swabs were used for SARS-CoV2 nucleic acid detection. Blood samples for serology in suspected or confirmed positive farms were taken simultaneously with oropharyngeal swabs by cardiac puncture under deep anesthesia followed by immediate euthanasia. In negative and pre-pandemic farms, blood samples were taken by nail clipping or by venous puncture (cephalic or jugular veins) in anesthetized animals.
Expression of antigens for the performance of the assays
The expression of SARS-CoV2 recombinant N protein was performed as established. 15 The codon-optimized DNA sequence encoding residues 331–524 of RBD from the SARS-CoV2 S protein (GenBank NC_045512) was ordered from Integrated DNA Technologies, amplified by PCR, and inserted into the plasmid pCMV6-AC-FC-S (OriGene). The RBD recombinant antigen (RBDmFc) was expressed in HEK 293-F cells, as a fusion with a mouse IgG Fc region in its C-terminus, collected from the supernatant of suspension cultures and purified by protein G affinity chromatography (GE Healthcare). Protein gel electrophoresis followed by Coomassie staining was used to assess molecular size and purity of RBD.
Antigen conjugation to horseradish peroxidase
RBD and N were conjugated to horseradish peroxidase (HRP) according to a published method, 22 to be used as detectors individually or mixed in a detector cocktail, in both the DR-ELISAs and MI.
Double-recognition ELISAs
DR-ELISAs based on N and RBD were adapted from an assay described previously.15,32 High-binding 96-well microplates (Costar; Merck) were coated by incubating the corresponding antigen overnight at 4°C in carbonate buffer, pH 9.6. After washing the wells with PBS (pH 7.4) with 0.05% polysorbate 20 (PBST), a blocking step was performed (StabilZyme select stabilizer; Surmodics) for 1 h at room temperature. Plates were incubated with serum samples diluted 1:5 (N-based ELISA) or 1:10 (RBD-based ELISA) in PBST with 2.5% fetal bovine serum (Gibco, Thermo Fisher). The wells were washed 3 times with washing buffer (Eurofins-Ingenasa) using an automatic microplate washer (PW-960; Shenzhen Heales). The wells were then incubated with N or RBDmFc conjugated to HRP (N-HRP and RBD-HRP, respectively) for 30 min at room temperature. After a washing step, specific Ig binding was detected by incubating with the peroxidase substrate (TMB-MAX; Neogen). The reaction was stopped after 15 min by adding 0.5 M sulfuric acid, and the absorbance was measured at 450 nm (SpectraMax M5 plate reader; Molecular Devices). Results were presented as a sample:positive (S:P) ratio, defined as: (sample OD – negative control OD)/(positive control OD – negative control OD) × 10.
To optimize the N- and RBD-based ELISAs, different concentrations of coating antigens, incubation times, as well as serum and peroxidase-conjugated antigen dilutions were used. The coating antigens were tested in 2-fold serial dilutions of 4–0.25 µg/mL. The positive control serum was tested at 1:5 and 1:10 dilutions, combined with 2-fold serial dilutions of 1:10,000–1:100,000 for N- and RBD-HRP.
We used 108 pre-COVID serum samples from farm 5, categorized as negative, to calculate cutoff values for the ELISAs. The cutoff values were defined as the highest S:P values of all negative sera plus 2 SD.
Microarray production
A duplex protein microarray was made by spotting N and RBDmFc in a triplicate pattern, on high-binding Costar 96-well microplates (NanoPlotter 2.1 microarrayer; GeSiM). The antigens were spotted in protein printing buffer (Arrayit), and 0.02% (v/v) polysorbate 20 at 15°C and 50% relative humidity. Purified canine IgG (Immunology Consultants) was also printed as a positional marker to be developed by α-dog IgG 1BH4 (Eurofins-Ingenasa) included in the detector cocktail. Microarrays were incubated overnight in the hood enclosure of the NanoPlotter printer. Afterward, the wells were washed with PBST and incubated with StabilZyme select stabilizer (Surmodics) for 1 h at room temperature for blocking and stabilization.
Microarray immunoassay
Fifty µL of mink sera 1:10 diluted in PBST with 2.5% fetal bovine serum (Gibco, Thermo Fisher) were incubated at room temperature for 30 min, with shaking (500 rpm) on the plate mini-shaker (PSU 2T PLUS, Biosan), followed by 3 washing steps with PBST carried out using an automatic microplate washer (PW-960; Shenzhen Heales). After those procedures, 50 µL of detector cocktail containing both N-HRP and RBD-HRP was added and incubated at room temperature, for 30 min, with agitation (500 rpm). This was followed by a final washing step, and then the reactive spots were developed by incubating with spot dark TMB (SeramunBlau; Seramun Diagnostica) for 10 min.
The optimal immunoassay conditions were determined by incubating the positive and negative sera at 1:10 dilution, on 2-fold serial printing concentrations of N (0.2–0.025 mg/mL) and RDB (0.25–0.031 mg/mL). To detect potential cross-reactivity between serum antibodies and antigens, the positive control serum was assayed using serial 2-fold dilutions of each antigen-HRP conjugates incubated individually (1:4,000–1:128,000 for N; 1:250–1:32,000 for RBD).
Pre-COVID serum samples from farm 5 (n = 108), the same used for ELISA cutoff calculations, were also used to calculate cutoff values for the MI. The cutoff values were defined as the highest SI values of all negative sera plus 1.2 SD.
MI image analysis
MIs were scanned and analyzed (Clair reader, ArrayReader 2.6.1 software; Sensovation). N- and RBD-specific Ig reactivity are expressed as signal intensity (SI) values in arbitrary units (AU). Pixel signal intensity was 0–65,536 AU; scanned image pixel intensities have a depth of 16 bits per pixel. SI is calculated as the average of the median pixel signal intensity of the triplicate spots minus their corresponding median local background. Spots with a signal-to-noise ratio (SNR) value <2.0 are considered flawed or too weak and are removed from averaging. If all triplicated spots have a SNR <2.0, then the average value is set to zero. SNR value was calculated as follows 45 : SNR = (mean signal intensity – mean background intensity)/(SD of background).
Analysis of MI reproducibility
Intra-plate, inter-plate, and inter-assay reproducibility for N- and RBD-specific Ig detection by MI were assessed using a serum with medium N- and RBD-specific Ig reactivity, to avoid skewed results when testing saturated or very low result values. Reproducibility was expressed as CV, which was the ratio of the SD to the mean multiplied by 100%. Intra-plate CV was assessed by calculating the variation of three 8-well strips of the same microplate; inter-plate variation was calculated on an 8-well strip of 3 different microplates on the same day; inter-assay reproducibility was calculated by testing the serum 8 times on 3 different days.
SARS-CoV2 RNA detection using RT-rtPCR
Viral RNA was detected by a RT-rtPCR assay, which targeted the SARS-Cov2 E gene, using an in-house adaptation of a published assay. 5 Briefly, a 20-µL reaction containing 5 µL of RNA was carried out (One-step NZYSpeedy RT-qPCR probe kit; NZYTech), following the manufacturer’s instructions. As originally described, primers E_Sarbeco_F1 (5′-ACAGGTACGTTAATAGTTAATAGCGT-3′) and E_Sarbeco_R2 (5′-ATATTGCAGCAGTACGCACACA-3′) were used at a concentration of 400 nM, and probe E_Sarbeco_P1 (5′-(FAM)-ACACTAGCCATCCTTACTGCGCTTCG-BHQ1-3′) was used at 200 nM per reaction. Primers and probes were sourced from Eurofins Genomics. Thermocycling was performed at 50°C for 10 min for reverse transcription, followed by 95°C for 3 min, and then 45 cycles of 95°C for 15 s, 58°C for 30 s.
Statistical analysis
MedCalc 10 software was used to statistically analyze the data obtained. Interactive dot diagram analyses were performed to establish sensitivity and specificity with the optimal cutoff value for each assay. Cutoff values were based on results obtained from testing serum samples from 108 pre-pandemic mink, and then calculated by adding 2 or 1.2 SDs to the highest DR-ELISA and MI result, respectively.
Results
Expression of antigens for assay performance
Recombinant N protein was expressed. Purification as assessed by SDS-PAGE and Coomassie blue staining confirmed the expected size, yield, and degree of purification. 15 The RBDmFc protein was expressed in HEK293-F. Further purification by protein G–based affinity chromatography rendered an average yield of 21.7 mg/L. The analysis by SDS-PAGE confirmed a highly purified protein with an apparent molecular mass of ~55 kDa (Fig. 1). The increase in apparent molecular weight compared to the theoretical weight (42.9 kDa) could be the result of the addition of 3 potential N-glycosylation sites.
Figure 1.
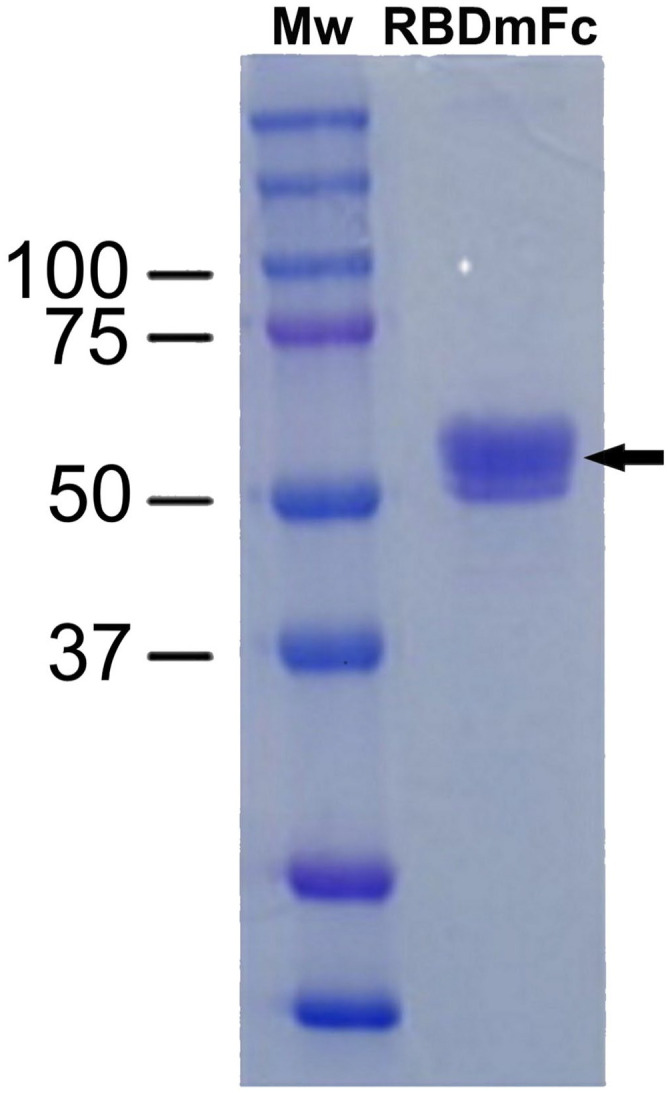
Analysis of purified recombinant RBDmFc by SDS-PAGE and Coomassie staining.
Three mg of receptor-binding domain (RBD, 55 kDa; indicated by an arrow), purified from culture supernatant of HEK-293 cells by protein G–based affinity chromatography, were fractionated by 10% SDS-PAGE. Mw = molecular weight markers (in kDa).
Farmed mink RT-rtPCR analysis
Only 1 of 71 samples from farm 1 (SARS-CoV2 infection confirmed) was positive by our in-house RT-rtPCR, 16 d after the peak in virus detection (87% RT-rtPCR positivity in the official control). Oropharyngeal samples from farm 2 were not available for in-house assays, but official testing detected 7 positive cases out of 30 mink (23% positivity). Additionally, all samples from farm 3 (n = 25) were negative by our in-house RT-rtPCR, and all samples from farm 4 (SARS-CoV2 infection suspected; n = 30) were negative by both the official test and our in-house assay. These results, along with the corresponding serologic assays, confirmed that the mink sampled on farm 4 were not infected with SARS-CoV2.
Development of DR-ELISAs
Initial experiments were performed to determine the optimal concentration of the coating and conjugated antigens as well as the dilution of sera. The optimal concentration for both coating antigens was 0.5 µg/mL, whereas the optimal combinations of serum and conjugate dilutions were as follows: serum dilution 1:5 and conjugate dilution 1:10,000 for the N-based ELISA, and serum dilution 1:10 with conjugate dilution 1:100,000 for the RBD-based ELISA (data not shown). The most suitable incubation time was 15 min. These conditions were used to analyze our serum collections.
Development of the MI for SARS-CoV2–specific antibody detection
It was shown that RBD-HRP detector at any dilutions (1:250–1:32,000) rendered no cross-reactivity on N spots in any printing antigen concentrations (Fig. 2A). On the contrary, N-HRP rendered cross-reactivity on RBD spots using detector dilutions lower than 1:16,000 (Fig. 2B). Dilutions that did not show any cross-reactivity (RBD-HRP dilutions of 1:1,000–1:32,000; N-HRP dilutions of 1:16,000–1:512,000) were mixed to obtain detector cocktails at 2-fold serial dilutions to define the best detector cocktail dilution. The detector cocktails were incubated on the microarray noted previously, with positive and negative sera (Fig. 3). The best conditions for the MI were 1:16,000 for N-HRP and 1:1,000 for RBD-HRP detectors (Fig. 3), and 0.05 mg/mL for N and 0.125 mg/mL for RBD printing concentrations. This combination had the highest non-saturating SI values for both N- and RBD-specific Ig reactivity using the positive serum (Fig. 3), and the lowest SI values with the negative serum (Fig. 3).
Figure 2.

Cross-reactivity determination by microarray immunoassay between SARS-CoV2–specific Ig and antigens. Specific Ig reactivity (signal intensity) was measured from 2-fold serial printing concentrations of the nucleoprotein (N, 0.2–0.025 mg/mL; on the left of the charts) and receptor-binding domain (RBD, 0.25–0.031 mg/mL; on the right of the charts) by incubating with positive control serum and serial 2-fold dilutions of single antigen detectors. A. Tested N-HRP dilutions: 1:4,000 (light blue), 1:8,000 (orange), 1:16,000 (gray), 1:32,000 (yellow), 1:64,000 (dark blue), 1:128,000 (green). B. Tested RBD-HRP dilutions: 1:250 (light blue), 1:500 (orange), 1:1,000 (gray), 1:2,000 (yellow), 1:4,000 (dark blue), 1:8,000 (green), 1:16,000 (magenta), 1:32,000 (brown).
Figure 3.

Best conjugated antigen detector dilutions and antigen printing concentrations for our microarray immunoassay (MI). Serial 2-fold dilutions of detector cocktail obtained with a mixture of nucleoprotein (N)-HRP and receptor-binding domain (RBD)-HRP were used for assaying the positive (on the left in the charts) and the negative control serum (on the right in the charts) with a microarray containing 2-fold serial antigen printing concentrations (0.2–0.025 mg/mL for N; 0.25–0.031 mg/mL for RBD). Specific Ig reactivity (signal intensity) to N and RBD are shown in A and B, respectively; tested detector cocktail dilutions: 1:16,000 N-HRP, 1:1,000 RBD-HRP (orange); 1:32,000 N-HRP, 1:2,000 RBD-HRP (gray); 1:64,000 N-HRP, 1:4,000 RBD-HRP (yellow); 1:128,000 N-HRP, 1:8,000 RBD-HRP (dark blue); 1:256,000 N-HRP, 1:16,000 RBD-HRP (green); 1:512,000 N-HRP, 1:32,000 RBD-HRP (magenta).
Reproducibility of the MI
Mean SI values of replicate tests for reproducibility were 16,078–19,555, far beyond saturated or very low result values (Table 2). The intra-plate CV for N- and RBD-specific Ig detection was 5.1% and 4.6%, respectively; the inter-plate CV was 7.6% and 10.7% for N and RBD, respectively; the inter-assay CV was 8.9% and 5.7% for N and RBD. CVs were <15%, which is in the acceptable range of published and commercial MIs.2,33
Table 2.
Microarray immunoassay reproducibility expressed as CV (SD as percentage of mean value) for N- and RBD-specific Ig reactivity.
| Intra-plate CV | Inter-plate CV | Inter-assay CV | |
|---|---|---|---|
| N-specific Ig reactivity | 5.1% (17,628 AU) | 7.6% (16,078 AU) | 8.9% (18,490 AU) |
| RBD-specific Ig reactivity | 4.6% (19,555 AU) | 10.7% (17,862 AU) | 5.7% (18,926 AU) |
Mean SI from intra-plate, inter-plate, and inter-assay replicates are shown in parentheses.
AU = arbitrary units; N = nucleoprotein; RBD = receptor-binding domain; SI = signal intensity.
Validation of ELISAs and MI
S:P values of N-specific Ig reactivity from 108 pre-COVID serum samples, categorized as negative, were 3.6 to −0.5 (median 0.9); those for RBD-specific Ig reactivity were 4.1–0.0 (median 0.9). ELISA cutoff values were set as the corresponding highest result plus 2 SD; that is, 5.4 for N-based ELISA, and 5.1 for RBD-based ELISA. SI values for N- and RBD-specific Ig reactivity measured by MI were 1,871–0 AU (median 0 AU) and 693–0 (median 0), respectively. MI cutoff values were set as the highest result plus 1.2 SD. These values were 2,245 AU for N-based MI, and 767 AU for RBD-based MI.
Considering the established cutoff values, our N-based ELISA detected more positive sera (90 of 101; 89% sensitivity; Fig. 4A) than the N-based MI (75 of 101; 74% sensitivity; Fig. 4C) in samples collected from farms 1 and 2, in which positive RT-rtPCR cases were detected (Table 1). However, all of these serum samples were Ig reactive to RBD by MI (101 of 101; Fig. 4D) and ELISA (71 of 71 from farm 1; sera from farm 2 could not be assayed, given the low volume of collected sera; Fig. 4B).
Figure 4.

Sensitivity (Se) and specificity (Sp) values of the double-recognition format ELISAs (DR-ELISAs) and the microarray immunoassay (MI). Dot plot diagrams in which each dot represents an individual sample: results obtained for DR-ELISA based on A. nucleoprotein (N) and B. receptor-binding domain (RBD), and for MI based on C. N and D. RBD. The horizontal solid lines are the cutoff values in each assay. The x-axes show the exposed and non-exposed classification of samples according to RT-rtPCR and time of sampling (pre or post COVID-19 pandemic outbreak). Positive = exposed mink from farms 1 and 2. Negative = non-exposed mink from farms 3, 4, and 5. The y-axes show the sample:positive (S:P) ratio or signal intensity obtained in the DR-ELISA or the MI, respectively.
Results for the ELISAs and MIs with N and RBD antigens were negative from every non-exposed farmed mink, in which viral RNA was not detected by RT-rtPCR (farms 3 and 4) or were collected before 2020 (farm 5). Therefore, both platforms had 100% specificity (Fig. 4).
Discussion
We found that RBD performed better than N when used as the antigenic target in ELISAs and MI, all developed in DR format. The choice of the antigenic marker is of utmost relevance because serosurveys are used to provide valuable information about past infections and outbreak evolution. Our RBD-based ELISA and MI had 100% sensitivity and specificity, discriminating accurately between farmed mink exposed to SARS-CoV2 and non-exposed mink. Similar seroprevalence rates close to 100% have been reported for most infected farms.9,13,23 The occurrence of false negatives using the RBD based on the Wuhan-Hu-1 S protein sequence (NC_045512) for detecting S protein variants can be largely, but not completely, ruled out. Common immunogenic epitopes are shared by the RBDs of variants of concern and Wuhan-Hu-1 SARS-CoV2, and these common epitopes are recognized by human antibodies. 12 Therefore, it is also conceivable that mink sera may recognize common epitopes of variants. Nevertheless, further work is needed to estimate sensitivity regarding previous and future variants. Our N-based assays had lower sensitivity (89% for ELISA and 74% for MI) but 100% specificity in both platforms. Interestingly, our ELISAs targeted to S or RBD performed better than those based on N for feline and canine sera (unpublished data).
The RT-rtPCR positivity rate decreased dramatically in farm 1 over 16 d (from 87% to 1.4%); the only RT-rtPCR– positive sample out of 71 was the one with the lowest Ig reactivity against RBD and negative against N. In experimental settings, antibodies in mink were detected from 14 dpi onwards, 28 although, in ferrets, antibodies could be detected from 8 dpi until at least 36 dpi. 25 Our results agree and suggest that mink quickly develop immunity after infection, and clear the virus or, at least, render it undetectable in mink upper airways. Our RBD-based ELISA could be a useful complementary tool for mink farm surveillance programs, which are currently based on detection of viral RNA by RT-rtPCR.
Acknowledgments
We thank Javier Sarraseca, Francisco Calzado, and Helena Redondo for their work on this project and their technical assistance.
Footnotes
Declaration of conflicting interests: The authors declared no potential conflicts of interest with respect to the research, authorship, and/or publication of this article.
Funding: Fernández-Antonio received no financial support for the research, authorship, and/or publication of this article. The other authors did not receive funding, other than salaries from Eurofins-Ingenasa, which did not influence the preparation or publication of our work. Our work did not receive other external financial support for the research, authorship, and/or publication of this article.
ORCID iDs: Carmen Vela  https://orcid.org/0000-0002-0791-5735
Luis A. Rivas
https://orcid.org/0000-0001-8392-3000
Contributor Information
Jorge Pulido, Departments of R&D, Eurofins-Ingenasa, Madrid, Spain.
Marga García-Durán, Departments of R&D, Eurofins-Ingenasa, Madrid, Spain.
Ricardo Fernández-Antonio, Department of Animal Health, Galician Mink Breeders Association (AGAVI), Santiago de Compostela, Spain.
Carmen Galán, Molecular Diagnostics, Eurofins-Ingenasa, Madrid, Spain.
Lissette López, Departments of R&D, Eurofins-Ingenasa, Madrid, Spain.
Carmen Vela, Departments of R&D, Eurofins-Ingenasa, Madrid, Spain.
Ángel Venteo, Departments of R&D, Eurofins-Ingenasa, Madrid, Spain.
Paloma Rueda, Departments of R&D, Eurofins-Ingenasa, Madrid, Spain.
Luis A. Rivas, Departments of R&D, Eurofins-Ingenasa, Madrid, Spain.
References
- 1. Andersen KG, et al. The proximal origin of SARS-CoV-2. Nat Med 2020;26:450–452. [DOI] [PMC free article] [PubMed] [Google Scholar]
- 2. Bastarache JA, et al. Accuracy and reproducibility of a multiplex immunoassay platform: a validation study. J Immunol Methods 2011;367:33–39. [DOI] [PMC free article] [PubMed] [Google Scholar]
- 3. Boklund A, et al. SARS-CoV-2 in Danish mink farms: course of the epidemic and a descriptive analysis of the outbreaks in 2020. Animals (Basel) 2021;11:164. [DOI] [PMC free article] [PubMed] [Google Scholar]
- 4. Chia WN, et al. Serological differentiation between COVID-19 and SARS infections. Emerg Microbes Infect 2020;9:1497–1505. [DOI] [PMC free article] [PubMed] [Google Scholar]
- 5. Corman VM, et al. Detection of 2019 novel coronavirus (2019-nCoV) by real-time RT-PCR. Euro Surveill 2020;25:2000045. [DOI] [PMC free article] [PubMed] [Google Scholar]
- 6. Dawson ED, et al. Multiplexed, microscale, microarray-based serological assay for antibodies against all human-relevant coronaviruses. J Virol Methods 2021;291:114111. [DOI] [PMC free article] [PubMed] [Google Scholar]
- 7. de Assis RR, et al. Analysis of SARS-CoV-2 antibodies in COVID-19 convalescent blood using a coronavirus antigen microarray. Nat Commun 2021;12:6. [DOI] [PMC free article] [PubMed] [Google Scholar]
- 8. Deng J, et al. Serological survey of SARS-CoV-2 for experimental, domestic, companion and wild animals excludes intermediate hosts of 35 different species of animals. Transbound Emerg Dis 2020;67:1745–1749. [DOI] [PMC free article] [PubMed] [Google Scholar] [Retracted]
- 9. European Centre for Disease Prevention and Control (ECDC). Detection of new SARS-CoV-2 variants related to mink, 12 November 2020. https://www.ecdc.europa.eu/sites/default/files/documents/RRA-SARS-CoV-2-in-mink-12-nov-2020.pdf.
- 10. European Commission. Commission Implementing Decision (2021/788) of 12 May 2021 laying down rules for the monitoring and reporting of infections with SARS-CoV-2 in certain animal species. Off J Eur Commun 2021;L173:6–14. [Google Scholar]
- 11. European Food Safety Authority and European Centre for Disease Prevention and Control; Boklund A, et al. Monitoring of SARS-CoV-2 infection in mustelids. EFSA J 2021;19:e06459. [DOI] [PMC free article] [PubMed] [Google Scholar]
- 12. Halfmann PJ, et al. Potent neutralization of SARS-CoV-2 including variants of concern by vaccines presenting the receptor-binding domain multivalently from nanoscaffolds. Bioeng Transl Med 2021;6:e10253. [DOI] [PMC free article] [PubMed] [Google Scholar]
- 13. Hammer AS, et al. SARS-CoV-2 transmission between mink (Neovison vison) and humans, Denmark. Emerg Infect Dis 2021;27:547–551. [DOI] [PMC free article] [PubMed] [Google Scholar]
- 14. Hobbs EC, Reid TJ. Animals and SARS-CoV-2: species susceptibility and viral transmission in experimental and natural conditions, and the potential implications for community transmission. Transbound Emerg Dis 2021;68:1850–1867. [DOI] [PMC free article] [PubMed] [Google Scholar]
- 15. Hoste ACR, et al. Two serological approaches for detection of antibodies to SARS-CoV-2 in different scenarios: a screening tool and a point-of-care test. Diagn Microbiol Infect Dis 2020;98:115167. [DOI] [PMC free article] [PubMed] [Google Scholar]
- 16. Jiang HW, et al. SARS-CoV-2 proteome microarray for global profiling of COVID-19 specific IgG and IgM responses. Nat Commun 2020;11:3581. [DOI] [PMC free article] [PubMed] [Google Scholar]
- 17. Jo WK, et al. Potential zoonotic sources of SARS-CoV-2 infections. Transbound Emerg Dis 2021;68:1824–1834. [DOI] [PMC free article] [PubMed] [Google Scholar]
- 18. Ministry of Food, Agriculture and Fisheries of Denmark. COVID-19: all mink in Denmark must be culled, 5 November 2020. https://en.fvm.dk/news/news/nyhed/covid-19-all-mink-in-denmark-must-be-culled/.
- 19. Mohit E, et al. A comparative review of immunoassays for COVID-19 detection. Expert Rev Clin Immunol 2021;17:573–599. [DOI] [PubMed] [Google Scholar]
- 20. Molenaar RJ, et al. Clinical and pathological findings in SARS-CoV-2 disease outbreaks in farmed mink (Neovison vison). Vet Pathol 2020;57:653–657. [DOI] [PubMed] [Google Scholar]
- 21. Munnink BBO, et al. Transmission of SARS-CoV-2 on mink farms between humans and mink and back to humans. Science 2021;371:172–177. [DOI] [PMC free article] [PubMed] [Google Scholar]
- 22. Nakane PK, Kawaoi A. Peroxidase-labeled antibody. A new method of conjugation. J Histochem Cytochem 1974;22:1084–1091. [DOI] [PubMed] [Google Scholar]
- 23. Oreshkova N, et al. SARS-CoV-2 infection in farmed minks, the Netherlands, April and May 2020. Euro Surveill 2020;25:2001005. [DOI] [PMC free article] [PubMed] [Google Scholar]
- 24. Premkumar L, et al. The receptor binding domain of the viral spike protein is an immunodominant and highly specific target of antibodies in SARS-CoV-2 patients. Sci Immunol 2020;5:eabc8413. [DOI] [PMC free article] [PubMed] [Google Scholar]
- 25. Ryan KA, et al. Dose-dependent response to infection with SARS-CoV-2 in the ferret model and evidence of protective immunity. Nat Commun 2021;12:81. [DOI] [PMC free article] [PubMed] [Google Scholar]
- 26. Sen SR, et al. Predicting COVID-19 severity with a specific nucleocapsid antibody plus disease risk factor score. mSphere 2021;6:e00203-21. [DOI] [PMC free article] [PubMed] [Google Scholar]
- 27. Shaffaf T, Ghafar-Zadeh E. COVID-19 diagnostic strategies part II: protein-based technologies. Bioengineering (Basel) 2021;8:54. [DOI] [PMC free article] [PubMed] [Google Scholar]
- 28. Shuai L, et al. Replication, pathogenicity, and transmission of SARS-CoV-2 in minks. Natl Sci Rev 2021;8:nwaa291. [DOI] [PMC free article] [PubMed] [Google Scholar]
- 29. Stevanovic V, et al. Seroprevalence of SARS-CoV-2 infection among pet animals in Croatia and potential public health impact. Transbound Emerg Dis 2021;68:1767–1773. [DOI] [PMC free article] [PubMed] [Google Scholar]
- 30. Su Q-D, et al. The biological characteristics of SARS-CoV-2 spike protein Pro330-Leu650. Vaccine 2020;38:5071–5075. [DOI] [PMC free article] [PubMed] [Google Scholar]
- 31. van Tol S, et al. Accurate serology for SARS-CoV-2 and common human coronaviruses using a multiplex approach. Emerg Microbes Infect 2020;9:1965–1973. [DOI] [PMC free article] [PubMed] [Google Scholar]
- 32. Venteo A, et al. A novel double recognition enzyme-linked immunosorbent assay based on the nucleocapsid protein for early detection of European porcine reproductive and respiratory syndrome virus infection. J Virol Methods 2012;181:109–113. [DOI] [PubMed] [Google Scholar]
- 33. Vigh-Conrad KA, et al. A protein allergen microarray detects specific IgE to pollen surface, cytoplasmic, and commercial allergen extracts. PLoS One 2010;5:e10174. [DOI] [PMC free article] [PubMed] [Google Scholar]
- 34. Wajnberg A, et al. Robust neutralizing antibodies to SARS-CoV-2 infection persist for months. Science 2020;370:1227–1230. [DOI] [PMC free article] [PubMed] [Google Scholar]
- 35. Wang C, et al. A novel coronavirus outbreak of global health concern. Comment. Lancet 2020;395:470–473. [DOI] [PMC free article] [PubMed] [Google Scholar]
- 36. Wang H, et al. SARS-CoV-2 proteome microarray for mapping COVID-19 antibody interactions at amino acid resolution. ACS Cent Sci 2020;6:2238–2249. [DOI] [PMC free article] [PubMed] [Google Scholar]
- 37. Wernike K, et al. Multi-species ELISA for the detection of antibodies against SARS-CoV-2 in animals. Transbound Emerg Dis 2021;68:1779–1785. [DOI] [PMC free article] [PubMed] [Google Scholar]
- 38. Williams DL. Time to stop mink farming in the EU. Vet Rec 2020;187:498. [DOI] [PubMed] [Google Scholar]
- 39. Wong SK, et al. A 193-amino acid fragment of the SARS coronavirus S protein efficiently binds angiotensin-converting enzyme 2. J Biol Chem 2004;279:3197–3201. [DOI] [PMC free article] [PubMed] [Google Scholar]
- 40. World Health Organization. Novel Coronavirus (2019-nCoV): situation report-11. 31 January 2020. https://www.who.int/docs/default-source/coronaviruse/situation-reports/20200131-sitrep-11-ncov.pdf?sfvrsn=de7c0f7_4
- 41. Zhang Q, et al. A serological survey of SARS-CoV-2 in cat in Wuhan. Emerg Microbes Infect 2020;9:2013–2019. [DOI] [PMC free article] [PubMed] [Google Scholar]
- 42. Zhang Y-Z, Holmes EC. A genomic perspective on the origin and emergence of SARS-CoV-2. Cell 2020;181:223–227. [DOI] [PMC free article] [PubMed] [Google Scholar]
- 43. Zhou P, et al. A pneumonia outbreak associated with a new coronavirus of probable bat origin. Nature 2020;579:270–273. [DOI] [PMC free article] [PubMed] [Google Scholar]
- 44. Zhu N, et al. A novel coronavirus from patients with pneumonia in China, 2019. N Engl J Med 2020;382:727–733. [DOI] [PMC free article] [PubMed] [Google Scholar]
- 45. Zong Y, et al. Forward-phase and reverse-phase protein microarray. Methods Mol Biol 2007;381:363–374. [DOI] [PubMed] [Google Scholar]