

Abstract
Objectives:
A paucity of information exists to advise medical school applicants who have had to retake the Medical College Admission Test (MCAT) to achieve a competitive score. To better advise repeat test takers from West Virginia and other Appalachian and southern areas, MCAT data from West Virginia applicants were analyzed and compared with national data.
Methods:
In the application cycles of 2017–2020, the following factors were analyzed in relation to medical school acceptance in West Virginia applicants: MCAT scores, the number of test-taking attempts, biology-chemistry-physics-math grade point average, time between test-taking attempts, and academic major. MCAT data from medical school applicants from West Virginia who took the test more than once also were compared with national data.
Results:
Of the total repeat test takers from West Virginia (N = 285) in the study timeframe, 57 (20%) were ultimately accepted into medical school. Factors associated with medical school acceptance were as follows: first MCAT test score (odds ratio [OR] 1.3, 95% confidence level [CL] 1.2–1.4, P < 0.001), change in MCAT test score (OR 1.2, 95% CL 1.1–1.3, P = 0.0015), and biology-chemistry-physics-math grade point average (OR 15.1, 95% CL 4.2–54.8, P < 0.0001). The highest benefit for improved scores occurred between the first and second attempts. The highest point gain occurred when the first MCAT score was in the range of 477 to 487 (<1st–12th percentile); this finding was not found in the national data.
Conclusions:
Although the study was limited to West Virginia medical school applicants, this information could prove useful in advising premedical applicants from other Appalachian and southern US areas.
Keywords: MCAT, Medical College Admission Test, medical education, medical school admissions
The Medical College Admission Test (MCAT) is a standardized examination required for admission by most medical schools in the United States and Canada, measuring higher-order cognitive skills necessary for success in medical school curricula. The MCAT has been reported to predict a variety of local and national student outcomes across all 4 years of medical school.1–11 The total MCAT score is composed of 4 subsection scores, with a range from 472 to 528 (<1st–100th percentile) and a midpoint at 500 with a standard deviation of 10.6.12 At our institution, a successful MCAT score based upon successful advancement to year 2 and completion of the curriculum in 4 years is defined as a total score of ≥500 (≥50th percentile). According to the Association of American Medical Colleges (AAMC), approximately one-third of all MCAT takers sit for the examination more than once.12 In the AAMC guide entitled Using MCAT Data in 2020 Medical Student Selection, national data revealed that retesters across a wide range of scores tended to earn higher total scores on their second attempts.12 The median gain in total score was 2 to 3 points for examinees who tested a second time and whose first-attempt scores ranged from 472 to 517 (<1st–96th percentile). For examinees whose initial scores ranged from 518 to 528 (97th–100th percentile), the median gain was zero points. Although these data are available at the national level, it is not readily available about applicants specifically from West Virginia or surrounding Appalachian and southern US areas. Practicing physicians may find this information useful, as it is common for premedical students to seek counsel from them about the medical school admissions process. In particular, physicians in West Virginia may have ample opportunity to mentor premedical students; West Virginia is home to two allopathic and one osteopathic medical school, and West Virginia is listed as the top state in the country with the most medical students per capita (89.2/100,000).13
The purpose of this study was to compare MCAT data from repeat test takers from West Virginia to the national data12 focusing on demographics, number of days between repeat tests, and predictors of MCAT scores and acceptance to medical school. Although the study was limited to West Virginia medical school applicants, this information could prove useful in advising premedical applicants from other Appalachian and southern US areas.
Methods
After approval of the West Virginia University School of Medicine (WVU SoM) institutional research board, MCAT scores of applicants from WV who applied to WVU SoM from the 2017–2020 application cycles were deidentified from the CollegeNet applicant portal. The data were exported to Excel (Microsoft, Redmond, WA) and organized by MCAT scores, sex, number of test-taking attempts, undergraduate biology-chemistry-physics-math grade point average (BCPM GPA), length of time between test-taking attempts, and academic major of BCPM or non-BCMP major. Data about the medical school’s Committee on Admissions decision for acceptance or rejection for each applicant also were included.
Data Analysis
All of the analyses were conducted using SAS 9.4 (SAS Institute, Cary, NC). Categorical data were described using valid percentages and frequencies, and continuous data were described using means and standard deviations. Bivariate analysis between admission and all other study variables included Wilcoxon exact tests, t tests, and χ2 tests as appropriate for the outcome type. Across time, correlations were conducted with Pearson correlations.
Linear mixed models with random effects for intercept and time were used to examine changes in scores over time, with Kenward-Rogers correction to the degree of freedom and the restricted maximum likelihood estimation. Logistic regression with maximum likelihood estimation was used for modeling admission with multiple predictors available on all participants, and exponentiated estimates were presented as odds ratios (ORs) with the 95% Wald confidence level (CL). An asterisk denotes an interaction term that multiplies one variable with another to determine an effect, for example, in determining the effect between acceptance and MCAT attempts (accepted * MCAT attempts), and (BCPM GPA * sex). Alpha was set to 0.05, unless otherwise specified.
Consistent with methodology used by the AAMC 2019 Using MCAT Data in 2020 Medical Student Selection in comparing scores,12 deciles were calculated for the sample for the first MCAT attempt (Fig.). Decile analysis in this sample size of 285 would be approximately 28.5 applicants in a decile totaling 10 groups. For the decile analysis, the top decile was compared against all of the other deciles using logistic regression analysis. Unadjusted ORs were presented, followed by adjusted ORs, with sex, BCPM major, BCPM GPA, and total days between first and second attempt included as covariates.
Fig.
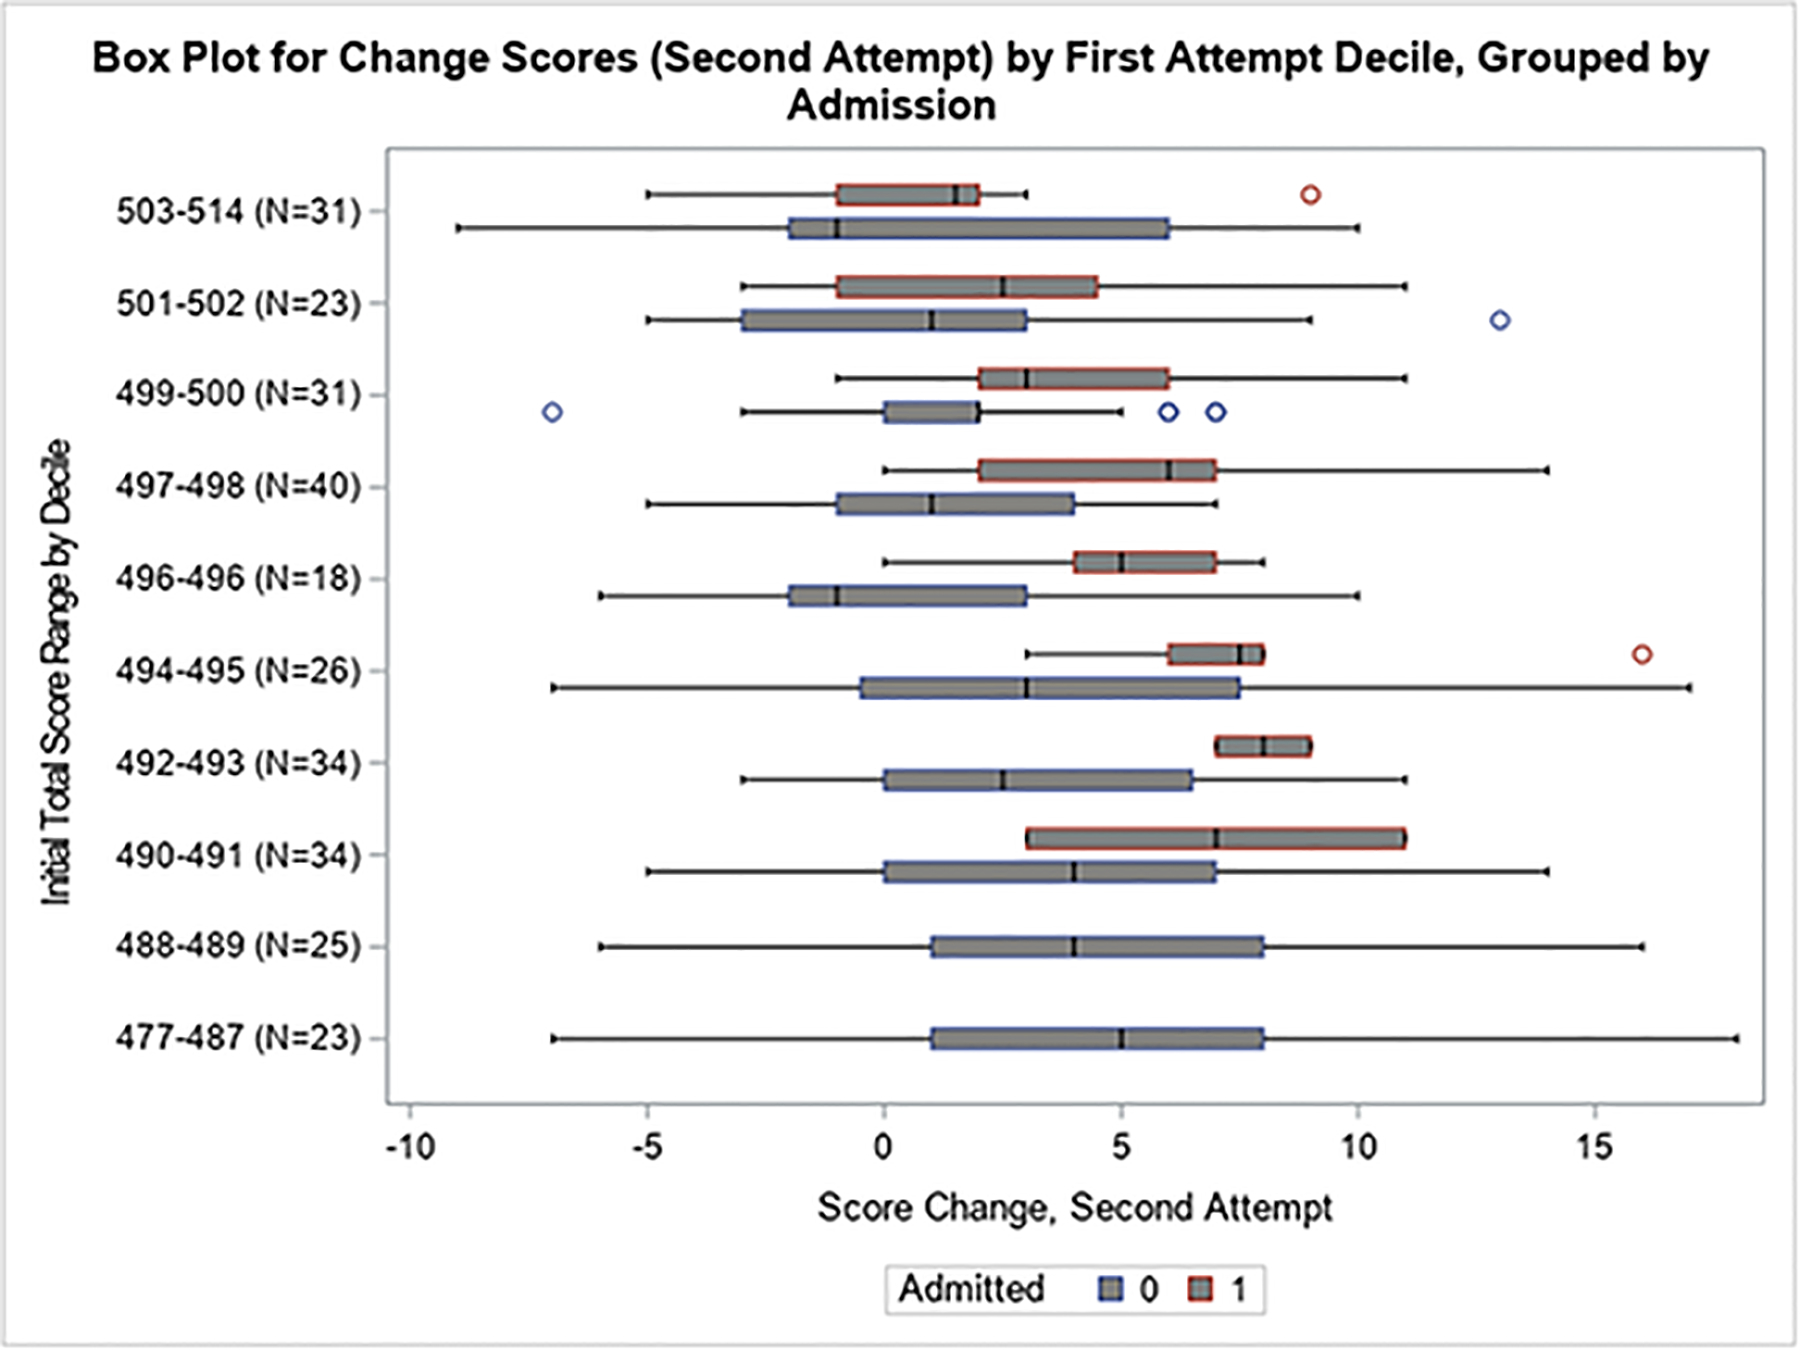
Decile group based on initial test scores in conjunction with change in score to the second attempt, separated by medical school admission.
Results
Demographic, Acceptance, and Days between Attempts
In the 2017–2020 medical school application cycles, there were 285 of 842 applicants from West Virginia who had taken the MCAT more than once. All 285 applicants took the MCAT at least twice, 65 (22.8%) took it 3 times, 10 (3.5%) took it 4 times, and 3 (1%) took it 5 times. Of the repeat test takers, 154 (54%) applicants were able to obtain a total MCAT of ≥500, and 57 (20%) were ultimately accepted into medical school.
Table 1 presents the demographic and medical school admission data of all 285 applicants and whether they gained subsequent acceptance. The accepted student MCAT retakers had significantly higher BPCM GPAs and MCAT scores at attempts 1, 2, and 3 (Table 1). Between nonaccepted and accepted applicants, differences occurred with respect to BCPM GPA (3.3 ± 0.5 for nonaccepted vs 3.7 ± 0.3 for accepted, P < 0.0001), in mean MCAT score 1 (494.1 ± 5.9 for nonaccepted vs 499.7 ± 4.9 for accepted, P < 0.0001), mean MCAT score 2 (496.8 ± 6.5 for nonaccepted vs 503.8 ± 4.4 for accepted, P = 0.0003), mean MCAT score 3 (495.9 ± 6.6 for nonaccepted vs 504.1 ± 3.7 for accepted, P = 0.002), and mean MCAT score change between test 1 and test 2 (2.8 ± 4.7 for nonaccepted vs 4.1 ± 4.4 for accepted, P = 0.046). The accepted student MCAT score range at attempts 1, 2, and 3 were 491 to 514 (20th–90th percentile), 494 to 514 (28th–90th percentile), and 494 to 514 (28th–90th percentile), respectively.
Table 1.
Descriptive statistics table for repeat MCAT takers from WV and described by admitted and nonadmitted
| Total, N = 285 | Nonadmitted, n = 228 | Admitted, n = 57 | P | |
|---|---|---|---|---|
| Sex (%) | 285 (100) | 228 (80) | 57 (20) | 0.81 |
| Male | 124 (43.5) | 100 (43.9) | 24 (42.1) | |
| Female | 161 (56.5) | 128 (56.1) | 33 (57.9) | |
| BCPM major, yes (%) | 231 (81.1) | 184 (80.7) | 47 (82.5) | 0.76 |
| BCPM GPA | 3.4 ± 0.45 | 3.3 ± 0.5 | 3.7 ± 0.3 | <0.0001 |
| MCAT score | ||||
| 1 (n = 285) | 495.2 ± 6.1 | 494.1 ± 5.9 | 499.7 ± 4.9 | <0.0001 |
| 2 (n = 285) | 498.2 ± 6.7 | 496.8 ± 6.5 | 503.8 ± 4.4 | <0.0003 |
| 3 (n = 65) | 496.8 ± 6.8 | 495.9 ± 6.6 | 504.1 ± 3.7 | 0.002 |
| 4 (n = 10) | 496.9 ± 8.2 | 496.9 ± 8.3 | ||
| 5 (n = 3) | 492.7 ± 9.5 | 492.7 ± 9.6 | ||
| Mean MCAT score change | ||||
| Test 1 and test 2 | 3.1 ± 4.7 | 2.8 ± 4.7 | 4.1 ± 4.4 | 0.046 |
| Test 2 and test 3 | 3.2 ± 4.7 | 2.8 ± 4.6 | 6.3 ± 4.2 | 0.06 |
| Test 3 and test 4 | 2.4 ± 4.5 | 2.4 ± 4.6 | ||
| Test 4 and test 5 | 3.7 ± 7.6 | 3.7 ± 7.7 | ||
| Days between MCAT tests | ||||
| Test 1 and test 2 | 245.3 ± 201.6 | 249.7 ± 200.1 | 227.6 ± 210.1 | 0.46 |
| Test 2 and test 3 | 315.5 ± 195.6 | 304.8 ± 183.1 | 404.3 ± 283.1 | 0.21 |
| Test 3 and test 4 | 217.7 ± 119.3 | 217.7 ± 119.4 | ||
| Test 4 and test 5 | 298.1 ± 56.7 | 298.1 ± 56.8 |
BCPM, biology-chemistry-physics-math; GPA, grade point average; MCAT, Medical College Admission Test; WV, West Virginia.
No differences were noted with respect to sex (P = 0.81), BCPM major (P = 0.76), or days between MCAT tests (Table 1). The number of days between MCAT test retakes increased the change score positively (P = 0.0003), but with only modest correlation (r = 0.21). Students who retook the test tended to receive similar scores to the initial attempt (r-attempt 1, 2 = 0.74), and scores tended to be more similar with increasing attempts (e.g., r-attempt 1, 3 = 0.70, r-attempt 1, 4 = 0.89, r-attempt 1, 5 = 0.99) and all with P < 0.0001.
Predictors of MCAT Scores across All Time Points
Acceptance (P = 0.03), MCAT attempts (P < 0.0001), accepted * MCAT attempts (P = 0.006), days between MCAT tests (P < 0.0001), sex (P = 0.0017), and BCPM GPA * sex (P = 0.009) were found to be significant variables in the prediction of MCAT scores. Accepted candidates scored on average 2.6 points higher than their nonaccepted colleagues (P = 0.03), and increasing attempts increased scores an average of 1.7 points (P < 0.0001). Those applicants who were accepted and took the MCAT more than once increased their scores an additional 1.6 points above those who eventually were not accepted (P = 0.006). Each day between testing modestly increased the score by 0.004 points (P < 0.0001). In comparing all of the test takers, women tended to have substantially lower scores than men (−14.62 points, P = 0.002); however, women who had higher BCPM GPAs tended to have higher MCAT scores by 3.6 points compared with men (P = 0.009).
Predictors of Acceptance, Controlling for Baseline Scores
Significant predictors of acceptance included first MCAT test score (OR 1.3, 95% CL 1.2–1.4, P < 0.0001), change in MCAT test score 1 and 2 (OR 1.2, 95% CL 1.1–1.3, P = 0.0015), and higher BCPM GPA (OR 15.1, 95% CL 4.2–54.8, P < 0.0001).
MCAT Decile Analysis
Baseline scores were examined by decile groups (Fig.). Total MCAT scores ranged from 477 to 514 (1st–90th percentile) and were separated into the 10 decile groups. Regarding decile groups between accepted and nonaccepted applicants (Fig.), applicants who had an MCAT score <488 (14th percentile) were not accepted into medical school despite retaking the test. Furthermore, applicants having a baseline MCAT score <494 (28th percentile) substantially decreased their odds of being accepted. Applicants whose first MCAT score was from 494 to 500 (28th–50th percentile) were required to post a significant score improvement for acceptance (Fig.). Because there were no acceptances offered in the lowest 2 deciles of MCAT scores of 477 to 487 (1st–12th percentile) and 488 to 489 (14th–16th percentile), unadjusted and adjusted odds of acceptance using logistic regression for only the top 8 deciles are presented in Table 2. Relative to the highest decile group (MCAT scores 503–514, 58th–90th percentile), the lowest odds of acceptance occurred with an MCAT score ≤496 (34th percentile). Although no applicants with a first-time MCAT score in the 477 to 487 decile group (<1st–12th percentile) were accepted, some of the applicants in that group did increase their scores by nearly 20 points (Fig.).
Table 2.
Unadjusted and adjusted odds of admission using logistic regression by top 8 deciles
| Decile | OR | 95% OR CL lower | 95% OR CL upper | Wald unadjusted P | Adjusted* ORa | 95% aOR CL lower | 95% aOR CL upper | Wald adjusted P |
|---|---|---|---|---|---|---|---|---|
| 1. 503–514 (n = 31) | — | |||||||
| 2. 501–502 (n = 23) | 0.65 | 0.21 | 1.95 | 0.11 | 0.50 | 0.14 | 1.73 | 0.30 |
| 3. 499–500 (n = 31) | 0.50 | 0.17 | 1.40 | 0.30 | 0.51 | 0.15 | 1.67 | 0.23 |
| 4. 497–498 (n = 40) | 0.46 | 0.17 | 1.23 | 0.37 | 0.41 | 0.13 | 1.28 | 0.44 |
| 5. 496 (n = 18) | 0.36 | 0.11 | 1.12 | 0.48 | 0.35 | 0.08 | 1.31 | 0.81 |
| 6. 494–495 (n = 26) | 0.36 | 0.11 | 1.12 | 0.83 | 0.33 | 0.08 | 1.24 | 0.90 |
| 7. 492–493 (n = 34) | 0.08 | 0.01 | 0.31 | 0.03 | 0.07 | 0.01 | 0.34 | 0.03 |
| 8. 490–491 (n = 34) | 0.08 | 0.01 | 0.31 | 0.03 | 0.09 | 0.01 | 0.44 | 0.08 |
N = 237, with 57 admitted and 180 not admitted but scoring >489 on initial test. Bottom 2 deciles (scores 477–489) were excluded as there were no admits for those deciles. BCPM, biology-chemistry-physics-math; CL, confidence level; GPA, grade point average; OR, odds ratio.
Adjusted for sex, BCPM GPA, BCPM major, and total days between first and second attempt.
Discussion
Medical schools are responsible for admitting students who possess both academic and nonacademic competencies necessary for successful completion of the curriculum to become a physician.11,14–16 Admissions committees seek to admit the most accomplished students whose qualities align readily with their school’s mission.11 Medical schools commonly adopt a two-stage admissions process that includes a holistic review of applications (looking for balance in applicants’ experiences, attributes, and academic metrics), followed by invitations to interview for a select group of students.11,15 Academic metrics include academic performance indicators such as undergraduate BCPM GPAs and MCAT scores.11,15,17 Our study focused solely on the academic metrics part of holistic review. Holistic review was not intended to replace or abandon academic metrics: instead, it was meant to place these metrics “in the broader context of the applicant’s life experiences, with a particular focus on adversities overcome, challenges faced, advantages and opportunities encountered, and the applicant’s demonstrated resilience in the face of these difficult circumstances.”11,16
Our data revealed that those applicants with first attempt scores in the top decile (503–514, 58th–90th percentile) were less able to improve their subsequent score (Fig.); this finding may indicate that having a higher MCAT score correlates with medical school acceptance and the need not to improve one’s score significantly. We also found that applicants who had an MCAT score <488 (14th percentile) were not accepted into medical school, and those applicants having a baseline MCAT score <494 (28th percentile) had a substantially decreased odds of being accepted relative to having a score of 502 (54th percentile). Applicants whose first MCAT score was from 494 to 500 (28th–50th percentile) were required to post a significant score improvement for acceptance (Fig.).
In contrast to national data, our analyses of data from West Virginia test takers indicated that the largest possible increase in MCAT score on a second attempt occurred when the first score was in the lowest decile of 477 to 487 (1st–12th percentile). Premedical advisors can use this finding to encourage test takers with such an exceedingly low score on first attempt that large improvement is possible, as some of these applicants may represent individuals who received no guidance on how to prepare for the MCAT or prepared minimally. These ill-prepared applicants may be well served by premedical advisors who can intervene and recommend effective preparation strategies before the second MCAT attempt.
The AAMC guide suggested that average score gains on the second MCAT attempt are greater when the time between the first and second attempt is greater and that completion of a postbaccalaureate program or other coursework can help explain gains in applicants’ scores over time; we did not find this to be the case in our analysis.12 Having longer periods of time between test-taking attempts in our cohort was associated with improved scores, but it did not guarantee that the students obtained a desirable score and subsequent medical school acceptance. The three strongest predictors for acceptance to our allopathic medical school were a higher initial MCAT score, a higher increase from initial test score to second test, and a higher BCPM GPA. Mitchell18 conducted a systematic review of previous studies about traditional predictors of performance in medical school and noted that the undergraduate GPA most often included substantial coursework in BCPM, in which nonscience GPA was often judged as having less importance.19 Although undergraduate GPA is considered an important component of the initial application review and is associated with medical school performance, it is nonstandardized among institutions and comprises different majors and coursework.2,6,11,20 Busche et al found that consideration of both MCAT scores and GPAs provided better prediction of students’ first year performance than using either metric alone.6 Dunleavy et al also found that both MCAT scores and GPAs total scores were strong predictors of academic performance and medical school graduation in the 119 medical schools in their study, and this relation generalized across all medical schools.2 Furthermore, Dunleavy and colleagues noted that MCAT scores were better predictors of unimpeded progress in medical school than GPAs alone, likely because the content of the MCAT is more closely aligned with content in the US Medical Licensing Examination than material graded in undergraduate education.2 GPAs arise from multiple areas of study and are influenced by other factors besides academic knowledge and skill (e.g., study habits).2 Dunleavy et al noticed, however, that medical students were more likely to experience unimpeded progress in medical school if they had higher undergraduate GPAs, and this effect is stronger for lower MCAT total scores than for higher MCAT total scores.2 In our study, we also found that MCAT scores and BCPM GPAs were predictive for repeat MCAT test takers accepted into medical school. Although the BCPM major is important for acceptance into medical school, it is less important in repeat MCAT test takers (P = 0.76). Conversely, the BCPM GPA is highly significant in repeat test takers (P < 0.0001) despite the variability in the confidence limit (4–54), as the OR is well above 1 (OR >15).
Successful medical school admission is dependent on other factors not addressed in our study such as competency in areas including interpersonal and intrapersonal skills, critical thinking and reasoning.19,21 In-person or virtual interviews are used to assess applicants’ nonacademic characteristics as advocated by the AAMC’s Advancing Holistic Review Initiative11,14,16 Applicant interview performance plays a major role in final admissions decisions.11,15,17 Terregino et al found that exclusive reliance on interview scores, after minimum academic criteria are met, may promote cultural and racial diversity among the accepted applicant pool.22 Institutions must determine their floor values of MCAT scores that are associated with academic success in their particular curriculum. Our institution has determined that floor range to be 500 to 506 (50th–68th percentile) based upon past student performance. The medical literature includes data from the old (in place from 1991 to January 2015) and new (in place from April 2015 to present) MCAT that provide evidence that medical students with MCAT scores in the middle of the score scale perform at similarly high levels as students with scores in the upper third of the scale.22
The limitations of our study must be considered. Our study was limited to data from one medical school and from applicants from one state and may not be generalizable. Also, not all factors associated with the admission process were considered because medical schools have differing goals, missions, and different standards for academic performance. A limitation of the MCAT is that it is not designed to predict the entire domain of medical student or physician performance.2
Conclusions
Physicians and other professionals who serve as premedical advisors are encouraged to share our findings with potential medical school applicants. In our study, having a BCPM major, a higher initial BCPM GPA, a higher initial MCAT score, and a higher positive change between test 1 and 2 were predictive of medical school acceptance. Despite retaking the MCAT, applicants with an initial MCAT score <488 (14th percentile) were not ultimately accepted to our allopathic medical school, and those with an initial MCAT score <494 (28th percentile) had substantially decreased odds for acceptance. Applicants whose first MCAT score ranged from 494 to 500 (28th–50th percentile) were required to post a significant score improvement to achieve ultimate acceptance. There was no benefit in taking the MCAT >3 times, with the highest benefit occurring between test 1 and 2. Lastly, although no applicants with MCAT scores in the 477 to 488 decile group (1st–14th percentile) were accepted, premedical advisors can provide encouragement to those students who earn an MCAT score in the lowest decile at first attempt that a large improvement in scores for the second attempt to reach a total score of at least 500 is possible.
Key Points.
No benefit was found in taking the Medical College Admission Test more than three times.
The highest benefit for improved scores occurred between the first and second attempts.
The highest point gain occurred when the first Medical College Admission Test score was in the range of 477 to 487; this finding was not found in the national data.
Acknowledgment
The authors thank Mason Blacker for his participation in data collection.
The research reported in this publication was supported by the National Institute of General Medical Sciences of the National Institutes of Health under award no. 2U54GM104942-02. The content is solely the responsibility of the authors and does not necessarily represent the official views of the National Institutes of Health.
Footnotes
The authors did not report any financial relationships or conflicts of interest.
References
- 1.Julian ER. Validity of the Medical College Admission Test for predicting medical school performance. Acad Med 2005;80:910–917. [DOI] [PubMed] [Google Scholar]
- 2.Dunleavy DM, Kroopnick MH, Dowd KW, et al. The predictive validity of the MCAT exam in relation to academic performance through medical school: a national cohort study of 2001–2004 matriculants. Acad Med 2013;88:666–671. [DOI] [PubMed] [Google Scholar]
- 3.Callahan CA, Hojat M, Veloski J, et al. The predictive validity of three versions of the MCAT in relation to performance in medical school, residency, and licensing examinations: a longitudinal study of 36 classes of Jefferson Medical College. Acad Med 2010;85:980–987. [DOI] [PubMed] [Google Scholar]
- 4.Donnon T, Paolucci EO, Violato C. The predictive validity of the MCAT for medical school performance and medical board licensing examinations: a meta-analysis of the published research. Acad Med 2007;82:100–106. [DOI] [PubMed] [Google Scholar]
- 5.Searcy CA, Dowd KW, Hughes MG, et al. Association of MCAT scores obtained with standard vs extra administration time with medical school admission, medical student performance, and time to graduation. JAMA 2015;313:2253–2262. [DOI] [PubMed] [Google Scholar]
- 6.Busche K, Elks ML, Hanson JT, et al. The validity of scores from the new MCAT exam in predicting student performance: results from a multisite study. Acad Med 2020;95:387–395. [DOI] [PubMed] [Google Scholar]
- 7.Jones RF, Vanyur S. MCAT scores and student progress in medical school. J Med Educ 1984;59:527–531. [DOI] [PubMed] [Google Scholar]
- 8.Huff KL, Fang D. When are students most at risk of encountering academic difficulty? A study of the 1992 matriculants to U.S. medical schools. Acad Med 1999;74:454–460. [DOI] [PubMed] [Google Scholar]
- 9.Andriole DA, Jeffe DB. Prematriculation variables associated with suboptimal outcomes for the 1994–1999 cohort of US medical school matriculants. JAMA 2010;304:1212–1219. [DOI] [PMC free article] [PubMed] [Google Scholar]
- 10.Violato C, Gauer JL, Violato EM, et al. A study of the validity of the new MCAT exam. Acad Med 2020;95:396–400. [DOI] [PubMed] [Google Scholar]
- 11.Gay SE, Santen SA, Mangrulkar RS, et al. The influence of MCAT and GPA preadmission academic metrics on interview scores. Adv Health Sci Educ Theory Pract 2018;23:151–158. [DOI] [PubMed] [Google Scholar]
- 12.Association of American Medical Colleges. Using MCAT® Data in 2020 Medical Student Selection. Washington, DC: Association of American Medical Colleges; 2019. [Google Scholar]
- 13.Association of American Medical Colleges. 2019 State Physician Workforce Data Report. Washington, DC: Association of American Medical Colleges; 2019. [Google Scholar]
- 14.Kirch DG. Transforming admissions: the gateway to medicine. JAMA 2012;308:2250–2251. [DOI] [PubMed] [Google Scholar]
- 15.Monroe A, Quinn E, Samuelson W, et al. An overview of the medical school admission process and use of applicant data in decision making: what has changed since the 1980s? Acad Med 2013;88:672–681. [DOI] [PubMed] [Google Scholar]
- 16.Witzburg RA, Sondheimer HM. Holistic review—shaping the medical profession one applicant at a time. N Engl J Med 2013;368:1565–1567. [DOI] [PubMed] [Google Scholar]
- 17.Association of American Medical Colleges. Medical school admissions: more than grades and test scores. Anal Brief 2011;11:1–2. [Google Scholar]
- 18.Mitchell KJ. Traditional predictors of performance in medical school. Acad Med 1990;65:149–158. [DOI] [PubMed] [Google Scholar]
- 19.Ganjoo R, Schwartz L, Boss M, et al. Predictors of success on the MCAT among post-baccalaureate pre-medicine students. Heliyon 2020;15;6:e03778. [DOI] [PMC free article] [PubMed] [Google Scholar]
- 20.Kreiter CD, Kreiter Y. A validity generalization perspective on the ability of undergraduate GPA and the medical college admission test to predict important outcomes. Teach Learn Med 2007;19:95–100. [DOI] [PubMed] [Google Scholar]
- 21.Association of American Medical Colleges. Core competencies for entering medical students. https://www.aamc.org/services/admissions-lifecycle/competencies-entering-medical-students. Accessed March 30, 2021.
- 22.Terregino CA, Saguil A, Price-Johnson T, et al. The diversity and success of medical school applicants with scores in the middle third of the MCAT score scale. Acad Med 2020;95:344–350. [DOI] [PubMed] [Google Scholar]