

Abstract
Introduction
Individuals with persistent developmental stuttering display deficits in aligning motor actions to external cues (i.e., sensorimotor synchronization). Diffusion imaging studies point to stuttering-associated differences in dorsal, not ventral, white matter pathways, and in the cerebellar peduncles. Here, we studied microstructural white matter differences between adults who stutter (AWS) and fluent speakers using two complementary approaches to: (a) assess previously reported group differences in white matter diffusivity, and (b) evaluate the relationship between white matter diffusivity and sensorimotor synchronization in each group.
Methods
Participants completed a sensorimotor synchronization task and a diffusion MRI scan. We identified the cerebellar peduncles and major dorsal- and ventral-stream language pathways in each individual and assessed correlations between sensorimotor synchronization and diffusion measures along the tracts.
Results
The results demonstrated group differences in dorsal, not ventral, language tracts, in alignment with prior reports. Specifically, AWS had significantly lower fractional anisotropy (FA) in the left arcuate fasciculus, and significantly higher mean diffusivity (MD) in the bilateral frontal aslant tract compared to fluent speakers, while no significant group difference was detected in the inferior fronto-occipital fasciculus. We also found significant group differences in both FA and MD of the left middle cerebellar peduncle. Comparing patterns of association with sensorimotor synchronization revealed a novel double dissociation: MD within the left inferior cerebellar peduncle was significantly correlated with mean asynchrony in AWS but not in fluent speakers, while FA within the left arcuate fasciculus was significantly correlated with mean asynchrony in fluent speakers, but not in AWS.
Conclusions
Our results support the view that stuttering involves altered connectivity in dorsal tracts and that AWS may rely more heavily on cerebellar tracts to process timing information. Evaluating microstructural associations with sensitive behavioral measures provides a powerful tool for discovering additional functional differences in the underlying connectivity in AWS.
1. Introduction
Persistent developmental stuttering (PDS) is a speech impairment, identified by frequent interruptions in the fluent production of speech, including word and part-word repetitions, sound prolongations, and blockage of speech sounds (Ambrose & Yairi, 1999; Yairi & Ambrose, 2013). Apart from aberrant speech, PDS is also associated with physical concomitants such as facial grimaces and eye-blinks (Conture & Kelly, 1991; Riva-Posse et al., 2008). Clinicians and researchers have long hypothesized that stuttering may arise from a pathology of the motor control system (Alm, 2004; Civier et al., 2010; Dietz et al., 1994; Max et al., 2004; Watkins et al., 2007, 2015; Zimmermann, 1980a, 1980b, 1980c). In line with this perspective, behavioral studies using a sensorimotor synchronization paradigm report that individuals who stutter demonstrate an impaired ability to synchronize motor actions with an auditory beat (Falk et al., 2015; Sares et al., 2019). Here, we investigate the neural pathways that are associated with sensorimotor synchronization in adults who stutter (AWS) and fluent speakers.
Sensorimotor synchronization (SMS) is defined as the temporal coordination between a rhythmic motor action and a predictable external event (Repp, 2005; Repp & Su, 2013). A popular paradigm for evaluating SMS in the lab is the finger tapping paradigm. In this paradigm, participants are asked to synchronize their taps to an external beat, such as a metronome (Repp, 2005; Repp & Su, 2013). The basic measure in SMS studies is asynchrony, defined as the time-difference between the tap and the corresponding beat. Participants tend to precede the auditory cue with their tapping, resulting in “negative mean asynchrony” (Aschersleben, 2002). Negative mean asynchrony is often interpreted as evidence for the presence of a predictive mechanism which is necessary for coordinating the movement with the sensory cue (Van der Steen & Keller, 2013).
Deficits in SMS are observed in various speech and language disorders. For example, children with specific language impairments show a consistent pattern of increased negative asynchrony, tapping significantly earlier compared to age-matched fluent speakers and compared to younger language-age matched children (Corriveau & Goswami, 2009). Similarly, children and adolescents who stutter demonstrate increased negative asynchrony, as well as lower consistency (larger standard deviation) when tapping in synchrony with an auditory rhythm compared to age-matched fluent speakers (Falk et al., 2015; Olander et al., 2010). Increased negative asynchrony was also reported in AWS (Max & Yudman, 2003; Sares et al., 2019; van de Vorst & Gracco, 2017). Together, these findings strengthen the idea that a difference in SMS is a consistent feature of disorders affecting speech (Harrington et al., 2004; Iimura et al., 2019; Loucks & De Nil, 2006). However, the specific brain mechanisms which mediate SMS in PDS have yet to be elucidated.
Computational models of SMS typically assume that a forward model of the motor command is necessary in order to anticipate the sensory stimulus and achieve temporal alignment between the movement and the auditory stimulus (Molinari et al., 2007). Maintaining the synchrony between these two types of information further requires an ongoing process of error correction, which depends on a fast, finely-timed calculation of prediction-errors (Repp, 2000, 2001a, 2001b). The computation of sensory prediction errors, especially those that involve precise timing, is attributed to cerebellar mechanisms, suggesting that the cerebellum is a key structure in SMS (Bower, 1997; Ivry, 1997; Ivry & Keele, 1989; Moberget et al., 2008; Wolpert et al., 1998). For example, patients with focal cerebellar lesions have increased variability during rhythmic finger tapping (Ivry et al., 1988), an effect that is even more profound in more severe cases of cerebellar damage (Molinari et al., 2005).
Cerebellar involvement in SMS is also detected in individuals who stutter. A recent imaging study by Frankford et al. (2021) found that paced reading to isochronous tones modulates the functional connectivity between the cerebellum and extra-cerebellar regions among AWS. The cerebellum is structurally connected to the rest of the neural system via three major white matter pathways: the superior, middle, and inferior cerebellar peduncles. FA within these pathways appears to be associated with some of the characteristics of SMS: action timing and error correction (Gomes et al., 2021; Jossinger et al., 2020, 2021). Interestingly, significant differences in FA within cerebellar white matter pathways have been reported for AWS compared to fluent speakers (Connally et al., 2014). However, a direct link between the structure of the cerebellar peduncles and SMS in AWS has not been investigated.
Apart from the cerebellum, SMS recruits a distributed cortical network, including the auditory cortex (i.e., the superior temporal gyrus; STG), supplementary motor area (SMA) and the inferior frontal gyrus (IFG) (Repp & Su, 2013; Wiener et al., 2010). It has been hypothesized that the synchronization between an auditory rhythm and a sequence of motor commands relies on long range white matter connections between the motor and the auditory systems (Zatorre et al., 2007). One of these connections is the arcuate fasciculus, a major dorsal pathway transmitting signals between the inferior frontal gyrus (IFG) and the superior temporal gyrus (STG). Indeed, FA within the left arcuate fasciculus is associated with SMS among fluent speakers (Blecher et al., 2016). This finding provides a motivation to examine the association between the microstructural properties of the left arcuate fasciculus and SMS among AWS.
Dorsal pathways connecting the cortical regions within the SMS network were found to be implicated in stuttering, including the arcuate fasciculus and the frontal aslant tract. The arcuate fasciculus consistently shows reduced FA among children and adults who stutter compared to fluent speakers (Chang et al., 2008; Connally et al., 2014; Cykowski et al., 2010; Sommer et al., 2002; Watkins et al., 2008). The frontal aslant tract, which links the IFG with the SMA, shows higher FA in children who stutter (Misaghi et al., 2018), and higher MD in AWS compared to fluent speakers (Kronfeld-Duenias et al., 2016a). In contrast to these dorsal differences, previous white matter studies failed to find significant group differences in ventral pathways of AWS compared with fluent speakers (Kronfeld-Duenias et al., 2016b).
In the current study, we adopted a hypothesis-driven approach to evaluate the association between SMS and specific white matter pathways in AWS and fluent speakers. Our aims were twofold: (1) To test specific hypotheses regarding previously reported group differences between AWS and fluent speakers in the microstructural properties (FA and MD) of dorsal and cerebellar white matter pathways, and (2) To evaluate and compare the pattern of association between SMS and white matter diffusivities in AWS vs. fluent speakers. Participants performed a finger-tapping task to evaluate their synchronization to a metronome beat. They then underwent a diffusion MRI scan, probing the microstructural properties of their white matter pathways. Using AFQ (Yeatman et al., 2012) we automatically identified, in each participant, the bilateral arcuate fasciculus and frontal aslant tract (FAT) dorsally, the bilateral inferior fronto-occipital fasciculus (IFOF), a ventral pathway that served as control, and the bilateral cerebellar peduncles. Then, we extracted the microstructural properties along these pathways in every individual and compared these properties between AWS and fluent speakers. Lastly, we compared AWS and fluent speakers in terms of the association patterns obtained between diffusivity measures and SMS.
1.2. Hypotheses
We tested three specific hypotheses: compared to fluent speakers, AWS would have (1) lower FA in the bilateral arcuate fasciculus, based on Connally et al. (2014); (2) higher MD in the bilateral FAT, based on Kronfeld-Duenias et al., (2016); (3) lower FA in the bilateral cerebellar peduncles, based on Connally et al. (2014). Importantly, we did not expect a significant difference in ventral language pathways, represented here by the bilateral IFOF.
Next, we analyzed the correlations between the microstructural properties of the left arcuate fasciculus and SMS in AWS and fluent speakers, following Blecher et al. (2016). We further conducted an exploratory analysis assessing differential patterns of association, in AWS and fluent speakers, between SMS and the microstructural properties of the cerebellar peduncles. Testing these hypotheses would lead to better understanding of the neural pathways underlying SMS and add to the body of knowledge on the mechanisms of PDS.
2. Methods
2.1. Participants
A total of 28 participants were recruited as a part of a larger study (Sares et al., 2018, 2019, 2020). The study was approved by the McGill Faculty of Medicine Institutional Review Board in accordance with principles expressed in the declaration of Helsinki.
Thirteen participants were assigned to the AWS group (8 females), and 15 fluent speakers were assigned to the control group (10 females) based on self-reported history of stuttering since childhood, or self-report of having no history of stuttering, respectively. In addition, a speech and language pathologist evaluated stuttering severity in each of the participants using the stuttering severity evaluation instrument (SSI-4; Riley, 2009). Music training was assessed using a questionnaire in which participants estimated cumulative hours of music training throughout their lifetime. The distribution of hours of training was skewed to the left, therefore estimates were log-transformed. The groups were matched by age, handedness and music training (all ps>.715, as indicated by the Wilcoxon signed-rank test; see Table 1).
Table 1.
Sample characteristics.a
| AWS (N = 13) |
Fluent speakers (N = 14)b |
p | |
|---|---|---|---|
| Age | 28.77 (10.7) | 29.71 (11.5) | .999 |
| Gender | 8F/5M | 9F/5M | .999 |
| Handedness | 78.9 (19) | 71.1 (36) | .788 |
| Music training (log hours) | 2.5 (1.3) | 2.5 (1.4) | .715 |
| SSI-4 | 17 (11.4) | 4.1 (7.8) | .006 * |
p<.05, Wilcoxon signed-rank test
The table depicts Mean (SD) values for each parameter, except Gender.
One control individual was excluded from the analyses due to excessive head motion. The denoted N specifies the sample size after the exclusion of this subject.
Abbreviations: Adults who stutter (AWS), stuttering severity instrument (SSI), male (M), female (F).
2.2. Sensorimotor synchronization task
Participants took part in an auditory-motor rhythm synchronization task, during which they were asked to produce motor responses in synchrony with a metronome beat. The full description of the task can be found in a previous publication (Sares et al., 2019). In short, the metronome beat consisted of 12 different tempi, with 10–14 clicks per tempo. The inter-beat-interval (IBI) of each tempo ranged from 350 to 700 ms in steps of 25 ms. The participants were asked to respond to the metronome beat by squeezing a small pressure pad held between the index finger and the thumb. The entire procedure was repeated 5–6 times, resulting in a total of 60–72 different tempi presented. The synchronization task lasted about 15 minutes.
Asynchrony was measured as the time difference between the participants’ response and the closest beat. To quantify asynchrony across different tempi, the measure of asynchrony was transformed to phase angle as follows:
Mean asynchrony refers to the average phase angle of each participant throughout the experiment. A negative mean asynchrony indicates that the participant tended to respond before the sound on average, while a positive mean asynchrony indicates that the participant tended to respond after the beat on average.
2.3. MRI data acquisition
MRI scans were conducted on a 3T Siemens Trio MRI scanner at the Montreal Neurological Institute, with a 32-channel head coil. The MRI protocol included standard anatomical and diffusion imaging sequences, as detailed below. Functional MRI scans were also included in the scan protocol but are not reported here.
2.3.1. T1 image acquisition
High-resolution T1-weighted anatomical images were acquired using a magnetization prepared rapid acquisition gradient echo (MPRAGE) protocol (TR=2.30 s, TE=2.98 ms, flip angle=9°, voxel size=1×1×1mm, FOV read=256mm).
2.3.2. Diffusion weighted image acquisition
A standard diffusion MRI (dMRI) protocol was applied by means of a single-shot spin-echo diffusion-weighted echo-planar imaging (DW-EPI) sequence (70 axial slices, 2 mm thick, with no gap; FOV= 244 mm × 244 mm, matrix size = 122 × 122, providing a cubic resolution of 2 × 2 × 2 cubic mm). dMRI data were acquired along 60 non-collinear gradient directions (b = 1000 s/mm2) and 9 reference volumes (b = 0 s/mm2). To minimize head motion, this protocol was divided into three short sequences, each about 3:30–4 min long.
2.4. Imaging data analysis
2.4.1. Software
Data analysis was conducted using Matlab 2012b (The Mathworks, Natick, MA). For data preprocessing, the open sourced ‘mrDiffusion’ package was used (https://github.com/vistalab/vistasoft/tree/master/mrDiffusion). Tract identification and quantification was implemented with the AFQ toolkit (Yeatman et al., 2012).
2.4.2. Data preprocessing
Diffusion MRI data were preprocessed in native space for each individual separately, following a published pipeline (Jossinger et al., 2020; Kronfeld-Duenias et al., 2016a; Yablonski et al., 2018). This pipeline included a rigid transformation of the volume anatomy to the ac-pc plane, motion- and eddy-current correction of DW-EPI data, alignment of DW-EPI data to the volume anatomy with corresponding recalculation of the diffusion directions, resampling and tensor fitting. T1 images were rotated to the ac-pc plane following manual identification of the anterior and posterior commissures. The b0 images were then registered to the T1 image using a rigid body mutual-information maximization algorithm (as implemented in SPM5 (Friston & Ashburner, 2004)). Diffusion weighted images were corrected for eddy-current and head motion distortions by using a 14-parameter constrained non-linear co-registration algorithm based on the expected pattern of eddy-current distortions (Rohde et al., 2004). The combined transform, resulting from both anatomical alignment and eddy-current correction, was applied to the raw diffusion data, and the diffusion data were resampled at 2 × 2 × 2 cubic mm isotropic voxels. Gradient directions were adjusted according to the same transformation (Leemans & Jones, 2009).
Diffusion tensors were fit to the registered diffusion data using a least squares algorithm. Then, using tensor decomposition, we extracted the three eigenvectors and eigenvalues of the tensor, and calculated, in each voxel, fractional anisotropy (FA) and mean diffusivity (MD). FA was calculated as the normalized standard deviation of the eigenvalues. MD was calculated as the average of the three eigenvalues.
2.4.3. Motion analysis
We carried out head-motion analysis along the same protocol reported in Yendiki et al., (2014). In short, we computed three parameters for head motion (in voxels) and three parameters for rotation (in degrees) by registering each volume to the first volume. Then, we averaged the absolute values of each component over all the volumes for a given participant. A single translation component and a single rotation component were calculated for each participant, by averaging over the three parameters for each component. Finally, we compared each component (translation, rotation) between the groups using a t-test.
2.4.4. Automatic tract identification and segmentation
In each individual’s native space, we identified the prominent dorsal and ventral language tracts, and the cerebellar peduncles, bilaterally (Figure 1 and Figure S1). Dorsal tracts included the arcuate fasciculus and the frontal aslant tract (FAT), which have previously shown significant group differences between AWS and fluent speakers (Connally et al., 2014; Kronfeld-Duenias et al., 2016a). Ventral tract included the inferior fronto-occipital fasciculus (IFOF), which did not show significant group differences in previous reports (Kronfeld-Duenias et al., 2016b). Cerebellar peduncles included the superior, middle and inferior cerebellar peduncles (SCP, MCP and ICP, respectively), which have previously shown significantly reduced FA among AWS compared with fluent speakers (Connally et al., 2014). To identify these tracts and quantify their diffusion parameters we used the AFQ package (Yeatman et al., 2012), which consists of the following steps: 1) whole brain fiber tractography, 2) automatic region-of-interest (ROI)-based tract segmentation and cleaning, 3) quantification of diffusion parameters along the tract.
Figure 1. Tracts of interest.
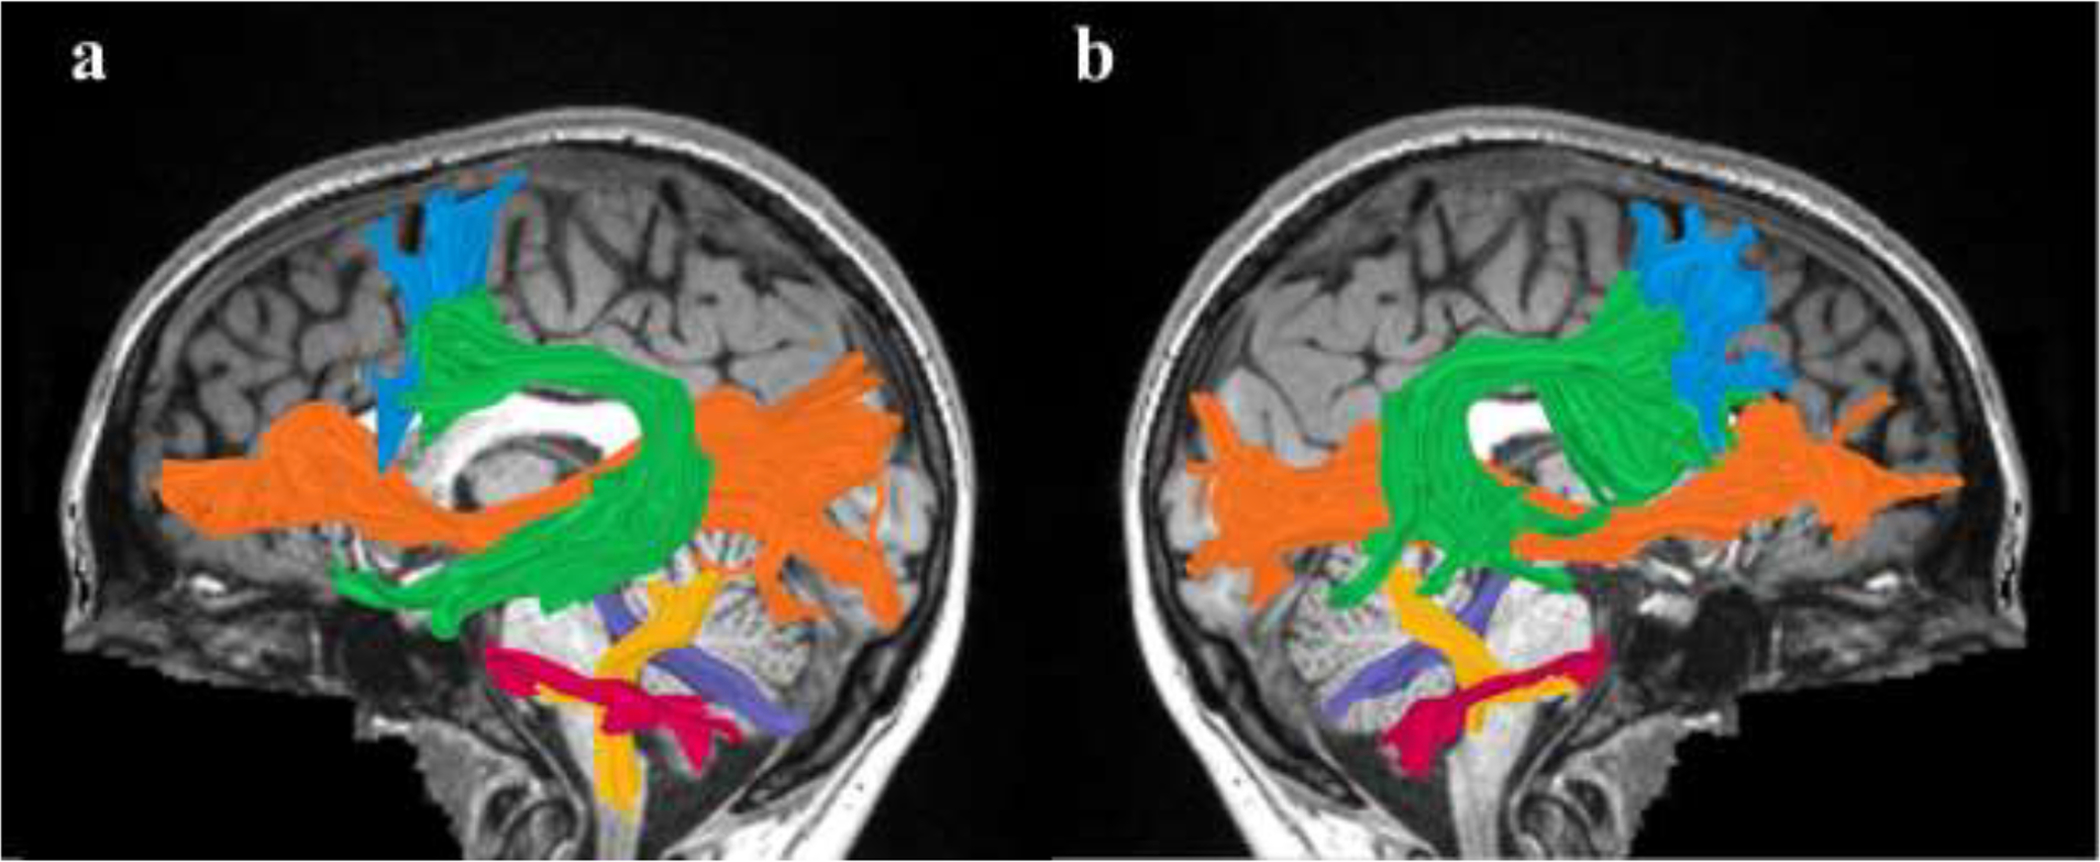
Shown are the left (a) and right (b) tracts of interest identified in a single participant (S43, fluent speaker, female, 19y), overlaid on a midsagittal T1 image of the same individual. The dorsal tracts identified are the arcuate fasciculus (green) and the frontal aslant tract (FAT; light blue). The ventral tract identified is the inferior fronto-occipital fasciculus (IFOF; orange). The cerebellar tracts identified are the superior cerebellar peduncle (SCP; purple), middle cerebellar peduncle (MCP; magenta), and the inferior cerebellar peduncle (ICP; yellow).
A whole-brain fiber group was tracked using a deterministic Streamlines Tractography (STT) algorithm (Basser et al., 2000; Mori et al., 1999) with a fourth-order Runge–Kutta path integration method and 1 mm fixed step size. To segment the tracts, we used a multiple-ROI approach in which the whole-brain fiber group was intersected with predefined ROIs using logical operations (see Figure S2). These ROIs were predefined on a T2 template, and then back-transformed to each participant’s native space (see Bruckert et al., 2019 Figure 3, for the position of the cerebellar ROIs; see Wakana et al., 2007, Figures 6 and 8, for the position of the ROIs of the AF and IFOF; see Kronfeld-Duenias et al., 2016a Figure 1 for the position of the ROIs of the FAT). To separate the MCP to left and right tracts, we defined an additional ROI on the midsagittal plane. The left MCP was segmented by intersecting the whole-brain fiber group with the left ROI and the midsagittal ROI, while excluding fibers going through a third “NOT”-ROI (see Figure S3). The right MCP was segmented similarly using the right ROI instead of the left.
After tract segmentation, an automated cleaning procedure was applied to remove outlier streamlines from each individual’s tract. As the cerebellar pathways are relatively short, different automatic cleaning procedures were applied to the cerebellar and cerebral pathways as follows: Cerebellar fibers were removed if they were longer than 1 standard deviation from the mean fiber length and spatially deviated more than 4 standard deviations from the core of the tract (Bruckert et al., 2019); Cerebral fibers were removed if they were longer than 4 standard deviations from the mean fiber length and spatially deviated more than 5 standard deviations from the core of the tract (Kronfeld-Duenias et al., 2016a; Yeatman et al., 2012). Finally, diffusion properties were calculated at equidistant nodes along the tract (30 nodes for the shorter cerebellar peduncles, and 100 nodes for the AF, FAT and IFOF) (Bruckert et al., 2019; Kronfeld-Duenias et al., 2016a; Yeatman et al., 2012).
2.4.5. Quality assurance
Individual tractograms of each tract in each participant were carefully examined by the first and last author (S.J & M.B-S).
2.5. Statistical analysis
We restricted analyses to tract segments enclosed between the two waypoint-ROIs which were used for tract segmentation. This was done with the goal of eliminating the extreme segments of the tracts which are highly variable between participants. We used non-parametric statistics (i.e., Wilcoxon signed-rank test and Spearman’s correlation) to refrain from assuming that the data is drawn from a predefined probability distribution.
2.5.1. Group differences
FA and MD values were averaged across the tract segment (between the two waypoint ROIs) and compared between groups (we refer to these values as tract-FA and tract-MD, respectively). Group comparisons were conducted by calculating the non-parametric Wilcoxon signed-rank test, controlling the false discovery rate (FDR) at alpha =.05 to correct for multiple comparisons across multiple tracts. Directional hypotheses were tested using a one-tailed statistical test.
Averaging FA and MD across the tract may mask existing group differences, because these values vary considerably along the trajectory of the tract (Yeatman et al., 2012). To gain better sensitivity, we further evaluated local group differences by comparing the local FA and MD values in equidistant nodes along each tract. Along-tract statistics were corrected for multiple comparisons using non-parametric permutation tests, controlling for family-wise error (FWE) at a corrected alpha of .05 (Nichols & Holmes, 2002). Significance was determined if a cluster of nodes satisfied two criteria: 1) Diffusivity values in each node within the cluster showed a group differences at an uncorrected alpha of .05, and 2) The size of the cluster was larger or equal to a critical cluster size determined by a permutation algorithm (Nichols & Holmes, 2002; Yeatman et al., 2012). FWE is used to correct the number of comparisons within a tract, but not between tracts. This analysis is referred to as tract-profile analysis.
2.5.2. Brain-Behavior correlations
Associations between tractometry and performance on the SMS task were assessed by calculating Spearman’s rank-order correlations. First, we assessed the simple correlations between tract-FA and mean asynchrony and between tract-MD and mean asynchrony. In accordance with the analysis described in Blecher et al. (2016), these correlations were calculated along the entire extent of the tract. Correlations with the cerebellar peduncles were corrected for multiple comparisons controlling the false discovery rate (FDR) at alpha =.05.
Second, to gain further sensitivity, we repeated this analysis along the tract, in the cerebellar peduncles and in the AF (see Section 1.2). Corrected significance was calculated using a non-parametric permutation test, controlling the family-wise error (FWE) at alpha=.05 (Nichols & Holmes, 2002; Yeatman et al., 2012), as explained above (see section 2.5.1). One fluent speaker was excluded from all correlation analyses because of an extremely high mean asynchrony score (phase angle = −185 deg, 2.9 SD below the average of the fluent speakers).
2.5.3. Bootstrap analysis
The significance of group differences between correlation coefficients was tested non-parametrically using a bootstrap analysis. To this end, we generated distributions of correlation coefficients by sampling with replacements (N=10,000 times) from the data of each group, and calculating the correlation coefficient for each sample. These distributions were compared visually. Then, we calculated the probability of obtaining the correlation coefficient observed in AWS based on the distribution of correlations of fluent speakers (i.e., the empirical p-value).
3. Results
3.1. Head motion
One control individual was excluded from further analyses due to excessive head motion (translational motion of more than 1 voxel). After excluding this subject, there were no significant group differences in translational and rotational head motion (uncorrected p=.035 for translational head motion failed to reach significance when controlling the FDR 5% for 2 comparisons; p=.182 for rotational head motion, FDR corrected) (see Figure S4).
3.2. Demographic characteristics
The groups did not differ significantly in age, gender, handedness, and music training. As expected, there was a significant group difference in stuttering severity, as measured by the SSI-4 (p=.006). The demographic characteristics of the analyzed sample (N=27) can be found in Table 1.
3.3. Tract identification
Dorsal, ventral and cerebellar pathways were identified individually in each participant’s native space (see Figure 1 and Figure S1). The left arcuate fasciculus and the bilateral IFOF were successfully identified in all participants (N=27). The right arcuate fasciculus was identified in 24 out of 27 participants, excluding one AWS and two control participants. The left and right FAT were successfully identified in 23 out of 27 participants, excluding two participants of each group. One additional right FAT tract of a control participant was excluded based on visual examination of the individual tractograms (see Methods and Figure S5). The bilateral SCP, MCP and ICP were successfully identified in all participants (N=27).
3.4. Hypothesis 1: Reduced FA in the bilateral arcuate fasciculus of AWS
We compared mean tract-FA values in the bilateral arcuate fasciculus of AWS and fluent speakers (Figure 2 and Table S1). This analysis successfully reproduced previously-reported group differences in the left arcuate fasciculus (Connally et al., 2014), showing significantly reduced tract-FA in AWS (p=.014, FDR controlled at 5% for 2 comparisons) (Figure 2b). No significant differences were found in the right arcuate fasciculus (p=.688; Figure 2e). We further compared the FA tract profiles, node-by-node, in 100 equidistant locations along the tract. This analysis revealed that the significant difference between the groups stems from nodes 81–100, in the temporal section of the left arcuate fasciculus (p<.05, FWE corrected for 100 nodes) (Figure 2c). No significant group differences were observed in the profile-analysis within the right arcuate fasciculus (Figure 2f). For completeness, we also compared MD values but found no significant group differences in either the left or right arcuate fasciculi (all ps>.089; Figure S6 and Table S2).
Figure 2. Testing Hypothesis 1: Reduced FA in the bilateral arcuate fasciculus of AWS.
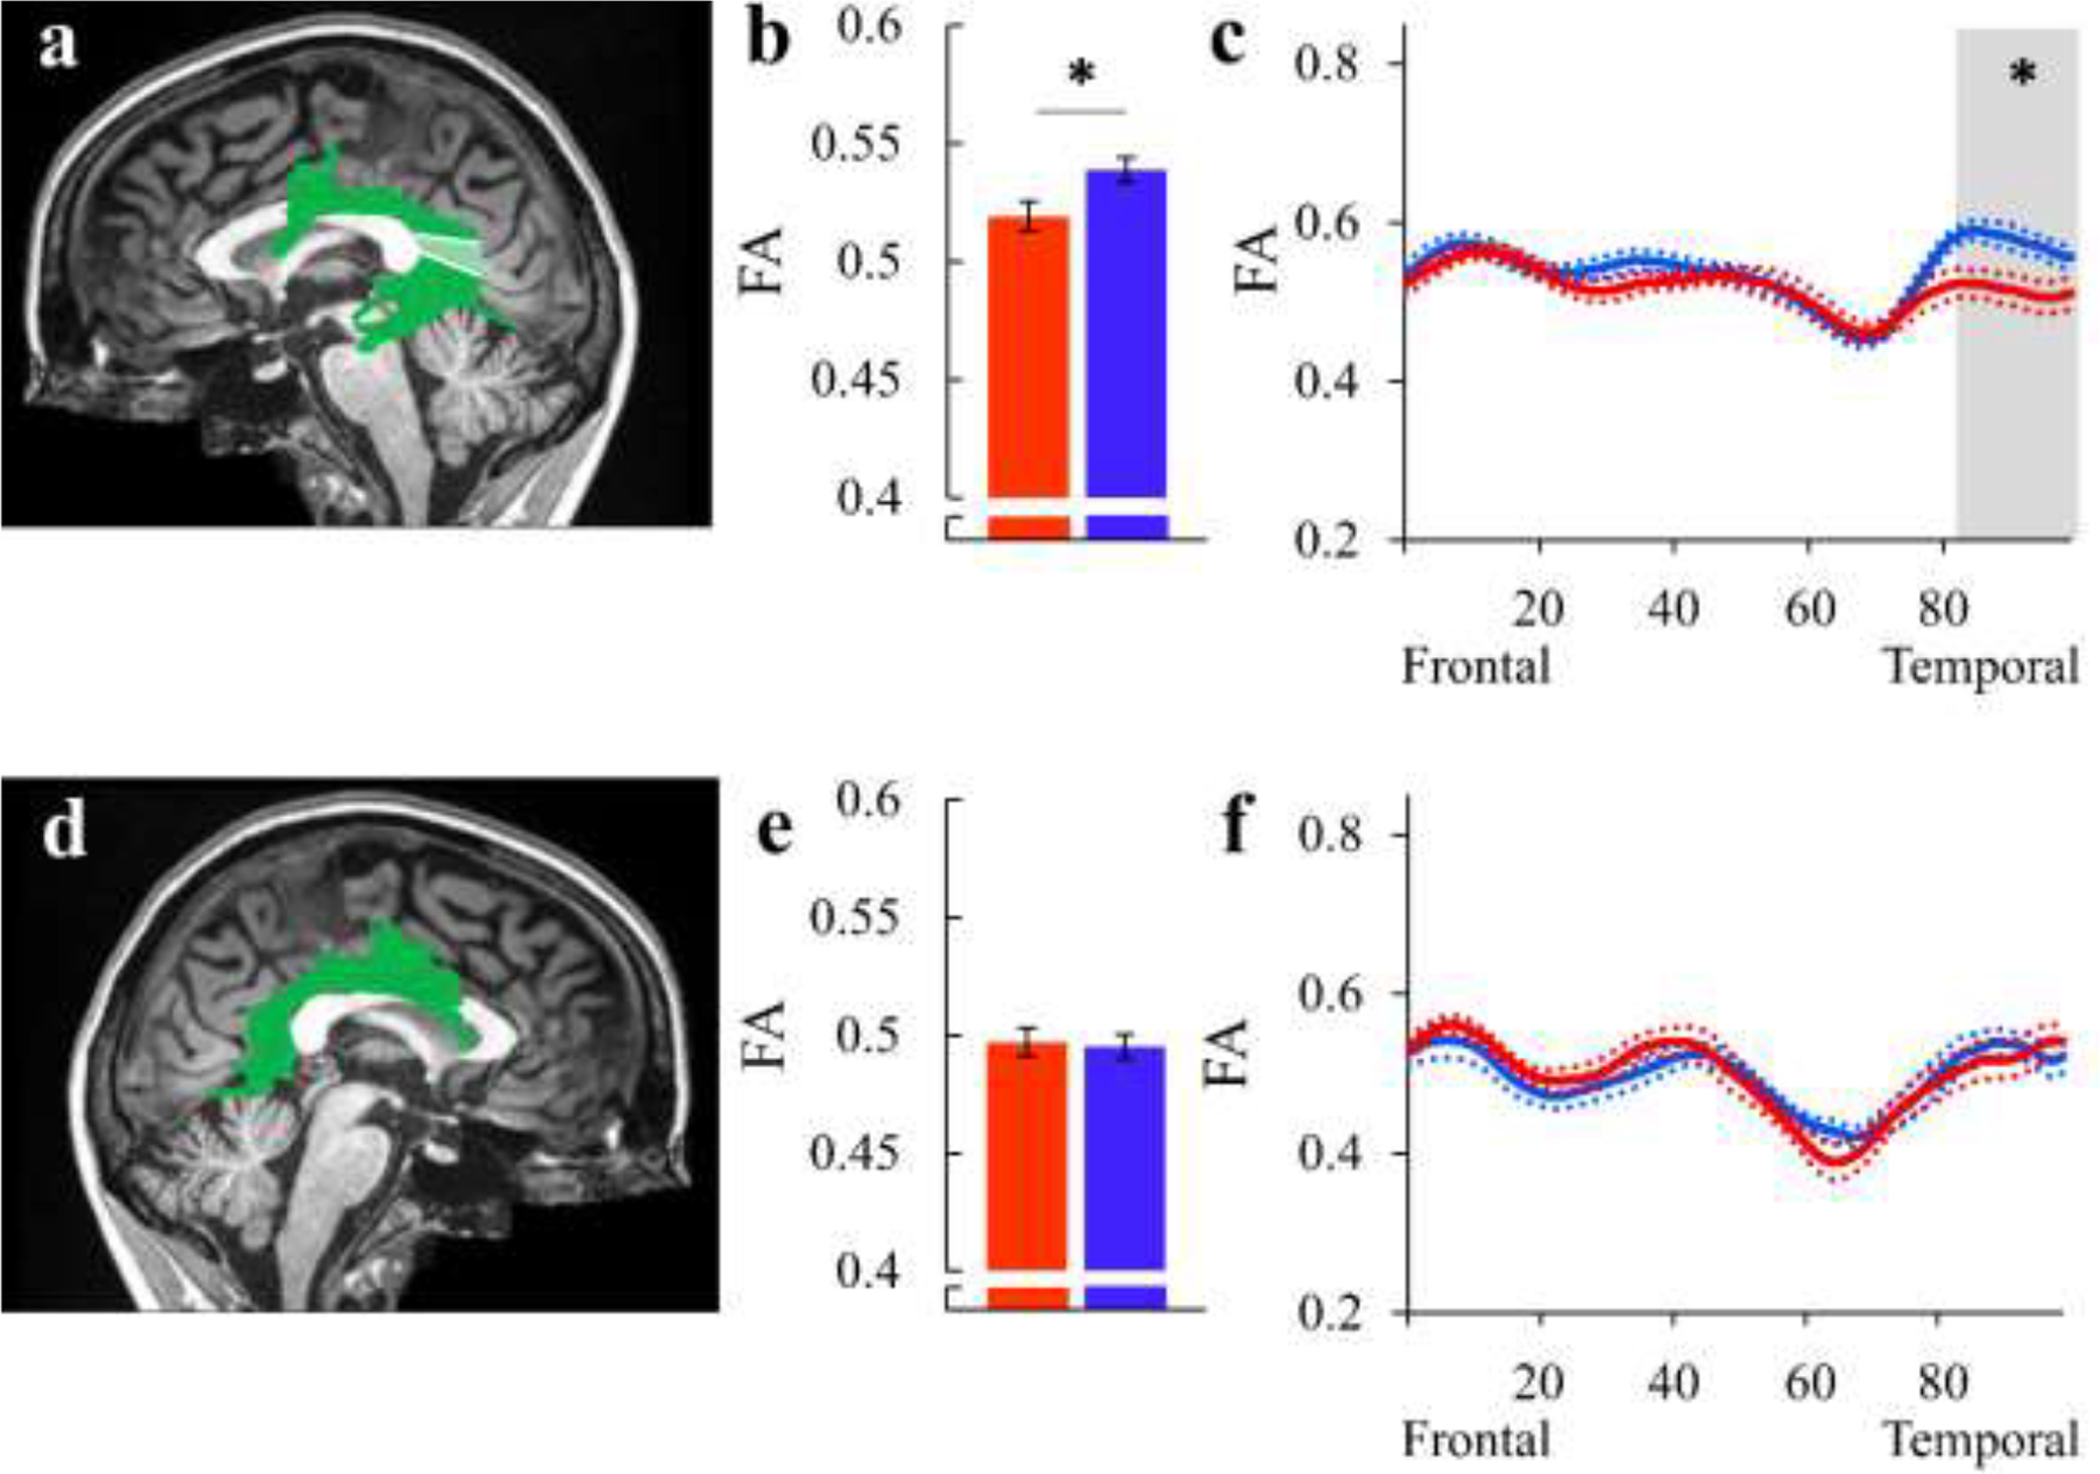
(a, d): The left (a) and right (d) arcuate fasciculi are identified in a single participant (S31, fluent speaker, female, 31y), overlaid on a midsagittal T1 image of the same individual. Shaded region in (a) indicate the location of the significant cluster of nodes. (b, e): Bar graphs show the group average tract-FA of the left (b) and right (e) arcuate fasciculus in AWS (red) and fluent speakers (blue). Error bars denote ±1 standard error of the mean. Asterisk denotes a significant group difference (p=.014, FDR controlled at 5% for 2 comparisons). (c, f): FA profiles along the left arcuate fasciculus (c) and the right arcuate fasciculus (f) are shown in AWS (red) and fluent speakers (blue), with colored dotted lines indicating ±1 standard error of the mean. Asterisk denotes a significant group difference (p<.05, FWE corrected over 100 nodes).
AWS – red, fluent speakers – blue.
3.5. Hypothesis 2: Elevated MD in the bilateral frontal aslant of AWS
We compared mean tract-MD values in the bilateral FAT (Figure 3 and Table S2). This analysis reproduced previously-reported group differences in the left FAT, showing higher tract-MD values in AWS compared to fluent speakers (p=.040, FDR controlled at 5% for 2 comparisons) (Figure 3b) in agreement with Kronfeld-Duenias et al. (2016a). We further compared the MD tract profiles, node-by-node, in 100 equidistant locations along the tract. This analysis revealed an additional significant difference between the groups within the right FAT in nodes 23–40, closer to the IFG (Figure 3f). Specifically, AWS showed higher MD values compared to fluent speakers in this cluster (p<.05, FWE corrected for 100 nodes). No significant group differences were observed in tract-MD of the right FAT (p=.065; Figure 3e and Table S2), nor in the MD profile of the left FAT (Figure 3c). For completeness, we evaluated FA in the FAT of AWS and fluent speakers but found no significant differences (all ps>.975; Figure S7 and Table S1).
Figure 3. Testing Hypothesis 2: Elevated MD in the bilateral frontal aslant tract of AWS.
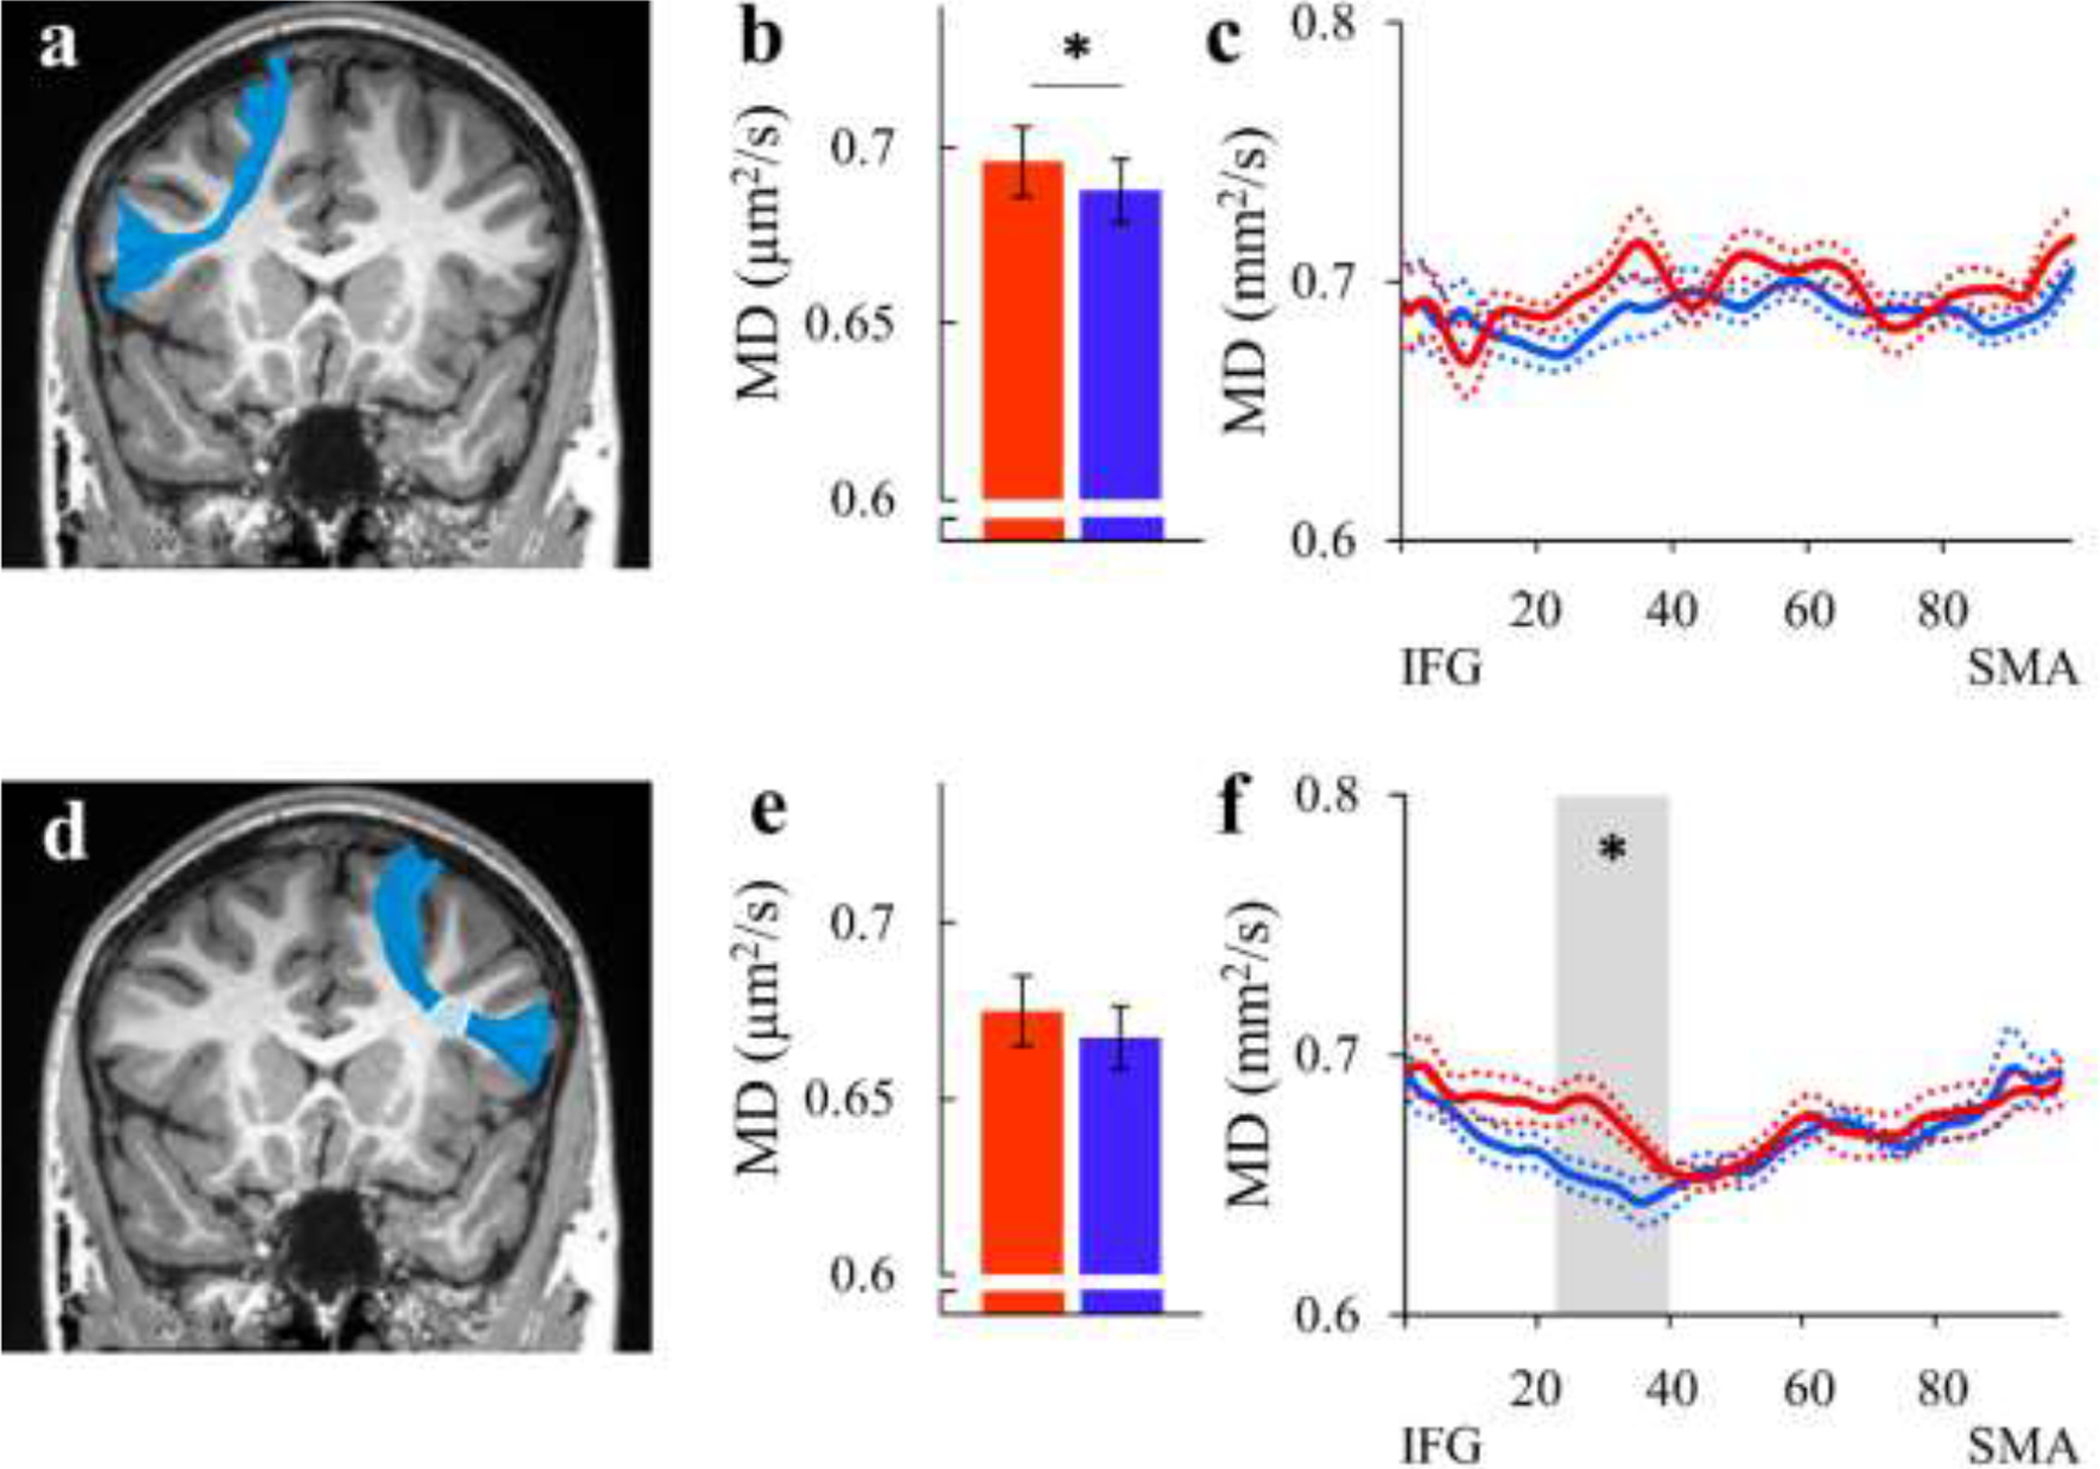
(a, d): The left (a) and right (d) FAT are identified in a single participant (S20, AWS, female, 18y), overlaid on a coronal T1 image of the same individual. Shaded region in (d) indicate the location of the significant cluster of nodes. (b, e): Bar graphs show the group average tract-MD of the left (b) and right (e) FAT in AWS (red) and fluent speakers (blue). Error bars denote ±1 standard error of the mean. Asterisk denotes a significant group difference (p=.04, FDR controlled at 5% for 2 comparisons). (c, f): MD profiles along the left (c) and right (f) FAT are shown in AWS (red) and fluent speakers (blue), with colored dotted lines indicating ±1 standard error of the mean. Asterisk denotes a significant group difference (p<.05, FWE correction over 100 nodes).
AWS – red, fluent speakers – blue.
3.6. Control analysis: No group differences in ventral speech-related tracts
As in previous reports (Kronfeld-Duenias et al., 2016b), no significant group differences were detected in the bilateral IFOF (Figure 4). This includes absence of significant differences when comparing tract-FA (all ps>.452), tract-MD (all ps>.104), FA profiles and MD profiles (p>.05, FWE corrected for 100 nodes) (Figures 4 and S8, and Tables S1 and S2).
Figure 4. Group comparison of the bilateral inferior fronto-occipital fasciculus (IFOF).
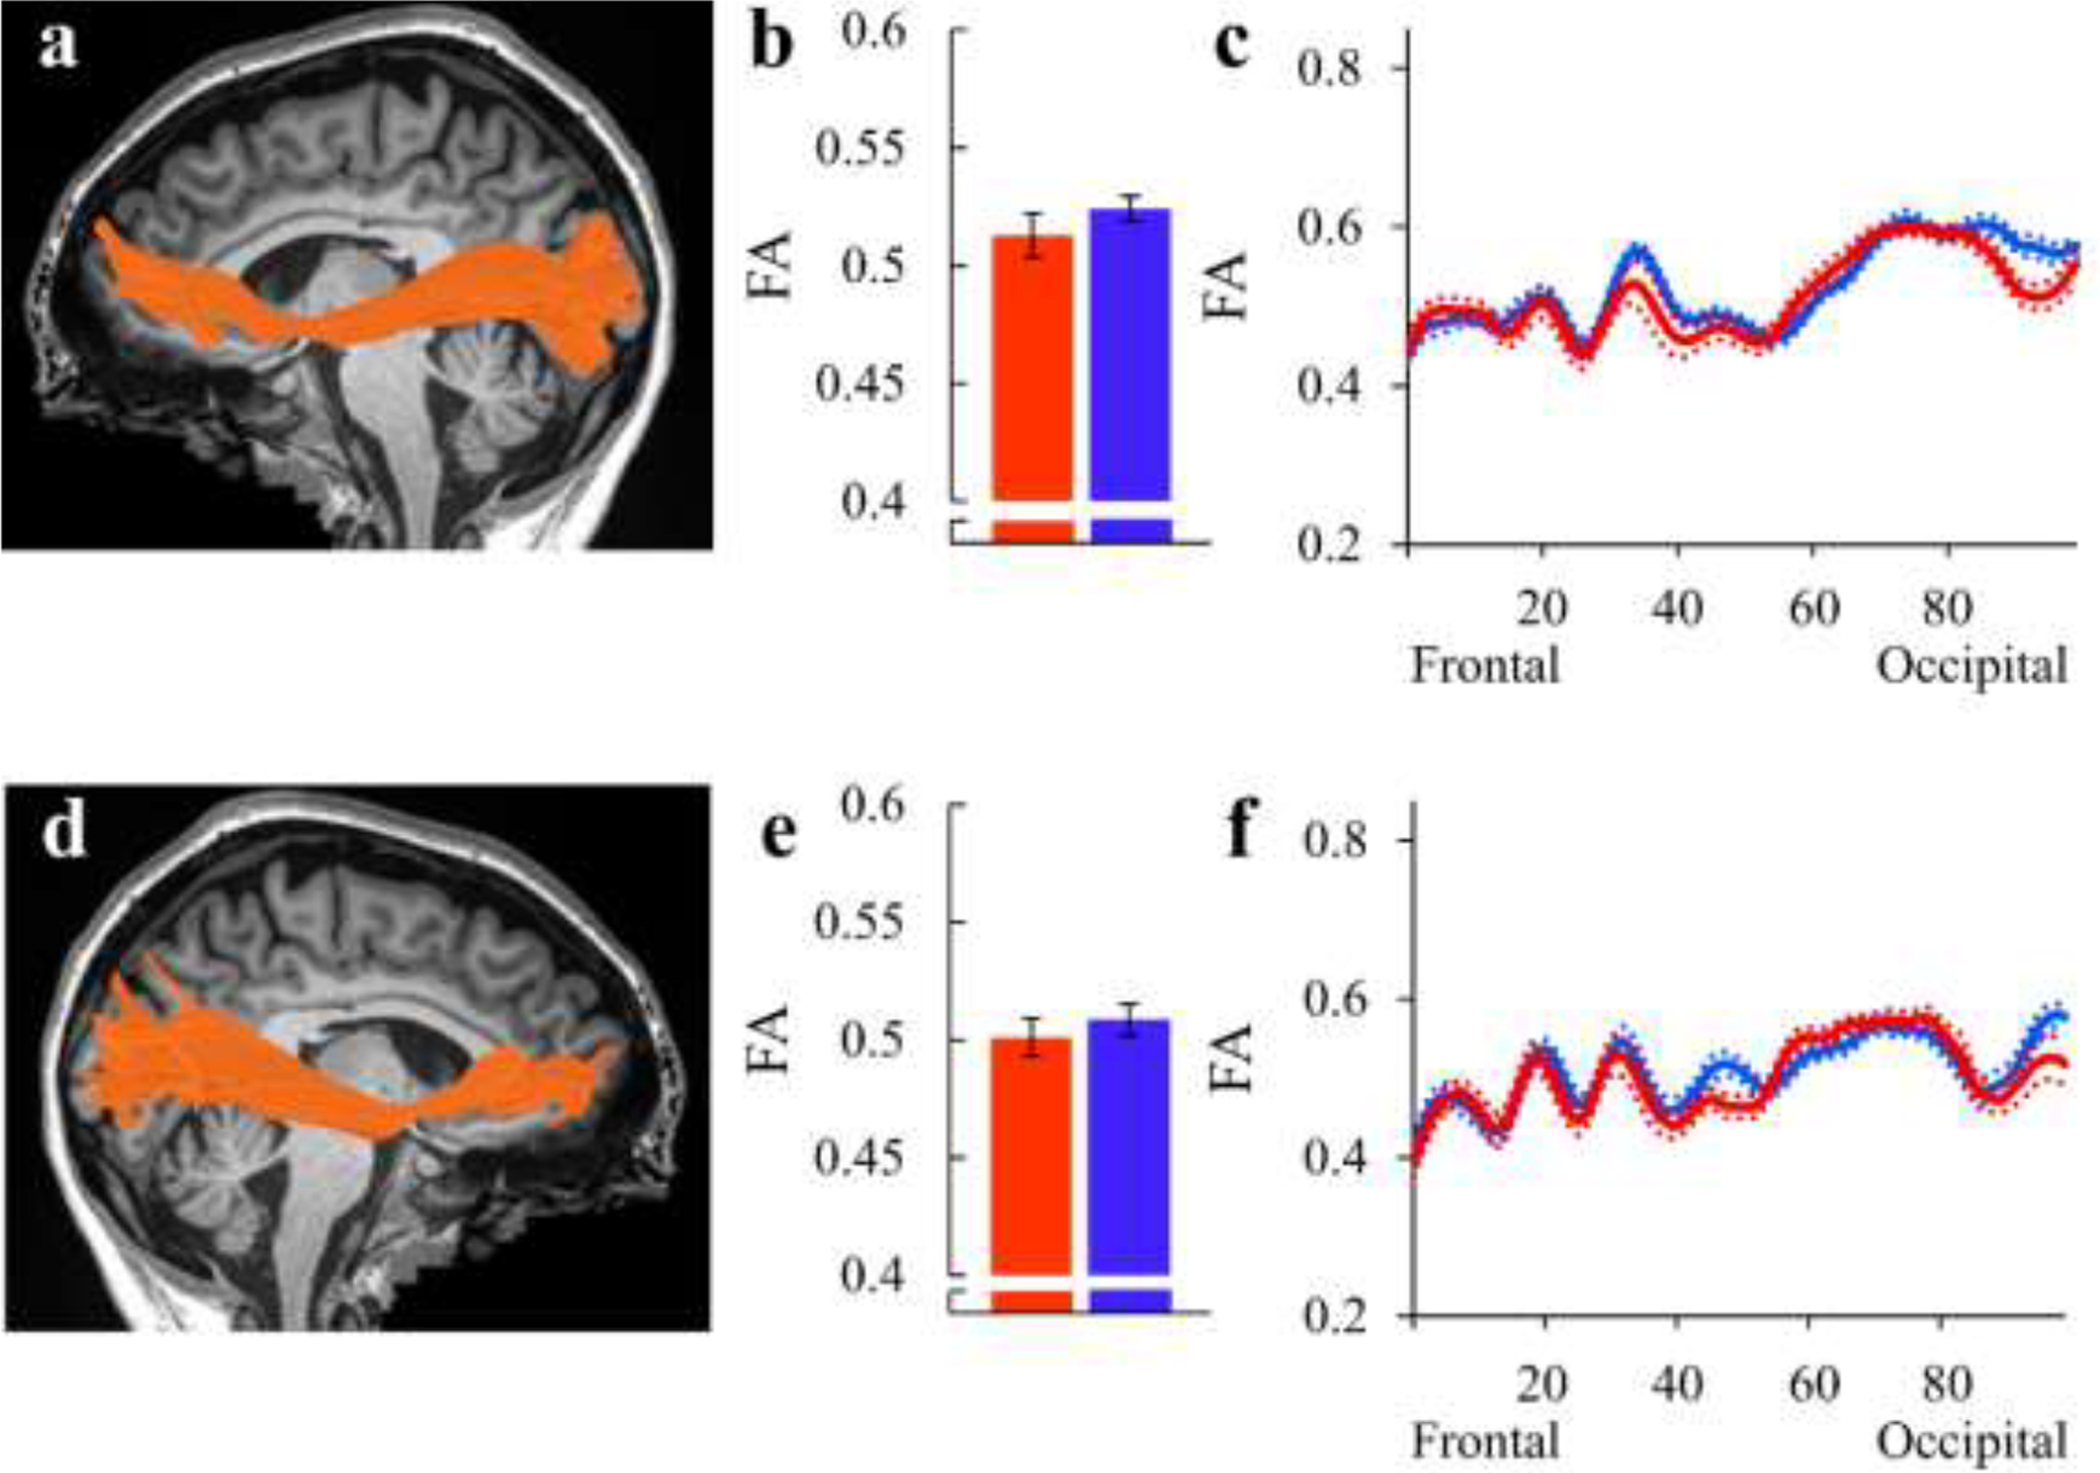
(a, d): The left (a) and right (d) IFOF are identified in a single participant (S12, fluent speaker, female, 23y), overlaid on a midsagittal T1 image of the same individual. (b, e): Bar graphs show the group average tract-FA of the left (b) and right (e) IFOF in AWS (red) and fluent speakers (blue). Error bars denote ±1 standard error of the mean. (c, f): FA profiles along the left (c) and right (f) IFOF are shown in AWS (red) and fluent speakers (blue), with colored dotted lines indicating ±1 standard error of the mean.
AWS – red, fluent speakers – blue.
3.7. Hypothesis 3: Reduced FA in the bilateral cerebellar peduncles of AWS
We compared mean tract-FA values in the bilateral cerebellar peduncles (Figure 5 and Table S1). It should be taken into account that our definition of the cerebellar peduncles is tractography based, unlike prior reports that used an ROI-based approach to define the cerebellar peduncles (Connally et al., 2014). Regardless, this analysis showed lower tract-FA values in left MCP of AWS compared to fluent speakers, in alignment with Connally et al. (2014) (p=.004, FDR corrected over 6 tracts, see Figure 5b). For completeness, we compared tract-MD values, FA tract profiles and MD tract profiles in each cerebellar peduncle. These analyses detected several significant group differences in left MCP. Specifically, higher tract-MD values were found in AWS compared to fluent speakers (p=.019, FDR controlled at 5% for 6 comparisons; see Figure S9b and Table S2), and reduced FA was found in AWS in nodes 1–24 of this tract (p<.05, FWE corrected across 30 nodes) (Figure 5d, left). In contrast to previous reports (Connally et al., 2014), no significant group differences were observed in the other cerebellar peduncles (all ps>.160) (Figures 5 and S9, and Tables S1 and S2).
Figure 5. Testing Hypothesis 3: Reduced FA in the bilateral cerebellar peduncles (CPs) of AWS.
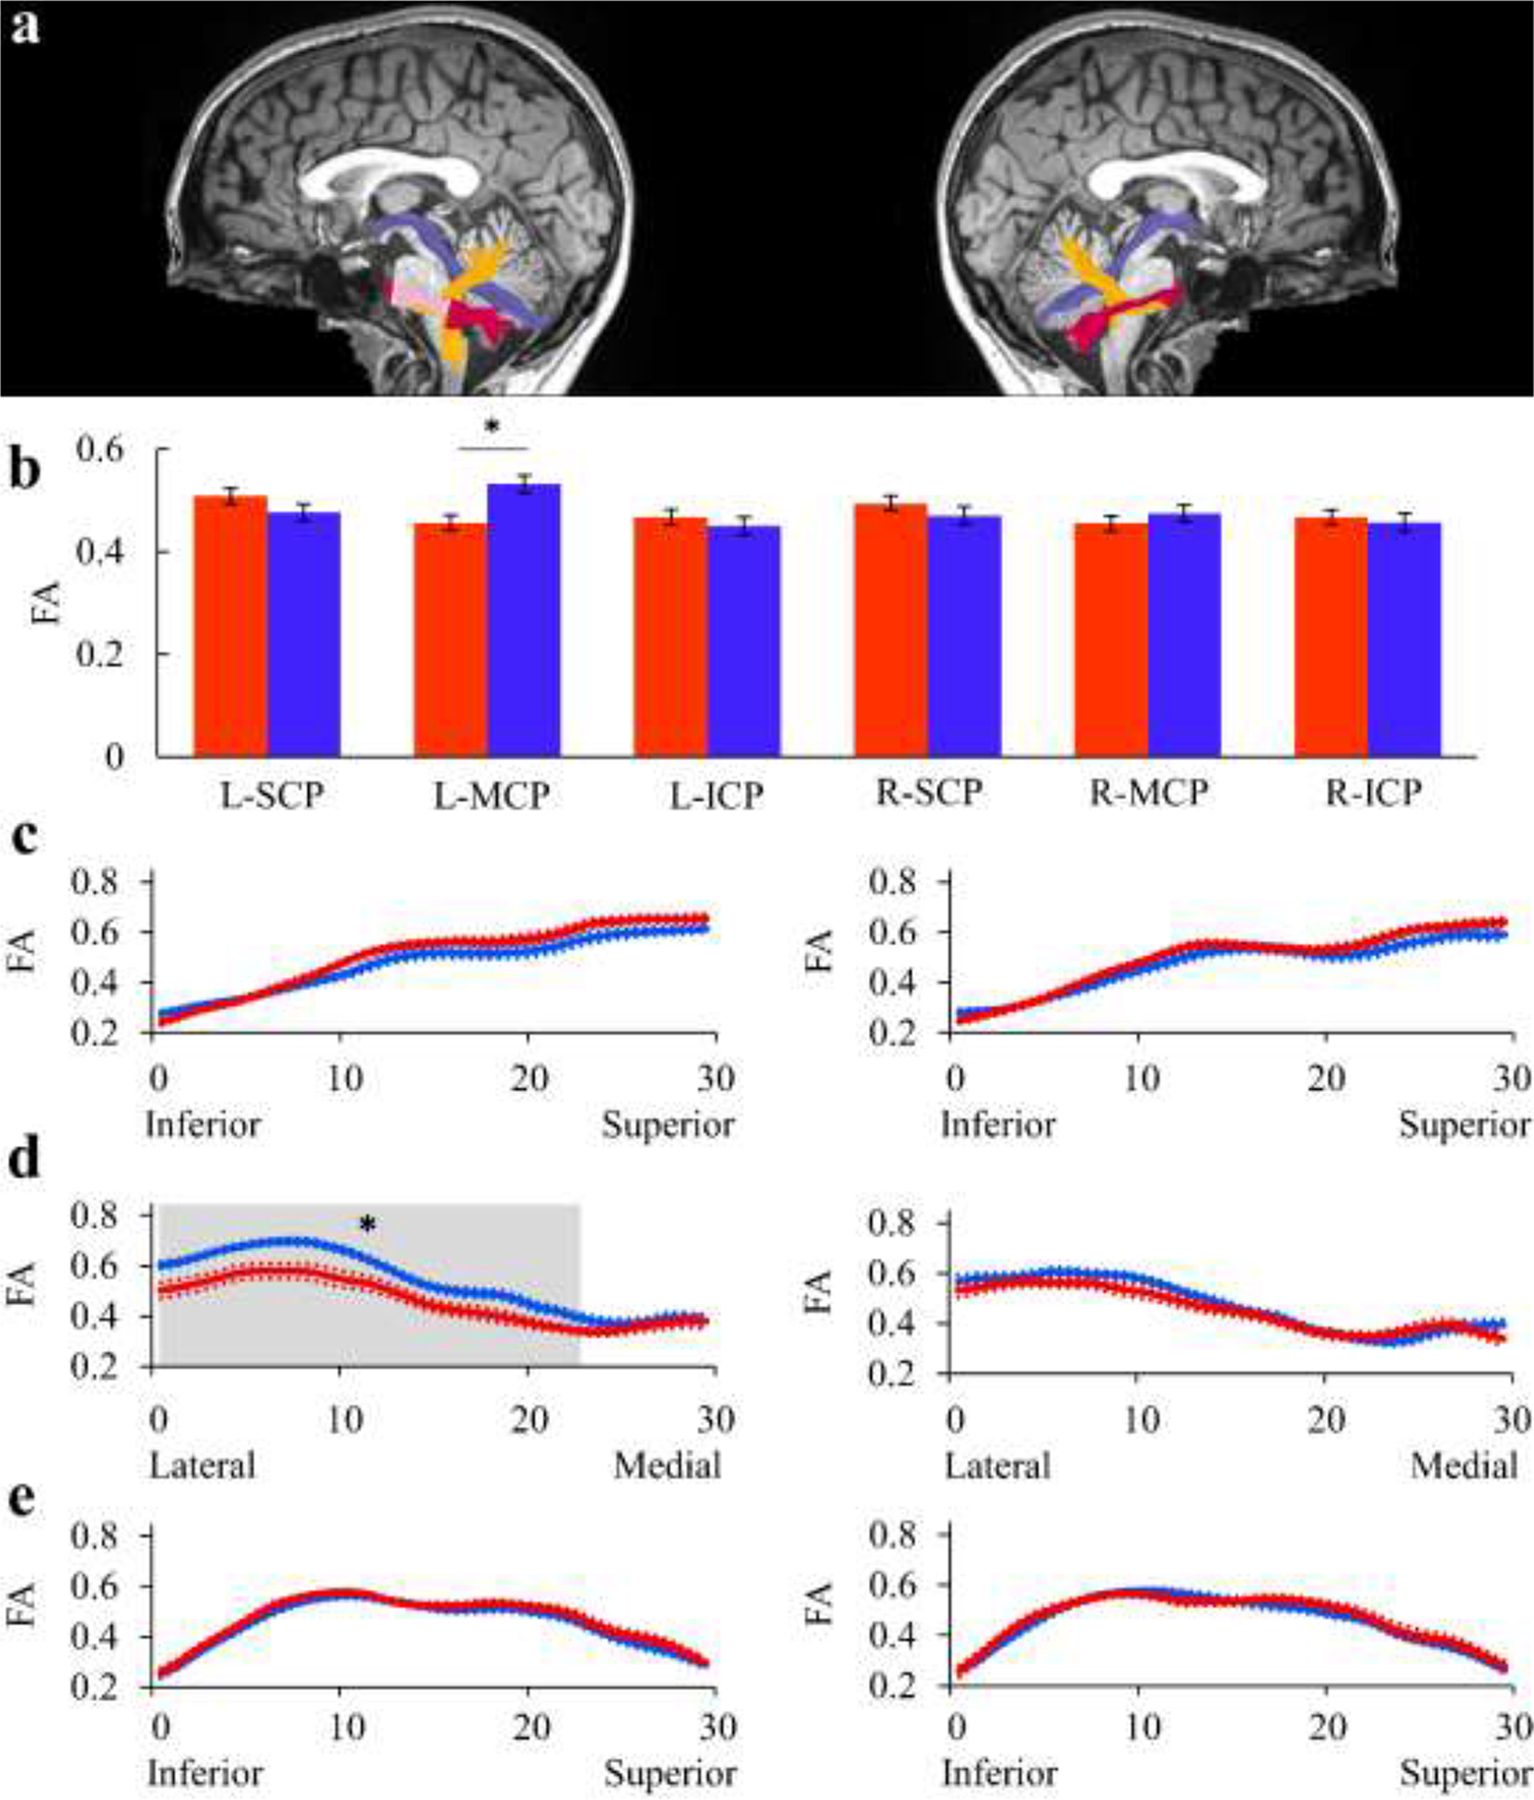
The results are shown for the left CPs (left column) and the right CPs (right column). a) The left and right SCP (purple), MCP (magenta) and ICP (yellow) are identified in a single participant (S43, fluent speaker, female, 19y), overlaid on a midsagittal T1 image of the same individual. Shaded region indicate the location of the significant cluster of nodes. b) Bar graphs show the group average tract-FA in AWS (red) and fluent speakers (blue). Error bars denote ±1 standard error of the mean. Asterisk denotes a significant group difference (p=.004, FDR controlled at 5% for 6 comparisons). (c-e): FA profiles along the bilateral SCP (c), MCP (d) and ICP (e) are shown in AWS (red) and fluent speakers (blue), with colored dotted lines indicating ±1 standard error of the mean. Asterisk denotes a significant group difference (p<.05, FWE corrected over 30 nodes).
AWS – red, fluent speakers – blue.
3.8. Differential association patterns with mean asynchrony
Following our prior findings of associations between microstructure and behavior, we examined the relationship between mean asynchrony, a measure of sensorimotor synchronization, and microstructural properties of the left arcuate fasciculus (Blecher et al., 2016) and the cerebellar peduncles (Gomes et al., 2021; Jossinger et al., 2021).
Spearman’s correlations were calculated between mean asynchrony and mean tract diffusivities (tract-FA and tract-MD) of the left arcuate fasciculus and the bilateral cerebellar peduncles (Table S3 and S4). This analysis revealed a significant positive correlation with tract-FA of the left arcuate fasciculus in fluent speakers (r=.62, p=.02; uncorrected) but not in AWS (r=−.0055, p=.99) (Figure 6b and Table S3). Moreover, the correlation coefficient in fluent speakers differed significantly from the one found in AWS (p=.013 calculated using a bootstrap analysis, see Methods section 2.5.3) (Figure 6c).
Figure 6. Mean asynchrony is correlated with FA of the left arcuate fasciculus among fluent speakers, but not among adults who stutter.
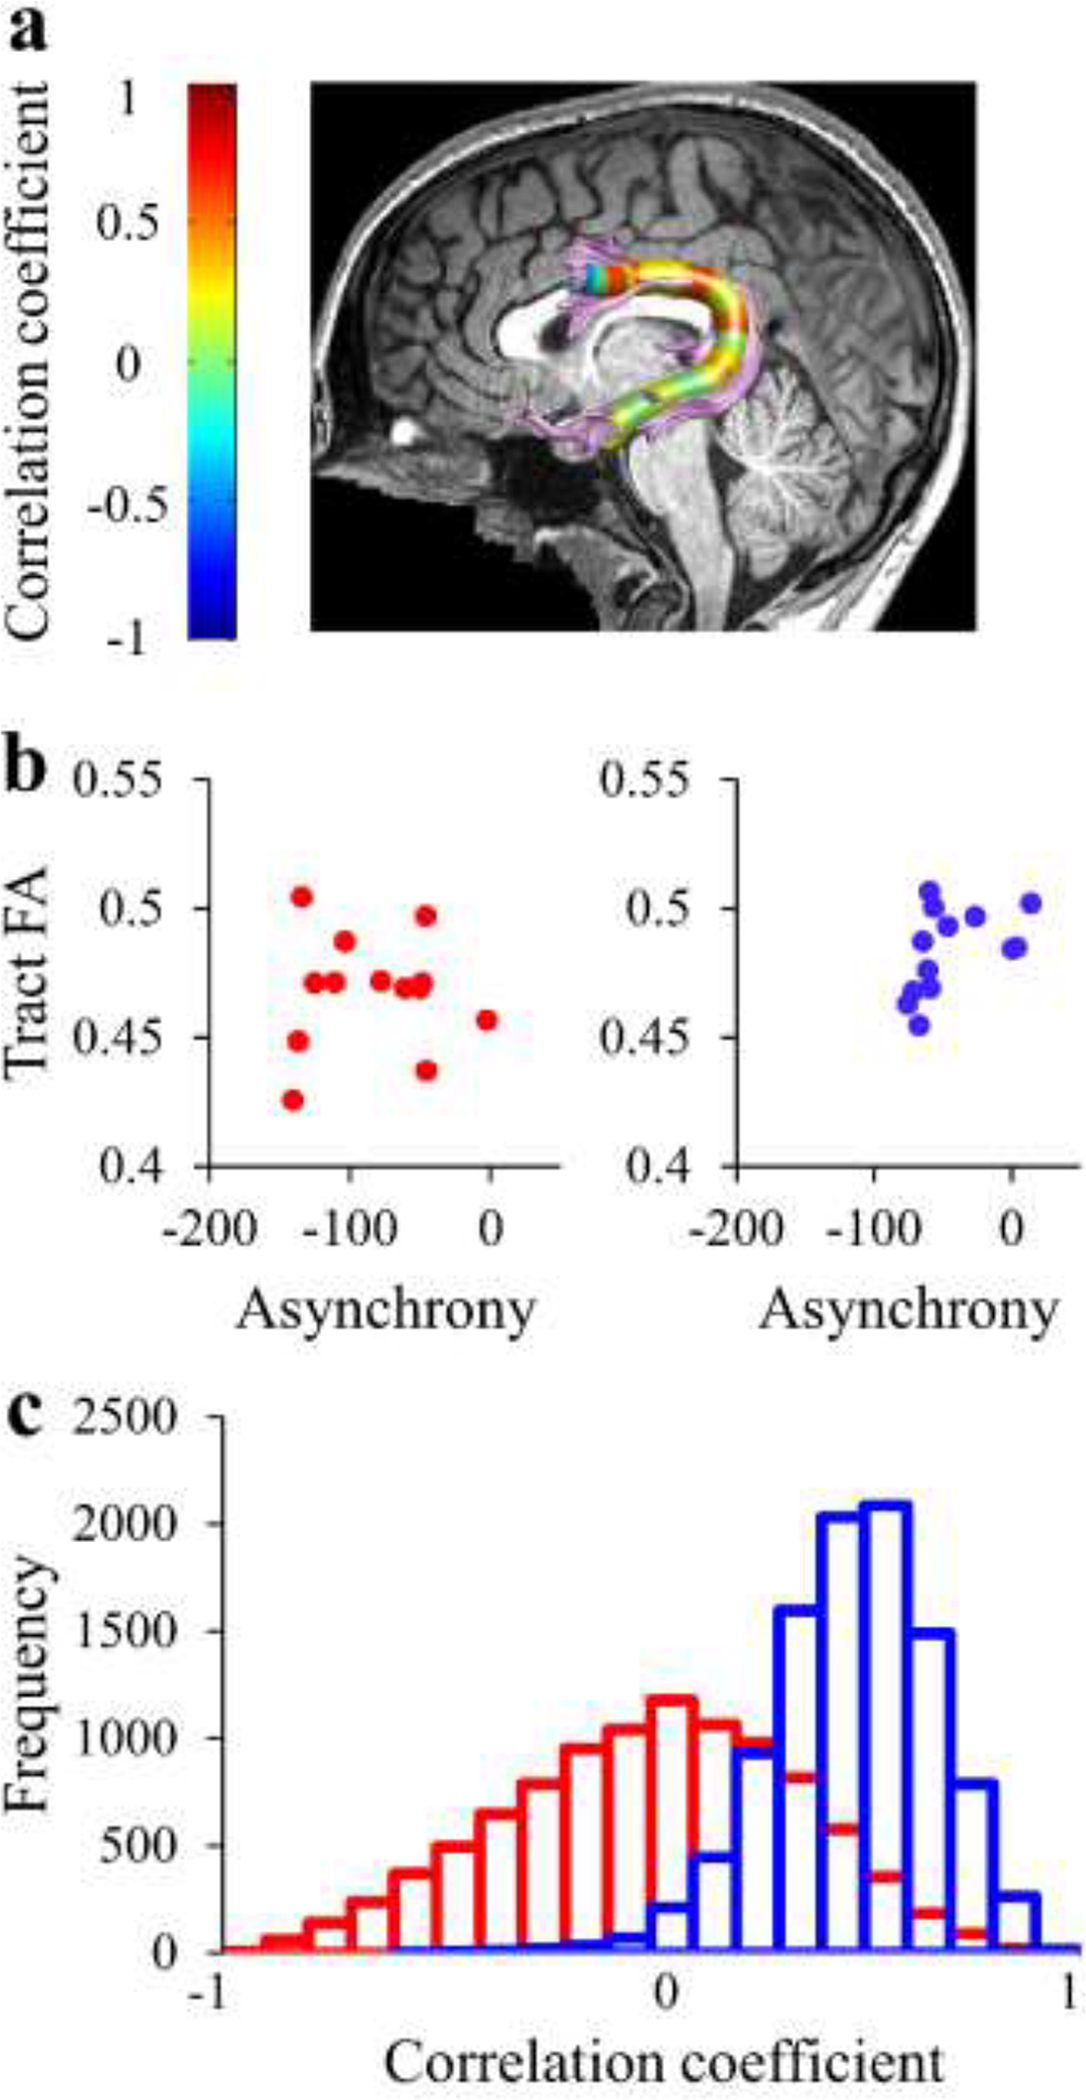
(a) Spearman’s r values calculated in each node along the core of the tract in fluent speakers (N=14). (b) Individual tract-FA values of the left arcuate fasciculus are plotted against individual mean asynchrony values in AWS (red) and fluent speakers (blue). A significant correlation is detected in fluent speakers (r=.62, p=.025, uncorrected) but not in AWS (r= −.005, p=.99). (c) Distributions of correlation coefficients were generated using bootstrap analysis by drawing repeated samples from the AWS group (red) and fluent speakers (blue). This analysis revealed that the probability for observing the correlation coefficient of AWS under the distribution of the fluent speakers is p=.013.
AWS – red, fluent speakers – blue.
In order to gain enhanced sensitivity for detecting localized brain-behavior correlations, we examined the associations between mean asynchrony and local diffusivity values, node by node, along the trajectory of the tracts (see Methods). Using this analysis, we found a significant negative correlation in AWS between mean asynchrony and MD within the left ICP (r = −.67, p<.01, FWE corrected across 30 nodes; see Figure 7b). Specifically, enhanced synchrony was associated with lower MD in a cluster of nodes within the left ICP (nodes 19–23). Fluent speakers did not show the same pattern of correlation (r=−.1154, p=.669). Moreover, the correlation coefficient in AWS differed significantly from the one calculated in corresponding nodes of the left ICP in fluent speakers (p=.0031, calculated using bootstrap) (Figure 7c).
Figure 7. Mean asynchrony is correlated with MD in the left ICP among adults who stutter, but not among fluent speakers.
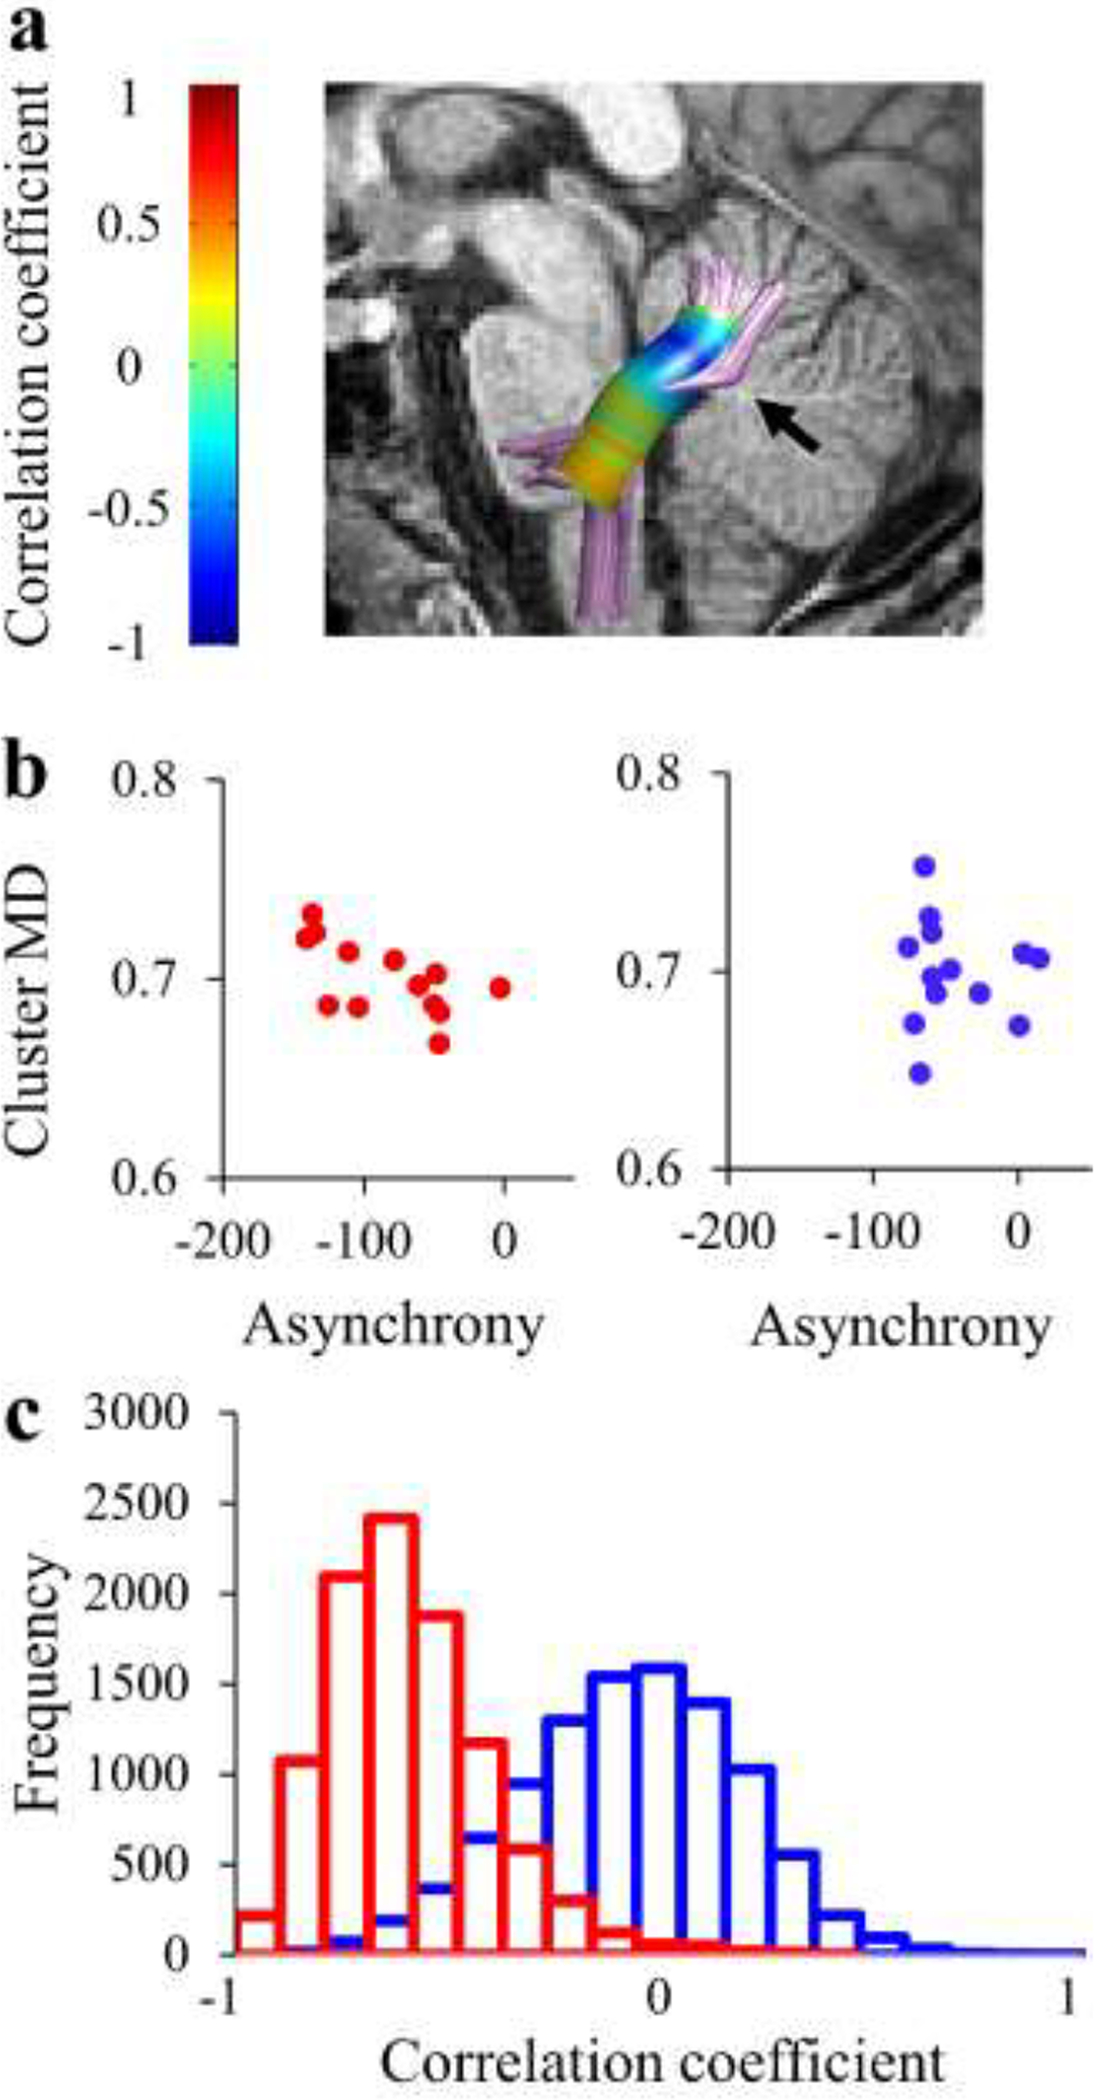
(a) The correlation between MD and mean asynchrony was assessed by calculating Spearman’s r values in each node along the core of the tract in AWS (N=13). A significant correlation is observed in nodes 19–23, denoted by the black arrow (p<.05, FWE corrected for 30 nodes). No significant cluster was observed in fluent speakers (not shown). (b) The mean MD value drawn from the significant cluster of nodes observed in AWS (see a) is plotted against the mean asynchrony in AWS (red) and fluent speakers (blue). (c) Distributions of correlation coefficients were generated using bootstrap analysis by drawing repeated samples from the AWS group (red) and fluent speakers (blue). This analysis revealed that the probability for observing the correlation coefficient of AWS under the distribution of the fluent speakers is p=.003.
AWS – red, fluent speakers – blue.
No additional correlations were found between mean asynchrony and the microstructural properties of the other cerebellar peduncles (all ps>.209), or between mean asynchrony and tract-MD of the left arcuate (uncorrected p=.040 in the right ICP failed to reach significance when controlling the FDR 5% for 6 tracts, all other ps>.163) (Tables S3 and S4).
4. Discussion
Using a hypothesis-driven approach, we successfully reproduced group differences between AWS and fluent speakers in bilateral dorsal, but not ventral, speech-related tracts. Specifically, AWS showed significantly lower FA in the left arcuate, and significantly higher MD in the bilateral frontal aslant compared to fluent speakers. Additional group differences were detected in the left MCP, where AWS showed significantly lower FA in a vast majority of nodes along the tract. A further comparison of brain-behavior association patterns revealed a novel double dissociation between the groups: in AWS, but not in fluent speakers, MD within the left inferior cerebellar peduncle significantly correlated with mean asynchrony. On the other hand, in fluent speakers, but not in AWS, FA within the left arcuate fasciculus significantly correlated with mean asynchrony. Our results support the view that stuttering involves altered connectivity in dorsal tracts and that AWS may therefore rely more heavily on cerebellar tracts to process timing information. We discuss potential interpretations of these findings below.
4.1. Microstructural group differences in dorsal and cerebellar white matter pathways
One of our aims was to reproduce previously-reported group differences in white matter tracts between AWS and fluent speakers. There is a great value in reproducing published results in the field of neurobiology of stuttering for two reasons. First, previous analyses of white matter microstructure in AWS produced mixed, sometimes contradictory, results. For example, reduced FA in the bilateral cerebellar peduncles was detected by Connally et al., (2014), but not by Jossinger et al. (2021). Similarly, while some studies detect group differences restricted to the left dorsal pathways (Chang et al., 2008; Sommer et al., 2002; Watkins et al., 2008), others report bilateral dorsal differences between AWS and fluent speakers (Kronfeld-Duenias et al., 2016b). Second, in light of the “replication crisis” in neuroscience, reproduction of previously published effects contributes to the reliability of results in this field (Barch & Yarkoni, 2013).
4.1.1. Microstructural differences in dorsal, but not ventral, speech-related tracts
Our findings confirm the hypothesis that AWS show group differences in microstructural properties of the dorsal, but not ventral, speech-related pathways (see Hypotheses 1+2 in section 1.2). Specifically, our results demonstrate altered connectivity in the left arcuate fasciculus and in the bilateral FAT of AWS compared to fluent speakers. FA reduction in the left arcuate fasciculus of children and adults who stutter is one of the most replicable findings in the study of microstructural connectivity in PDS (Chang et al., 2008; Connally et al., 2014; Cykowski et al., 2010; Sommer et al., 2002; Watkins et al., 2008). This pathway has been proposed to support the integration between motor and auditory information during speech production (Hickok, 2012; Hickok & Poeppel, 2007). In the DIVA model of speech production, connections between the IFG and STG (i.e., the arcuate fasciculus) are embedded in the feedback control system that conveys auditory signals when listening to one’s own speech (Tourville & Guenther, 2011). Moreover, manipulations that affect auditory feedback during speech production induce temporary fluency in people who stutter (Lincoln et al., 2006; Macleod et al., 1995; O’Donnell et al., 2008). Hence, altered connectivity in the arcuate fasciculus of AWS strengthens the view that stuttering may involve aberrant reliance on auditory feedback (Max et al., 2004).
While the arcuate fasciculus is hypothesized to take part in the feedback control system of speech, the FAT may be involved in the feedforward control system of speech (Tourville & Guenther, 2011). Broadly, the projections from the IFG to the SMA through the FAT carry feedforward articulatory motor plans to produce a desired sound (Tourville & Guenther, 2011). This tract was shown to be associated with speech initiation, verbal fluency, and stuttering (Chernoff et al., 2018; Dick et al., 2019). For example, a direct electrostimulation of this pathway evokes stuttering-like dysfluencies (Kemerdere et al., 2016). Structural data also support the role of the FAT in stuttering by demonstrating group differences between people with PDS and fluent speakers in the microstructural properties of this pathway (Kronfeld-Duenias et al., 2016a; Misaghi et al., 2018; Neef et al., 2018). Our findings here, demonstrating bilateral group differences in the FAT, converge with these prior findings, thus strengthening its role in PDS.
Similar to previous findings (Kronfeld-Duenias et al., 2016b), we did not find group differences in the microstructural properties of the IFOF. The IFOF is a ventral pathway connecting the occipital, temporal, and frontal lobes (Dick et al., 2014). According to the dual-stream model of speech processing, while the dorsal stream is linked to sensorimotor processing (as noted above), the ventral stream is linked to more lexical aspects of speech recognition and comprehension (Hickok & Poeppel, 2007). Our findings, which are restricted to the dorsal stream, are compatible with the view that stuttering involves an impairment in sensorimotor integration. This conclusion is tentative, however, since other functions have been associated with certain dorsal pathways; for example, syntactic processing has been associated with the left arcuate fasciculus (Friederici, 2012).
4.1.2. Microstructural difference in the middle cerebellar peduncle
Our findings reproduce significant group differences in the left MCP, demonstrating lower FA along a vast majority of nodes along this tract in AWS compared to fluent speakers (Connally et al., 2014). A recent tractography study in healthy human subjects showed that the MCP connects the cerebellum with the contralateral prefrontal and temporal cortices, including the SMA and IFG (Palesi et al., 2017), all of which have been implicated in stuttering (Brown et al., 2005; Cai et al., 2014; Chang et al., 2008, 2011, 2015; De Nil et al., 2003; Kell et al., 2009; Lu et al., 2009, 2010; Watkins et al., 2008). Here, we extend these findings by showing that the white matter fibers connecting the SMA and IFG with the cerebellum have different properties in AWS compared to fluent speakers. The total volume of the cerebellum was recently shown to be affected by early life experience, demonstrating smaller cerebellar volume in early-trained musicians (before the age of 7) compared to late-trained musicians or non-musicians (Baer et al., 2015). In this context, it would be interesting to determine whether the altered connectivity seen in the MCP of AWS is generated by the childhood experience of stuttering and accommodating a sensorimotor speech disorder.
Contrary to previous findings by Connally et al. (2014), we did not find significant group differences between AWS and fluent speakers in the microstructural properties of the SCP and ICP. The discrepancy between our results and previous findings could stem from several differences in methods and samples. First, while we used tractography to define the cerebellar peduncles, Connally et al. (2014) used an ROI based definition of the tracts. Furthermore, our methods assess group differences and correlations in 30 nodes along each of the cerebellar peduncles, while the ROI-based definition provides a single value for each cerebellar peduncle. The different methods used to define the pathways could have had a crucial impact on the results. However, a recent report by our group (Jossinger et al., 2021), which followed the same protocol as in Connally et al. (2014) to define the cerebellar peduncles, still failed to find microstructural group differences within the cerebellar peduncles of AWS vs. fluent speakers.
A second difference concerns scanning protocols, e.g., different field strengths, different spatial resolutions, different number of directions etc. Finally, we consider the different sample characteristics, including age and gender. Our AWS sample is atypical in terms of gender, encompassing more females than males: 5m:8f in the current sample, compared to 21m:8f in Connally et al. (2014), and 17m:6f in Jossinger el al. (2021). This difference is particularly relevant as the prevalence of stuttering in the general population is grater in males than females, with a male-to-female ratio of 4:1 (Yairi & Ambrose, 2013). In addition, the current sample spans an older age range compared to the previous report: the mean age of the current sample is 28.8y [range: 18–51] compared to 22.6y [14–42] in Connally et al. (2014). In fact, the sample in Jossinger et al (2021) had a similar age range to the current one (31.2 [19–52]), and that study, too, failed to find cerebellar group differences. Therefore, differences in the cerebellar peduncles may emerge in younger, but not in older, samples of AWS and fluent speakers.
4.1.3. Additional microstructural difference in other white matter tracts
The current study focused on a small number of pre-defined hypotheses using individualized tractography methods in native space. Given the relatively small sample size, we had to limit the number of hypotheses tested. Our hypothesis-driven approach enabled us to detect statistically significant group differences despite our relatively small sample size. An alternative approach would be to run a whole brain analysis in standard space. Such analyses have previously detected differences between people who stutter and fluent speakers in several foci, including the CST and corpus callosum (but see Choo et al., 2012, Kronfeld-Duenias et al., 2016a, for contradictory results). Future studies with larger sample size are still needed to validate these findings.
4.2. Double dissociation between AWS and fluent speakers in the neural substrates of SMS
Our findings demonstrated a double dissociation between AWS and fluent speakers in the neural substrates controlling SMS. This result complements the direct group comparisons between microstructural properties (as discussed in section 4.1). In fact, a significant difference in association patterns was found in a pathway where a direct comparison failed to detect any group differences (see Section 4.2.2). This finding highlights an important point: Association patterns between tractometry and cognitive measures may reveal differences that are invisible to tractometry alone. We see this in other domains as well, for example, differences in association patterns (without accompanying differences in tractometry) were found in comparisons between preterm and full term born children (Travis et al., 2016), high and low performing preschoolers (Qi et al., 2020), people with primary progressive aphasia and controls (Janssen et al., 2020). Hence, this approach provides a powerful tool for discovering additional functional differences in the underlying connectivity within these groups.
4.2.1. The left arcuate fasciculus is associated with SMS only in fluent speakers, and not in AWS.
Our results show a positive correlation between FA of the left arcuate fasciculus and mean asynchrony in fluent speakers, not in AWS. Specifically, more synchronous tapping with the auditory beat is associated with higher FA within the left arcuate fasciculus of fluent speakers. This association reproduces similar findings observed in an independent group of fluent speakers (Blecher et al., 2016) and suggests that the arcuate fasciculus is involved in coordinating the motor action with the external auditory beat to optimize the synchronization between them.
Interestingly, the association between the left arcuate fasciculus and SMS was not evident among AWS in our current sample. As discussed above (see section 4.1.1), consistent differences have been observed in the microstructural properties of the left arcuate fasciculus in AWS, who are also repeatedly shown to have deficits in SMS (Max & Yudman, 2003; Sares et al., 2019; van de Vorst & Gracco, 2017). Here we show for the first time that the significant microstructural group difference in the left arcuate fasciculus is accompanied by a difference in the pattern of association with SMS. Accordingly, we raise the hypothesis that differences in SMS observed in people who stutter may derive from variations in the structure of the arcuate fasciculus. If that is the case, we predict that training sensorimotor synchronization capacities may change the microstructural properties of the left arcuate, which may, in turn, enhance speech fluency among AWS.
4.2.2. The left ICP is associated with SMS only in AWS, and not in fluent speakers.
A novel contribution of the current study concerns the selective association between SMS and MD within the left ICP, which was observed only in AWS and not in fluent speakers. Specifically, we found that enhanced synchrony between tapping and an auditory beat was correlated with reduced MD within a specific cluster of nodes along the left ICP. The cerebellum is often thought of as a “timekeeping” mechanism, controlling the temporal structure of ongoing motor sequences, including speech production (Ackermann, 2008) and SMS (Molinari et al., 2007). This general-purpose mechanism generates rapid predictions about the sensory consequence of self-generated movements, thus bypassing the slow nature of physiological feedback loops (Wolpert et al., 1998). Deviations from the predicted sensory consequence are monitored and labeled as prediction errors, and then used to update the sensory predictions in accordance with the actual sensory feedback. This process of error monitoring has been attributed to the olivo-cerebellar fibers (i.e., “climbing fibers”) which pass through the ICP (Shadmehr, 2017).
Alterations in error monitoring during speech production have been proposed as part of the core deficit in stuttering (Arnstein et al., 2011; Max et al., 2004; Postma & Kolk, 1993). It was suggested that people who stutter tend to over-rely on efferent feedback as a way to cope with an insufficient or unstable internal model of speech (Civier et al., 2010; Max et al., 2004). We recently showed that the left ICP is also implicated in timing related aspects of speech in an independent sample of AWS (Jossinger et al., 2021). The current findings generalize the association of the left ICP with timing related behaviors among adults who stutter, suggesting a more general deficit in error-monitoring during timed sensorimotor interactions, which goes beyond speech.
4.3. Interpreting the results in terms of tissue properties.
We report group differences in both FA and MD across several dorsal and cerebellar white matter pathways. Specifically, compared to fluent speakers, AWS showed reduced FA in the left arcuate fasciculus and the left MCP, and elevated MD in the bilateral FAT. Interpreting these differences in terms of the underlying tissue properties is notoriously hard, because both FA and MD are modulated by multiple biological factors, including axonal density, directional coherence, axonal diameter and myelin content (Assaf & Pasternak, 2008; Beaulieu, 2002; Jones et al., 2013). Some of these tissue properties influence FA and MD in opposite directions: For example, tight axonal packing or elevated myelination would manifest in elevated FA but reduced MD in the same voxel. In sum, both reduced FA and elevated MD may stem from reduced myelin content, sparser fiber bundles, or some combination of both, and both may lead to poorer neuronal communication.
Similar caution should be taken when attempting to interpret the brain-behavior correlations seen in each of the groups. Our data show a positive correlation between sensorimotor synchronization and FA within the left arcuate fasciculus of fluent speakers, and a negative correlation between sensorimotor synchronization and MD within the left ICP of AWS. Fluent speakers who were more synchronized with the auditory beat had higher FA values within their left arcuate fasciculus, whereas AWS who were more synchronized with the auditory beat had lower MD within their left ICP. Considering that stronger connectivity is linked with both high FA and low MD, we suggest that better performance in a sensorimotor synchronization task is linked with better connectivity within the left arcuate fasciculus among fluent speakers, and better connectivity within the left ICP among AWS. This simplistic, hypothetical explanation should be further tested with more advanced quantitative MRI measures that are sensitive to the different biological factors comprising the tissue (Assaf et al., 2008; Assaf & Basser, 2005; Berman et al., 2019; Filo et al., 2019; Mezer & Yeatman, 2014).
4.4. Limitations
The relatively small sample size (N=13 for AWS and N=14 for fluent speakers) limits the statistical power of our study. To cope with this limitation, we incorporated a hypothesis driven approach that enabled us to restrict the number of comparisons and use one-tailed statistical tests. Despite the limited power (especially within the left arcuate fasciculus and MCP; see Supplementary material) we were still able to detect significant group differences supporting our hypotheses. However, looking at larger samples may reveal additional group differences in other white matter pathways, and further extend the patterns of associations in AWS and fluent speakers. For example, a larger sample could expand the behavioral range of SMS scores and reveal additional associations between SMS and the cerebellar peduncles in fluent speakers.
A second limitation is the use of tensor fitting and deterministic tractography (traditional DTI methods), rather than using more complex models of diffusivity coupled with probabilistic tractography (advanced methods). Deterministic tractography was chosen because it provides a more direct comparison to prior findings (Blecher et al., 2016; Jossinger et al., 2020; Kronfeld-Duenias et al., 2016a). Of relevance, we recently reported high consistency between traditional and advanced methods in both FA and MD values extracted from dorsal and ventral cerebral tracts (Yablonski et al., 2021). For example, correlation coefficients of r=0.96 and r=0.95 were found between MD values of the left and right FAT (respectively) identified with traditional vs. advanced methods (Ibid, Supplementary figure 1). Thus, we expect the current findings to generalize beyond the specific methods used here.
A third limitation concerns the lack of a baseline motor task in our study. It could be argued that SMS differences in AWS may stem from a more basic motor impairment. However, a recent study by van de Vorst & Gracco (2017) showed that AWS have aberrant SMS patterns compared to fluent speakers, while the two groups perform similarly during an unpaced tapping task. Lastly, any study that identifies differences and associations in a sample of adults may not provide conclusive insight into the direction of causality that underlies the effects. The current study is no exception. Developmental and longitudinal studies are required to determine whether the white matter differences observed in this study resulted from compensatory mechanisms after years of stuttering or whether these differences caused stuttering symptoms. In addition, training studies targeting non-speech sensorimotor synchronization in AWS will determine the causal relation between SMS, stuttering and the underlying neural substrates.
4.5. Conclusions
In conclusion, our results support the view that stuttering involves altered connectivity in dorsal, but not ventral, speech-related tracts, and that AWS may rely more heavily on cerebellar tracts to process timing information. By reproducing some, but not other, previously reported effects, this study helps to pinpoint the microstructural abnormalities at the root of PDS. By evaluating microstructural differences in the context of a sensitive behavioral measure, we discovered a novel double dissociation between AWS and fluent speakers in the neural substrates of sensorimotor integration.
Supplementary Material
Highlights.
We assessed white matter pathways and sensorimotor synchronization in adults who stutter and fluent speakers.
Group differences were detected in dorsal and cerebellar pathways.
The left inferior cerebellar peduncle was associated with sensorimotor synchronization in adults who stutter.
The left arcuate fasciculus was associated with sensorimotor synchronization in fluent speakers.
Differential association patterns provide enhanced sensitivity and offer a useful tool for discovery in communication disorders.
Acknowledgements.
This study was conducted as part of Sivan Jossinger’s doctoral dissertation, carried out under the supervision of Prof. Michal Ben-Shachar at the Gonda Multidisciplinary Brain research center, Bar-Ilan University. Collection and analysis of behavioral data, as well as structural scan acquisition, were carried out at McGill University by Anastasia Sares and Mickael Deroche under the supervision of Prof. Vincent Gracco.
Funding.
This study is supported by the Israel Science Foundation (ISF Grant #1083/17 to MBS) and by the NIH (grant #DC-015855 to VG). Dana Suri-Barot is supported by the Navon Scholarship funded by the Israeli Ministry of Science and Technology (#3-16626).
Footnotes
Publisher's Disclaimer: This is a PDF file of an unedited manuscript that has been accepted for publication. As a service to our customers we are providing this early version of the manuscript. The manuscript will undergo copyediting, typesetting, and review of the resulting proof before it is published in its final form. Please note that during the production process errors may be discovered which could affect the content, and all legal disclaimers that apply to the journal pertain.
Conflict of interest. The authors declare that they have no conflict of interest.
References
- Ackermann H (2008). Cerebellar contributions to speech production and speech perception: psycholinguistic and neurobiological perspectives. Trends in Neurosciences, 31(6), 265–272. [DOI] [PubMed] [Google Scholar]
- Alm PA (2004). Stuttering and the basal ganglia circuits: a critical review of possible relations. Journal of Communication Disorders, 37(4), 325–369. [DOI] [PubMed] [Google Scholar]
- Ambrose NG, & Yairi E (1999). Normative disfluency data for early childhood stuttering. Journal of Speech, Language, and Hearing Research : JSLHR, 42(4), 895–909. [DOI] [PubMed] [Google Scholar]
- Arnstein D, Lakey B, Compton RJ, & Kleinow J (2011). Preverbal error-monitoring in stutterers and fluent speakers. Brain and Language, 116(3), 105–115. [DOI] [PubMed] [Google Scholar]
- Aschersleben G (2002). Temporal control of movements in sensorimotor synchronization. Brain and Cognition, 48(1), 66–79. [DOI] [PubMed] [Google Scholar]
- Assaf Y, & Basser PJ (2005). Composite hindered and restricted model of diffusion (CHARMED) MR imaging of the human brain. NeuroImage, 27(1), 48–58. [DOI] [PubMed] [Google Scholar]
- Assaf Y, Blumenfeld-Katzir T, Yovel Y, & Basser PJ (2008). AxCaliber: A method for measuring axon diameter distribution from diffusion MRI. Magnetic Resonance in Medicine, 59(6), 1347–1354. [DOI] [PMC free article] [PubMed] [Google Scholar]
- Assaf Y, & Pasternak O (2008). Diffusion tensor imaging (DTI)-based white matter mapping in brain research: A review. Journal of Molecular Neuroscience, 34(1), 51–61. [DOI] [PubMed] [Google Scholar]
- Baer LH, Park MTM, Bailey JA, Chakravarty MM, Li KZH, & Penhune VB (2015). Regional cerebellar volumes are related to early musical training and finger tapping performance. NeuroImage, 109, 130–139. [DOI] [PubMed] [Google Scholar]
- Barch DM, & Yarkoni T (2013). Introduction to the special issue on reliability and replication in cognitive and affective neuroscience research. Cognitive, Affective and Behavioral Neuroscience, 13(4), 687–689. [DOI] [PubMed] [Google Scholar]
- Basser PJ, Pajevic S, Pierpaoli C, Duda J, & Aldroubi A (2000). In vivo fiber tractography using DT-MRI data. Magnetic Resonance in Medicine, 44(4), 625–632. [DOI] [PubMed] [Google Scholar]
- Beaulieu C (2002). The basis of anisotropic water diffusion in the nervous system - a technical review. NMR in Biomedicine, 15(7–8), 435–455. [DOI] [PubMed] [Google Scholar]
- Berman S, Filo S, & Mezer AA (2019). Modeling conduction delays in the corpus callosum using MRI-measured g-ratio. NeuroImage, 195(November 2018), 128–139. [DOI] [PubMed] [Google Scholar]
- Blecher T, Tal I, & Ben-Shachar M (2016). White matter microstructural properties correlate with sensorimotor synchronization abilities. NeuroImage, 138, 1–12. [DOI] [PubMed] [Google Scholar]
- Bower JM (1997). Control of sensory data acquisition. International Review of Neurobiology, 41(February 1997), 489–513. [DOI] [PubMed] [Google Scholar]
- Brown S, Ingham RJ, Ingham JC, Laird AR, & Fox PT (2005). Stuttered and fluent speech production: An ALE meta-analysis of functional neuroimaging studies. Human Brain Mapping, 25(1), 105–117. [DOI] [PMC free article] [PubMed] [Google Scholar]
- Bruckert L, Shpanskaya K, McKenna ES, Borchers LR, Yablonski M, Blecher T, Ben-Shachar M, Travis KE, Feldman HM, & Yeom KW (2019). Age-Dependent White Matter Characteristics of the Cerebellar Peduncles from Infancy Through Adolescence. The Cerebellum, 18(3), 372–387. [DOI] [PubMed] [Google Scholar]
- Cai S, Tourville JA, Beal DS, Perkell JS, Guenther FH, & Ghosh SS (2014). Diffusion imaging of cerebral white matter in persons who stutter: evidence for network-level anomalies. Frontiers in Human Neuroscience, 8(1 FEB), 1–18. [DOI] [PMC free article] [PubMed] [Google Scholar]
- Chang SE, Erickson KI, Ambrose NG Hasegawa-Johnson MA, & Ludlow CL (2008). Brain anatomy differences in childhood stuttering. Neuroimage, 39(3), 1333–1344. [DOI] [PMC free article] [PubMed] [Google Scholar]
- Chang SE, Horwitz B, Ostuni J, Reynolds R, & Ludlow CL (2011). Evidence of Left Inferior Frontal–Premotor Structural and Functional Connectivity Deficits in Adults Who Stutter. Cerebral Cortex, 21(11), 2507–2518. [DOI] [PMC free article] [PubMed] [Google Scholar]
- Chang SE, Zhu DC, Choo AL, & Angstadt M (2015). White matter neuroanatomical differences in young children who stutter. Brain, 138(3), 694–711. [DOI] [PMC free article] [PubMed] [Google Scholar]
- Chernoff BL, Teghipco A, Garcea FE, Sims MH, Paul DA, Tivarus ME, Smith SO, Pilcher WH, & Mahon BZ (2018). A Role for the Frontal Aslant Tract in Speech Planning: A Neurosurgical Case Study. Journal of Cognitive Neuroscience, 30(5), 752–769. [DOI] [PubMed] [Google Scholar]
- Choo AL, Chang SE, Zengin-Bolatkale H, Ambrose NG, & Loucks TM (2012). Corpus callosum morphology in children who stutter. Journal of Communication Disorders, 45(4), 279–289. [DOI] [PMC free article] [PubMed] [Google Scholar]
- Civier O, Tasko SM, & Guenther FH (2010). Overreliance on auditory feedback may lead to sound/syllable repetitions: Simulations of stuttering and fluency-inducing conditions with a neural model of speech production. Journal of Fluency Disorders, 35(3), 246–279. [DOI] [PMC free article] [PubMed] [Google Scholar]
- Connally EL, Ward D, Howell P, & Watkins KE (2014). Disrupted white matter in language and motor tracts in developmental stuttering. Brain and Language, 131, 25–35. [DOI] [PubMed] [Google Scholar]
- Conture EG, & Kelly EM (1991). Young stutterers’ nonspeech behaviors during stuttering. Journal of Speech and Hearing Research, 34(5), 1041–1056. [DOI] [PubMed] [Google Scholar]
- Corriveau KH, & Goswami U (2009). Rhythmic motor entrainment in children with speech and language impairments: Tapping to the beat. Cortex, 45(1), 119–130. [DOI] [PubMed] [Google Scholar]
- Cykowski MD, Fox PT, Ingham RJ, Ingham JC, & Robin DA (2010). A study of the reproducibility and etiology of diffusion anisotropy differences in developmental stuttering: A potential role for impaired myelination. NeuroImage, 52(4), 1495–1504. [DOI] [PMC free article] [PubMed] [Google Scholar]
- De Nil LF, Kroll RM, Lafaille SJ, & Houle S (2003). A positron emission tomography study of short-and long-term treatment effects on functional brain activation in adults who stutter. Journal of Fluency Disorders, 28(4), 357–380. [DOI] [PubMed] [Google Scholar]
- De Santis S, Assaf Y, Evans CJ, & Jones DK (2014). Improved precision in CHARMED assessment of white matter through sampling scheme optimization and model parsimony testing. Magnetic Resonance in Medicine, 71(2), 661–671. [DOI] [PMC free article] [PubMed] [Google Scholar]
- Dick AS, Bernal B, & Tremblay P (2014). The language connectome: New pathways, new concepts. Neuroscientist, 20(5), 453–467. [DOI] [PubMed] [Google Scholar]
- Dick AS, Garic D, Graziano P, & Tremblay P (2019). The frontal aslant tract (FAT) and its role in speech, language and executive function. Cortex, 111, 148–163. [DOI] [PMC free article] [PubMed] [Google Scholar]
- Dietz V, Zijlstra W, & Duysens J (1994). Human neuronal interlimb coordination during split-belt locomotion. Experimental Brain Research, 101(3), 513–520. [DOI] [PubMed] [Google Scholar]
- Falk S, Müller T, & Dalla Bella S (2015). Non-verbal sensorimotor timing deficits in children and adolescents who stutter. Frontiers in Psychology, 6(July), 1–12. [DOI] [PMC free article] [PubMed] [Google Scholar]
- Filo S, Shtangel O, Salamon N, Kol A, Weisinger B, Shifman S, & Mezer AA (2019). Disentangling molecular alterations from water-content changes in the aging human brain using quantitative MRI. Nature Communications, 10(1), 3403. [DOI] [PMC free article] [PubMed] [Google Scholar]
- Frankford SA, Heller Murray ES, Masapollo M, Cai S, Tourville JA, Nieto-Castañón A, & Guenther FH (2021). The neural circuitry underlying the “rhythm effect” in stuttering. Journal of Speech, Language, and Hearing Research, 64(6s), 2325–2346. [DOI] [PMC free article] [PubMed] [Google Scholar]
- Friederici AD (2012). The cortical language circuit: from auditory perception to sentence comprehension. Trends in Cognitive Sciences, 16(5), 262–268. [DOI] [PubMed] [Google Scholar]
- Friston KJ, & Ashburner J (2004). Generative and recognition models for neuroanatomy. NeuroImage, 23(1), 21–24. [DOI] [PubMed] [Google Scholar]
- Gomes CA, Steiner KM, Ludolph N, Spisak T, Ernst TM, Mueller O, Göricke SL, Labrenz F, Ilg W, Axmacher N, & Timmann D (2021). Resection of cerebellar tumours causes widespread and functionally relevant white matter impairments. Human Brain Mapping, 42(6), 1641–1656. [DOI] [PMC free article] [PubMed] [Google Scholar]
- Harrington DL, Lee RR, Boyd LA, Rapcsak SZ, & Knight RT (2004). Does the representation of time depend on the cerebellum? Effect of cerebellar stroke. Brain, 127(3), 561–574. [DOI] [PubMed] [Google Scholar]
- Hickok G (2012). Computatinal neuroanatomy of speech production. Nature Reviews Neuroscience, 13(2), 135–145. [DOI] [PMC free article] [PubMed] [Google Scholar]
- Hickok G, & Poeppel D (2007). The cortical organization of speech processing. Nature Reviews Neuroscience, 8(5), 393–402. [DOI] [PubMed] [Google Scholar]
- Iimura D, Asakura N, Sasaoka T, & Inui T (2019). Abnormal sensorimotor integration in adults who stutter: A behavioral study by adaptation of delayed auditory feedback. Frontiers in Psychology, 10(OCT), 1–11. [DOI] [PMC free article] [PubMed] [Google Scholar]
- Ivry R (1997). Cerebellar timing systems. International Review of Neurobiology, 41, 555–573. [PubMed] [Google Scholar]
- Ivry R, & Keele SW (1989). Timing functions of the cerebellum. Journal of Cognitive Neuroscience, 1(2), 136–152. [DOI] [PubMed] [Google Scholar]
- Ivry R, Keele SW, & Diener HC (1988). Dissociation of the lateral and medial cerebellum in movement timing and movement execution. Experimental Brain Research, 73(1), 167–180. [DOI] [PubMed] [Google Scholar]
- Janssen N, Roelofs A, Mangnus M, Sierpowska J, Kessels RPC, & Piai V (2020). How the speed of word finding depends on ventral tract integrity in primary progressive aphasia. NeuroImage: Clinical, 28(September), 102450. [DOI] [PMC free article] [PubMed] [Google Scholar]
- Jones DK, Knösche TR, & Turner R (2013). White matter integrity, fiber count, and other fallacies: The do’s and don’ts of diffusion MRI. NeuroImage, 73, 239–254. [DOI] [PubMed] [Google Scholar]
- Jossinger S, Kronfeld-Duenias V, Zislis A, Amir O, & Ben-Shachar M (2021). Speech rate association with cerebellar white-matter diffusivity in adults with persistent developmental stuttering. Brain Structure and Function, 226(3), 801–816. [DOI] [PubMed] [Google Scholar]
- Jossinger S, Mawase F, Ben-Shachar M, & Shmuelof L (2020). Locomotor Adaptation Is Associated with Microstructural Properties of the Inferior Cerebellar Peduncle. The Cerebellum, 19(3), 370–382. [DOI] [PubMed] [Google Scholar]
- Kell CA, Neumann K, von Kriegstein K, Posenenske C, von Gudenberg AW, Euler H, & Giraud A (2009). How the brain repairs stuttering. Brain, 132(10), 2747–2760. [DOI] [PubMed] [Google Scholar]
- Kemerdere R, de Champfleur NM, Deverdun J, Cochereau J, Moritz-Gasser S, Herbet G, & Duffau H (2016). Role of the left frontal aslant tract in stuttering: a brain stimulation and tractographic study. Journal of Neurology, 263(1), 157–167. [DOI] [PubMed] [Google Scholar]
- Kronfeld-Duenias V, Amir O, Ezrati-Vinacour R, Civier O, & Ben-Shachar M (2016a). The frontal aslant tract underlies speech fluency in persistent developmental stuttering. Brain Structure and Function, 221(1), 365–381. [DOI] [PubMed] [Google Scholar]
- Kronfeld-Duenias V, Amir O, Ezrati-Vinacour R, Civier O, & Ben-Shachar M (2016b). Dorsal and ventral language pathways in persistent developmental stuttering. Cortex, 81, 79–92. [DOI] [PubMed] [Google Scholar]
- Leemans A, & Jones DK (2009). The B -matrix must be rotated when correcting for subject motion in DTI data. Magnetic Resonance in Medicine, 61(6), 1336–1349. [DOI] [PubMed] [Google Scholar]
- Lincoln M, Packman A, & Onslow M (2006). Altered auditory feedback and the treatment of stuttering: A review. Journal of Fluency Disorders, 31(2), 71–89. [DOI] [PubMed] [Google Scholar]
- Loucks TMJ, & De Nil LF (2006). Anomalous sensorimotor integration in adults who stutter: A tendon vibration study. Neuroscience Letters, 402(1–2), 195–200. [DOI] [PubMed] [Google Scholar]
- Lu C, Ning N, Peng D, Ding G, Li K, Yang Y, & Lin C (2009). The role of large-scale neural interactions for developmental stuttering. Neuroscience, 161(4), 1008–1026. [DOI] [PubMed] [Google Scholar]
- Lu C, Peng D, Chen C, Ning N, Ding G, Li K, Yang Y, & Lin C (2010). Altered effective connectivity and anomalous anatomy in the basal ganglia-thalamocortical circuit of stuttering speakers. Cortex, 46(1), 49–67. [DOI] [PubMed] [Google Scholar]
- Macleod J, Kalinowski J, Stuart A, & Armson J (1995). Effect of single and combined altered auditory feedback on stuttering frequency at two speech rates. Journal of Communication Disorders, 28(3), 217–228. [DOI] [PubMed] [Google Scholar]
- Max L, Guenther F, & Gracco V (2004). Unstable or insufficiently activated internal models and feedback-biased motor control as sources of dysfluency: A theoretical model of stuttering. Contemporary Issues in Communication Science and Disorders, 31, 105–122. [Google Scholar]
- Max L, & Yudman EM (2003). Accuracy and variability of isochronous rhythmic timing across motor systems in stuttering versus nonstuttering individuals. Journal of Speech, Language, and Hearing Research, 46(1), 146–163. [DOI] [PubMed] [Google Scholar]
- Mezer A, & Yeatman JD (2014). Quantifying the local tissue volume and composition in individual brains with MRI. Pediatric Nephrology, 29(7), 1231–1238.24504731 [Google Scholar]
- Misaghi E, Zhang Z, Gracco VL, De Nil LF, & Beal DS (2018). White matter tractography of the neural network for speech-motor control in children who stutter. Neuroscience Letters, 668(September 2017), 37–42. [DOI] [PMC free article] [PubMed] [Google Scholar]
- Moberget T, Karns CM, Deouell LY, Lindgren M, Knight RT, & Ivry R (2008). Detecting violations of sensory expectancies following cerebellar degeneration: A mismatch negativity study. Neuropsychologia, 46(10), 2569–2579. [DOI] [PMC free article] [PubMed] [Google Scholar]
- Molinari M, Leggio MG, Filippini V, Gioia MC, Cerasa A, & Thaut MH (2005). Sensorimotor transduction of time information is preserved in subjects with cerebellar damage. Brain Research Bulletin, 67(6), 448–458. [DOI] [PubMed] [Google Scholar]
- Molinari M, Leggio MG, & Thaut MH (2007). The cerebellum and neural networks for rhythmic sensorimotor synchronization in the human brain. Cerebellum, 6(1), 18–23. [DOI] [PubMed] [Google Scholar]
- Mori S, Crain BJ, Chacko VP, & Van Zijl PCM (1999). Three-dimensional tracking of axonal projections in the brain by magnetic resonance imaging. Annals of Neurology, 45(2), 265–269. [DOI] [PubMed] [Google Scholar]
- Neef NE, Anwander A, Bütfering C, Schmidt-Samoa C, Friederici AD, Paulus W, & Sommer M (2018). Structural connectivity of right frontal hyperactive areas scales with stuttering severity. Brain, 141(1), 191–204. [DOI] [PMC free article] [PubMed] [Google Scholar]
- Nichols TE, & Holmes AP (2002). Nonparametric permutation tests for functional neuroimaging: A primer with examples. Human Brain Mapping, 15(1), 1–25. [DOI] [PMC free article] [PubMed] [Google Scholar]
- O’Donnell JJ, Armson J, & Kiefte M (2008). The effectiveness of SpeechEasy during situations of daily living. Journal of Fluency Disorders, 33(2), 99–119. [DOI] [PubMed] [Google Scholar]
- Olander L, Smith A, & Zelaznik H (2010). Development of Stuttering. Journal of Speech Language and Hearing Research, 53(4), 876–886. [DOI] [PMC free article] [PubMed] [Google Scholar]
- Palesi F, De Rinaldis A, Castellazzi G, Calamante F, Muhlert N, Chard D, Tournier JD, Magenes G, D’Angelo E, & Wheeler-Kingshott CAMG (2017). Contralateral cortico-ponto-cerebellar pathways reconstruction in humans in vivo: Implications for reciprocal cerebro-cerebellar structural connectivity in motor and non-motor areas. Scientific Reports, 7(1), 1–13. [DOI] [PMC free article] [PubMed] [Google Scholar]
- Postma a, & Kolk H. (1993). The covert repair hypothesis: prearticulatory repair processes in normal and stuttered disfluencies. Journal of Speech and Hearing Research, 36(3), 472–487. [PubMed] [Google Scholar]
- Qi CH, Van Horn ML, Selig JP, & Kaiser AP (2020). Relations between language skills and problem behaviour in preschool children. Early Child Development and Care, 190(16), 2493–2504. [DOI] [PMC free article] [PubMed] [Google Scholar]
- Repp BH (2000). Compensation for subliminal timing perturbations in perceptual-motor synchronization. Psychological Research, 63(2), 106–128. [DOI] [PubMed] [Google Scholar]
- Repp BH (2001a). Phase correction, phase resetting, and phase shifts after subliminal timing perturbations in sensorimotor synchronization. Journal of Experimental Psychology: Human Perception and Performance, 27(3), 600–621. [PubMed] [Google Scholar]
- Repp BH (2001b). Processes underlying adaptation to tempo changes in sensorimotor synchronization. Human Movement Science, 20(3), 277–312. [DOI] [PubMed] [Google Scholar]
- Repp BH (2005). Sensorimotor synchronization: A review of the tapping literature. Psychonomic Bulletin and Review, 12(6), 969–992. [DOI] [PubMed] [Google Scholar]
- Repp BH, & Su YH (2013). Sensorimotor synchronization: A review of recent research (2006–2012). Psychonomic Bulletin and Review, 20(3), 403–452. [DOI] [PubMed] [Google Scholar]
- Riley GD (n.d.). SSI-4: Stuttering severity instrument for children and adults (4th ed.) (p. Austin, TX: ). [DOI] [PubMed] [Google Scholar]
- Riva-Posse P, Busto-Marolt L, Schteinschnaider Á, Martinez-Echenique L, Cammarota Á, & Merello M (2008). Phenomenology of abnormal movements in stuttering. Parkinsonism and Related Disorders, 14(5), 415–419. [DOI] [PubMed] [Google Scholar]
- Rohde GK, Barnett AS, Basser PJ, Marenco S, & Pierpaoli C (2004). Comprehensive approach for correction of motion and distortion in diffusion-weighted MRI. Magnetic Resonance in Medicine, 51(1), 103–114. [DOI] [PubMed] [Google Scholar]
- Sares AG, Deroche MLD, Ohashi H, Shiller DM, & Gracco VL (2020). Neural Correlates of Vocal Pitch Compensation in Individuals Who Stutter. Frontiers in Human Neuroscience, 14(February), 1–16. [DOI] [PMC free article] [PubMed] [Google Scholar]
- Sares AG, Deroche MLD, Shiller DM, & Gracco VL (2018). Timing variability of sensorimotor integration during vocalization in individuals who stutter. Scientific Reports, 8(1), 1–10. [DOI] [PMC free article] [PubMed] [Google Scholar]
- Sares AG, Deroche MLD, Shiller DM, & Gracco VL (2019). Adults who stutter and metronome synchronization: evidence for a nonspeech timing deficit. Annals of the New York Academy of Sciences, 1449(1), 56–69. [DOI] [PMC free article] [PubMed] [Google Scholar]
- Shadmehr R (2017). Learning to Predict and Control the Physics of Our Movements. The Journal of Neuroscience, 37(7), 1663–1671. [DOI] [PMC free article] [PubMed] [Google Scholar]
- Sommer M, Koch MA, Paulus W, Weiller C, & Büchel C (2002). Disconnection of speech-relevant brain areas in persistent developmental stuttering. Lancet, 360(9330), 380–383. [DOI] [PubMed] [Google Scholar]
- Tourville JA, & Guenther FH (2011). The DIVA model: A neural theory of speech acquisition and production. Language and Cognitive Processes, 26(7), 952–981. [DOI] [PMC free article] [PubMed] [Google Scholar]
- Travis KE, Ben-Shachar M, Myall NJ, & Feldman HM (2016). Variations in the neurobiology of reading in children and adolescents born full term and preterm. NeuroImage: Clinical, 11, 555–565. [DOI] [PMC free article] [PubMed] [Google Scholar]
- van de Vorst R, & Gracco VL (2017). Atypical non-verbal sensorimotor synchronization in adults who stutter may be modulated by auditory feedback. Journal of Fluency Disorders, 53(November 2016), 14–25. [DOI] [PubMed] [Google Scholar]
- Van der Steen MCM, & Keller PE (2013). The adaptation and anticipation model (ADAM) of sensorimotor synchronization. Frontiers in Human Neuroscience, 7(MAY), 1–15. [DOI] [PMC free article] [PubMed] [Google Scholar]
- Wakana S, Caprihan A, Panzenboeck MM, Fallon JH, Perry M, Gollub RL, Hua K, Zhang J, Jiang H, Dubey P, Blitz A, van Zijl P, & Mori S (2007). Reproducibility of quantitative tractography methods applied to cerebral white matter. NeuroImage, 36(3), 630–644. [DOI] [PMC free article] [PubMed] [Google Scholar]
- Watkins KE, Chesters J, & Connally E (2015). The neurobiology of developmental stuttering. In S. S Hickok G (Ed.), Neurobiology of language. (pp. 995–1004). Elsevier. [Google Scholar]
- Watkins KE, Smith SM, Davis S, & Howell P (2007). Structural and functional abnormalities of the motor system in developmental stuttering. Brain, 131(1), 50–59. [DOI] [PMC free article] [PubMed] [Google Scholar]
- Watkins KE, Smith SM, Davis S, & Howell P (2008). Structural and functional abnormalities of the motor system in developmental stuttering. Brain, 131(1), 50–59. [DOI] [PMC free article] [PubMed] [Google Scholar]
- Wiener M, Turkeltaub P, & Coslett HB (2010). The image of time: A voxel-wise meta-analysis. NeuroImage, 49(2), 1728–1740. [DOI] [PubMed] [Google Scholar]
- Wolpert DM, Miall RC, & Kawato M (1998). Internal models in the cerebellum. Trends in Cognitive Sciences, 2(9), 338–347. [DOI] [PubMed] [Google Scholar]
- Yablonski M, Menashe B, & Ben-Shachar M (2021). A general role for ventral white matter pathways in morphological processing: Going beyond reading. NeuroImage, 226(June 2020), 117577. [DOI] [PubMed] [Google Scholar]
- Yablonski M, Rastle K, Taylor JSH, & Ben-Shachar M (2018). Structural properties of the ventral reading pathways are associated with morphological processing in adult English readers. Cortex, 1–18. [DOI] [PubMed] [Google Scholar]
- Yairi E, & Ambrose N (2013). Epidemiology of stuttering: 21st century advances. Journal of Fluency Disorders, 38(2), 66–87. [DOI] [PMC free article] [PubMed] [Google Scholar]
- Yeatman JD, Dougherty RF, Myall NJ, Wandell BA, & Feldman HM (2012). Tract Profiles of White Matter Properties: Automating Fiber-Tract Quantification. PLoS ONE, 7(11), e49790. [DOI] [PMC free article] [PubMed] [Google Scholar]
- Yendiki A, Koldewyn K, Kakunoori S, Kanwisher N, & Fischl B (2014). Spurious group differences due to head motion in a diffusion MRI study. NeuroImage, 88, 79–90. [DOI] [PMC free article] [PubMed] [Google Scholar]
- Zatorre RJ, Chen JL, & Penhune VB (2007). When the brain plays music: Auditory-motor interactions in music perception and production. Nature Reviews Neuroscience, 8(7), 547–558. [DOI] [PubMed] [Google Scholar]
- Zimmermann G (1980a). Articulatory Behaviors Associated with Stuttering. Journal of Speech, Language, and Hearing Research, 23(1), 108–121. [DOI] [PubMed] [Google Scholar]
- Zimmermann G (1980b). Articulatory Dynamics of Fluent Utterances of Stutterers and Nonstutterers. Journal of Speech, Language, and Hearing Research, 23(1), 95–107. [DOI] [PubMed] [Google Scholar]
- Zimmermann G (1980c). Stuttering. Journal of Speech, Language, and Hearing Research, 23(1), 122–136. [PubMed] [Google Scholar]
Associated Data
This section collects any data citations, data availability statements, or supplementary materials included in this article.