

Abstract
Diagnostic accuracy, a measure of diagnostic tests for correctly identifying patients with or without a target disease, plays an important role in evidence-based medicine. Diagnostic accuracy of a new test ideally should be evaluated by comparing to a gold standard; however, in many medical applications it may be invasive, costly, or even unethical to obtain a gold standard for particular diseases. When the accuracy of a new candidate test under evaluation is assessed by comparison to an imperfect reference test, bias is expected to occur and result in either overestimates or underestimates of its true accuracy. In addition, diagnostic test studies often involve repeated measurements of the same patient, such as the paired eyes or multiple teeth, and generally lead to correlated and clustered data. Using the conventional statistical methods to estimate diagnostic accuracy can be biased by ignoring the within-cluster correlations. Despite numerous statistical approaches have been proposed to tackle this problem, the methodology to deal with correlated and clustered data in the absence of a gold standard is limited. In this paper, we propose a method based on the composite likelihood function to derive simple and intuitive closed-form solutions for estimates of diagnostic accuracy, in terms of sensitivity and specificity. Through simulation studies, we illustrate the relative advantages of the proposed method over the existing methods that simply treat an imperfect reference test as a gold standard in correlated and clustered data. Compared with the existing methods, the proposed method can reduce not only substantial bias, but also the computational burden. Moreover, to demonstrate the utility of this approach, we apply the proposed method to the study of National-Eye-Institute-funded Telemedicine Approaches to Evaluating of Acute-Phase Retinopathy of Prematurity (e-ROP), for estimating accuracies of both the ophthalmologist examination and the image evaluation.
Keywords: Composite likelihood, Diagnostic accuracy study, Gold standard, Imperfect reference test
1. Introduction
Diagnostic test accuracy plays a pivotal role in evidence-based medicine. Essentially, it provides evidence on how well a test correctly identifies patients with disease or those without disease, and therefore guides medical treatment decisions. In a study for evaluating performance of a new candidate diagnostic test, each patient should be examined by both a candidate diagnostic test and a gold standard which by definition provides 100% sensitivity and 100% specificity [1, 2, 3]. Then sensitivity and specificity of the new candidate diagnostic test could be easily estimated by the proportion of positive results of a candidate diagnostic test among subjects who have the disease and the proportion of negative results of a candidate diagnostic test among subjects who do not have the disease, respectively. In clinical practice, a gold standard may not be available for some diseases due to invasive, cost-prohibitive or inherent variability of findings on clinical examinations [4].
Although a gold standard may not be available in many medical circumstances, investigators commonly choose an imperfect reference in calculating sensitivity and specificity of a diagnostic accuracy. Obviously, such a procedure generally leads to errors with artifactual overestimates or underestimates of a candidate test’s true capabilities [5], and this leads to misclassification of the patient’s findings and likely affects treatment decisions and outcomes. To deal with this problem, Frequentist and Bayesian methods have been widely discussed in the literature. In particular, two models have been proposed to account for the absence of a gold standard, including a multivariate generalized linear mixed model [6] and a hierarchical summary receiver operating characteristic model [7], and the equivalence between these two models has been established [8]. Other possible settings include studies that rely on two or more imperfect reference tests to verify the capabilities of a candidate diagnostic test or studies that have multiple candidate diagnostic tests with an imperfect reference. In the former case, the composite reference test has been developed by Alonzo and Pepe [9]; particularly, this method results in a pseudo gold standard by combining information from multiple imperfect reference tests. The advantage of this method is to reduce the impact of misclassification of disease status by providing a fixed rule, where each individual patient in the study population is assigned a final diagnosis [10]. For the latter case, the latent class models have been developed for estimating diagnostic accuracy [11, 12], among others, but some possible limitations of the latent class approach are discussed in Pepe and Alonzo [13] and Albert and Dodd [14]. More recently, Wang and Zhou [15] proposed the use of latent profile approach, which allows for flexible biomarker distributions and incorporation of previous knowledge about risk factors, to assessing the accuracy of continuous biomarkers in the absence of a gold standard. However, the above-mentioned methods are not designed to determine diagnostic accuracy of correlated and clustered data in the absence of a gold standard.
The motivating study for this effort is the multi-center, National-Eye-Institute-funded Telemedicine Approaches to Evaluating of Acute-Phase Retinopathy of Prematurity (e-ROP). Retinopathy of Prematurity (ROP), an eye disease that occurs primarily in premature infants, is a leading cause of treatable blindness in premature children worldwide [16]. When infants with ROP are diagnosed in early stage, they can often be effectively treated with laser retinal ablative surgery or other treatments [17, 18]. In the e-ROP study, the enrolled infants underwent a serial diagnostic examination of both eyes by study-certified ophthalmologists (hereafter referred as the ophthalmologist examination), which is considered as the gold standard. At the same study session, a non-physician imager obtained six images of each eye of the infants and the images were uploaded to a central server for grading by trained non-physician readers. The ROP examination process is stressful for the infant and time-intensive for both the ophthalmologist and the imager. In addition, there is significant liability for both examinations and image evaluation [19, 20, 21].
However, a telemedicine-based digital retinal imaging evaluation to detect severe ROP is a reasonable alternative to the ophthalmologist examination in many circumstances such a limited availability of examiners or travel requirements for infants requiring examination. Using variously defined terms for determining such as referral-warranted ROP (defined as presence of ROP stage 3 or above, or plus disease, or Zone 1 ROP), images obtained by trained imagers and evaluated by trained readers have been shown effective in a series of studies [22]. Of importance in the e-ROP study and several other large ROP studies, the prevalence rates of severe ROP significantly differ between male and female infants. For example, the observed prevalence rates of severe ROP in the e-ROP study are respectively 17.0% and 12.8% for male and female infants. Additionally, sensitivities and specificities of both the ophthalmologist examination and the image evaluation in male and female infants are likely to be the same, respectively. It is well known that the ROP examination by study-certified ophthalmologists may vary within and across examiners [23].
Indeed, previous studies have shown that the agreement between two independent ophthalmologists is only moderate, indicating that the ophthalmologist examination does not constitute a gold standard [24]. Such moderate agreement may result from that ophthalmologists vary in their proficiency levels or utilize different internal thresholds to diagnose ROP disease, thereby leading to potential variations in sensitivity and specificity. This problem is related to the Hui-Walter paradigm [25]. Specifically, Hui and Walter [25] proposed a latent class model to estimate the accuracy of various diagnostic tests when the accuracy of a gold standard is not precisely known. In fact, the Hui-Walter approach makes the following three assumptions: (i) two diagnostic tests are both applied to two separate subpopulations with different disease prevalence rates; (ii) the results of one diagnostic test are assumed to be independent of the other ones within the diseased and the disease-free subpopulations; and (iii) the sensitivities and specificities of both diagnostic tests are assumed to be consistent among two different subpopulations. The Hui-Walter framework can be extended in a straightforward way to evaluate sensitivities and specificities of both the ophthalmologist examination and the image evaluation in the e-ROP study. Importantly, the e-ROP study involves correlated and clustered data since the paired eyes of each infant underwent both the ophthalmologist examination and the image evaluation, and the inter-eye correlations are very high for both diagnostic tests [26]. Therefore, such a strong inter-eye correlation in the e-ROP study needs to be considered while determining sensitivity and specificity of the ophthalmologist examination and the image evaluation.
The correlated and clustered data are common in medical applications, and they may arise in some other settings besides ophthalmic research. As an example, one setting is that multiple diagnostic tests are measured on the same individual patient or/and the same diagnostic test is repeatedly performed multiple times on the same individual patient, resulting in correlations within a patient. Intuitively, ignoring the correlation may lead to the underestimates of standard errors for diagnostic accuracies when the conventional statistical methods assuming independence of data are applied to correlated and clustered data. The existing literature on statistical methods for estimating accuracies of diagnostic tests have been extensively discussed when the correlated nature of the data within each patient exists [27, 28]. Among those, the random-effects models and the generalized estimating equations (GEE) [29, 30] are commonly used methods. The GEE approach is developed by using marginal models to estimate parameters of interest without the need of correctly specifying the full likelihood [29, 30]. Smith and Hadgu [31] and Sternberg and Hadgu [32] were the first to propose the use of GEE strategy and the robust variance estimates for estimating sensitivities and specificities of multiple diagnostic tests when the reference test was not subject to errors.
In this paper, we provide a way to estimate capabilities of a new candidate diagnostic test in ophthalmic applications when an imperfect reference is used in the evaluation; in other words, we extend the Hui-Walter framework to deal with correlated and clustered data. Specifically, the key contributions of this paper are twofold. Firstly, we develop an extension framework of the Hui-Walter paradigm based on the composite likelihood to reduce the potential bias caused by an imperfect reference test, where the composite likelihood approach is defined by adding together individual component log-likelihood, and each of which is a valid marginal or conditional log-likelihood [33, 34]. Secondly, we provide simple and intuitive closed-form solutions for estimating diagnostic accuracy for both the imperfect reference and a candidate test under evaluation. This method provides closed-form solutions for estimating diagnostic accuracy in terms of sensitivity and specificity. It also provides the estimate of disease prevalence rate, which can be clinically useful to estimate the predictive values (e.g., positive predictive value and negative predictive value) of a diagnostic test. Such a closed-form expression enables a significant reduction in computational complexity and time, compared to the standard analytical methods.
The rest of this paper is organized as follows. In Section 2, we present the proposed method for evaluating diagnostic test accuracy based on the composite likelihood inference. In Section 3, we conduct simulation studies to assess performances of the proposed method, compared with the existing methods. The use of the proposed method is illustrated in Section 4 through application to the e-ROP study. We provide a brief discussion on robustness and limitations with the proposed method in Section 5.
2. Statistical Methodology
In this section, we present the proposed method that extends the Hui-Walter framework to deal with correlated and clustered data, and derive the closed-form solutions for estimations of diagnostic test accuracy.
We consider a setting in which N subjects are sampled from G populations and evaluated for the presence or absence of a targeted disease by both a reference test (i.e., Test 1) and a candidate test under evaluation (i.e., Test 2). The reference test in this setting is not assumed as a gold standard. Let and denote binary test results of left- and right-eye from test h applied to subject i in the gth study population; specifically, (or ) = 1 indicates a positive result and (or ) = 0 indicates a negative result, where i = 1, 2, …, ng, g = 1, 2, …, G, and h = 1, 2. Let Zi denote the known population membership for subject i, and let Di denote the true disease status for subject i: Di = 1 if diseased and Di = 0 if non-diseased. Denote that and are separate sensitivity and specificity from test h in the gth study population.
Along the line of work by Hui and Walter [25], we make three assumptions, including (i) two diagnostic tests are conditionally independent given a true disease status, that is, ; (ii) sensitivity and specificity of test h are assumed to be the same across study populations, that is, Segh = Seh and Spgh = Sph; and (iii) disease prevalence rate, θg = Pr(D = 1|G = g), of study populations are all distinct. To mimic the e-ROP study, we consider G = 2 for illustration. Under the aforementioned assumptions, the standard full likelihood function based on the observed data is given by
Here ϕ = (Se1, Sp1, Se2, Sp2, θ1, θ2) is an unknown parameter vector, and ρ = (ρ1, ρ2) is an inter-eye correlation parameter vector with and . We note that modeling the correlation structure among these paired test results is fairly challenging. This is due to the fact that (i) the correlation structure may depend on unknown or unobserved disease status, that is, the correlation may be distinct if the infants have ROP disease than if not; and (ii) the correlation structure may be dependent on infants’ characteristics, such as birth weight, age and gender. In this paper, we aim to study a parsimonious modeling strategy, although we understand that there could be efficiency loss, compared to an (unknown) model that correctly characterizes a dependence structure.
To estimate these unknown parameters (ϕ, ρ), several statistical software programs, such as R and SAS, can be directly applied to maximize the standard full likelihood function through using the numerical methods. Despite the standard full likelihood is conceptually straightforward, it may encounter computational difficulties, such as non-convergence problem, singular covariance matrix and sensitive to the choice of initial values, due to high-dimensional integrals. Furthermore, modeling the complexity of a correlation structure for the repeated test results poses a challenge in the standard full likelihood function. To overcome such model and correlation complexity, we propose an alternative inference procedure that focuses on ϕ without inferring ρ. In other words, the used measures of diagnostic tests do not involve any inter-eye correlation parameters, thus we can re-write the standard full likelihood function and construct a composite likelihood function [33, 34] under the working independence assumption. The basic idea of the composite likelihood method is to construct a likelihood function by multiplying a set of marginal or conditional densities, which avoids specification of the full likelihood function [33, 34]. Specifically, letting ρ = (0, 0) in L(ϕ), we obtain the composite likelihood as
where (or ), are total counts of observed test outcomes j and j′ in tests (or ) and (or ) respectively: j = 1 if (or ) is positive and j′ = 1 if (or ) is positive; j = 1 if (or ) is positive and j′ = 0 if (or ) is negative, and so on. Also, is the joint probability of test results of the gth study population with outcomes j and j′ in tests Tg1 and Tg2, respectively. For g = 1, 2, we have the following marginal parameters
The maximum composite likelihood estimates of model parameters ϕ can be obtained by maximizing the composite log-likelihood function, logLc(ϕ). Indeed, this derived composite log-likelihood function is the same as the log-likelihood function that describes in the Hui-Walter framework; particularly, logLc(ϕ) is combined with pairs of test results for each subject into the log-likelihood components. Therefore, the maximum composite likelihood estimates of ϕ can be expressed in closed-forms, which are identical to the solutions in the Hui-Walter framework, and the closed-form solutions are given by
| (1) |
where
h = 1, 2, hc is the complement of h, and a dot in the place of a subscript indicates summation over the index. As shown in equation (1), the closed-form solutions can substantially reduce computational burden, compared to the numerical methods. Regarding the issue of model identifiability in the Hui-Walter framework, Duan et al. [?] proposed a method based on Gröbner basis to investigate its global identifiability. Briefly, the estimate of θ2 is uniquely determined, i.e., identifiable, if the two populations have different disease prevalence rates (i.e., θ1 ≠ θ2) and the sum of sensitivity and specificity does not equal to one in both populations (i.e., Seh + Sph ≠ 1, h = 1, 2). Additionally, in order to make sure θ2 is globally identifiable, the parameter space for θ2 should be restricted to either [0, 0.5] or [0.5, 1]. Once θ2 is uniquely identified, the other parameters can be found uniquely as function of θ2 obtained from solving the system of linear equations of Gröbner basis. We refer to Duan et al. [35] for more details.
The above composite log-likelihood function, logLc(ϕ), for the correlated and clustered data is not a true likelihood function, so the conventional covariance matrix estimator, such as the covariance estimator derived from the Hui-Walter paradigm, is no longer valid. Here we use the sandwich variance estimator for the covariance matrix [34]. Denote the maximum composite likelihood estimator by a solution of the score equation , , , , , and . By a Taylor expansion, the estimator is approximately normally with mean zero and symmetric covariance matrix Σ. A sketch of derivation for the covariance matrix is provided in the supplementary material.
3. Simulation Study
In this section, we conduct simulation studies with the primary aim to evaluate performance of the proposed method and to investigate model misspecification under different levels of inter-eye correlation structures for two diagnostic tests, including a reference test (i.e., Test 1) and a candidate test under evaluation (i.e., Test 2). All simulation scenarios are assumed to have two subpopulations (e.g., female and male) with population-specific disease prevalence rates, θ1 and θ2, respectively. For comparison purposes, we also implement two existing methods, including the GEE approach and the naive method. Specifically, the key assumptions for the use of GEE approach include (a) the reference test (i.e., Test 1) is treated as an error-free test in terms of Se1 = Sp1 = 1; and (b) the “working correlation matrix” is required to specify and the independent working correlation structure is assumed in all simulation studies. On the other hand, the naive method makes similar assumptions about that the reference test (i.e., Test 1) is assumed to be perfect, and the correlation between test results of left- and right-eyes is assumed to be independent. In all simulation studies, we generate the correlated binary data for each of the two diagnostic tests through the bindata package in R [36], where the correlated binary random variables are generated by thresholding a normal distribution. We apply the GEE approach via the use of the R package geepack [37].
Specifically, test outcomes of Tests 1 and 2 for each subject are assumed to be conditionally independent as given a disease status, and therefore they are generated separately. For test outcomes of Test 1, they are generated by allowing an inter-eye correlation: for the ith subject in the gth study population, if Di = 1, the joint distribution of follows a correlated binomial distribution with a correlation ρ1 and the marginal probabilities Se1 and Se1 for and , respectively; if Di = 0, the joint distribution of follows a correlated binomial distribution with the inter-eye correlation of ρ1, and and have marginal probabilities (1 − Sp1) and (1 − Sp1), respectively. We repeat the same procedure to generate test outcomes of Test 2 with an inter-eye correlation of ρ2, except that if Di = 1, the marginal probabilities are Se2 and Se2 for and , respectively; if Di = 0, the marginal probabilities are separate (1 − Sp2) and (1 − Sp2) for and .
In order to investigate impacts of error rates contained in the reference test, such as false positive and false negative rates, we consider two different scenarios in the simulation studies. In the first scenario, we set the parameters as ϕ = (Se1, Sp1, Se2, Sp2, θ1, θ2) = (0.90, 0.95, 0.90, 0.90, 0.15, 0.25). In the second scenario, there are larger errors contained in the reference test, i.e., ϕ = (Se1, Sp1, Se2, Sp2, θ1, θ2) = (0.80, 0.90, 0.90, 0.90, 0.15, 0.25). We consider a small, moderate, or a relatively large population with 200, 400, 800, and 1200 subjects. To evaluate the impact of inter-eye correlation structures, we let ρ1 = ρ2 take values of 0, 0.4, and 0.8 to represent different degrees of correlations between left- and right-eyes. For each simulation setting, we generate 1000 datasets. Each simulated dataset is analyzed by the following three methods, including the GEE approach, the naive method and the proposed method. The data are simulated in R (R Development Core Team, Version 4.0.3).
Tables 1 and 2 summarize biases, empirical standard errors, and model-based standard errors based on 1000 replicate datasets. The parameters of interest include sensitivities, specificities, and disease prevalences for two study subpopulations. As shown in Table 1, given a smaller sample size with N = 200, the proposed method has small biased estimates of parameters. While sample sizes become large (e.g., N = 800 and N = 1200), the parameter estimates are improved by using the proposed method: the estimates are nearly unbiased, and the standard errors are close to the empirical deviations, suggesting that the proposed method can effectively reduce bias introduced by an imperfect reference. Additionally, the proposed method is insensitive to misspecification of the inter-eye correlation structures. Furthermore, we observe that when sample size is relatively small, the proposed method has larger bias in estimated disease prevalence rates than the naïve method, while the sample size increases up to 800 or 1200, bias is reduced. Due to sampling variation, there are slightly different in estimates of two disease prevalence rates. Compared to the proposed method, the naive method that ignores both the imperfect reference test and inter-eye correlation yields relatively larger bias in estimates of parameters; particularly for the estimated sensitivity of the candidate test under evaluation (i.e., Test 2). Despite the sample sizes increase, bias is not significantly reduced by applying the naive method. Moreover, the GEE method that ignores the imperfect reference test gives similar results to the naive method.
Table 1.
Summary of 1, 000 simulations with 200, 400, 800, and 1200 subjects: bias (BIAS), empirical standard error (SE), and model-based standard error (MBSE) of estimates (Se1, Sp1, Se2, Sp2, θ1, θ2). Upper panel: the GEE method; middle panel: the naive method; bottom panel: the proposed method.
| Se1 = 0.90 | Sp1 = 0.95 | Se2 = 0.90 | Sp2 = 0.90 | θ1 = 0.15 | θ2 = 0.25 | |||||||||||||||
|---|---|---|---|---|---|---|---|---|---|---|---|---|---|---|---|---|---|---|---|---|
| N | ρ | Method | BIAS | SE | MBSE | BIAS | SE | MBSE | BIAS | SE | MBSE | BIAS | SE | MBSE | BIAS | SE | MBSE | BIAS | SE | MBSE |
| 200 | 0.0 | GEE | - | - | - | - | - | - | −0.14 | 0.065 | 0.079 | −0.02 | 0.025 | 0.026 | - | - | - | - | - | - |
| Naive | - | - | - | - | - | - | −0.15 | 0.048 | 0.048 | −0.02 | 0.048 | 0.018 | 0.03 | 0.033 | 0.034 | 0.01 | 0.041 | 0.040 | ||
| Proposed | −0.04 | 0.139 | 0.128 | 0.01 | 0.031 | 0.030 | −0.01 | 0.104 | 0.094 | 0.02 | 0.045 | 0.043 | 0.02 | 0.063 | 0.064 | 0.03 | 0.065 | 0.075 | ||
| 0.4 | GEE | - | - | - | - | - | - | −0.15 | 0.066 | 0.079 | −0.02 | 0.025 | 0.026 | - | - | - | - | - | - | |
| Naive | - | - | - | - | - | - | −0.15 | 0.056 | 0.055 | −0.02 | 0.056 | 0.022 | 0.03 | 0.035 | 0.036 | 0.01 | 0.042 | 0.042 | ||
| Proposed | −0.04 | 0.145 | 0.135 | 0.01 | 0.033 | 0.034 | −0.01 | 0.108 | 0.104 | 0.02 | 0.049 | 0.048 | 0.02 | 0.064 | 0.069 | 0.03 | 0.069 | 0.082 | ||
| 0.8 | GEE | - | - | - | - | - | - | −0.15 | 0.067 | 0.079 | −0.02 | 0.025 | 0.026 | - | - | - | - | - | - | |
| Naive | - | - | - | - | - | - | −0.15 | 0.063 | 0.061 | −0.02 | 0.063 | 0.024 | 0.03 | 0.037 | 0.037 | 0.01 | 0.044 | 0.043 | ||
| Proposed | −0.05 | 0.154 | 0.135 | 0.01 | 0.034 | 0.035 | −0.01 | 0.111 | 0.108 | 0.02 | 0.051 | 0.049 | 0.02 | 0.067 | 0.070 | 0.03 | 0.071 | 0.085 | ||
|
| ||||||||||||||||||||
| 400 | 0.0 | GEE | - | - | - | - | - | - | −0.15 | 0.045 | 0.056 | −0.02 | 0019 | 0.018 | - | - | - | - | - | - |
| Naive | - | - | - | - | - | - | −0.15 | 0.034 | 0.034 | −0.02 | 0.034 | 0.013 | 0.03 | 0.024 | 0.024 | 0.01 | 0.029 | 0.029 | ||
| Proposed | −0.03 | 0.119 | 0.126 | 0.01 | 0.028 | 0.028 | −0.01 | 0.094 | 0.090 | 0.01 | 0.037 | 0.044 | 0.01 | 0.049 | 0.057 | 0.02 | 0.054 | 0.067 | ||
| 0.4 | GEE | - | - | - | - | - | - | −0.15 | 0.046 | 0.056 | −0.02 | 0.019 | 0.018 | - | - | - | - | - | - | |
| Naive | - | - | - | - | - | - | −0.15 | 0.038 | 0.039 | −0.02 | 0.038 | 0.015 | 0.03 | 0.025 | 0.025 | 0.01 | 0.030 | 0.030 | ||
| Proposed | −0.03 | 0.130 | 0.129 | 0.01 | 0.029 | 0.030 | −0.02 | 0.097 | 0.097 | 0.02 | 0.042 | 0.042 | 0.02 | 0.053 | 0.057 | 0.02 | 0.056 | 0.068 | ||
| 0.8 | GEE | - | - | - | - | - | - | −0.15 | 0.046 | 0.056 | −0.02 | 0.019 | 0.018 | - | - | - | - | - | - | |
| Naive | - | - | - | - | - | - | −0.15 | 0.043 | 0.043 | −0.02 | 0.043 | 0.017 | 0.03 | 0.026 | 0.026 | 0.01 | 0.031 | 0.030 | ||
| Proposed | −0.03 | 0.136 | 0.114 | 0.01 | 0.030 | 0.032 | −0.01 | 0.100 | 0.106 | 0.02 | 0.045 | 0.040 | 0.02 | 0.055 | 0.057 | 0.02 | 0.060 | 0.068 | ||
|
| ||||||||||||||||||||
| 800 | 0.0 | GEE | - | - | - | - | - | - | −0.15 | 0.032 | 0.040 | −0.02 | 0.013 | 0.013 | - | - | - | - | - | - |
| Naive | - | - | - | - | - | - | −0.15 | 0.024 | 0.024 | −0.02 | 0.024 | 0.009 | 0.03 | 0.017 | 0.017 | 0.01 | 0.021 | 0.020 | ||
| Proposed | −0.01 | 0.098 | 0.096 | 0.00 | 0.023 | 0.023 | −0.01 | 0.081 | 0.077 | 0.01 | 0.029 | 0.029 | 0.01 | 0.037 | 0.039 | 0.01 | 0.042 | 0.047 | ||
| 0.4 | GEE | - | - | - | - | - | - | −0.15 | 0.032 | 0.040 | −0.02 | 0.013 | 0.013 | - | - | - | - | - | - | |
| Naive | - | - | - | - | - | - | −0.15 | 0.028 | 0.027 | −0.02 | 0.028 | 0.011 | 0.03 | 0.018 | 0.018 | 0.01 | 0.021 | 0.021 | ||
| Proposed | −0.02 | 0.107 | 0.103 | 0.01 | 0.025 | 0.025 | −0.01 | 0.085 | 0.083 | 0.01 | 0.033 | 0.032 | 0.01 | 0.039 | 0.042 | 0.01 | 0.046 | 0.051 | ||
| 0.8 | GEE | - | - | - | - | - | - | −0.15 | 0.032 | 0.040 | −0.02 | 0.013 | 0.013 | - | - | - | - | - | - | |
| Naive | - | - | - | - | - | - | −0.15 | 0.031 | 0.031 | −0.02 | 0.031 | 0.012 | 0.03 | 0.019 | 0.019 | 0.01 | 0.022 | 0.022 | ||
| Proposed | −0.02 | 0.114 | 0.109 | 0.01 | 0.026 | 0.027 | −0.01 | 0.089 | 0.089 | 0.01 | 0.035 | 0.035 | 0.01 | 0.041 | 0.045 | 0.02 | 0.048 | 0.055 | ||
|
| ||||||||||||||||||||
| 1200 | 0.0 | GEE | - | - | - | - | - | −0.14 | 0.026 | 0.032 | −0.02 | 0.010 | 0.011 | - | - | - | - | - | - | |
| Naive | - | - | - | - | - | - | −0.15 | 0.019 | 0.020 | −0.02 | 0.019 | 0.008 | 0.03 | 0.014 | 0.014 | 0.01 | 0.016 | 0.017 | ||
| Proposed | −0.01 | 0.088 | 0.085 | 0.00 | 0.020 | 0.020 | 0.00 | 0.069 | 0.070 | 0.01 | 0.025 | 0.024 | 0.01 | 0.031 | 0.032 | 0.01 | 0.038 | 0.040 | ||
| 0.4 | GEE | - | - | - | - | - | - | −0.15 | 0.026 | 0.032 | −0.02 | 0.010 | 0.011 | - | - | - | - | - | - | |
| Naive | - | - | - | - | - | - | −0.15 | 0.022 | 0.022 | −0.02 | 0.022 | 0.009 | 0.03 | 0.015 | 0.015 | 0.01 | 0.017 | 0.017 | ||
| Proposed | −0.01 | 0.099 | 0.089 | 0.00 | 0.023 | 0.022 | −0.01 | 0.079 | 0.073 | 0.01 | 0.029 | 0.027 | 0.01 | 0.035 | 0.035 | 0.01 | 0.042 | 0.043 | ||
| 0.8 | GEE | - | - | - | - | - | - | −0.15 | 0.025 | 0.032 | −0.02 | 0.011 | 0.011 | - | - | - | - | - | - | |
| Naive | - | - | - | - | - | - | −0.15 | 0.024 | 0.025 | −0.02 | 0.024 | 0.010 | 0.03 | 0.015 | 0.015 | 0.01 | 0.017 | 0.018 | ||
| Proposed | −0.01 | 0.106 | 0.098 | 0.00 | 0.024 | 0.024 | −0.01 | 0.083 | 0.078 | 0.01 | 0.032 | 0.030 | 0.01 | 0.038 | 0.038 | 0.01 | 0.045 | 0.047 | ||
Note “-” refers to that the reference test is treated as a gold standard.
Table 2.
Summary of 1, 000 simulations with 200, 400, 800, and 1200 subjects: bias (BIAS), empirical standard error (SE), and model-based standard error (MBSE) of estimates (Se1, Sp1, Se2, Sp2, θ1, θ2). Upper panel: the GEE method; middle panel: the naive method; bottom panel: the proposed method.
| Se1 = 0.80 | Sp1 = 0.90 | Se2 = 0.90 | Sp2 = 0.90 | θ1 = 0.15 | θ2 = 0.25 | |||||||||||||||
|---|---|---|---|---|---|---|---|---|---|---|---|---|---|---|---|---|---|---|---|---|
| N | ρ | Method | BIAS | SE | MBSE | BIAS | SE | MBSE | BIAS | SE | MBSE | BIAS | SE | MBSE | BIAS | SE | MBSE | BIAS | SE | MBSE |
| 200 | 0.0 | GEE | - | - | - | - | - | - | −0.26 | 0.068 | 0.088 | −0.04 | 0.028 | 0.028 | - | - | - | - | - | - |
| Naive | - | - | - | - | - | - | −0.27 | 0.052 | 0.054 | −0.04 | 0.052 | 0.020 | 0.06 | 0.033 | 0.033 | 0.03 | 0.038 | 0.038 | ||
| Proposed | 0.01 | 0.159 | 0.152 | 0.02 | 0.045 | 0.050 | −0.03 | 0.142 | 0.141 | 0.01 | 0.054 | 0.053 | 0.03 | 0.078 | 0.087 | 0.03 | 0.085 | 0.100 | ||
| 0.4 | GEE | - | - | - | - | - | - | −0.27 | 0.069 | 0.088 | −0.04 | 0.028 | 0.028 | - | - | - | - | - | - | |
| Naive | - | - | - | - | - | - | −0.27 | 0.059 | 0.060 | −0.04 | 0.059 | 0.024 | 0.06 | 0.036 | 0.036 | 0.02 | 0.041 | 0.041 | ||
| Proposed | 0.00 | 0.170 | 0.162 | 0.02 | 0.048 | 0.052 | −0.04 | 0.147 | 0.145 | 0.02 | 0.058 | 0.058 | 0.03 | 0.084 | 0.095 | 0.04 | 0.087 | 0.110 | ||
| 0.8 | GEE | - | - | - | - | - | - | −0.27 | 0.070 | 0.088 | −0.04 | 0.028 | 0.028 | - | - | - | - | - | - | |
| Naive | - | - | - | - | - | - | −0.27 | 0.066 | 0.066 | −0.04 | 0.066 | 0.026 | 0.06 | 0.040 | 0.039 | 0.02 | 0.043 | 0.043 | ||
| Proposed | 0.00 | 0.177 | 0.288 | 0.02 | 0.050 | 0.052 | −0.04 | 0.154 | 0.146 | 0.02 | 0.060 | 0.083 | 0.03 | 0.084 | 0.120 | 0.04 | 0.093 | 0.134 | ||
|
| ||||||||||||||||||||
| 400 | 0.0 | GEE | - | - | - | - | - | - | −0.27 | 0.049 | 0.062 | −0.04 | 0.020 | 0.020 | - | - | - | - | - | - |
| Naive | - | - | - | - | - | - | −0.27 | 0.038 | 0.038 | −0.04 | 0.038 | 0.015 | 0.06 | 0.024 | 0.024 | 0.02 | 0.027 | 0.027 | ||
| Proposed | 0.01 | 0.141 | 0.143 | 0.01 | 0.038 | 0.038 | −0.03 | 0.126 | 0.121 | 0.01 | 0.047 | 0.046 | 0.02 | 0.066 | 0.069 | 0.02 | 0.073 | 0.081 | ||
| 0.4 | GEE | - | - | - | - | - | - | −0.27 | 0.048 | 0.062 | −0.04 | 0.020 | 0.020 | - | - | - | - | - | - | |
| Naive | - | - | - | - | - | - | −0.27 | 0.041 | 0.042 | −0.04 | 0.041 | 0.017 | 0.05 | 0.026 | 0.026 | 0.02 | 0.029 | 0.029 | ||
| Proposed | 0.00 | 0.151 | 0.159 | 0.02 | 0.041 | 0.045 | −0.04 | 0.133 | 0.137 | 0.01 | 0.050 | 0.054 | 0.02 | 0.070 | 0.080 | 0.03 | 0.075 | 0.094 | ||
| 0.8 | GEE | - | - | - | - | - | - | −0.27 | 0.048 | 0.062 | −0.04 | 0.020 | 0.020 | - | - | - | - | - | - | |
| Naive | - | - | - | - | - | - | −0.27 | 0.046 | 0.047 | −0.04 | 0.046 | 0.019 | 0.05 | 0.027 | 0.027 | 0.02 | 0.031 | 0.031 | ||
| Proposed | 0.00 | 0.163 | 0.145 | 0.02 | 0.045 | 0.047 | −0.05 | 0.141 | 0.147 | 0.02 | 0.054 | 0.052 | 0.03 | 0.075 | 0.081 | 0.03 | 0.081 | 0.096 | ||
|
| ||||||||||||||||||||
| 800 | 0.0 | GEE | - | - | - | - | - | - | −0.27 | 0.036 | 0.044 | −0.04 | 0.014 | 0.014 | - | - | - | - | - | - |
| Naive | - | - | - | - | - | - | −0.27 | 0.027 | 0.027 | −0.04 | 0.027 | 0.010 | 0.05 | 0.017 | 0.017 | 0.03 | 0.020 | 0.019 | ||
| Proposed | 0.01 | 0.118 | 0.120 | 0.01 | 0.030 | 0.029 | −0.02 | 0.107 | 0.096 | 0.01 | 0.038 | 0.039 | 0.01 | 0.051 | 0.053 | 0.01 | 0.057 | 0.063 | ||
| 0.4 | GEE | - | - | - | - | - | - | −0.27 | 0.034 | 0.044 | −0.04 | 0.014 | 0.014 | - | - | - | - | - | - | |
| Naive | - | - | - | - | - | - | −0.27 | 0.030 | 0.030 | −0.04 | 0.030 | 0.012 | 0.05 | 0.018 | 0.018 | 0.03 | 0.020 | 0.020 | ||
| Proposed | 0.01 | 0.129 | 0.127 | 0.01 | 0.030 | 0.033 | −0.02 | 0.116 | 0.106 | 0.01 | 0.042 | 0.041 | 0.01 | 0.055 | 0.056 | 0.02 | 0.064 | 0.068 | ||
| 0.8 | GEE | - | - | - | - | - | - | −0.27 | 0.035 | 0.044 | −0.04 | 0.014 | 0.014 | - | - | - | - | - | - | |
| Naive | - | - | - | - | - | - | −0.27 | 0.034 | 0.033 | −0.04 | 0.034 | 0.013 | 0.05 | 0.020 | 0.019 | 0.03 | 0.022 | 0.022 | ||
| Proposed | 0.01 | 0.136 | 0.134 | 0.01 | 0.036 | 0.036 | −0.02 | 0.121 | 0.111 | 0.01 | 0.044 | 0.044 | 0.01 | 0.056 | 0.060 | 0.02 | 0.066 | 0.073 | ||
|
| ||||||||||||||||||||
| 1200 | 0.0 | GEE | - | - | - | - | - | - | −0.27 | 0.027 | 0.036 | −0.04 | 0.011 | 0.012 | - | - | - | - | - | - |
| Naive | - | - | - | - | - | - | −0.27 | 0.022 | 0.022 | −0.04 | 0.022 | 0.008 | 0.05 | 0.014 | 0.014 | 0.03 | 0.015 | 0.016 | ||
| Proposed | 0.01 | 0.108 | 0.106 | 0.01 | 0.025 | 0.025 | −0.01 | 0.092 | 0.090 | 0.00 | 0.032 | 0.032 | 0.01 | 0.043 | 0.043 | 0.01 | 0.051 | 0.053 | ||
| 0.4 | GEE | - | - | - | - | - | - | −0.27 | 0.028 | 0.036 | −0.04 | 0.011 | 0.012 | - | - | - | - | - | - | |
| Naive | - | - | - | - | - | - | −0.27 | 0.024 | 0.024 | −0.04 | 0.024 | 0.010 | 0.05 | 0.015 | 0.015 | 0.03 | 0.016 | 0.017 | ||
| Proposed | 0.01 | 0.117 | 0.112 | 0.01 | 0.029 | 0.029 | −0.01 | 0.102 | 0.098 | 0.01 | 0.036 | 0.036 | 0.01 | 0.049 | 0.048 | 0.01 | 0.056 | 0.059 | ||
| 0.8 | GEE | - | - | - | - | - | - | −0.27 | 0.027 | 0.036 | −0.04 | 0.011 | 0.012 | - | - | - | - | - | - | |
| Naive | - | - | - | - | - | - | −0.27 | 0.026 | 0.027 | −0.04 | 0.026 | 0.011 | 0.05 | 0.016 | 0.016 | 0.02 | 0.017 | 0.018 | ||
| Proposed | 0.01 | 0.126 | 0.124 | 0.01 | 0.031 | 0.031 | −0.02 | 0.108 | 0.101 | 0.01 | 0.040 | 0.039 | 0.01 | 0.053 | 0.052 | 0.01 | 0.062 | 0.064 | ||
Note “-” refers to that the standard test is treated as a gold standard.
Table 2 presents the results when the reference test has larger errors in the accuracy. We observe that the proposed method can reduce the bias even though the reference test is subject to larger errors in its accuracy. In contrast, the naive method and the GEE method have severe biases for the accuracy of the candidate test under evaluation. When the sample size increases, the naive method still has large bias in estimated disease prevalence rates. Both of GEE and naive methods are sensitive to the impact of test accuracy of the reference test. However, we note that the results from three methods are largely overlapping. This is because the estimation of diagnostic accuracies when the reference test is not a gold standard requires a very large sample size; see for example, earlier investigations [6, 8] including ours, whereas our sample size is moderate.
The proposed method complies with the Hui-Walter framework, assuming a conditional independence between Test 1 and Test 2, but the conditional independence assumption may be violated in practice. We conducted additional simulation studies, where Test 1 and Test 2 are correlated with Phi coefficients of 0.25 and 0.4. The results show estimates of sensitivities, specificities, and disease prevalence rates from all three methods are biased when two diagnostic tests are conditionally dependent. The detailed results are summarized in Tables S1 and S2 of the supplementary materials.
In summary, the above simulation results suggest that the proposed method can effectively reduce bias of diagnostic accuracy caused by the imperfect reference test, compared with the other two approaches. Although the GEE method as first described by Smith and Hadgu [31] and then by Sternberg and Hadgu [32] can account for the correlation between the tests, it was highly impacted by the accuracy of the reference test. Moreover, the estimation based on the proposed method is more robust to misspecification of inter-eye correlation structure, compared to the naive method.
4. Applications
In this section, we illustrate the application of the proposed method to the e-ROP study, which is a multicenter observational cohort study designed to evaluate the validity, reliability, feasibility, safety, as well as relative cost-effectiveness of a digital imaging system in infants with referral warranted-ROP (RW-ROP) [38]. The e-ROP study has enrolled 1284 premature infants with birth weight less than 1251g (mean birth weight 864g) across 13 clinical centers in North American. All infants underwent regularly scheduled diagnostic examinations by an ophthalmologist and digital imaging by non-physician staff using a wide-field digital camera. The images from each eye were graded by trained, masked, non-physician readers in a central reading center. For illustration, we collect test results from both ophthalmologist examination and image evaluation for each infant at their last visit. The cross-tabulation between the ophthalmologist examination and the image evaluation for RW-ROP in an eye is shown in Table 3 for 1192 eyes of 596 female infants and 1222 eyes of 611 male infants. Infants (N = 50) who had unknown status of RW-ROP from either ophthalmologist examination or image evaluation were not included in this analysis. In the e-ROP study, the observed prevalence rates of RW-ROP based on the ophthalmologist examination are 12.8% in female infants and 17.0% in male infants, and the observed inter-eye correlation for RW-ROP based on the ophthalmologist examination is approximately 0.9. Three required assumptions for applying our proposed method to the e-ROP study can be reasonably met. Firstly, because the ophthalmologist examinations were performed by ophthalmologists without access to the retinal images and the image evaluations were performed independently by trained non-physician graders who were masked to the findings of the ophthalmologist examination, it is anticipated that the e-ROP study meets the assumption of conditional independence between two tests given a disease status. Secondly, the mechanisms of RW-ROP and the characteristics of image are not dependent on gender, thus we can expect that sensitivity and specificity of clinical examination and image evaluation of RW-ROP in male and female infants are to be similar. Finally, the e-ROP study and several other large ROP studies [39, 40] support that the prevalence rates of ROP disease differ in male and female infants. With the naive method in which the ophthalmologist examination is considered as a gold standard and the inter-eye correlation is ignored, the estimates of sensitivity and specificity for the image evaluation are 88.3% (95% CI: 85.0% to 91.7%) and 91.6% (95% CI: 90.4% to 92.8%), respectively. The estimates of sensitivity and specificity for the image evaluation using the GEE method with the assumption of working independent correlation and the ophthalmologist examination as a gold standard are 88.3% (95% CI: 84.4% to 92.3%) and 91.6% (95% CI: 90.2% to 93.0%), respectively.
Table 3.
Cross-tabulation between the ophthalmologist examination and the image evaluation for detecting RW-ROP among female and male infants in the e-ROP Study (N = 1207).
| Ophthalmologist examination (T1) | Female infants |
Male infants |
||||
|---|---|---|---|---|---|---|
| Image evaluation (T2) |
Image evaluation (T2) |
|||||
| Positive | Negative | Total | Positive | Negative | Total | |
| Positive | 131 | 21 | 152 | 187 | 21 | 208 |
| Negative | 78 | 962 | 1040 | 95 | 919 | 1014 |
|
| ||||||
| Total | 209 | 983 | 1192 | 282 | 940 | 1222 |
Table 4 presents the estimated sensitivity and specificity obtained with the proposed method for both ophthalmologist examination and image evaluation, as well as the estimated prevalence rates of RW-ROP in female and male infants. The estimates of RW-ROP prevalence rates based on the proposed method are 14.8% (95% CI: 6.5% to 23.0%) and 20.6% (95% CI: 11.4% to 29.8%) for female and male infants, respectively. The results of ophthalmologist examination show lower sensitivity (75.1% with 95% CI: 44.5% to 100%) and higher specificity (98.1% with 95% CI: 94.4% to 100%), while the image evaluation has higher sensitivity (98.5% with 95% CI: 77.0% to 100%) and lower specificity (96.5% with 95% CI: 88.1% to 100%). It is not surprising that sensitivity from the image evaluation by non-physician graders is higher than the clinician’s examination for the detection of RW-ROP in this e-ROP study. Previous studies already found that trained readers have been very effective in identifying vision-threatening diabetic retinopathy and do as well as or better than ophthalmologists evaluating for diabetic retinopathy by the clinical examination [41]. In fact, non-physician readers may be less biased and perform more impartial grading than the physicians examining a patient. Additionally, we observe that the estimated confidence intervals for sensitivity are wide. One possible reason is that, due to the absence of a gold standard in the latent class modeling, the uncertainty in the final results may increase; this is particularly true for the limited sample sizes in those subjects with disease, as shown by the simulation studies and discussed in the literature [42, 43, 44]. Thus, large sample sizes are needed to increase the precision of these estimates. The results demonstrate that the evaluation of retinal images by non-physician trained grader provides higher sensitivity and slightly lower specificity than the ophthalmologist examination, bu both sensitivity and specificity estimates are higher than that of the naïve method. This finding is consistent with our earlier work and the telemedicine of other retinal diseases [45, 46, 47, 48].
Table 4.
The estimated sensitivity and specificity of the ophthalmologist examination and the image evaluation for detecting referral-warranted ROP and the estimated prevalence rate of referral-warranted ROP, with 95% confidence intervals.
| Diagnostic tests | Sensitivity | Specificity | Subpopulations | Prevalence |
|---|---|---|---|---|
| Ophthalmologist examination (T1) | 75.1% | 98.1% | Female | 14.8% |
| (44.5% to 100%) | (94.4% to 100%) | (6.5% to 23.0%) | ||
| Image evaluation (T2) | 98.5% | 96.5% | Male | 20.6% |
| (77.0% to 100%) | (88.1% to 100%) | (11.4% to 29.8%) |
To interpret the clinically meaningful indices, PPV and NPV, of a particular diagnostic test, it is critically important for clinicians to estimate the likelihood of the condition in a subject of a specific population. In clinical practice, a high NPV is required for a diagnostic test to be useful in ruling out the disease, while a high PPV is required for a diagnostic test to be useful in detecting the disease. Figure 1 presents the estimated PPV and NPV with a given prevalence rate (ranging from 0% to 100%), and their point-wise 95% confidence intervals. These plots for the wide range of clinically likely levels of disease prevalence depict the relationship between prevalence rate of RW-ROP and predictive values for a test. As shown in Figure 1, we observe that the ophthalmologist examination has the estimated overall PPV of 87.2% (95% CI: 82.0% to 91.1%) and NPV of 95.7% (95% CI: 69.2% to 99.6%) when the estimated prevalence rate of RW-ROP is given as 15%. In Figure 2, the image evaluation yields the overall PPV of 83.3% (95%CI: 79.8% to 86.3%) and NPV of 99.7% (95% CI: 0% to 100%) when the estimated prevalence rate of RW-ROP is given by 15%. We note that the estimated overall NPV for the image evaluation has a wide 95% confidence interval. This can be explained due to that the estimated sensitivity of the image evaluation is likely to very large, and thus (1-sensitivity) is relatively small. When the estimated sensitivity of the image evaluation is close to 1 and the number of false negatives is small, it could lead to large variance in log{(1-sensitivity)/specificity} [28] as well as log(1-sensitivity). As such, the variance of NPV is dominated by a large variance on estimating log(1-sensitivity), leading to a wide 95% confidence interval [27].
Figure 1.
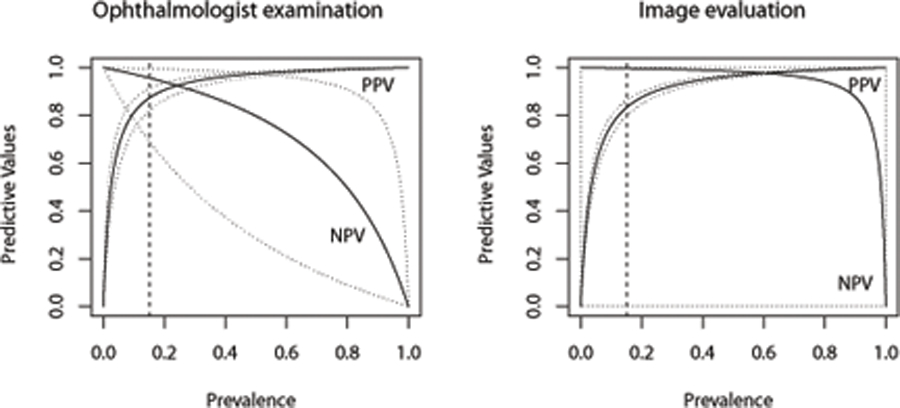
Overall PPV and NPV plots for the ophthalmologist examination (left panel) with sensitivity of 75.11% and specificity of 98.06% in the theoretical populations with disease prevalences of 0% to 100%, and the image evaluation(right panel) with sensitivity of 98.50% and specificity of 96.51% in the theoretical populations with disease prevalences of 0% to 100%.
Figure 2.
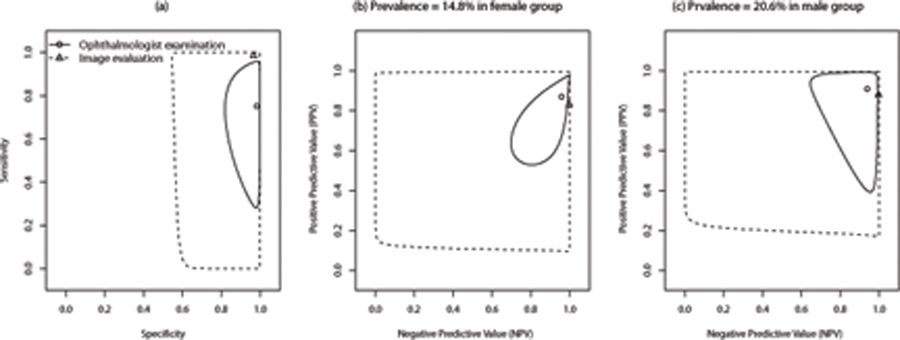
(A) All premature infants, (B) Prevalence=14.8% in female group, (C) prevalence=20.6% in male group
5. Discussion
We have demonstrated that the proposed method based on a composite likelihood can estimate diagnostic test accuracy in the presence of both the imperfect reference test and the inter-eye correlation, and gain computational efficiency due to its closed-form solutions. We have conducted simulation studies to evaluate the utility of the proposed approach in bias reduction, under various scenarios of classification error rates of a reference test and magnitude of inter-eye correlations. The simulation studies indicate that the proposed method can effectively reduce bias introduced by an imperfect reference test, compared to the naive method that simply treats a reference test as gold standard. Moreover, the proposed method is robust to misspecification of inter-eye correlation structures, even in the settings with strong inter-eye correlations. Similar frameworks based on the composite likelihood have been widely applied to deal with complex correlated structures. For example, Gao and Song [49] proposed the use of Expectation-Maximization (EM) algorithm to the framework of composite likelihood to estimate transition probabilities in a multivariate hidden Markov model, given missing data or latent variables. They showed that their procedure based on composite likelihoods can gain not only computational feasibility but also computational efficiency [49].
Despite the advantages of the proposed composite likelihood method, there are several possible limitations in this work. First, regarding small sample variance estimates, the sandwich variance estimator has been shown to be underestimated when a study yields small sample sizes. For example, when no inter-eye correlations exist, the simulation studies indicate that the Hui-Walter framework produced larger model-based standard errors compared to the proposed method, particularly for small sample sizes (not shown in Tables 1 and 2). In other words, the proposed method that uses the sandwich variance estimator could be underestimated when a study yields small sample sizes. Although various bias-corrected sandwich estimator methods have been proposed to improve small sample performance for generalized estimating equations [50, 51, 52, 53], such correction methods on variance estimators are not considered in this work. Second, in this study, we do not account for potential heterogeneity between study sites. The prevalence of other risk factors may vary across study sites, potentially leading to variation in diagnostic test accuracy. Such an issue should be investigated in future work. Third, another limitation is that the two diagnostic tests (i.e., the ophthalmologist examination and the image evaluation) are assumed to be conditionally independent in this work. Indeed, the conditional independence assumption can be made in a more flexible way; in other words, the conditional independence of two diagnostic tests could be assumed in either non-diseased subjects or diseased subjects, but not both populations, and the choice could be based on the clinical context and the technology of diagnostic tests. Nevertheless, in some other situations, this assumption may be not hold [54]. As discussed by Vacek [55] and other authors [56, 57], the classification error rates, including false positive and false negative rates, for both diagnostic tests may be substantial underestimated in the Hui-Walter latent class model if the conditional dependence between two diagnostic tests is not properly specified. The simulation studies show that, when the two diagnostic tests are correlated, the proposed method could lead to biased estimates of diagnostic accuracy. To the best of our knowledge, several methods have been proposed with various dependence models to relax this assumption for multiple diagnostic tests when the reference test is a gold standard [58, 54, 11]. However, properly accounting for conditional dependence remains challenging, for example, Albert and Dodd [14, 59] showed that selecting adequate models for dependence structures is difficult in most practical situations. Fourth, the composite likelihood approach for the correlated and clustered data is based on a per subject analysis of disease because the ROP disease always affects either both eyes or neither of them for each subject. For other clustered datasets, however, a per location analysis may be more appropriate than a per subject analysis when disease is localized and can be treated with local treatment delivery. For example, in a diagnostic test accuracy study of a mammography system for detecting breast cancer, a per breast analysis is more appropriate than a per subject analysis because breast cancer typically is found in only one of the two breasts and the surgical treatment is local to that breast, e.g., cancerous tissue is excised. Such an example of a comparative accuracy study is the difference in accuracy between radiologist evaluations based on the mammography system alone and their evaluations based on the mammography system and the output of a computer assisted detection (CAD) algorithm applied to the mammograms.
Most previously published studies involving telemedicine-based digital retinal imaging for ROP diagnosis have compared the results to a reference test of ophthalmologist examination [60, 61, 62], and the evidence indicates that the digital retinal imaging has great potential in detecting potentially severe ROP in premature infants. We believe that our findings are important for implementation of a telemedicine system and can facilitate the development of new diagnostic tests for detecting potentially severe ROP, especially in the presence of an imperfect reference test. Moreover, incorporating the proposed approach with other possible factors, such as demographic and other clinical characteristics, can provide a higher likelihood of early detection and timely treatment of severe ROP for clinicians. We believe the proposed method can also be applied to other areas of medicine and help to characterize better the diagnostic accuracy of new tests that may otherwise be missed by the conventional methods.
Supplementary Material
Acknowledgements
The authors would like to thank the editor and anonymous reviewers for their constructive comments. This work was supported by NIH grants: U10 EY017014 (for G.Y. and G.E.Q.), R21 EY025686 (for G.Y. and G.E.Q), R01 AI130460 (for Y.C.), and R01 LM012607 (for Y.C.).
Data availability statement
The data used in this manuscript are available on request from the National-Eye-Institute-funded Telemedicine Approaches to Evaluating of Acute-Phase Retinopathy of Prematurity (e-ROP) study team upon reasonable request. The data are not publicly available due to privacy or ethical restrictions.
References
- 1.Guyatt GH, Tugwell P, Feeny D, Haynes R, Drummond M. A framework for clinical evaluation of diagnostic technologies. CMAJ: Canadian Medical Association Journal 1986; 134(6):587. [PMC free article] [PubMed] [Google Scholar]
- 2.Knottnerus JA, Begg C, Bossuyt P, Buntinx F, Deville W, Dinant G, Eijkemans R, Feinstein A, Gatsonis C, Glasziou P. The evidence base of clinical diagnosis BMJ books London, 2002. [Google Scholar]
- 3.Bossuyt PM, Reitsma JB, Bruns DE, Gatsonis CA, Glasziou PP, Irwig LM, Moher D, Rennie D, De Vet HC, Lijmer JG. The stard statement for reporting studies of diagnostic accuracy: explanation and elaboration. Annals of Internal Medicine 2003; 138(1):W1–12. [DOI] [PubMed] [Google Scholar]
- 4.Joseph L, Gyorkos TW, Coupal L. Bayesian estimation of disease prevalence and the parameters of diagnostic tests in the absence of a gold standard. American Journal of Epidemiology 1995; 141(3):263–272. [DOI] [PubMed] [Google Scholar]
- 5.Rutjes AW, Reitsma JB, Di Nisio M, Smidt N, Van Rijn JC, Bossuyt PM. Evidence of bias and variation in diagnostic accuracy studies. Canadian Medical Association Journal 2006; 174(4):469–476. [DOI] [PMC free article] [PubMed] [Google Scholar]
- 6.Chu H, Chen S, Louis TA. Random effects models in a meta-analysis of the accuracy of two diagnostic tests without a gold standard. Journal of the American Statistical Association 2009; 104(486):512–523. [DOI] [PMC free article] [PubMed] [Google Scholar]
- 7.Dendukuri N, Schiller I, Joseph L, Pai M. Bayesian meta-analysis of the accuracy of a test for tuberculous pleuritis in the absence of a gold standard reference. Biometrics 2012; 68(4):1285–1293. [DOI] [PMC free article] [PubMed] [Google Scholar]
- 8.Liu Y, Chen Y, Chu H. A unification of models for meta-analysis of diagnostic accuracy studies without a gold standard. Biometrics 2015; 71(2):538–547. [DOI] [PMC free article] [PubMed] [Google Scholar]
- 9.Alonzo TA, Pepe MS, et al. Using a combination of reference tests to assess the accuracy of a new diagnostic test. Statistics in Medicine 1999; 18(22):2987–3003. [DOI] [PubMed] [Google Scholar]
- 10.Naaktgeboren CA, Bertens LC, van Smeden M, de Groot JA, Moons KG, Reitsma JB. Value of composite reference standards in diagnostic research. Bmj 2013; 347:f5605. [DOI] [PubMed] [Google Scholar]
- 11.Qu Y, Tan M, Kutner MH. Random effects models in latent class analysis for evaluating accuracy of diagnostic tests. Biometrics 1996; :797–810. [PubMed]
- 12.Hui SL, Zhou XH. Evaluation of diagnostic tests without gold standards. Statistical Methods in Medical Research 1998; 7(4):354–370. [DOI] [PubMed] [Google Scholar]
- 13.Pepe MS, Alonzo TA. Comparing disease screening tests when true disease status is ascertained only for screen positives. Biostatistics 2001; 2(3):249–260. [DOI] [PubMed] [Google Scholar]
- 14.Albert PS, Dodd LE. A cautionary note on the robustness of latent class models for estimating diagnostic error without a gold standard. Biometrics 2004; 60(2):427–435. [DOI] [PubMed] [Google Scholar]
- 15.Wang Z, Zhou XH, et al. Biomarker assessment and combination with differential covariate effects and an unknown gold standard, with an application to alzheimer’s disease. The Annals of Applied Statistics 2018; 12(2):1204–1227. [Google Scholar]
- 16.Gilbert C Retinopathy of prematurity: a global perspective of the epidemics, population of babies at risk and implications for control. Early Human Development 2008; 84(2):77–82. [DOI] [PubMed] [Google Scholar]
- 17.Schaffer D, Palmer E, Plotsktz H, Metz H, Flynn J, Tung B. Cryotherapy retinopathy of prematurity cooperative group-multicenter trial of for retinopathy of prematurity-prognostic factors in the natural course of retinopathy of prematurity. Ophthalmology 1993; 100:230–237. [DOI] [PubMed] [Google Scholar]
- 18.Good WV, Hardy RJ. The multicenter study of early treatment for retinopathy of prematurity (etrop). Ophthalmology 2001; 108(6):1013–1014. [DOI] [PubMed] [Google Scholar]
- 19.Yen KG, Hess D, Burke B, Johnson R, Feuer WJ, Flynn J. The optimum time to employ telephotoscreening to detect retinopathy of prematurity. Transactions of the American Ophthalmological Society 2000; 98:145. [PMC free article] [PubMed] [Google Scholar]
- 20.Richter GM, Williams SL, Starren J, Flynn JT, Chiang MF. Telemedicine for retinopathy of prematurity diagnosis: evaluation and challenges. Survey of Ophthalmology 2009; 54(6):671–685. [DOI] [PMC free article] [PubMed] [Google Scholar]
- 21.Ying GS, Quinn GE, Wade KC, Repka MX, Baumritter A, Daniel E. Predictors for the development of referral-warranted retinopathy of prematurity in the telemedicine approaches to evaluating acute-phase retinopathy of prematurity (e-rop) study. JAMA Ophthalmology 2015; 133(3):304–311. [DOI] [PMC free article] [PubMed] [Google Scholar]
- 22.Quinn GE, Vinekar A. The role of retinal photography and telemedicine in rop screening. Seminars in Perinatology, Elsevier, 2019. [DOI] [PubMed] [Google Scholar]
- 23.Shah PK, Prabhu V, Karandikar SS, Ranjan R, Narendran V, Kalpana N. Retinopathy of prematurity: past, present and future. World Journal of Clinical Pediatrics 2016; 5(1):35. [DOI] [PMC free article] [PubMed] [Google Scholar]
- 24.Reynolds JD, Dobson V, Quinn GE, Fielder AR, Palmer EA, Saunders RA, Hardy RJ, Phelps DL, Baker JD, Trese MT, et al. Evidence-based screening criteria for retinopathy of prematurity: natural history data from the cryo-rop and light-rop studies. Archives of Ophthalmology 2002; 120(11):1470–1476. [DOI] [PubMed] [Google Scholar]
- 25.Hui SL, Walter SD. Estimating the error rates of diagnostic tests. Biometrics 1980; :167–171. [PubMed]
- 26.Ying Gs, Pan W, Quinn GE, Daniel E, Repka MX, Baumritter A, et al. Intereye agreement of retinopathy of prematurity from image evaluation in the telemedicine approaches to evaluating of acute-phase rop (e-rop) study. Ophthalmology Retina 2017; 1(4):347–354. [DOI] [PMC free article] [PubMed] [Google Scholar]
- 27.Pepe MS, et al. The statistical evaluation of medical tests for classification and prediction Medicine, 2003.
- 28.Zhou XH, McClish DK, Obuchowski NA. Statistical methods in diagnostic medicine, vol. 569. John Wiley & Sons, 2009. [Google Scholar]
- 29.Liang KY, Zeger SL. Longitudinal data analysis using generalized linear models. Biometrika 1986; 73(1):13–22. [Google Scholar]
- 30.Zeger SL, Liang KY. Longitudinal data analysis for discrete and continuous outcomes. Biometrics 1986; :121–130. [PubMed]
- 31.Smith PJ, Hadgu A. Sensitivity and specificity for correlated observations. Statistics in Medicine 1992; 11(11):1503–1509. [DOI] [PubMed] [Google Scholar]
- 32.Sternberg MR, Hadgu A. A gee approach to estimating sensitivity and specificity and coverage properties of the confidence intervals. Statistics in Medicine 2001; 20(9–10):1529–1539. [DOI] [PubMed] [Google Scholar]
- 33.Lindsay BG. Composite likelihood methods. Contemporary mathematics 1988; 80(1):221–39. [Google Scholar]
- 34.Varin C, Reid N, Firth D. An overview of composite likelihood methods. Statistica Sinica 2011; :5–42.
- 35.Duan R, Cao M, Ning Y, Zhu M, Zhang B, McDermott A, Chu H, Zhou X, Moore JH, Ibrahim JG, et al. Global identifiability of latent class models with applications to diagnostic test accuracy studies: A gröbner basis approach. Biometrics 2020; 76(1):98–108. [DOI] [PMC free article] [PubMed] [Google Scholar]
- 36.Leisch F, Weingessel A, Hornik K. Bindata: Generation of artificial binary data. R package version 0.9–12 2005;.
- 37.Halekoh U, Højsgaard S, Yan J, et al. The r package geepack for generalized estimating equations. Journal of Statistical Software 2006; 15(2):1–11. [Google Scholar]
- 38.Quinn GE, Ying Gs, Daniel E, Hildebrand PL, Ells A, Baumritter A, Kemper AR, Schron EB, Wade K. Validity of a telemedicine system for the evaluation of acute-phase retinopathy of prematurity. JAMA Ophthalmology 2014; 132(10):1178–1184. [DOI] [PMC free article] [PubMed] [Google Scholar]
- 39.Ying GS, Bell EF, Donohue P, Tomlinson LA, Binenbaum G, Group GRR. Perinatal risk factors for the retinopathy of prematurity in postnatal growth and rop study. Ophthalmic Epidemiology 2019; 26(4):270–278. [DOI] [PubMed] [Google Scholar]
- 40.Husain SM, Sinha AK, Bunce C, Arora P, Lopez W, Mun KS, Reddy MA, Adams GG. Relationships between maternal ethnicity, gestational age, birth weight, weight gain, and severe retinopathy of prematurity. The Journal of Pediatrics 2013; 163(1):67–72. [DOI] [PubMed] [Google Scholar]
- 41.Hutchinson A, McIntosh A, Peters J, O’keeffe C, Khunti K, Baker R, Booth A. Effectiveness of screening and monitoring tests for diabetic retinopathy–a systematic review. Diabetic Medicine 2000; 17(7):495–506. [DOI] [PubMed] [Google Scholar]
- 42.Collins LM, Fidler PL, Wugalter SE, Long JD. Goodness-of-fit testing for latent class models. Multivariate Behavioral Research 1993; 28(3):375–389. [DOI] [PubMed] [Google Scholar]
- 43.Lin TH, Dayton CM. Model selection information criteria for non-nested latent class models. Journal of Educational and Behavioral Statistics 1997; 22(3):249–264. [Google Scholar]
- 44.Nylund KL, Asparouhov T, Muthen BO. Deciding on the number of classes in latent class analysis and growth mixture modeling: A monte carlo simulation study. Structural Equation Modeling: A Multidisciplinary Journal 2007; 14(4):535–569. [Google Scholar]
- 45.Quinn GE, Ells A, Capone A, Hubbard GB, Daniel E, Hildebrand PL, Ying Gs. Analysis of discrepancy between diagnostic clinical examination findings and corresponding evaluation of digital images in the telemedicine approaches to evaluating acute-phase retinopathy of prematurity study. JAMA Ophthalmology 2016; 134(11):1263–1270. [DOI] [PMC free article] [PubMed] [Google Scholar]
- 46.Mansberger SL, Sheppler C, Barker G, Gardiner SK, Demirel S, Wooten K, Becker TM. Long-term comparative effectiveness of telemedicine in providing diabetic retinopathy screening examinations: a randomized clinical trial. JAMA Ophthalmology 2015; 133(5):518–525. [DOI] [PMC free article] [PubMed] [Google Scholar]
- 47.Shi L, Wu H, Dong J, Jiang K, Lu X, Shi J. Telemedicine for detecting diabetic retinopathy: a systematic review and meta-analysis. British Journal of Ophthalmology 2015; 99(6):823–831. [DOI] [PMC free article] [PubMed] [Google Scholar]
- 48.Silva PS, Aiello LP. Telemedicine and eye examinations for diabetic retinopathy: a time to maximize real-world outcomes. JAMA Ophthalmology 2015; 133(5):525–526. [DOI] [PubMed] [Google Scholar]
- 49.Gao X, Song PXK. Composite likelihood em algorithm with applications to multivariate hidden markov model. Statistica Sinica 2011; :165–185.
- 50.Mancl LA, DeRouen TA. A covariance estimator for gee with improved small-sample properties. Biometrics 2001; 57(1):126–134. [DOI] [PubMed] [Google Scholar]
- 51.O’Brien LM, Fitzmaurice GM. Analysis of longitudinal multiple-source binary data using generalized estimating equations. Journal of the Royal Statistical Society: Series C (Applied Statistics) 2004; 53(1):177–193. [Google Scholar]
- 52.Bell ML, Grunwald GK. Small sample estimation properties of longitudinal count models. Journal of Statistical Computation and Simulation 2011; 81(9):1067–1079. [Google Scholar]
- 53.Li P, Redden DT. Small sample performance of bias-corrected sandwich estimators for cluster-randomized trials with binary outcomes. Statistics in Medicine 2015; 34(2):281–296. [DOI] [PMC free article] [PubMed] [Google Scholar]
- 54.Dendukuri N, Joseph L. Bayesian approaches to modeling the conditional dependence between multiple diagnostic tests. Biometrics 2001; 57(1):158–167. [DOI] [PubMed] [Google Scholar]
- 55.Vacek PM. The effect of conditional dependence on the evaluation of diagnostic tests. Biometrics 1985; :959–968. [PubMed]
- 56.Brenner H How independent are multiple ‘independent’ diagnostic classifications? Statistics in Medicine 1996; 15(13):1377–1386. [DOI] [PubMed] [Google Scholar]
- 57.Torrance-Rynard VL, Walter SD. Effects of dependent errors in the assessment of diagnostic test performance. Statistics in medicine 1997; 16(19):2157–2175. [DOI] [PubMed] [Google Scholar]
- 58.Georgiadis MP, Johnson WO, Gardner IA, Singh R. Correlation-adjusted estimation of sensitivity and specificity of two diagnostic tests. Journal of the Royal Statistical Society: Series C (Applied Statistics) 2003; 52(1):63–76. [Google Scholar]
- 59.Albert PS, Dodd LE. On estimating diagnostic accuracy from studies with multiple raters and partial gold standard evaluation. Journal of the American Statistical Association 2008; 103(481):61–73. [DOI] [PMC free article] [PubMed] [Google Scholar]
- 60.Roth DB, Morales D, Feuer WJ, Hess D, Johnson RA, Flynn JT. Screening for retinopathy of prematurity employing the retcam 120: sensitivity and specificity. Archives of Ophthalmology 2001; 119(2):268–272. [PubMed] [Google Scholar]
- 61.Chiang MF, Starren J, Du YE, Keenan JD, Schiff WM, Barile GR, Li J, Johnson RA, Hess DJ, Flynn JT. Remote image based retinopathy of prematurity diagnosis: a receiver operating characteristic analysis of accuracy. British Journal of Ophthalmology 2006; 90(10):1292–1296. [DOI] [PMC free article] [PubMed] [Google Scholar]
- 62.Richter GM, Sun G, Lee TC, Chan RP, Flynn JT, Starren J, Chiang MF. Speed of telemedicine vs ophthalmoscopy for retinopathy of prematurity diagnosis. American Journal of Ophthalmology 2009; 148(1):136–142. [DOI] [PMC free article] [PubMed] [Google Scholar]
Associated Data
This section collects any data citations, data availability statements, or supplementary materials included in this article.
Supplementary Materials
Data Availability Statement
The data used in this manuscript are available on request from the National-Eye-Institute-funded Telemedicine Approaches to Evaluating of Acute-Phase Retinopathy of Prematurity (e-ROP) study team upon reasonable request. The data are not publicly available due to privacy or ethical restrictions.