

Abstract
The fathead minnow is a widely used model organism in environmental toxicology. The lack of a high-quality fathead minnow reference genome, however, has severely hampered its uses in toxicogenomics. We present the de novo assembly and annotation of the fathead minnow genome using long PacBio reads, Bionano and Hi-C scaffolding data, and large RNA-sequencing data sets from different tissues and life stages. The new annotated fathead minnow reference genome has a scaffold N50 of 12.0 Mbp and a complete benchmarking universal single-copy orthologs score of 95.1%. The completeness of annotation for the new reference genome is comparable to that of the zebrafish GRCz11 reference genome. The fathead minnow genome, revealed to be highly repetitive and sharing extensive syntenic regions with the zebrafish genome, has a much more compact gene structure than the zebrafish genome. Particularly, comparative genomic analysis with zebrafish, mouse, and human showed that fathead minnow homologous genes are relatively conserved in exon regions but had strikingly shorter intron regions. The new fathead minnow reference genome and annotation data, publicly available from the National Center for Biotechnology Information and the University of California Santa Cruz genome browser, provides an essential resource for aquatic toxicogenomic studies in ecotoxicology and public health.
Keywords: Fathead minnow, Genome assembly, Zebrafish, Gene structure, Toxicogenomics, Comparative genomics
INTRODUCTION
The fathead minnow (Pimephales promelas), found in most surface waters across North America, can tolerate many harsh conditions. Its short life span (1–3 years) and high reproductive rate make it the most suitable freshwater species for aquatic toxicology research and regulatory testing (Ankley & Johnson, 2004), and it is among the most commonly used model species for ecological toxicity testing (Ankley et al., 2001, 2005; Geis et al., 2003; Roush et al., 2018).
Consequently, there is a huge compendium of toxicity studies largely focused on apical responses, such as growth, mortality, and fecundity, to chemical exposure. Though these studies have been critical in characterizing the risk posed by chemicals, they provide little insight into the underlying mechanisms determining organismal response. The stressor response phenotype is ultimately determined through the coordinated interaction of genome, epigenome, transcriptome, metabolome, and proteome (Hanson et al., 2018), which can provide insight into gene–environment interactions and the response of biologic pathways to environmental perturbations. Therefore, next-generation sequencing (NGS)–based toxicogenomic studies are now essential for exposure assessment, hazard screening, genetic susceptibility, as well as cross-species extrapolation. Toxicogenomics not only can improve risk assessment and regulatory tests but also helps move toxicologic studies toward the full adoption of new approach methodologies, shifting to the new animal-free testing paradigm (Liu et al., 2019).
Aquatic toxicogenomic studies demand a high-quality fathead minnow reference genome to accurately interpret NGS results (Florea et al., 2011). The current draft fathead minnow genome assembly (GCA_000700825, dubbed in the present study “FHM1”; Burns et al., 2016; Saari et al., 2017) has been a valuable aquatic toxicology resource; however, it is insufficient for most toxicogenomic studies because of its high fragmentation and incompleteness. We present a de novo assembled, highly contiguous, and comprehensively annotated fathead minnow genome assembly. The assembly was accomplished using a hybrid of long- and short-read sequencing, optical mapping, and Hi-C technologies. In terms of complete benchmarking universal single-copy orthologs (BUSCOs) and RNA-sequencing (RNA-seq) read mapping rates, the new fathead minnow assembly, henceforth referred to as FHM2, is comparable to the latest zebrafish GRCz11 assembly, the best-characterized fish genome available (Howe et al., 2013).
MATERIAL AND METHODS
Source of specimens
All fathead minnows were obtained from the culture at the US Environmental Protection Agency (USEPA) laboratory in Cincinnati, Ohio. This culture was established in 1998 and has since been maintained without any additional fish from the outside (Gordon et al., 2014). Because the genome sequencing effort unfolded over several years, a few different fish were used for the different analyses.
DNA library construction and sequencing
High–molecular weight DNA was isolated from brain and tail muscle tissue from a single 10-month-old male fathead minnow using MagAttract (Qiagen). Samples were digested overnight using proteinase K. The DNA concentration was checked on a Nanodrop ND-1000 spectrophotometer (Nanodrop Technologies). The DNA integrity was confirmed using a Bioanalyzer DNA 12000 chip (Agilent Technologies).
Long-read DNA libraries were prepared by the Inter-disciplinary Center for Biotechnology Research at the University of Florida and sequenced on a PacBio RS II system. Sequencing was done in two rounds. For the first round of sequencing, BluePippin (Sage Biosciences) was used to select templates >20 kb, and libraries were sequenced on 24 SMRT cells using P6-C4 chemistry. For the second round of sequencing, the size selection was done using SageELF (Sage Biosciences), and libraries were sequenced on 48 SMRT cells.
Short-read sequencing libraries were prepared and sequenced by the Research Technology Support Facility (RTSF) Genomics Core at Michigan State University. Libraries were prepared using the Illumina TruSeq Nano DNA library kit. Sequencing was done in a paired-end 250-base format on both lanes of a dual flow cell in Rapid Run mode on an Illumina HiSeq 2500 System.
RNA library construction and sequencing
RNA was isolated from multiple tissues from five adult male and five adult female fish, from unfertilized eggs, and from several developmental stages ranging from 24 h postfertilization (hpf) embryos to 30 days posthatch (dph) larvae. Total RNA was isolated using Tri-Reagent (Molecular Research Center) following the manufacturer’s protocol and quantified using a Nanodrop ND-1000 (Thermo Fisher Scientific). The RNA quality was checked using the RNA 6000 Nano Assay on an Agilent 2100 Bioanalyzer (Agilent Technologies). Two RNA pools were made: an adult pool made up of equal amounts of RNA from each adult tissue and a juvenile pool made up of equal amounts from eggs, embryos, and larvae.
The RNA libraries were produced and sequenced by the RTSF. Separate libraries were prepared from the two RNA pools using the TruSeq Stranded mRNA LT sample prep kit (Illumina). Libraries were run in paired-end 150-base format on both lanes of a dual flow cell in Rapid Run mode on an Illumina HiSeq 2500 System. Base calling was done with Illumina Real Time Analysis software, Ver 1.17.21.3; and output was converted to FASTQ format with Illumina Bcl2fastq, Ver 1.8.4.
Noncoding RNA library construction and sequencing
For sequencing of noncoding RNA (ncRNA), RNA was isolated from unfertilized eggs from one adult female, from four 4-dph fry, from 20 6-dph fry, and from both brain and liver tissue from one adult male and one adult female. Samples were homogenized in Tri-reagent and processed using the Direct-zol RNA Microprep kit (Zymo Research) following the manufacturer’s protocol. The RNA quality was checked using an RNA 6000 Nano chip on an Agilent Bioanalyzer. For each sample type, 1 µg of total RNA was used as input for the TruSeq Small RNA Library Preparation Kit (Illumina) following the manufacturer’s protocol. The RTSF sequenced the pooled libraries on one lane of an Illumina HiSeq 4000 flow cell in a 1 × 50 bp single-read format using HiSeq 4000 SBS reagents. In addition, RNA from 10 larvae (6 dph) that had been exposed for 48 h to 10 mg 17α-ethynylestradiol (EE2)/L and 10 unexposed larvae was used to make libraries following the procedures described. These libraries were similarly sequenced on two lanes of a flow cell.
Generation of Bionano optical mapping data
The DNA was isolated from blood of a 6-month-old male fathead minnow using the Blood and Cell Culture DNA Isolation Kit (Bionano Genomics). Nucleated fish blood was embedded in agarose plugs and sent to the McDonnell Genome Institute at Washington University for processing and analysis. Genomic DNA was drop-dialyzed and allowed to equilibrate at room temperature for 2 days. The DNA samples were assessed for quantity and quality using a Qubit dsDNA BR Assay kit and clamped homogenous electric fields gel electrophoresis. A 750-ng aliquot of DNA was labeled and stained following the Bionano Prep Direct Label and Stain protocol, quantified using a Qubit dsDNA HS Assay kit, and run on the Saphyr Optical Genome Mapping Instrument.
HiC library preparation and sequencing
Liver tissue from a single adult male was used for chromosome conformation capture Hi-C sequencing. Library preparation and sequencing were performed by Dovetail Genomics. Two Hi-C libraries were prepared in a manner similar to that described previously (Lieberman-Aiden et al., 2009). Briefly, for each library, chromatin was fixed within the nucleus using formaldehyde and then extracted. Fixed chromatin was digested with DpnII, the 5′ overhangs filled in with biotinylated nucleotides, and then the free blunt ends were ligated. After ligation, crosslinks were reversed, and the DNA was purified from protein. Purified DNA was treated to remove biotin that was not internal to ligated fragments. The DNA was then sheared to approximately 350-bp mean fragment size, and sequencing libraries were generated using NEBNext Ultra enzymes and Illumina-compatible adapters. Biotin-containing fragments were isolated using streptavidin beads before polymerase chain reaction enrichment of each library. The libraries were sequenced on an Illumina HiSeqX platform in a 2 × 150–bp read format. Together, the 428 million reads from the two libraries provided 14,719X physical coverage of the genome.
Identification of homologs for gene structure comparison
The blast search resulted in 16,762 homologous genes shared among fathead minnow, zebrafish, mouse, and human species. The following filter was applied to remove potentially vast different homologs: The numbers of exons or introns between fathead minnow and zebrafish homologs were the same, and the ratios of total exon length between the two species were between 0.5 and 2. After filtering, 6753 homologs were obtained for gene structure comparison between the four species.
The detailed methods for genome assembly, annotation, and comparative genomics analysis are provided in the Supporting Information.
RESULTS
An overview of the new FHM2 reference genome and annotation is illustrated in Figure 1. Shown in the figure are the 15 chromosome/subchromosome scaffolds. Each individual scaffold is packed with a large number of genes (in red) and contains high-density repeat elements (gray histograms), indicating a compact yet repetitive genome. The phylogenetic tree, constructed from the housekeeping gene succinate dehydrogenase complex flavoprotein subunit A confirmed that fathead minnow is closely related to the popular model species zebrafish.
FIGURE 1:
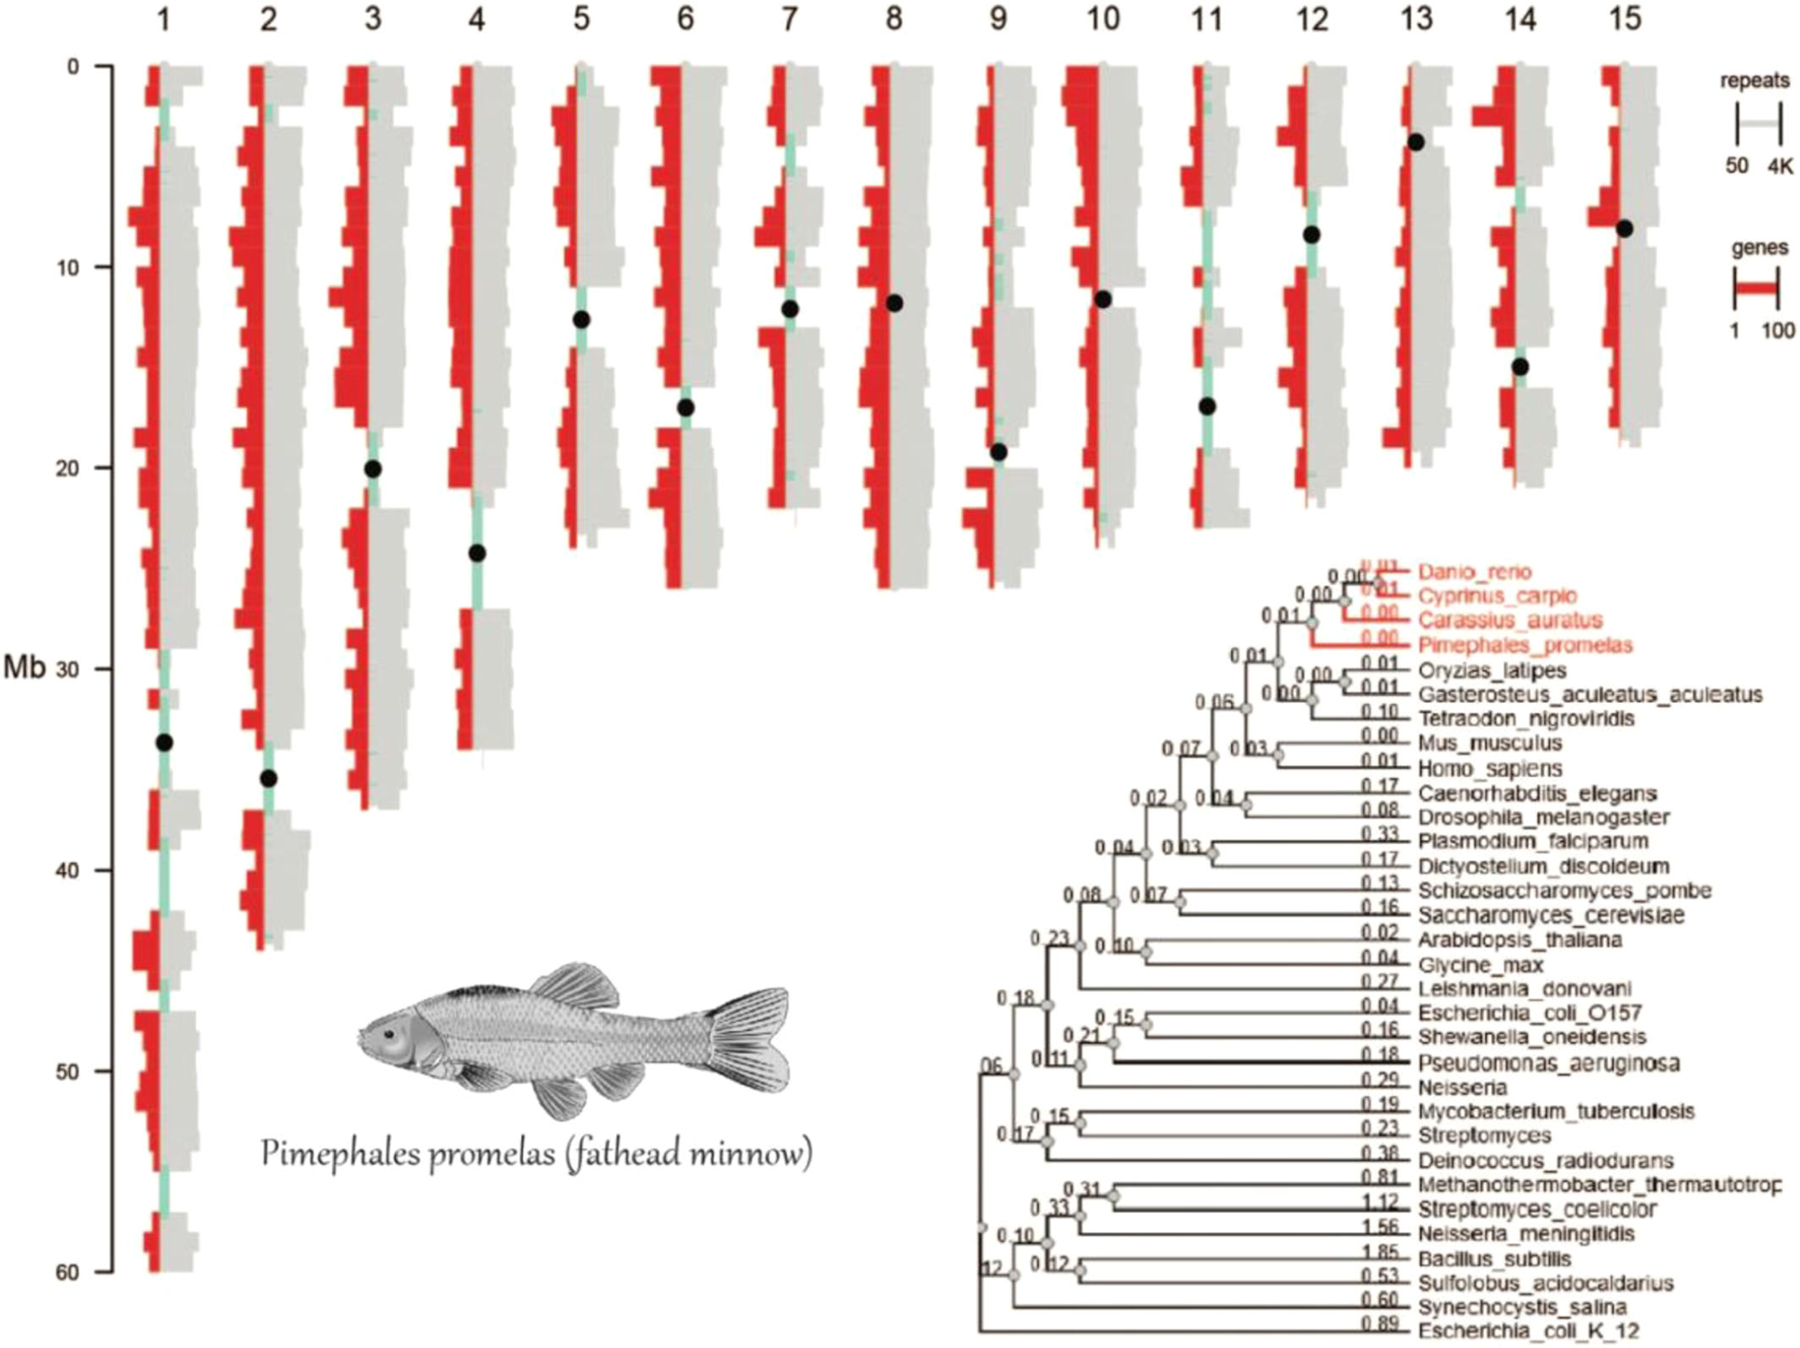
The distribution and density of genes (in red) and repeat elements (in gray) on the 15 longest scaffolds of the fathead minnow genome, along with sequence gaps (in green). On each scaffold, a pseudo-centromere (black dot) is located at center of the longest gap, indicating the potential location of centromeres on chromosomes. The rooted phylogenetic tree (bottom right) shows the evolutionary relationship of fathead minnow with other model organisms, including closely related fish species (in red).
De novo assembly of the fathead minnow genome
Genome assembly.
The FHM2 assembly includes eight major steps (Figure 2A). In the first step, CANU (Ver 1.8; Koren et al., 2017, 2018) was used to correct bases, trim reads, and assemble the initial diploid reference genome from approximately 70× PacBio reads generated in-house. Two different sets of long PacBio sequencing data, which included a total of 9,361,408 reads with approximately 75 Gbp, were generated for the de novo assembly of the fathead minnow genome. Because the estimated fathead minnow genome size is 1.1 Gbp (Gold & Amemiya, 1987; Saari et al., 2017), the coverage depth of PacBio reads is more than 70×, providing enough depth coverage for the assembly of the fathead minnow genome of reasonable quality. The size of the initial draft diploid genome assembly was 1,454,900,621 bp with a contig N50 (the shortest contig length needed to cover 50% of the genome) of 141,276 bp. In the second step, the diploid draft assembly was polished by Pilon (Ver 1.23), using 2 × 100–bp Illumina paired-end reads (SRR1304883 and SRR1301972) and two lanes of Illumina 2 × 250–bp reads generated in-house (see Materials and Methods for more details), to correct base calling errors and fill mini-gaps in the draft. Over 99% of reads in both Illumina data sets were mapped to the draft assembly, indicating the completeness of the assembly. In the third step, redundant haplotigs, resulting from heterozygous regions of haplotype copies not recognized by the assembler, were purged from the polished draft. This resulted in a haploid assembly of 926,182,690 bp with a contig N50 of 297,600 bp (see Figure 2B,C). The removal of haplotigs reduced the size of the assembly by almost 520 Mbp. In the fourth step, the haplotig-purged draft was polished using the same sets of Illumina reads as used to do the initial polishing. There was little change in the read mapping rate, that is, remaining >99%, in the polishing run for the assembly before and after purging haplotigs, suggesting that only duplicated haplotigs were purged.
FIGURE 2:
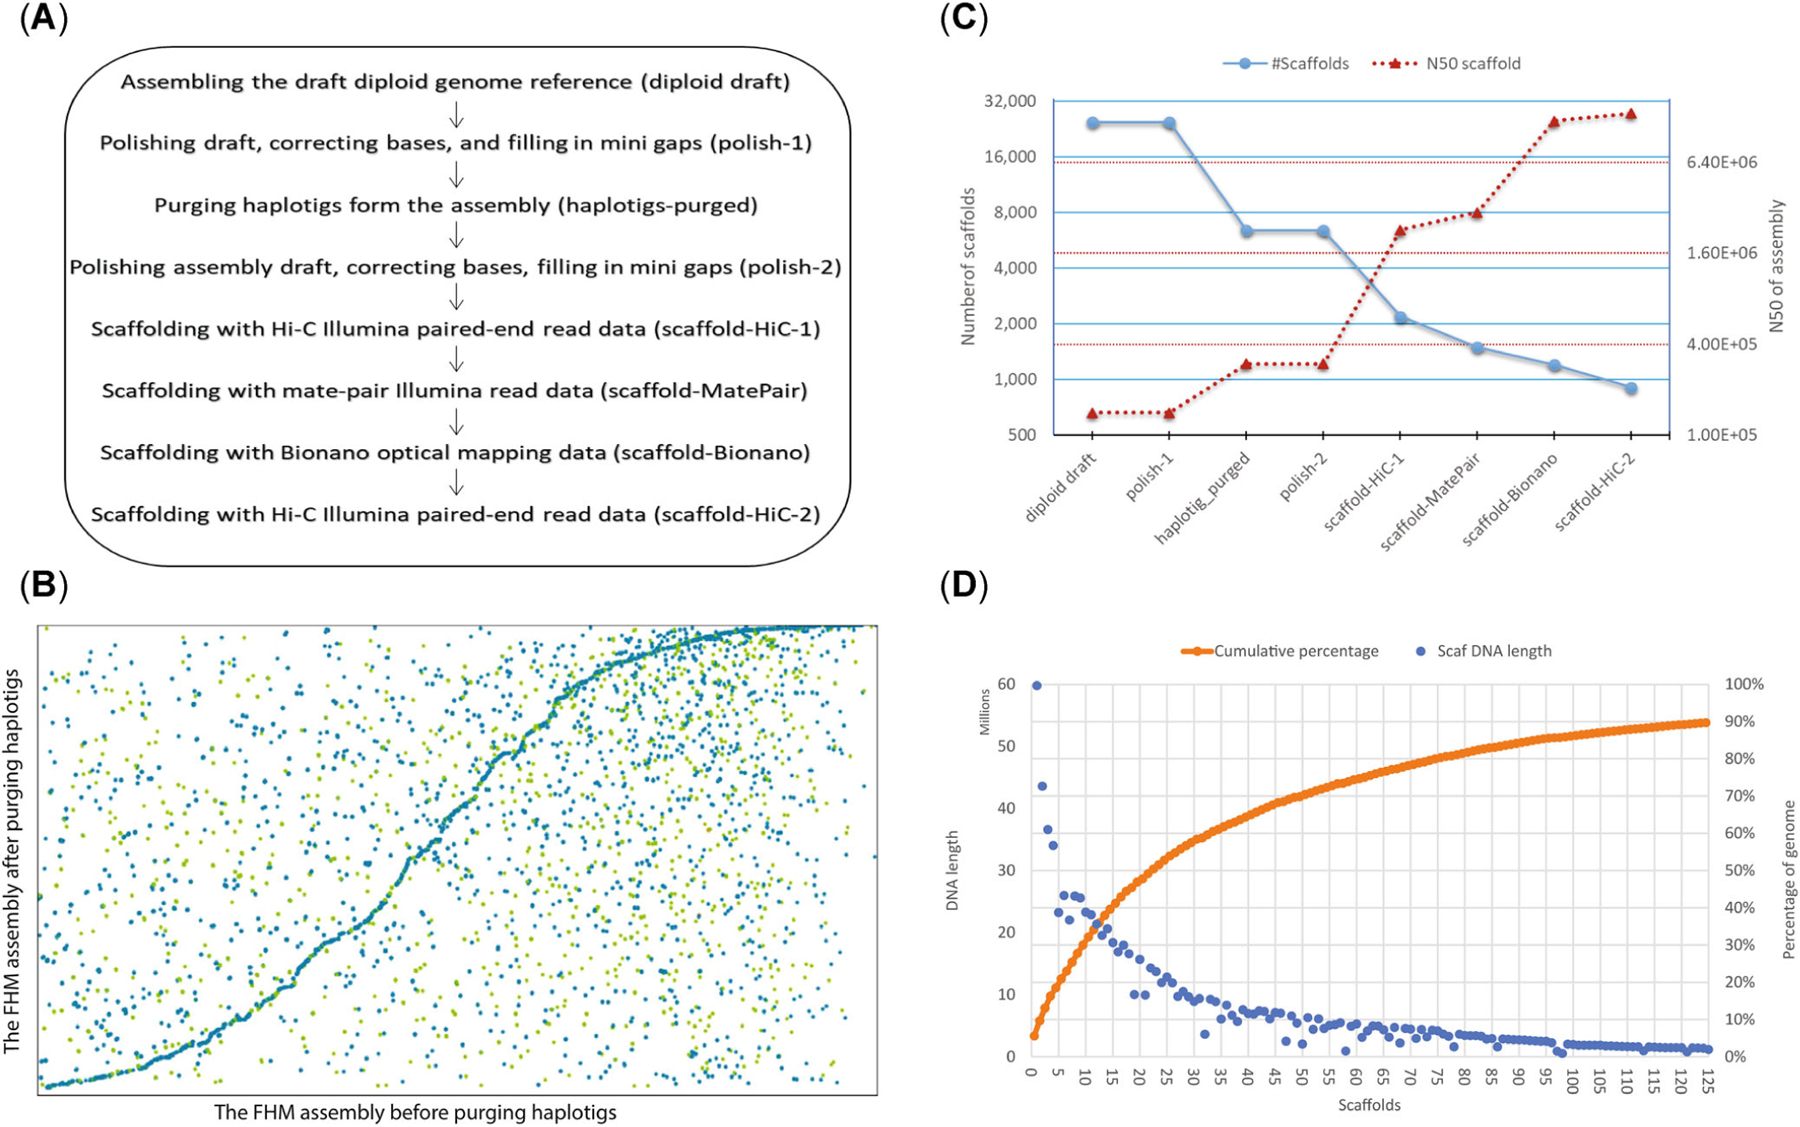
Assembly of the fathead minnow (FHM) reference genome. (A) The assembling process. The order of eight assembly steps was optimized to achieve the best assembly. (B) Dotplot of the FHM genome assemblies before and after purging haplotigs. The x-axis is the original FHM diploid genome assembly (1.45 Gbp) by CANU, and the y-axis is the one (0.93 Gb) after purging haplotigs. The removal of haplotigs reduced the size of the FHM genome assembly by almost 520 Mbp. (C) Number of scaffolds and N50 of FHM assemblies at different assembly steps. The x-axis shows different assembly steps from the initial assembling of diploid daft to the final scaffolding with HiC data. The primary y-axis (blue solid line with the round dot marker) is of the number of scaffolds, and the secondary y-axis (red dotted line with triangle marker) is N50. Both y-axes are in the log2 scale. (D) Scaffold length distribution of the FHM genome assembly. Blue dots are lengths of individual scaffolds, and orange ones are the cumulative percentage of the total genome length. The plot shows only the first 125 scaffolds.
To achieve chromosome/subchromosome scale assembly, the assembly was then subjected to four rounds of scaffolding (Steps 5–8), each increasing the scaffold N50 (the shortest scaffold length needed to cover 50% of the genome) of the assembly substantially (Figure 2C). The initial scaffolding step with HiC data (14,719× genome coverage) increased the scaffold N50 of the assembly by eightfold. Scaffolding with long mate-pair Illumina reads increased the N50 only slightly, but it helped to correct some initial scaffolding errors. The incorporation of Bionano data (113× effective coverage) increased the scaffold N50 an additional fourfold and helped correct misassembled regions (Supporting Information, Figure S1). The final scaffolding with HiC data identified and utilized more long-distance chromosome interaction sites (Supporting Information, Figure S2), which further improved the assembly to the chromosome/subchromosome level with scaffold N50 reaching >13.5 Mbp. After trimming Ns at the beginnings and ends of all scaffolds, the scaffold N50 of the final fathead minnow assembly was reduced to 12.0 Mbp. The longest scaffold (>60 Mbp) of the fathead minnow assembly was equivalent in size to the longest chromosome (∼62 Mbp) of the closely related zebrafish, suggesting that the assembly approaches the chromosome scale.
The final haploid assembly contains 910 scaffolds and 6281 contigs with a total 1,066,412,313 bp in length. Gaps account for 13.2% of the genome reference. Among the 910 scaffolds, 133 (14.6%) of all scaffolds are longer than 1 Mbp. The first 15 scaffolds are of chromosome/subchromosome size, each >15 Mbp, and comprise approximately 40% of the genome sequences (Figure 2D; see Supporting Information, Figure S3, for the full distribution). Approximately 90% of the genome is contained on the first 125 scaffolds, with >50% on the first 23 scaffolds. The remaining 785 scaffolds accounts for <10% of the genome reference.
Genome assembly assessment.
We evaluated three aspects of the FHM2 assembly: (1) contiguity by contig/scaffold N50, the shortest contig/scaffold length in the assembly to cover 50% of the total genome; (2) completeness by BUSCO score, which checks the presence or absence of highly conserved genes in an assembly; and (3) base accuracy by mapping rates of short Illumina reads to the genome. The contig N50 of the FHM2 assembly is approximately 300 kbp, and the scaffold N50 reaches 12.0 Mbp, both of which are much greater than those of FHM1, indicating substantial improvement of FHM2 over FHM1. The BUSCO analysis indicated that the FHM2 assembly is >95% complete, similar to the quality of the latest version of the zebrafish assembly (GRCz11), as shown in Table 1. In addition, the complete and single-copy BUSCOs score of the FHM2 assembly is near 90%, suggesting a high degree of completeness of the FHM2 assembly with few duplications. The base accuracy of the assembly was assessed indirectly by measuring the mapping rate of Illumina genome sequencing reads, assuming that a low error rate of bases in the assembly leads to a high mapping rate. The overall mapping rates were >99.4% for both 2 × 250–bp Illumina paired-end data sets that were used to polish the assembly, indicating a low base error rate of the assembly.
TABLE 1:
Comparison of FHM2 with the FHM1 and ZF assemblies
| Assembly statistics | FHM1 (GCA_000700825) | FHM2 (GCA_016745375) | ZF (GRCz11) |
|---|---|---|---|
| Number of scaffolds | 73,057 | 910 | 993 |
| N50 contig | 7513 | 300,151 | 1,428,257 |
| N50 scaffold | 60,380 | 11,952,773 | 54,304,671 |
| Complete BUSCOsa | 3506 (76.5%) | 4357 (95.1%) | 4384 (95.7%) |
| Complete and single-copy BUSCOs | 3324 (72.5%) | 4115 (89.8%) | 4215 (92.0%) |
| Complete and duplicated BUSCOs | 182 (4.0%) | 242 (5.3%) | 169 (3.7%) |
| Fragmented BUSCOs | 507 (11.1%) | 73 (1.6%) | 66 (1.4%) |
| Missing BUSCOs | 571 (12.4%) | 153 (3.3%) | 134 (2.9%) |
| Total contig size | 811,183,656 | 925,375,343 | 1,368,782,359 |
| Total scaffold size | 1,219,326,373 | 1,066,412,313 | 1,373,471,384 |
Statistics based on “genome mode” BUSCO assessment.
FHM = fathead minnow; ZF = zebrafish; BUSCO = benchmarking universal single-copy orthologs.
Repetitive elements
We used RepeatModeler (Ver 2.0.1) and RepeatMasker (Ver 4.1.0) to annotate repetitive regions of the FHM2 genome assembly. Overall, we found that >461 Mbp of the genome sequence, or 43.27% of the FHM2 genome assembly, was comprised of repetitive regions. Among all repeat elements (Table 2), DNA transposons were the most abundant, accounting for 21.47% of the whole genome. In contrast, only 9.09% of the genome was composed of retroelements, which were dominated by long terminal repeats that represented 6.62% of the genome. Compared to the genomes of four other teleost species (Gao et al., 2016), fathead minnow has the second highest proportion (38.9%) of total interspersed repeats; zebrafish is highest with 56.5% (Supporting Information, Table S4). The five teleost species differ substantially in terms of the distribution of repeat elements, but the AT-rich fathead minnow genome has the highest proportion of both simple repeats and low-complexity regions reported for four other teleost genomes: zebrafish, medaka (Oryzias latipes), stickleback (Gasterosteus aculeatus), and pufferfish (Tetraodon nigroviridis). The five teleost species differ substantially in terms of the distribution of repeat elements (Supporting Information, Table S4). The zebrafish genome has the highest proportion (56.49%) of total interspersed repeats, whereas the fathead minnow genome is the second highest (38.90%). In contrast, the AT-rich fathead minnow genome contains the highest proportion of simple repeats and low-complexity regions among all five species.
TABLE 2:
Repetitive elements in the FHM2 genome assembly
| Type | Subgroup | No. elementsa | Length (bp) | % Genome |
|---|---|---|---|---|
| Retroelements | 249,678 | 96,792,759 | 9.08 | |
| SINEs | 22,354 | 2,714,953 | 0.25 | |
| Penelope | 1207 | 265,815 | 0.02 | |
| LINEs | 78,893 | 23,445,138 | 2.20 | |
| L2/CR1/Rex | 59,637 | 15,291,306 | 1.43 | |
| R1/LOA/Jockey | 2299 | 857,151 | 0.08 | |
| R2/R4/NeSL | 2263 | 1,224,253 | 0.11 | |
| RTE/Bov-B | 4905 | 1780,570 | 0.17 | |
| L1/CIN4 | 2184 | 1,032,311 | 0.10 | |
| LTR elements | 148,431 | 70,632,668 | 6.62 | |
| BEL/Pao | 9750 | 6,260,165 | 0.59 | |
| Ty1/Copia | 406 | 234,805 | 0.02 | |
| Gypsy/DIRS1 | 89,802 | 47,549,943 | 4.46 | |
| Retroviral | 17,549 | 7,893,150 | 0.74 | |
| DNA transposons | 1,138,712 | 228,911,213 | 21.47 | |
| hobo-Activator | 256,864 | 54,737,880 | 5.13 | |
| Tc1-IS630-Pogo | 71,534 | 14,918,781 | 1.40 | |
| PiggyBac | 19,182 | 5,854,328 | 0.55 | |
| Tourist/Harbinger | 89,007 | 19,615,220 | 1.84 | |
| Other (Mirage, P-element, Transib) | 8307 | 2261,427 | 0.21 | |
| Rolling circles | 43,452 | 22,236,361 | 2.09 | |
| Unclassified | 583,472 | 89,130,569 | 8.36 | |
| Total interspersed repeats | 414,834,541 | 38.90 | ||
| Small RNA | 3015 | 513,354 | 0.05 | |
| Satellites | 30,422 | 5,491,099 | 0.51 | |
| Simple repeats | 354,572 | 16,612,360 | 1.56 | |
| Low complexity | 35,283 | 1,920,018 | 0.18 |
Most repeats fragmented by insertions or deletions have been counted as one element.
FHM = fathead minnow; LINE = long interspersed element; SINE = short interspersed element; LTR = long terminal repeat.
Protein coding genes
Gene prediction.
A pipeline consisting of the popular gene prediction tools Maker and EVidenceModeler was developed for predicting gene models with RNA-seq data (Supporting Information, Figure S4). Maker produced 30,909 gene models with 47,716 transcripts/proteins, and the BUSCO analysis of its exemplar protein set, which contains only the longest protein from each gene, showed the complete BUSCO score at 84.8% with 5.8% duplication. The RNA-seq read mapping analysis showed that the overall mapping rate to Maker’s exemplar transcript set (transcripts corresponding to the longest proteins of each gene) was 77.9% and that the unique mapping rate was 71.7%. The EVidenceModeler tool predicted a total of 37,190 gene models, of which the exemplar transcripts had a complete BUSCO score of 94.1% with 6.7% duplication. The total RNA-seq mapping rate to EVidenceModeler’s exemplar transcripts was 77.9%, with the unique mapping rate at 72.9%. To refine EVidenceModeler gene models with untranslated region information, Maker was rerun using the 37,190 EVidenceModeler models as input gene predictions; 36,881 gene models were retained, including any of the original EVidenceModeler models that exhibited no coding sequence overlap with the new Maker output models. The 36,881 genes had a complete BUSCO score of 94.2% with 6.6% duplication, and the overall RNA-seq read mapping rate was 85.3% with a 78.5% unique mapping rate, which were better than either the original EVidenceModeler or Maker sets.
We applied a filter, based on mapping evidence and homology to reference proteins (see Gene model filtering section in the Supporting Information), to the 36,881 gene models to remove potential pseudogenes and nonfunctional paralogs. After filtering, there were 26,150 gene models and 47,578 transcripts/proteins; and there was little change in the complete BUSCO score and overall read mapping rates. The filtered gene models were then manually curated to generate the final set of gene models, transcripts, and protein sequences. Protein sequences from both EVidenceModeler and Maker were analyzed by BLAST (Altschul et al., 1990). If the alignment score for the EVidenceModeler protein was higher than that for the Maker protein, the original EVidenceModeler model was retained. Based on this criterion, 303 of the 47,578 protein sequences were changed back to their original EVidence-Modeler sequences. Most protein changes were due to minor adjustment of the reading frame in existing transcripts. Only six transcripts were changed in the manual curation. One to six bases were either added to or removed from five transcripts, while one exon of 206 bases was added to the sixth. The final curated gene set has a complete BUSCO score of 94.3%, slightly improved compared to precuration (Supporting Information, Figure S5), while maintaining the read mapping rate at 84.9% (Supporting Information, Table S5).
Benchmark comparison with zebrafish.
Benchmark analyses were carried out by comparison to zebrafish, which is closely related to the fathead minnow and has the best-characterized gene models in fish species. For this comparison, the full set of protein or transcript sequences rather than the exemplar set was used for both BUSCO and read mapping rate analyses.
Overall BUSCO scores were comparable between fathead minnow and zebrafish (Table 3). The complete BUSCO score for fathead minnow proteins is 94.3%, and that for fathead minnow transcripts is 94.7%, which are only slightly lower than the corresponding scores for zebrafish. However, the complete and duplicated BUSCO scores for fathead minnow are noticeably lower (8.2% and 6.1% lower for proteins and transcripts, respectively) than those for zebrafish, suggesting that our fathead minnow gene models potentially have a lower duplication level.
TABLE 3:
Comparison of protein and transcript BUSCO scores between FHM2 and ZF
| Proteins |
Transcripts |
|||
|---|---|---|---|---|
| FHM2 | ZF | FHM2 | ZF | |
| Complete BUSCOs | 4325 (94.3%) | 4456 (97.2%) | 4341 (94.7%) | 4423 (96.5%) |
| Complete and single-copy BUSCOs | 2821 (61.5%) | 2577 (56.2%) | 2743 (59.8%) | 2543 (55.5%) |
| Complete and duplicated BUSCOs | 1504 (32.8%) | 1879 (41.0%) | 1598 (34.9%) | 1880 (41.0%) |
| Fragmented BUSCOs | 120 (2.6%) | 57 (1.2%) | 110 (2.4%) | 85 (1.9%) |
| Missing BUSCOs | 139 (3.1%) | 71 (1.6%) | 133 (2.9%) | 76 (1.6%) |
Numbers in parentheses are the corresponding percentages of the BUSCOs.
FHM = fathead minnow; ZF = zebrafish; BUSCO = benchmarking universal single-copy orthologs.
The read mapping analysis shows similar overall mapping rates of 50-bp RNA-seq reads (Table 4). The transcriptome mapping rates for fathead minnow are all slightly better than those for zebrafish. In particular, the unique transcriptome read mapping rates for fathead minnow are 4%–5% higher than the corresponding ones for zebrafish. Whole-genome mapping rates were consistent, though slightly less pronounced, that is, an approximately 3% difference, with transcriptome read mapping results. Together, BUSCO and mapping rate analyses indicate that the FHM2 genome assembly and gene prediction models are of at least similar quality to zebrafish.
TABLE 4:
Comparison of RNA-sequencing read mapping rates between FHM2 and ZF
| Whole Genome |
Transcriptome |
|||
|---|---|---|---|---|
| FHM2 | ZF | FHM2 | ZF | |
| Both reads | 90% (80%, 10%) | 87% (79%, 8%) | 74% (45%, 29%) | 69% (39%, 30%) |
| First read | 94% (81%, 13%) | 91% (80%, 11%) | 81% (45%, 36%) | 75% (40%, 35%) |
| Second read | 92% (80%, 12%) | 90% (79%, 11%) | 78% (45%, 33%) | 75% (40%, 35%) |
To make the transcriptome comparison fair, only protein coding transcripts from the ZF primary assembly (GRCz11 primary assembly) were used. Reported values in each cell are total mapping rate, unique mapping rate, and multimapping rate, respectively.
FHM = fathead minnow; ZF = zebrafish.
The numbers of predicted protein coding genes and transcripts in the FHM2 genome are very close to those in the zebrafish genome, which has 25,638 protein genes and 47,834 corresponding transcripts (Table 5). The two species are also similar in the number of transcript isoforms per gene (1.87 for zebrafish and 1.82 for fathead minnow). There are, however, some noticeable differences. First, the proportion of transcripts without a 5′- or 3′-untranslated region in FHM2 is >18%, which is far greater than the approximately 5% in zebrafish. This large difference could reflect incomplete untranslated region prediction in fathead minnow rather than the actual biological differences between the two species. Second, the median protein coding gene length in FHM2 is 10,177 bp, much shorter than the 13,569 bp in zebrafish, which is possibly explained by incomplete prediction of untranslated regions and some exons.
TABLE 5:
Comparison of FHM2 model transcripts/proteins to transcripts/proteins extracted from ZF primary assembly (GCF_000002035.6_GRCz11)
| ZF | FHM2 | |
|---|---|---|
| Number of protein coding genes | 25,638 | 26,150 |
| Number of protein coding transcripts | 47,834 | 47,578 |
| Unique protein sequences | 36,644 (77%) | 32,848 (69%) |
| No. of transcripts with no 5′-UTR | 2533 | 9900 |
| No. of transcripts with no 3′-UTR | 2621 | 8680 |
| Median protein coding gene length | 13,569 | 10,177 |
| Median transcript length | 2486 | 2967 |
| Median CDS length | 1476 | 1371 |
| Median 5′-UTR length | 180 | 259 |
| Median 3′-UTR length | 531 | 816 |
| Median protein length | 491 | 456 |
| Median no. unique exons per gene | 8 | 8 |
| Median intron length | 984 | 469 |
FHM = fathead minnow; ZF = zebrafish; UTR = untranslated region; CDS = coding sequence.
Gene name and functional annotation.
Gene names and functions of predicted genes were annotated by identifying homologs and/or functional domains. Of the 27 species in the National Center for Biotechnology Information’s (NCBI’s) landmark database, zebrafish returned the highest number of top BLAST hits (Figure 3A); 93% of predicted FHM2 transcripts had a top-matched homologous gene in the zebrafish genome. An InterProScan signature search also successfully found matched functional domain signatures for 96% of all predicted FHM2 transcripts. Overall, 22,743 (87%) of the 26,150 predicted fathead minnow protein coding genes were assigned a gene name, and 42,940 (90%) transcripts representing 22,469 genes (86%) were annotated with at least one Gene Ontology (GO) term. Two versions of GO annotation were provided: the full GO version that includes all GO terms and the GO slim version with a reduced number of GO terms. The full GO version provides details about the function of a gene, while the GO slim version is better for functional enrichment analysis. The full GO version has 873,774 GO terms, while the GO slim version has only 498,616 terms. Figure 3B shows a comparison of the number of GO terms in three GO categories: biological process, cellular component, and molecular function. In the GO slim version, the largest number of GO terms assigned to a transcript is 50. Figure 3C shows the detailed distribution of GO terms in the GO slim version among all predicted fathead minnow transcripts.
FIGURE 3:
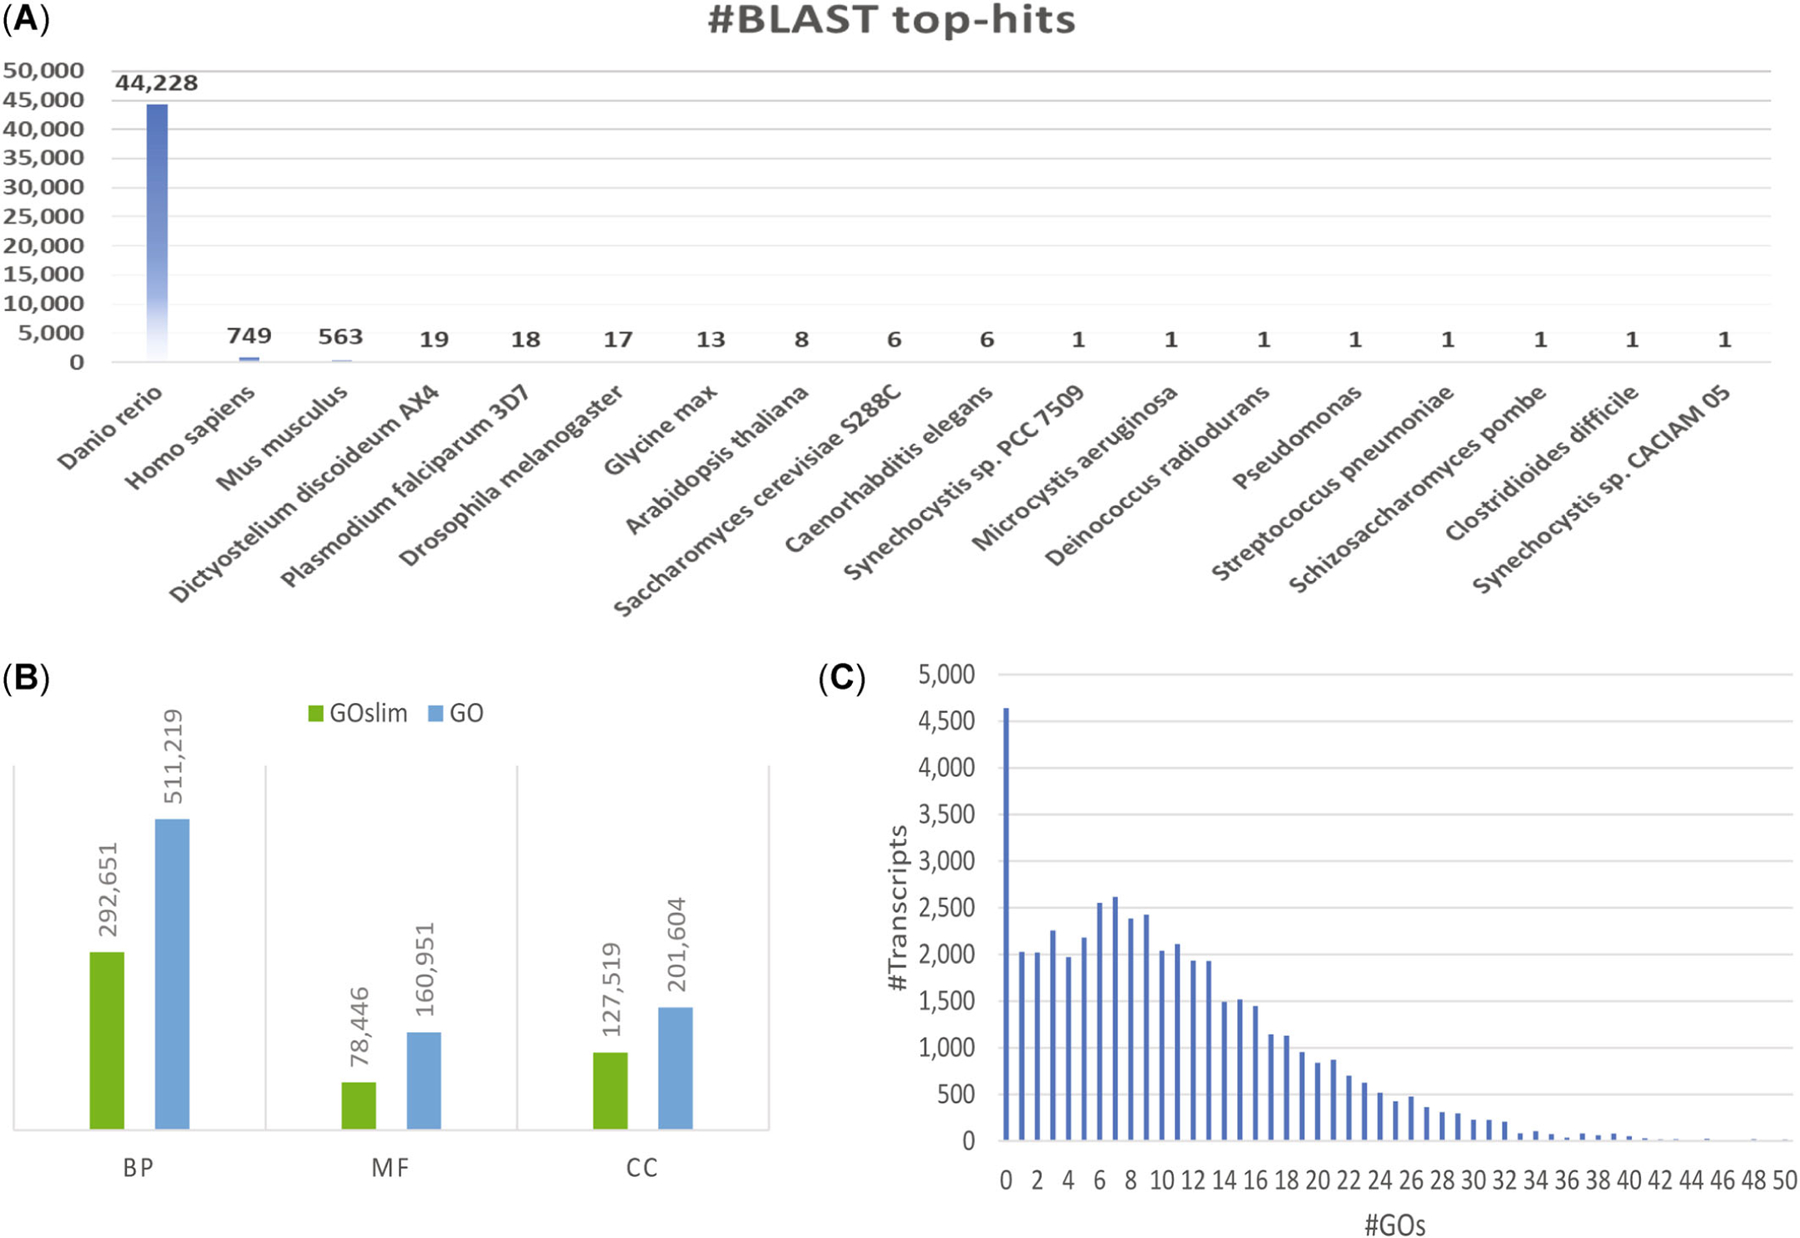
Gene function annotation and visualization. (A) Distribution of 27 landmark species with respect to the number of top-blast hits in homolog search. (B) Gene ontology (GO) term distribution among biological process, molecular function, and cellular compartment categories. (C) GO term distribution among all predicted transcripts in the fathead minnow genome. BP = biological process; MF = molecular function; CC = cellular compartment.
In addition, Kyoto Encyclopedia of Genes and Genomes (KEGG) pathway annotation identified 148 KEGG metabolic pathways, with 4299 genes associated with at least one KEGG pathway. Furthermore, 6425 genes were annotated with at least one enzyme commission number, with a total of 1401 unique enzyme commission numbers reported.
Short ncRNAs
The tRNAscan-SE tool predicted a total of 2670 transfer RNAs (tRNAs) in fathead minnow, approximately one-third the number of tRNAs in zebrafish (Table 6; Supporting Information, Table S6). This high-confidence set, generated from the initial prediction set of 3776 tRNAs after filtering out pseudogenes and potentially false hits, is most likely to be functional in the translation process (Chan & Lowe, 2019). The detailed list of fathead minnow tRNAs by anticodon counts (Supporting Information, Table S7) can be used as a reference for codon usage bias analysis.
TABLE 6:
Small RNAs predicted in FHM2 in comparison to reported values for ZF
| Small RNA type | FHM2 | ZF | Source |
|---|---|---|---|
| tRNA | 2670 | 8676 | gtRNAdb |
| miRNA | 620 | 387/374 | rfam.xfam.org/mirbase.org |
| piRNA | 392,936 | 1,330,692 | regulatoryrna.org |
| SSU_rRNA_eukarya | 47 | 36 | rfam.xfam.org |
| LSU_rRNA_eukarya | 16 | 52 | rfam.xfam.org |
| snoRNA | 201 | 283 | rfam.xfam.org |
| scaRNA | 13 | 11 | rfam.xfam.org |
FHM = fathead minnow; ZF = zebrafish; tRNA = transfer RNA; miRNA = microRNA; piRNA = Piwi-interacting RNA; rRNA = ribosomal RNA; snoRNA = small nucleolar RNA; scaRNA = small Cajal body–specific RNA.
A total of 620 microRNAs (miRNAs) were predicted in the fathead minnow genome by miRDeep* using a stringent cutoff of 100, which was chosen to minimize false-positive hits while retaining miRNAs with exact matches in zebrafish. At least one significant match for 618 of the 620 predicted miRNAs was found in the miRNA database (mirbase.org), suggesting that most predicted miRNAs are likely to be functional. Fathead minnow has more miRNAs than every fish species in the miRNA database except Oreochromis niloticus; mammals tend to have a far greater number of miRNAs than fathead minnow (Supporting Information, Table S8). The abundance of miRNAs in the fathead minnow genome suggests that posttranscriptional regulation, including RNA silencing, may play an important role in gene expression regulation in fathead minnow.
P-Element induced wimpy testis (PIWI)-interacting RNAs (piRNAs) are small non-coding RNAs of approximately 24–32 nucleotides in length that typically play a regulatory role by binding to members of the PIWI protein family and regulate signaling pathways at the transcriptional or posttranscriptional level. In addition, piRNAs and PIWI proteins may be used as biomarkers for various cancers because they are often abnormally expressed in cancer tissues. Prediction of piRNAs was accomplished using both the Piano (Wang et al., 2014) and piRNN (Wang et al., 2018) tools. In the fathead minnow genome, 87,498 transposon-interacting piRNAs were predicted using Piano, and 392,936 piRNAs were predicted by piRNN (Supporting Information, Figure S7). The length distribution of the two sets of piRNAs predicted by the two programs differs greatly (Supporting Information, Figures S6 and S7). Based on these predictions, fathead minnow has far fewer piRNAs than zebrafish, which has approximately 1.33 million piRNAs in piRBase (http://www.regulatoryrna.org). The abundance level of piRNAs in fathead minnow is nevertheless similar to that (>300,000 piRNAs) of many other species reported in the study by Ozata et al. (2019).
Other small RNAs.
Information on the numbers of other noncoding RNAs predicted by Infernal/Rfam, including ribosomal RNA, small nuclear RNA, small nucleolar RNA, small Cajal body–specific RNA, ribonuclease (RNase) for mitochondrial RNA processing, nuclear RNAse P (RNaseP_nuc), and signal recognition particle RNA (Metazo_SRP), can be found in Table 6 and Supporting Information, Table S9. Infernal (Kalvari et al., 2018) was used to predict these short RNAs (see the Supporting Information for details).
Data visualization with the University of California Santa Cruz genome browser
We built a fully functional FHM2 assembly hub for the University of California Santa Cruz (UCSC) genome browser. Users can visually explore the FHM2 genome with their own data by adding customized browser tracks. Such data visualization with the UCSC browser is a critical and popular approach for manually validating results of sequencing projects and generating new hypotheses. The FHM2 assembly hub includes an ab initio gene prediction track, a final gene annotation track, and a repetitive element track, searchable by gene symbol or gene accession number, providing a detailed view of annotated genes and repeats. The FHM2 assembly hub data are available at CyVerse Discovery Environment (https://data.cyverse.org/dav-anon/iplant/home/myepa/FHM/FHM2assembly_hub.txt).
Data visualization with the FHM2 reference genome is also available on CoGe with the EPIC-CoGe browser (Nelson et al., 2018). The EPIC-CoGe browser allows users to visually explore GC content of the reference genome and generate a bird’s-eye view of gene annotation (Supporting Information, Figure S8).
Comparative genome analysis
Homologous gene structure comparison.
Pairwise comparison of 6753 homologous genes in fathead minnow, zebrafish, mouse, and human revealed that fathead minnow generally has a much more compact gene structure, with conserved exon regions connected by relative short introns (Figure 4). The overall differences in total lengths of exon regions are relatively small though significant between fathead minnow and each of the other species. Specifically, ranked by the median of total length of exon regions, human was ranked at the top with the longest exon region; mouse was the second, followed closely in third by fathead minnow; zebrafish was the last, of which the median length of exon regions only is approximately 88% that of fathead minnow despite their close evolutionary relationship. In contrast to relatively conserved exon regions, intron regions among the four species were drastically different (Figure 4A); the median intron region lengths of zebrafish, mouse, and human were 1.89, 2.71, and 3.41 times that of fathead minnow, respectively. The elongation of very long chain fatty acids 6 gene is an extreme example (Figure 4B): The intron regions of this gene in zebrafish, mouse, and human are at least 18 times longer than those in the fathead minnow gene. While such large differences between fathead minnow and mouse or human are not surprising, it is unexpected to see that zebrafish has almost twice as long intron regions but shorter exon regions because these two fish species are closely related, sharing large syntenic regions (Figure 5). Similar results were observed when all 16,762 homologous genes were used for the comparison.
FIGURE 4:
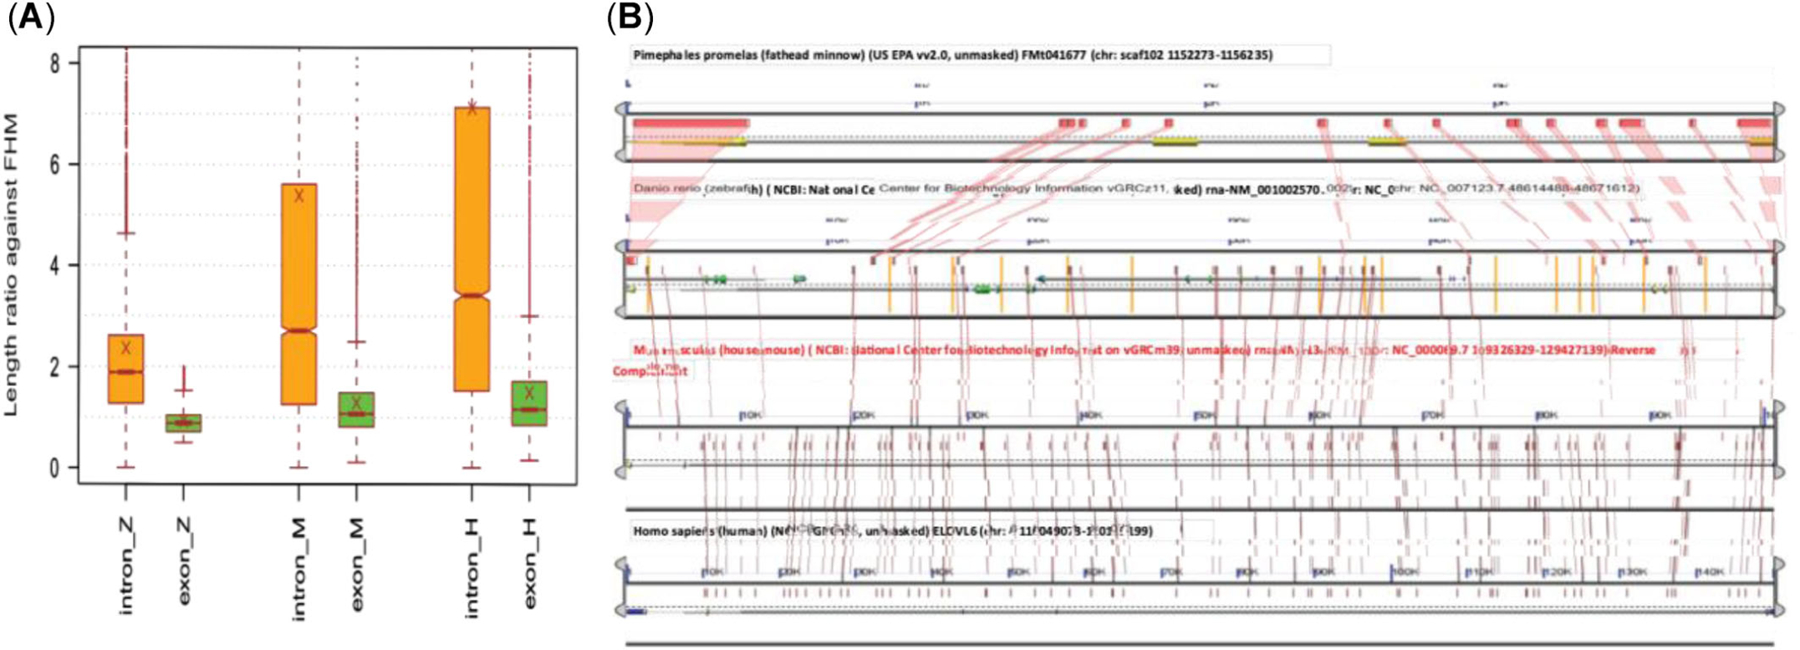
Cross-species comparison between fathead minnow (FHM) and other related species. (A) Comparison of homologous gene structure. For each homologous gene in zebrafish (ZF), mouse, and human, the ratio of total intron/exon length against the corresponding FHM homologous gene was computed. The first group in the figure is the comparison with ZF (*_Z), the second group with mouse (*_M), and the last group with human (*_H). The box-and-whisker plots of length ratios show that ZF, mouse, and human all have overall much longer intron regions than FHM in their homologous genes, with a median ratio of 1.89 for ZF, 2.71 for mouse, and 3.41 for human. In contrast, the length differences in exon regions of the same homologous genes are relatively small, though they remain highly significant statistically (Wilcoxon signed-rank test, p < 2.2e-16). Interestingly, in comparison with FHM, ZF (0.88) has overall a slightly shorter length of exon regions, mouse (1.07) has a very similar length, while human (1.17) has a slightly longer exon region. (B) The gene structure comparison of the elovl6 (elongation of very long chain fatty acids 6) homologous genes from FHM, ZF, mouse, and human. The plot shows a high-score pairs alignment map of the four homologous genes, generated by GEvo with Lagan as the alignment tool. On the top is the shortest FHM gene of 3956 bp, second from top is the ZF gene of 57,314 bp, the third from the top is the mouse gene of 106,101 bp, and at the bottom is the longest human gene of 152,761 bp. The large difference in gene length among the four homologs is largely due to changes of intron regions, of which the lengths of the ZF, mouse, and human genes are approximately 18, 32, and 46 times the length of the FHM gene, respectively. The corresponding exon regions of the ZF, mouse, and human genes are only 1.3, 7.6, and 8.1 times that of the FHM one, much smaller changes compared to intron regions.
FIGURE 5:
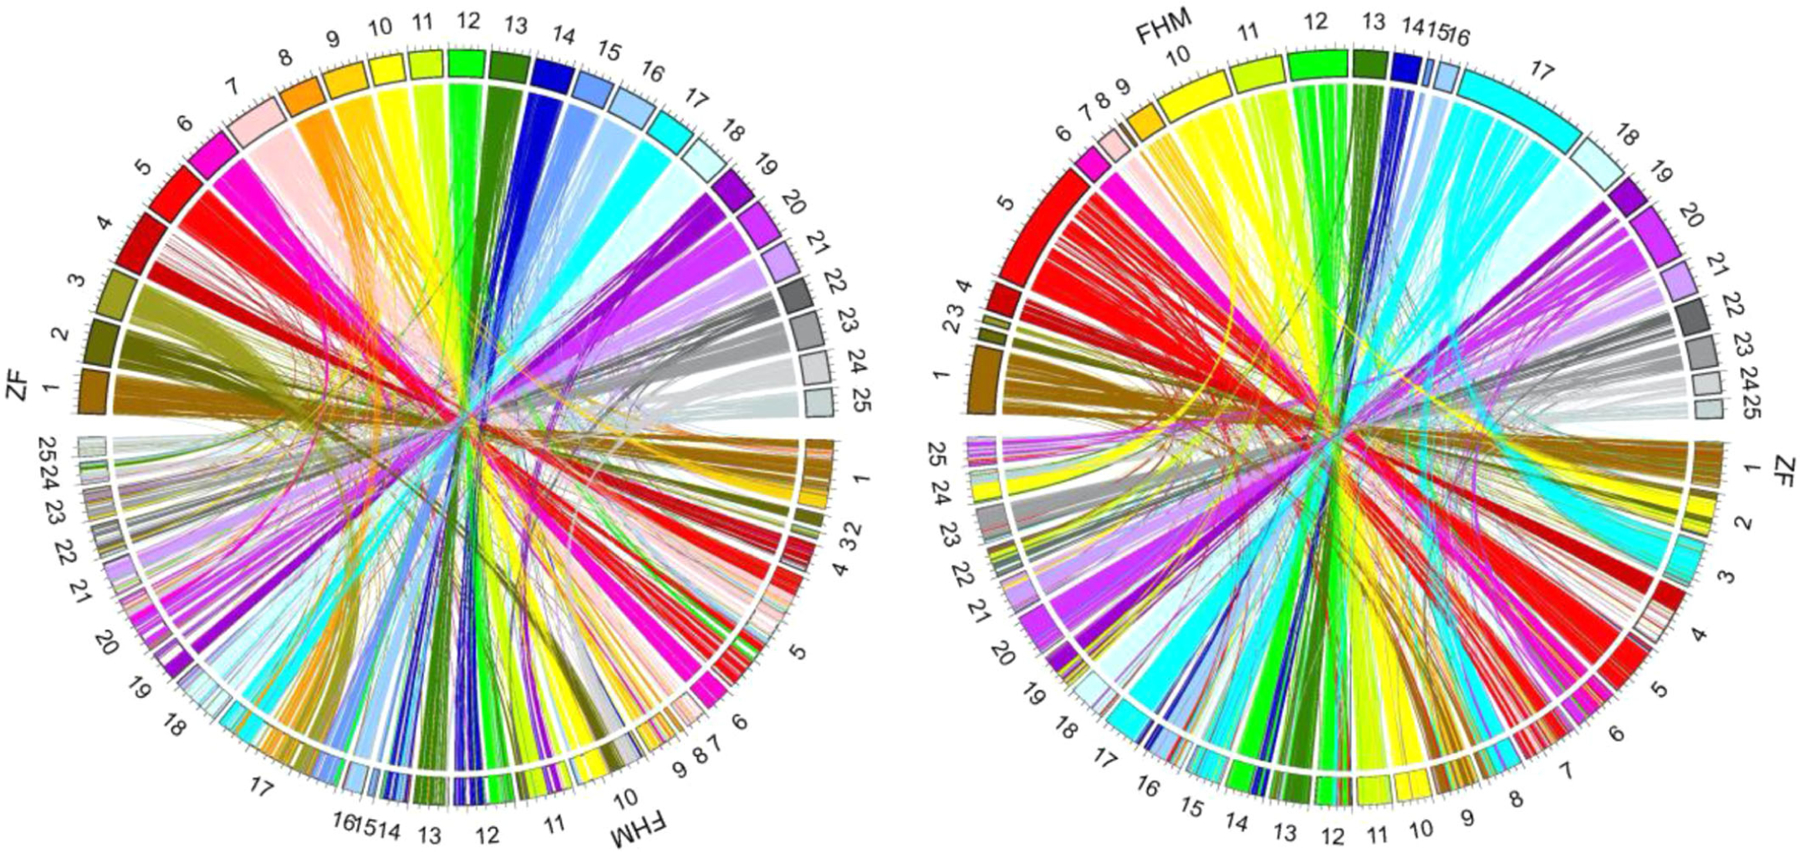
Circos plots of genomic synteny between the fathead minnow (FHM2) and zebrafish (ZF) genome references. (Left) The ZF syntenic regions mapped to the FHM genome. (Right) The FHM syntenic regions mapped to the ZF genome. For the synteny comparison, the ZF genome reference was used as the reference guide to assemble the FHM scaffolds into 25 pseudo-chromosomes. Satsuma (Ver 3.1.0; Grabherr et al., 2010) was used to generate the whole-genome synteny, and mySyntenyPortal (Lee et al., 2018) was used to create the plots. The plots show the longest 25,000 syntenic genomic regions between FHM and ZF, with the shortest syntenic region being 587 bp.
Synteny analysis between zebrafish and fathead minnow.
As two closely related species, the comparison between the zebrafish and fathead minnow genomes revealed that they share extensive syntenic regions. In some cases, syntenic regions are almost the same length of an entire scaffold or chromosome as shown by syntenic plots (Figure 5; Supporting Information, Figure S9). The coding sequence-based syntenic analysis showed that there were 117,846 high-scoring segment pairs from the LAST (Kielbasa et al., 2011) alignment after filtering out tandem duplicates. The total length (74,989,746) of high-scoring segment pairs accounts for >7% or 8% if excluding scaffolding gaps of the FHM2 reference genome. The average length of high-scoring segment pairs is 636 bp, with the mean percent identity at 71% the maximum at 31,479 bp (Supporting Information, Figure S10). On closer inspection of these syntenic regions using the GEvo tool, however, we found that genomic regions containing syntenic blocks are often much shorter in the fathead minnow genome than the corresponding regions in the zebrafish genome. In most syntenic genomic regions that we examined with the GEvo tool, the length of an fathead minnow region is only approximately one-half of the corresponding zebrafish region. For example, the plot of syntenic blocks (Figure 6A) shows that the genomic region surrounding transcript FMt022379 in fathead minnow is only approximately 90 kbp in length, whereas the corresponding region surrounding transcript ENDART00000132491 (gene ENSDARG00000025554) in zebrafish is 200 kbp, more than twice as long (see Supporting Information, Figures S11 and S12, for additional examples). Such differences in length can also be seen in the syntenic dot-plot shown in Supporting Information, Figure S9, where lengths of fathead minnow syntenic regions represented by the y-axis are much shorter than those of the corresponding zebrafish represented by the x-axis. The results suggest that fathead minnow and zebrafish have diverged substantially from their last common ancestor and that zebrafish may have gained much more intergenic or intron regions than fathead minnow, which has either gained little or lost such noncoding regions in the evolutionary process from its ancestor. This also indicates that fathead minnow has a much more condensed genome than zebrafish because the two species have a similar number of genes.
FIGURE 6:
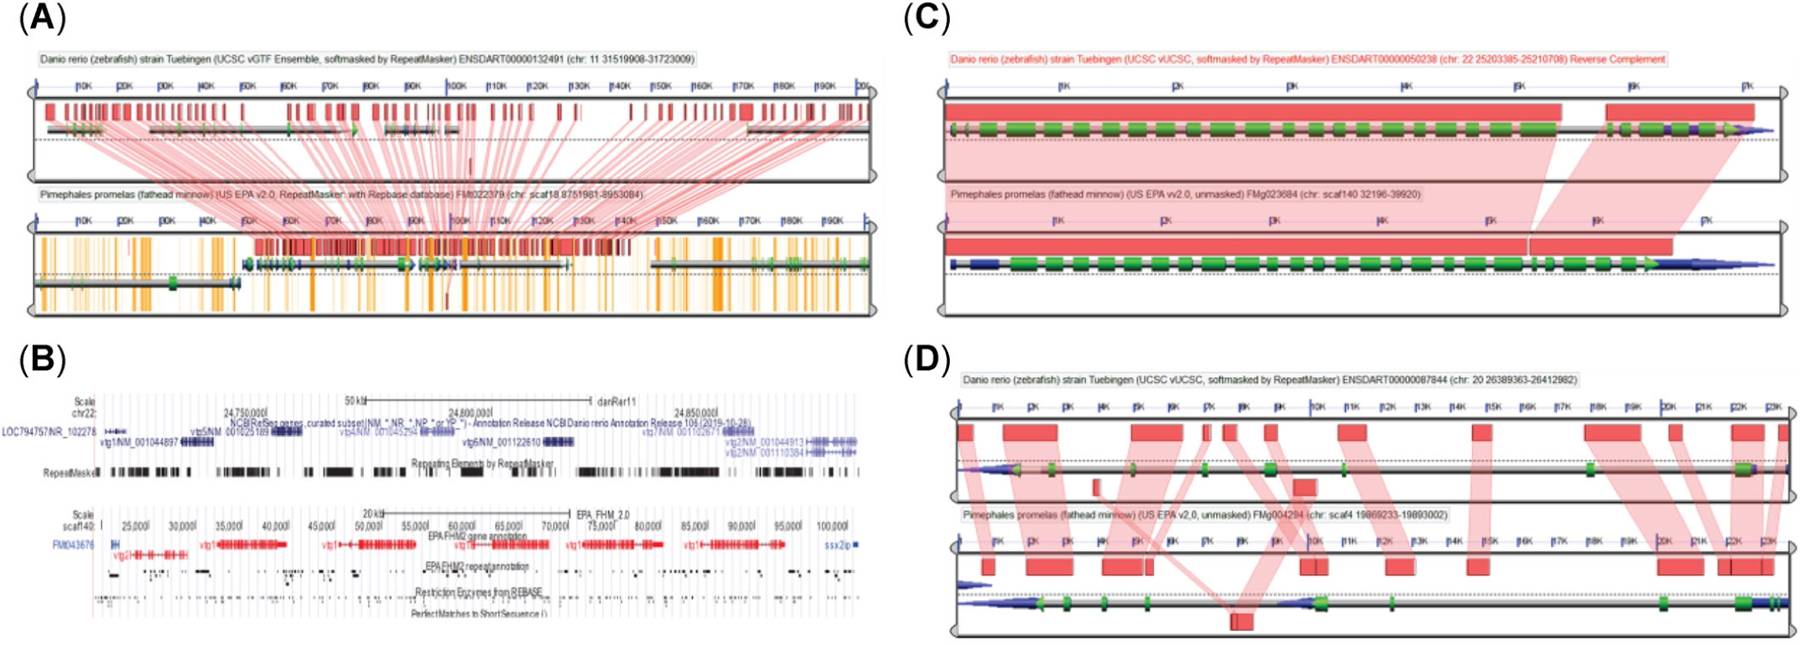
Homolog comparison between fathead minnow (FHM2) and zebrafish (ZF). (A) Syntenic map of the genomic region surrounding the FMt022379 in FHM2 and the ENDART00000132491 in ZF. The genomic region containing the syntenic region in the ZF is approximately 200 kbp, over two times larger than the corresponding region (∼90 kbp) in the FHM2 genome. In this syntenic region, FHM has much shorter introns or intergenic regions. The yellow regions in the FHM genome are repeats or gaps. (B) Genomic map of vitellogenin (vtg) genes in the ZF and FHM. The University of California Santa Cruz gene map plot on the top shows the cluster of six vtg genes in chromosome 22 of the ZF genome, while the one on the bottom shows a similar cluster of six vtg genes in scaffold 140 of the FHM2 genome. (C) Syntenic map of the vtg1 genes between ZF and FHM. (D) Syntenic plot of the estrogen receptor 1 gene between ZF and FHM. UCSC = University of California Santa Cruz; US EPA = US Environmental Protection Agency; NCBI = National Center for Biotechnology Information.
Conservation of estrogen response and exposure biomarker genes.
Fathead minnow and zebrafish are among the most widely used model fish species in environmental toxicogenomics. In particular, toxicogenomic approaches have been applied to the endocrine-disrupting chemicals, for example, EE2, to better characterize the cellular responses underlying their adverse effects on reproduction and development (Ankley & Johnson, 2004). Many studies have measured the differential expression of known estrogen-responsive genes across species as a means of determining estrogenic exposure; however, these studies have largely been done without consideration of the underlying genomic structure. For this reason, we examined two well-studied estrogen-responsive genes, the vitellogenin gene (vtg) and the estrogen receptor 1 gene (esr1), to investigate whether differences between two species could possibly impact estrogen response. Expression of vtg, which generates an egg yolk precursor protein, is a commonly used biomarker indicating exposure to estrogen-like chemicals in male fish; and esr1 is a critical gene for regulating estrogen response. There are seven copies of the vtg gene found in both species. Both their sequence and genomic arrangement appears to be highly conserved between the two species. In both species, six of the seven vtg genes are tandemly arrayed within a tight region of a single chromosome or scaffold (chr22 in zebrafish, scaf140 in fathead minnow; Figure 6B). Another vtg gene, vtg3, is in a different chromosome, chr11 and scaf62 in zebrafish and fathead minnow, respectively. Sequences of the ortholog vtg genes are highly conserved in all exons. Conservation of intron sequences was also observed except for the largest intron in zebrafish, which was greatly reduced in fathead minnow (Figure 6C). In contrast to vtg, both fathead minnow and zebrafish genomes contain only a single copy of the esr1 gene. However, there are eight transcript isoforms in the fathead minnow, while only four exist in zebrafish. The syntenic alignment of the esr1 genes shows that both the order of exons and the sequences of all coding sequence and their flanking region sequences are highly conserved, but sequences in their intron regions differ markedly with large deletions and insertions (Figure 6D).
DISCUSSION
We describe the de novo assembly and annotation of a highly contiguous and near-complete reference genome and annotation for the fathead minnow. The new reference genome, with a scaffold N50 of 12 Mb and complete BUSCO score >95%, is a drastic improvement over the FHM1 reference with respect to assembly contiguity and completeness. The new high-quality FHM2 reference genome can make the fathead minnow a more useful model for toxicogenomic studies.
We were able to comprehensively annotate the FHM2 reference genome, providing new details about its composition. In our repeat analysis, 19.3% of the FHM2 genome was found to be interspersed repeats by using only the known repeat libraries (data not shown), while 38.9% of the genome was identified to be interspersed repeats when combining de novo repeat discovery and a known-library search. The result suggests that many interspersed repeats are new and may be unique to the fathead minnow genome. In addition, our repeat analysis results show that fathead minnow has a substantially higher proportion of simple repeats or low-complexity regions compared to other teleost species, a distinguishing feature of the fathead minnow genome.
There is great interest in using the genome assembly for the interpretation of transcriptional and epigenetic data; to this end, we annotated 26,150 protein coding genes. The completeness of the protein gene annotation is indicated by the high percentage of complete BUSCOs for both the transcript (94.7%) and the genome (95.1%). The number of annotated protein coding genes in the FHM2 is very similar to the well-annotated zebrafish reference genome (25,638), which also has similar BUSCO scores and mapping rates. Given that the zebrafish genome is likely the best-characterized published fish genome and is closely related to the fathead minnow, this comparison provides strong evidence that our gene prediction and annotation are relatively complete and of high quality. Nevertheless, the untranslated region annotation may be incomplete because many gene models are without any untranslated region. To address this issue, we will use new nanopore complementary DNA sequencing data as well as full-length RNA-seq data from those published studies (Carmona-Antonanzas et al., 2014; Lavelle et al., 2018) to improve gene models. Our annotation of small RNAs offers a glimpse of the scale of posttranscription regulations in the fathead minnow and their potential differences among species. Limited by the performance of prediction tools, our small RNA annotation, especially miRNAs and piRNAs, remains preliminary at this point. Further improvement could be made with additional small RNA-seq data and experimental functional validation.
The homologous genes comparison found that intron regions of fathead minnow genes were surprisingly much shorter than those in zebrafish, mouse, and human, suggesting that fathead minnow might be under the selection of different evolutionary forces. Comparison between the fathead minnow and zebrafish reference genomes confirmed that fathead minnow and zebrafish are the most closely related fish species reported by the published phylogenetic study of the more than 20 vertebrates on the evolutionary distance of neurokinin B receptor genes (tachykinin 3a; Biran et al., 2014). This is supported by three observations from the present study: (1) large syntenic genome regions shared between the two species, far more than that shared with other teleost fish species (results not shown); (2) top BLAST hits of the majority (93%) of fathead minnow transcripts from the zebrafish genome among 27 landmark species; and (3) the high similarity of the large vitellogenin gene in gene sequence level, number of paralogs, and chromosome arrangement. Despite the close evolutionary relationship between fathead minnow and zebrafish, we found that fathead minnow is a clearly distinguished species from zebrafish with respect to the following aspects: (1) large difference in GC content in intron regions, with zebrafish at 50.6% and fathead minnow only at 37.1%; (2) a substantial number (3350, or 7%) of fathead minnow transcripts without any acceptable homologous match in zebrafish; and (3) more compact gene structure, that is, shorter and more AT-rich intron/intergenic regions, in fathead minnow than zebrafish. Such large differences suggest that fathead minnow and zebrafish have their own unique value as model organisms and that one cannot be replaced with another.
In conclusion, we assembled de novo a highly contiguous and complete reference genome of the fathead minnow and provided detailed annotation of the genome. Our study reveals that the fathead minnow genome has generally much more compact gene structure than the closely related zebrafish, though there is a high degree of similarity in coding genes between them. The new FHM2 reference genome, together with the comprehensive annotation, represents a major advance in environmental genome research, providing a robust framework for gene expression and regulation studies, opening the door for a much deeper understanding of changes at the molecular level in response to toxins and other environmental stressors.
Supplementary Material
Acknowledgment—
We acknowledge the Research Technology Support Facility Genomics Core at Michigan State University for DNA and RNA sequencing services, Dovetail Genomics for the Hi-C library preparation and sequencing service, and McDonnell Genome Institute at Washington University School of Medicine for the Bionano data service for the work presented in this article. We also thank J. Lazorchak at the USEPA for kindly providing the fathead minnow picture, and T. Purucker at the USEPA and X. Wang at the National Institute of Environmental Health Sciences for their helpful comments about the manuscript.
Footnotes
This article includes online-only Supporting Information.
Supporting Information—The Supporting information is available on the Wiley Online Library at https://doi.org/10.1002/etc.5266.
Disclaimer—The views expressed in this article are those of the authors and do not necessarily reflect the views or policies of the USEPA. Any mention of trade names, products, or services does not imply an endorsement by the US government or the USEPA. The USEPA does not endorse any commercial products, services, or enterprises.
Data Availability Statement—
The fathead minnow genome assembly and annotation data are available at the NCBI Genome database with the accession number GCA_016745375. All raw DNA and RNA sequencing data associated with the project have been deposited to NCBI under the BioProject PRJNA565199, which includes 30 BioSamples (nos. SAMN12766224–SAMN12766252 and SAMN12875914), 103 sequence read archive data sets (accession nos. SRR 10135744–SRR10135767, SRR10199005–SRR10199006, SRR10536067–SRR10536141, and SRR10613469–SRR10613470), and one supplementary data set (accession no. SUPPF_0000003192). Data, associated metadata, and calculation tools are available from the corresponding author (biales. adam@epa.gov, huang.weichun@epa.gov).
REFERENCES
- Altschul SF, Gish W, Miller W, Myers EW, & Lipman DJ (1990). Basic local alignment search tool. Journal of Molecular Biology, 215(3), 403–410. [DOI] [PubMed] [Google Scholar]
- Ankley GT, Jensen KM, Kahl MD, Korte JJ, & Makynen EA (2001). Description and evaluation of a short-term reproduction test with the fathead minnow (Pimephales promelas). Environmental Toxicology and Chemistry, 20(6), 1276–1290. [PubMed] [Google Scholar]
- Ankley GT, & Johnson RD (2004). Small fish models for identifying and assessing the effects of endocrine-disrupting chemicals. Institute for Laboratory Animal Research Journal, 45(4), 469–483. [DOI] [PubMed] [Google Scholar]
- Ankley GT, Kuehl DW, Kahl MD, Jensen KM, Linnum A, Leino RL, & Villeneuvet DA (2005). Reproductive and developmental toxicity and bioconcentration of perfluorooctanesulfonate in a partial life-cycle test with the fathead minnow (Pimephales promelas). Environmental Toxicology and Chemistry, 24(9), 2316–2324. [DOI] [PubMed] [Google Scholar]
- Biran J, Golan M, Mizrahi N, Ogawa S, Parhar IS, & Levavi-Sivan B (2014). Direct regulation of gonadotropin release by neurokinin B in tilapia (Oreochromis niloticus). Endocrinology, 155(12), 4831–4842. [DOI] [PubMed] [Google Scholar]
- Burns FR, Cogburn AL, Ankley GT, Villeneuve DL, Waits E, Chang YJ, Llaca V, Deschamps SD, Jackson RE, & Hoke RA (2016). Sequencing and de novo draft assemblies of a fathead minnow (Pimephales promelas) reference genome. Environmental Toxicology and Chemistry, 35(1), 212–217. [DOI] [PubMed] [Google Scholar]
- Carmona-Antonanzas G, Tocher DR, Martinez-Rubio L, & Leaver MJ (2014). Conservation of lipid metabolic gene transcriptional regulatory networks in fish and mammals. Gene, 534(1), 1–9. [DOI] [PubMed] [Google Scholar]
- Chan PP, & Lowe TM (2019). tRNAscan-SE: Searching for tRNA genes in genomic sequences. Methods in Molecular Biology, 1962, 1–14. [DOI] [PMC free article] [PubMed] [Google Scholar]
- Florea L, Souvorov A, Kalbfleisch TS, & Salzberg SL (2011). Genome assembly has a major impact on gene content: A comparison of annotation in two Bos taurus assemblies. PLoS One, 6(6), e21400. [DOI] [PMC free article] [PubMed] [Google Scholar]
- Gao B, Shen D, Xue S, Chen C, Cui H, & Song C (2016). The contribution of transposable elements to size variations between four teleost genomes. Mobile DNA, 7, 4. [DOI] [PMC free article] [PubMed] [Google Scholar]
- Geis SW, Fleming K, Mager A, & Reynolds L (2003). Modifications to the fathead minnow (Pimephales promelas) chronic test method to remove mortality due to pathogenic organisms. Environmental Toxicology and Chemistry, 22(10), 2400–2404. [DOI] [PubMed] [Google Scholar]
- Gold JR, & Amemiya CT (1987). Genome size variation in North American minnows (Cyprinidae). II. Variation among 20 species. Genome, 29(3), 481–489. [DOI] [PubMed] [Google Scholar]
- Gordon DA, Smith ME, Wratschko M, Agard D, Holden L, Wilcox S, & Lazorchak JM (2014). A new approach for the laboratory culture of the fathead minnow, Pimephales promelas. Environmental Toxicology and Chemistry, 33(1), 126–133. [DOI] [PubMed] [Google Scholar]
- Grabherr MG, Russell P, Meyer M, Mauceli E, Alföldi J, Di Palma F, & Lindblad-Toh K (2010). Genome-wide synteny through highly sensitive sequence alignment: Satsuma. Bioinformatics, 26(9), 1145–1151. [DOI] [PMC free article] [PubMed] [Google Scholar]
- Hanson C, Cairns J, Wang L, & Sinha S (2018). Principled multi-omic analysis reveals gene regulatory mechanisms of phenotype variation. Genome Research, 28(8), 1207–1216. [DOI] [PMC free article] [PubMed] [Google Scholar]
- Howe K, Clark MD, Torroja CF, Torrance J, Berthelot C, Muffato M, Collins JE, Humphray S, McLaren K, Matthews L, McLaren S, Sealy I, Caccamo M, Churcher C, Scott C, Barrett JC, Koch R, Rauch GJ, White S, … Stemple DL (2013). The zebrafish reference genome sequence and its relationship to the human genome. Nature, 496(7446), 498–503. [DOI] [PMC free article] [PubMed] [Google Scholar]
- Kalvari I, Nawrocki EP, Argasinska J, Quinones-Olvera N, Finn RD, Bateman A, & Petrov AI (2018). Non-coding RNA analysis using the Rfam database. Current Protocols in Bioinformatics, 62(1), e51. [DOI] [PMC free article] [PubMed] [Google Scholar]
- Kielbasa SM, Wan R, Sato K, Horton P, & Frith MC (2011). Adaptive seeds tame genomic sequence comparison. Genome Research, 21(3), 487–493. [DOI] [PMC free article] [PubMed] [Google Scholar]
- Koren S, Rhie A, Walenz BP, Dilthey AT, Bickhart DM, Kingan SB, Hiendleder S, Williams JL, Smith TPL, & Phillippy AM (2018). De novo assembly of haplotype-resolved genomes with trio binning. Nature Biotechnology, 36, 1174–1182. [DOI] [PMC free article] [PubMed] [Google Scholar]
- Koren S, Walenz BP, Berlin K, Miller JR, Bergman NH, & Phillippy AM (2017). Canu: Scalable and accurate long-read assembly via adaptive k-mer weighting and repeat separation. Genome Research, 27(5), 722–736. [DOI] [PMC free article] [PubMed] [Google Scholar]
- Lavelle C, Smith LC, Bisesi JH Jr., Yu F, Silva-Sanchez C, Moraga-Amador D, Buerger AN, Garcia-Reyero N, Sabo-Attwood T, & Denslow ND (2018). Tissue-based mapping of the fathead minnow (Pimephales promelas) transcriptome and proteome. Frontiers in Endocrinology (Lausanne), 9, 611. [DOI] [PMC free article] [PubMed] [Google Scholar]
- Lee J, Lee D, Sim M, Kwon D, Kim J, Ko Y, & Kim J (2018). my-SyntenyPortal: An application package to construct websites for synteny block analysis. BMC Bioinformatics, 19(1), 216. [DOI] [PMC free article] [PubMed] [Google Scholar]
- Lieberman-Aiden E, van Berkum NL, Williams L, Imakaev M, Ragoczy T, Telling A, Amit I, Lajoie BR, Sabo PJ, Dorschner MO, Sandstrom R, Bernstein B, Bender MA, Groudine M, Gnirke A, Stamatoyannopoulos J, Mirny LA, Lander ES, & Dekker J (2009). Comprehensive mapping of long-range interactions reveals folding principles of the human genome. Science, 326(5950), 289–293. [DOI] [PMC free article] [PubMed] [Google Scholar]
- Liu Z, Huang R, Roberts R, & Tong W (2019). Toxicogenomics: A 2020 vision. Trends in Pharmacological Sciences, 40(2), 92–103. [DOI] [PMC free article] [PubMed] [Google Scholar]
- Nelson ADL, Haug-Baltzell AK, Davey S, Gregory BD, & Lyons E (2018). EPIC-CoGe: Managing and analyzing genomic data. Bioinformatics, 34(15), 2651–2653. [DOI] [PMC free article] [PubMed] [Google Scholar]
- Ozata DM, Gainetdinov I, Zoch A, O’Carroll D, & Zamore PD (2019). PIWI-interacting RNAs: Small RNAs with big functions. Nature Reviews Genetics, 20(2), 89–108. [DOI] [PubMed] [Google Scholar]
- Roush KS, Krzykwa JC, Malmquist JA, Stephens DA, & Sellin Jeffries MK (2018). Enhancing the fathead minnow fish embryo toxicity test: Optimizing embryo production and assessing the utility of additional test endpoints. Ecotoxicology and Environmental Safety, 153, 45–53. [DOI] [PubMed] [Google Scholar]
- Saari TW, Schroeder AL, Ankley GT, & Villeneuve DL (2017). First-generation annotations for the fathead minnow (Pimephales promelas) genome. Environmental Toxicology and Chemistry, 36(12), 3436–3442. [DOI] [PMC free article] [PubMed] [Google Scholar]
- Wang K, Hoeksema J, & Liang C (2018). piRNN: Deep learning algorithm for piRNA prediction. PeerJ, 6, e5429. [DOI] [PMC free article] [PubMed] [Google Scholar]
- Wang K, Liang C, Liu J, Xiao H, Huang S, Xu J, & Li F (2014). Prediction of piRNAs using transposon interaction and a support vector machine. BMC Bioinformatics, 15, 419. [DOI] [PMC free article] [PubMed] [Google Scholar]
Associated Data
This section collects any data citations, data availability statements, or supplementary materials included in this article.
Supplementary Materials
Data Availability Statement
The fathead minnow genome assembly and annotation data are available at the NCBI Genome database with the accession number GCA_016745375. All raw DNA and RNA sequencing data associated with the project have been deposited to NCBI under the BioProject PRJNA565199, which includes 30 BioSamples (nos. SAMN12766224–SAMN12766252 and SAMN12875914), 103 sequence read archive data sets (accession nos. SRR 10135744–SRR10135767, SRR10199005–SRR10199006, SRR10536067–SRR10536141, and SRR10613469–SRR10613470), and one supplementary data set (accession no. SUPPF_0000003192). Data, associated metadata, and calculation tools are available from the corresponding author (biales. adam@epa.gov, huang.weichun@epa.gov).