

Abstract
COVID-19-induced “acute respiratory distress syndrome” (ARDS) is associated with prolonged respiratory failure and high mortality, but the mechanistic basis of lung injury remains incompletely understood. Here, we analyze pulmonary immune responses and lung pathology in two cohorts of patients with COVID-19 ARDS using functional single-cell genomics, immunohistology, and electron microscopy. We describe an accumulation of CD163-expressing monocyte-derived macrophages that acquired a profibrotic transcriptional phenotype during COVID-19 ARDS. Gene set enrichment and computational data integration revealed a significant similarity between COVID-19-associated macrophages and profibrotic macrophage populations identified in idiopathic pulmonary fibrosis. COVID-19 ARDS was associated with clinical, radiographic, histopathological, and ultrastructural hallmarks of pulmonary fibrosis. Exposure of human monocytes to SARS-CoV-2, but not influenza A virus or viral RNA analogs, was sufficient to induce a similar profibrotic phenotype in vitro. In conclusion, we demonstrate that SARS-CoV-2 triggers profibrotic macrophage responses and pronounced fibroproliferative ARDS.
Keywords: SARS-CoV-2, COVID-19, ARDS, macrophages, monocytes, single-cell transcriptomics, proteomics, fibrosis, lung, pulmonary fibrosis, IPF
Graphical abstract
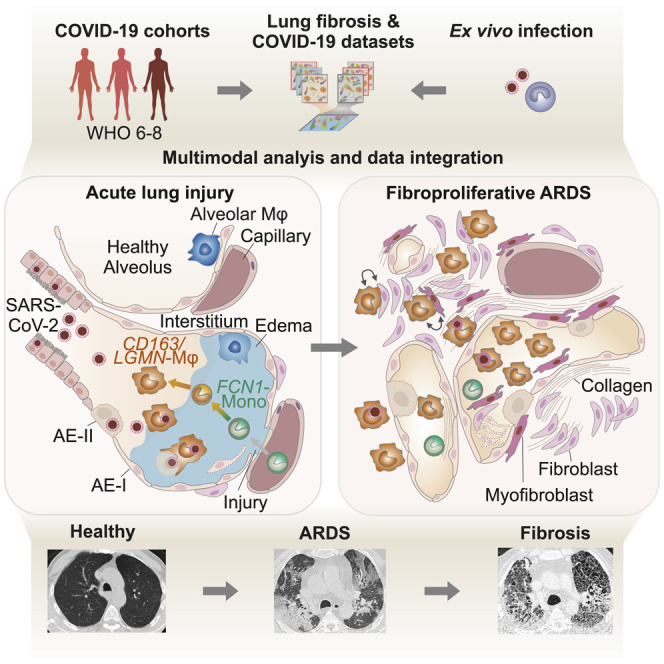
SARS-CoV-2 infection, but not influenza A, triggers immunological and pathological changes in the lung that are hallmarks of pulmonary fibrosis. A subset of CD163+ macrophages are found to drive this fibroproliferative acute respiratory distress.
Introduction
“Severe acute respiratory syndrome coronavirus-2" (SARS-CoV-2), the causative agent of “coronavirus disease 2019” (COVID-19), initially infects and replicates in epithelial cells of the upper respiratory tract (Walls et al., 2020; Hoffmann et al., 2020; Wölfel et al., 2020). While SARS-CoV-2 infection causes mild respiratory disease in the majority of individuals, approximately 5% of patients develop acute respiratory distress syndrome (ARDS), which requires prolonged respiratory support and is associated with high mortality (Osuchowski et al., 2021; Richardson et al., 2020). ARDS is a clinical syndrome defined as a combination of acute hypoxemia and bilateral radiographic opacities not explained by cardiac dysfunction or volume overload, occurring within seven days after a known clinical insult or onset of new respiratory symptoms (Ferguson et al., 2012). The pathophysiology of ARDS is typically viewed as a bi- or triphasic response to lung injury. The initial “exudative phase” is characterized by injury-induced and myeloid-cell-propagated diffuse alveolar damage, barrier breakdown, and edema. It is followed by a second “proliferative phase,” marked by epithelial cell repair, reabsorption of fluid, and restoration of alveolar integrity. The third “fibrotic phase” only occurs in a subset of patients, and it is associated with respiratory failure and high mortality (Thompson et al., 2017).
COVID-19-induced ARDS requires protracted mechanical ventilation or extracorporeal membrane oxygenation (ECMO), and it is associated with high mortality (Barbaro et al., 2020; Hasan et al., 2020; Henry and Lippi, 2020). Respiratory failure and ARDS typically develop in the second week after symptom onset, in spite of declining viral loads (Barbaro et al., 2020; He et al., 2020; Jones et al., 2021; Wölfel et al., 2020). The delayed onset suggests that ARDS in COVID-19 is driven by secondary events, including inappropriate immune responses (Carsana et al., 2020; D’Alessio and Heller, 2020; Polak et al., 2020). Supporting this notion, dysregulated systemic and mucosal immune responses, particularly within the myeloid cell compartment, have been observed in severe COVID-19 (Bharat et al., 2020; Carsana et al., 2020; Chua et al., 2020; D’Alessio and Heller, 2020; Grant et al., 2021; Liao et al., 2020; Messner et al., 2020; Schulte-Schrepping et al., 2020; Szabo et al., 2021). It has been repeatedly suggested that a subset of COVID-19 patients develops a detrimental hyperinflammatory condition, and monocytes and macrophages have been proposed as critical mediators of this inflammatory syndrome (Blanco-Melo et al., 2020; Mehta et al., 2020; Webb et al., 2020). In contrast, systematic analysis of severe COVID-19 showed that the levels of inflammatory cytokines were one or two orders of magnitude lower than in comparable cohorts of non-COVID-19-induced ARDS (Calfee et al., 2014; Leisman et al., 2020; Sinha et al., 2020), calling into question the concept of a “cytokine storm” or “inflammatory macrophage” syndrome (Remy et al., 2020). In line with this observation, monocyte and neutrophil populations in the peripheral blood of critically ill COVID-19 patients show a suppressive phenotype (Schulte-Schrepping et al., 2020). However, anti-inflammatory treatments like dexamethasone and anti-interleukin 6 (IL-6)/anti-IL-6R antibodies or janus kinase (JAK) inhibitors improve clinical outcomes when administered in the early phase of severe COVID-19 (Guimarães et al., 2021; Patel et al., 2021; Horby et al., 2021), indicating that inflammatory mediators contribute to early organ injury in COVID-19.
Besides their role in host defense and inflammation, macrophages and monocytes are important mediators of tissue repair, remodelling, and fibrosis (Adler et al., 2020; Henderson et al., 2020; Wynn and Vannella, 2016). Distinct macrophage phenotypes have been implicated in the different phases of ARDS. Inflammatory macrophages are viewed as key propagators of lung injury during the exudative phase, whereas regulatory macrophages, previously referred to as “alternatively activated” or “M2" macrophages, have been associated with the proliferative and fibrotic phase of ARDS (Herold et al., 2015; Thompson et al., 2017). Several studies have reported an accumulation of distinct monocytes and macrophages in COVID-19 (Bharat et al., 2020; Grant et al., 2021; Liao et al., 2020), yet their functional contribution to ARDS remains unknown.
Here, we investigate pulmonary immune responses in severe COVID-19 at single-cell resolution. We describe a pronounced infiltration of monocyte-derived macrophages that acquired transcriptional signatures reminiscent of profibrotic macrophages identified in idiopathic pulmonary fibrosis (IPF). Alongside the potentially profibrotic program in pulmonary macrophages, we observed a pronounced expansion and activation of myofibroblasts and fibroblasts and their engagement in extensive intercellular communication networks with pulmonary macrophages. The IPF-like transcriptional profile was induced by the exposure of monocytes from healthy donors to SARS-CoV-2, but not to influenza A virus (IAV). Consistent with the observed macrophage and mesenchymal cell responses, clinical, histological, and ultrastructural analyses revealed extensive fibrotic tissue remodelling, indicative of exacerbated fibroproliferative response in COVID-19-associated ARDS.
Results
Pulmonary CD163+ macrophages accumulate in COVID-19 ARDS
We analyzed tissue samples and bronchoalveolar lavage (BAL) fluid samples from 47 patients with severe COVID-19 using functional single-cell genomics (single-cell RNA-sequencing [scRNA-seq] and single-nucleus RNA-sequencing [snRNA-seq]), multi-epitope ligand cartography (MELC), immunofluorescence (IF) microscopy, immunohistochemistry (IHC), RNA-fluorescence in situ hybridization (RNA-FISH), and transmission electron microscopy (EM), complemented by clinical evaluations, including lung mechanics and computed tomography (CT) imaging (Figure 1 A and S1 A; Table S1). In line with previous reports, histopathological analysis of lung autopsy samples revealed diffuse alveolar damage, fibroproliferative responses, and features of organizing pneumonia (Bharat et al., 2020; Carsana et al., 2020; Osuchowski et al., 2021; Speranza et al., 2021) (Figure 1B). Accumulation of macrophages in the damaged lung tissue was detected by IHC and IF microscopy of CD68+ and hemoglobin-haptoglobin scavenger receptor CD163+ cells (Figures 1B and 1C). Quantification of CD68+ cells revealed a significant increase of macrophage density and a higher proportion of macrophages expressing CD163 in COVID-19 (Figure 1D). SARS-CoV-2 RNA was detected within epithelial cells and macrophages by RNA-FISH and consecutive IHC (Figures 1E and S1B). For a detailed analysis of pulmonary immune cell populations, we performed MELC (Schubert et al., 2006). We stained lung tissue samples of 9 autopsy cases of fatal COVID-19 with a panel of 22 immune cell markers (Figures S1C–S1E; STAR Methods) revealing a predominance of myeloid cells (CD45+, CD3–, CD4–, CD20–, and variable expression of CD11b, CD14, CD16, CD66b, CD68, CD84, HLA-DR, TREM1) with prominent clusters of macrophages (Figures 1F and 1G), in line with previous reports (Bharat et al., 2020; Carsana et al., 2020; Chua et al., 2020; Speranza et al., 2020). MELC confirmed the accumulation of CD163+ macrophages, some of which co-expressed chemokine receptor CXCR3 and complement factor C1Q (Figures 1F, 1G, S1E, and S1F). In addition, we noted a prominent deposition of collagen (Figure S1C).
Figure 1.

CD163+ macrophages accumulate in the lung in severe COVID-19
(A) Overview of study design and analyses. CT, computed tomography; BAL, bronchoalveolar lavage; scRNA-seq, single-cell RNA sequencing; snRNA-seq, single-nucleus RNA sequencing; IHC, immunohistochemistry; IF, immunofluorescence microscopy; MELC, multi-epitope ligand cartography; EM, electron microscopy; VCin, inspiratory vital capacity; PBMC, peripheral blood mononuclear cells; IAV, Influenza A virus.
(B) Postmortem analysis of consecutive histological sections of non-COVID-19 (left) and COVID-19 autopsy lung samples (right) by hematoxylin and eosin (H&E; top) and CD68 IHC (bottom). Scale bar, 100 μm.
(C) IF of CD68 (green) and CD163 (red) in lung tissue autopsy samples of COVID-19 patients and non-COVID-19 controls. Arrows indicate CD68+CD163– macrophages, and arrowheads indicate CD68+CD163+ macrophages. Scale bar, 20 μm.
(D) Quantification of CD68+ macrophage density (left) and the proportion of CD163+ macrophages (right) in lung autopsy samples from fifteen donors (as in C). Mann-Whitney test; ∗p < 0.05.
(E) Representative images of consecutive histological sections of lung autopsy samples. H&E (left), CD68 IHC (middle), and SARS-CoV-2 RNA-FISH (right). Arrowheads indicate SARS-CoV-2 RNA-positive macrophages. Scale bars, 50 μm, 25 μm. RNA-FISH, RNA-fluorescence in situ hybridization.
(F) Lung autopsy samples of 9 COVID-19 patients were analyzed by MELC with a panel of 22 markers on 19 fields of view (FOVs). Two-dimensional embedding computed by UMAP on 9,684 computationally identified CD45 positive cells (T cells, CD3+; B cells, CD20+; NK cells, CD56+; neutrophils, MRP14+/CD66b+; monocytes, MRP14+/CCR2+; macrophages, MRP14+/HLA-DR+).
(G) Relative proportion (of total CD45+ cells) of cell types in all 19 FOVs (left), and average cell numbers (summary, right).
Figure S1.

Study cohorts and (immuno-)histological analysis of lung tissues, related to Figure 1
(A) Schematic overview of all patients enrolled in the two cohorts. Clinical characteristics, course of disease, treatments, analysis time points, and outcomes are indicated.
(B) Consecutive histological sections of COVID-19 lung tissue showing H&E (left), CD68 (middle) and SARS-CoV-2 RNA (right; scale bar, 50 µm; insert scale bar, 25 µm).
(C) MELC analysis of lung autopsy tissue showing collagen and immune cell staining.
(D) UMAP embedding as shown in Figure 1F color-coded by donor.
(E) UMAP embedding as in Figure 1F, color-coded arcsin-transformed mean fluorescence intensity across all epitopes measured by MELC.
(F) CD163 fluorescence intensity across the different cellular populations identified by MELC as presented in Figure 1F, every dot represents one cell. The line indicates the threshold of CD163+ and CD163- cells.
Monocyte-derived macrophages adopt a damage response signature in severe COVID-19
In order to gain a higher resolution of pulmonary immune response during severe COVID-19, we analyzed single-cell transcriptomes of BAL cells in patients with COVID-19-associated ARDS (Figures 2 A and S2 A–S2D; Table S1). Consistent with postmortem analysis of lung tissue (Figure 1) and in agreement with previous reports (Grant et al., 2021; Liao et al., 2020; Szabo et al., 2021), we identified a dominant proportion of myeloid cells, particularly neutrophils and monocytes/macrophages (Figures 2A and S2E; Table S2). SARS-CoV-2 transcripts were primarily detected within monocytes/macrophages (Figure S2C).
Figure 2.

Monocyte-derived macrophages adopt a damage response signature in severe COVID-19
(A) UMAP (Uniform Manifold Approximation and Projection) embedding of 46,060 single-cell transcriptomes in the BAL fluid of patients with severe COVID-19 ARDS. Cell-type annotation was based on expression of canonical marker genes.
(B) UMAP embedding and slingshot trajectory of 7,816 transcriptomes of monocytes/macrophages identified in (A). Clusters were defined by comparing gene expression patterns of Leiden clusters (Mono, monocytes; Mono/Mφ, transitory monocyte-macrophages; AMφ, alveolar macrophages).
(C) Marker gene expression and SARS-CoV-2 mRNA counts, color-coded and projected onto the UMAP embedding in (B). Statistical significance of differential expression for each gene per cluster shown in Table S2.
(D) Dot plot of scaled, log-normalized expression of marker genes of the clusters in (B). Gene names color-coded by functional categories. Dot size indicates percentage of cells per cluster with any mRNAs detected, and color shows Z-scores of log-normalized mRNA counts. Statistics in Table S2.
(E) Relative proportions of cell types across all BAL scRNA-seq samples derived from (B) and Figure S2M ordered by increasing days post symptom onset.
(F) Heatmap displaying -log10 transformed adjusted p values (one-sided Fisher’s exact test) assessing the overlap between gene sets from COVID-19-associated monocyte/macrophage clusters identified in (B) (y axis) and published transcriptional signatures of COVID-19-associated monocytes/macrophages (cluster names and reference studies indicated; Table S3).
Figure S2.

Monocyte/macrophage transcriptional profiles in BAL, related to Figure 2
(A–C) UMAP embedding (as in Figure 2A, dataset 1) of BAL scRNA-seq transcriptomes color-coded according to the patients of origin (A), by sampling time after symptom onset (B), and SARS-CoV-2 mRNA molecule counts (C).
(D) Dot plot displaying the expression of canonical marker genes delineates the cell types identified in BAL (Figure 2A). Dot size shows the percentage of cells with any mRNA counts, color shows the z-scores of log-normalized expression.
(E) Cellular composition of BAL fluid across patients by cell type according to scRNA-seq. Bar height shows proportion in percent, labels show the real cell numbers, color indicates the cell type. Summary shows average across patients.
(F) Heatmap displaying differential expressed (DE, FDR < 10e-15) genes between macrophage populations (as in Figure 2B) and across the different patients analyzed.
(G) UMAP as Figure 2B split by patient, color indicates macrophage clusters as in Figure 2B.
(H) Heatmap showing the mean rank of ChEA3 transcription factor enrichment. Clusters (y axis) as in Figure 2B, transcription factors (x axis) ordered by cluster and mean rank. Input to ChEA3 were the DE genes shown in F, TFs were selected by mean rank < 30.
(I–K) UMAP embedding of 26,554 single-cell transcriptomes in the BAL fluid of severe COVID-19 patients at late stage of disease (dataset 2), color-coded according to identified cell types using canonical markers (I), patients of origin (J) and sampling time after symptom onset (K).
(L) Cellular composition of BAL fluid (dataset 2) across patients by cell type according to scRNA-seq. Bar height shows proportion in percent, labels show the total cell numbers, colors indicate the cell type. Summary shows average across patients.
(M) UMAP embedding of 12,712 transcriptomes of monocytes/macrophages in (I). Cell subtype labels were defined by cluster specific expression of previously identified BAL monocyte/macrophage markers (Figure 2F) (Mono; Monocytes, Mono/Mφ; Monocyte-derived macrophages, AMφ; Alveolar macrophages). Low quality refers to a cluster of cells with very high mitochondrial marker gene expression.
(N) UMAP from (M) split by patient, colors indicate macrophage clusters.
(O) Dot plot showing the previously identified monocyte/macrophage markers as in Figure 2F for the cell subtype labels from (M). Dot size shows the percentage of cells per cluster, color shows average expression of log-normalized mRNA counts.
A detailed analysis revealed six monocyte/macrophage populations with distinct gene expression profiles (Figures 2B–2D, S2F, and S2G; Table S2). “FCN1-Monocytes” (FCN1-Mono) expressed high levels of ficolin-M (FCN1) and CD14 but low levels of FCGR3A, encoding for CD16a (Figures 2C and 2D). FCN1-Mono were marked by a high expression of alarmins (S100A8, S100A12), selected inflammatory cytokines (IL1B, IL6, CXCL8), and CCR2, the receptor for monocyte chemoattractant protein-1 (MCP-1/CCL2) (Figures 2C, 2D, and S2F). Notably, FCN1-Mono also expressed TGFB1, encoding for TGF-β, a master regulator of wound healing and repair, and its downstream target TGFBI. The adjacent “Mono/Mφ” population showed a less distinct phenotype, indicative of a transitory differentiation state. (Figures 2D and S2F). Mono/Mφ and the adjacent monocyte-derived macrophage population expressed high levels of SPP1, encoding for Osteopontin, a multifunctional matricellular protein and cytokine expressed in macrophages in various pathologies (Rittling, 2011). The SPP1 + macrophage population was defined by high expression of CD163 and LGMN, encoding for Legumain, and is henceforth referred to as “CD163/LGMN-Mφ” (Figures 2C and 2D). We also identified three types of alveolar macrophages (AMφ1, AMφ2, and proliferating AMφ), characterized by high expression of FABP1, FABP4, and MARCO (Figure 2D), characteristic for AMφ (Arredouani et al., 2005). AMφ-2 expressed high levels of TGF-β family member “inhibin beta A” (INHBA), while “proliferating-AMφ” expressed cell-cycle-related genes (MKI67, TOP2A, NUSAP1) (Figures 2C and 2D).
Transcriptional analysis indicated that infiltrating monocytes (FCN1-Mono) differentiated along a curved trajectory (Figure 2B) toward CD163/LGMN-Mφ, AMφ1, and AMφ2 (Figure 2B). The prominent expression of monocyte chemoattractant CCL2 in FCN1-Mono, Mono/Mφ, and CD163/LGMN-Mφ suggested a feedforward loop of monocyte recruitment and subsequent macrophage differentiation (Figure 2D).
Macrophage populations were characterized by the expression of genes related to TGF-β signaling (TGFB, TGFBI, INHBA, NRP1), scavenger receptors and molecules associated with apoptotic cell uptake (MRC1, CD163, MERTK, TREM2, MARCO), lipid handling and -metabolism (PLA2G7, APOC, APOE, LIPA, LPL, FBP1, FABP4), and extracellular matrix (ECM) components or molecules involved in ECM interaction and breakdown (FN, VCAN, SPP1, LGMN, MMP9, SDC3) (Figures 2C and 2D). Transcription factor enrichment analysis using the ChEA3 tool (Keenan et al., 2019) predicted SPI1 (encoding PU.1) as regulatory in FCN1-Mono and transcription factor EC (TFEC) and glycosylated lysosomal membrane protein (GLMP) for CD163/LGMN-Mφ, while nuclear receptor peroxisome proliferator-activated receptor gamma (PPARγ), involved in alveolar macrophage differentiation, lipid homeostasis, and repression of inflammatory macrophage responses (Kidani and Bensinger, 2012; Schneider et al., 2014), was predicted to control transcription in AMφ1 and AMφ2 (Figure S2H; Table S2).
We corroborated these findings on a second set of BAL samples from patients with severe COVID-19 ARDS, revealing similar macrophage populations (Figures S2I–S2O). FCN1-Mono, Mono-Mφ, and CD163/LGMN-Mφ were dominant in the first four weeks of COVID-19 ARDS, and AMφ1 and AMφ2 repopulated the alveolar compartment in the later stages of the disease (Figure 2E). For further validation, we compared the transcriptional phenotypes of macrophages identified in our cohort with previously published transcriptomes of pulmonary macrophages in COVID-19 (Grant et al., 2021; Liao et al., 2020). We found highly similar macrophage profiles in all three COVID-19 datasets (Figure 2F), confirming that the accumulation of monocyte-derived macrophages with damage response- and tissue repair signatures is a common feature of COVID-19 ARDS.
Pulmonary macrophages in COVID-19 adopt a profibrotic phenotype
Misguided damage repair- and wound healing responses by monocytes and macrophages play a key role in tissue remodeling, scarring, and fibrosis (Adler et al., 2020; Henderson et al., 2020; Misharin et al., 2017; Satoh et al., 2017). Macrophages within fibrotic niches in pulmonary fibrosis express shared transcriptional programs (Aran et al., 2019; Ayaub et al., 2021; Joshi et al., 2020; Morse et al., 2019; Reyfman et al., 2019). We therefore assessed the transcriptional similarity between monocytes and macrophages in severe COVID-19 and macrophages from four published datasets of pulmonary fibrosis (Adams et al., 2020; Ayaub et al., 2021; Reyfman et al., 2019; Morse et al., 2019). We computed cell-based scores based on gene set expression and assessed differences across populations (Figures 3 A and S3 A), in addition to overrepresentation analysis between gene sets (Figure 3B). These comparisons indicated that the CD163/LGMN-Mφ population closely resembles IPF-specific macrophage phenotypes, while FCN1-Mono and AMφ1 and AMφ2 were more similar to homeostatic monocytes and alveolar macrophages, respectively (Figures 3A, 3B, and S3A; Table S3).
Figure 3.

Gene set enrichment and data integration reveals a profibrotic phenotype of COVID-19-associated macrophages
(A) Gene set module score of “IPF-expanded macrophages” (IPFe-Mφ) and alveolar FABP4+Mφ (Ayaub et al., 2021), calculated based on single transcriptomes. Projected onto the UMAP embedding (top) and plotted as violin plots (bottom) across the monocyte/macrophage clusters (annotated in Figure 2B). Dot color indicates signature module score. Violin colors show cluster identity, numbers indicate -log10 transformed adjusted p values (one-sided wilcoxon test compared to average), and lines in violins indicate median scores per cluster.
(B) Heatmap representing -log10 transformed adjusted p values (one-sided Fisher’s exact test) assessing the overlap of gene sets from monocyte/macrophage clusters identified in Figure 2B (y axis) and published transcriptional signatures of monocyte/macrophage clusters derived from the indicated IPF datasets (cluster names and reference studies indicated on the x axis; Table S3).
(C) Schematic depicting monocyte/macrophage data integration from present study and Bharat et al. (2020) with two human lung fibrosis reference datasets (Adams et al., 2020; Morse et al., 2019) via scVI. COVID-19 macrophages were mapped to IPF or control macrophages based on a kNN (k-nearest neighbor)-proximity mapping.
(D) UMAP of 138,341 cells derived from all four datasets based on integrated scVI embedding.
(E) UMAP as in (D) highlighting COVID-19-associated macrophage clusters annotated in Figure 2B. Cells from reference datasets shaded in gray.
(F) Proximity analysis of macrophage clusters annotated in Figure 2B and macrophages identified in IPF and healthy controls, respectively. Circle size shows cell fraction, color codes indicate the -log10 transformed adjusted p values, and bold black circle indicates statistical significance (adjusted p < 0.0001, Fisher’s exact test, one-tailed with Benjamini-Hochberg correction).
Figure S3.

Gene set enrichment analysis and data integration analysis with reference datasets, related to Figure 3
(A) Signature module scores of monocyte-macrophage clusters associated to idiopathic pulmonary fibrosis identified in two publically available datasets (Adams et al., 2020; Morse et al., 2019; Reyfman et al., 2019) projected on the UMAP embedding (top), and plotted as violin plots (bottom) across the clusters of monocyte-macrophage clusters of BAL scRNA-seq (annotation in Figure 2B). Violin plots are filled with color displaying cluster identity as in Figure 2B. Boxes above the violins show negative log10 transformed adjusted p values (one-sided Wilcoxon test compared to average). The lines in the violin plots represent the median of the respective scores per cluster.
(B) UMAP with kernel density overlay showing the density of cells from each condition (Control, IPF, and COPD) in the embedding (related to Figure 3D). Darker red indicates higher relative fractions of those cells in that UMAP region.
(C) Cell population density of macrophage clusters identified in this study (top) and in Bharat et al. (2020) (bottom). Kernel density overlay on UMAP embedding as in Figure 3D, color intensity shows relative fraction of cells.
(D) Marker gene expression projected on the UMAP of COVID-19/lung diseases integration analysis as presented in Figure 3D. Color shows normalized gene counts in ln(CPM+1). CPM: counts per million.
(E) Proximity analysis shows similarity of macrophage populations in COVID-19 (Bharat et al., 2020) to those in IPF and healthy patients (control). Circle size shows cell fraction, color codes the -log10 transformed adjusted p values, and bold black circle indicates statistical significance (adjusted p < 0.0001) (Fisher exact test, one-tailed with Benjamini-Hochberg correction).
In order to directly compare the cellular transcriptomes of COVID-19-associated and IPF-associated macrophages, we integrated our scRNA-seq data along with another COVID-19 dataset (Bharat et al., 2020) with two scRNA-seq datasets containing IPF, COPD (chronic obstructive pulmonary disease), and control samples (Adams et al., 2020; Morse et al., 2019) using single-cell variational inference (scVI) (Lopez et al., 2018; Wolf et al., 2018) (Figures 3C–3F). The joint embedding of 138,341 macrophage transcriptomes revealed significant similarity of CD163/LGMN-Mφ and proliferating-AMφ populations with IPF-associated macrophages (Figures 3D–3F, S3B, and S3C). Both IPF- and COVID-19-associated macrophages expressed genes with well-known pathogenic functions in fibrosis, such as SPP1, TGFB1, TGFBI, LGMN, and CCL18 (Figure S3D). Proximity analysis based on a k-nearest neighbors classifier revealed a significant similarity of CD163/LGMN-Mφ and proliferating-AMφ with IPF-associated macrophages (relative fractions 0.66 and 0.83, respectively; adjusted p < 0.0001; Fisher’s exact test, one-tailed) (Figure 3F). AMφ2 (0.63) and FCN1-Mono (0.47), which resemble steady-state alveolar macrophages and monocytes, were embedded in proximity to macrophages from healthy lungs (Figures 3F, S3B, and S3C). Similar results were obtained analyzing a published COVID-19 dataset (Bharat et al., 2020), confirming that monocyte-derived macrophages (MoM3), which corresponded to CD163/LGMN-Mφ (Figure 2F), showed a high similarity with IPF-associated macrophages (Figures S3C and S3E).
Gene set overrepresentation, scRNA-seq data integration, and proximity analyses revealed that pulmonary CD163/LGMN-Mφ in COVID-19 showed significant transcriptional similarity with macrophages found in IPF. The data indicate that newly recruited monocyte-derived macrophages in COVID-19 adopt a fibrosis-associated phenotype.
Interaction of pulmonary macrophages and mesenchymal cells in COVID-19 ARDS
To further investigate the association of pulmonary macrophage populations and fibrotic responses, we analyzed postmortem lung tissue samples from patients with fatal COVID-19. Using snRNA-seq, we identified 15 distinct populations of lung cells based on canonical marker genes (Figure 4 A) (Lukassen et al., 2020). We found macrophage phenotypes similar to those described in BAL (Figures 4B and S4 A), as well as pericytes, smooth muscle cells, fibroblasts, and myofibroblasts (Figures 4C and S4B). Fibroblasts and myofibroblasts showed strong upregulation of ECM protein-encoding genes in COVID-19, particularly in later stages of the disease (days 34–82), indicating a strong fibrotic response (Figure S4C). We next inferred communication networks between macrophages and mesenchymal cells using the ligand-receptor interaction tool CellChat (Jin et al., 2021). The analysis revealed strong interactions of CD163/LGMN-Mφ and, to a lesser extent, Mono/Mφ with myofibroblasts, fibroblasts, and pericytes (Figure 4D). The interaction strength was increased at later time points (days 34–82) relative to earlier stages of the disease (days 7–21) (Figure 4D). Information flow analysis showed an involvement of potent profibrotic pathways, including Col, FGF (fibroblast growth factor), TGFB1, and SPP1, among others (Figure 4E).
Figure 4.

Macrophage-fibroblast interactions in COVID-19 lungs
(A) UMAP embedding of 48,656 snRNA-seq transcriptomes of lung tissue of six patients with fatal COVID-19 and three non-COVID-19 controls. Cell-type annotation based on expression of canonical marker genes.
(B) UMAP embedding of 7,504 macrophages identified in (A).
(C) UMAP embedding of 7,492 fibroblasts, smooth muscle cells (SMCs), and pericytes identified in (A).
(D) Circle plot showing cell-cell interaction strength between macrophage, fibroblast, SMC, and pericyte clusters predicted by CellChat. Each circle represents one cell type, edges between circles represent intracellular signaling between cell types, and edge thickness reflects interaction strength, while the colored edges show differential interaction strength, where red represents increased interaction strength in late (n = 3) versus early (n = 3) samples.
(E) Signaling pathways ranked by differential overall information flow of inferred interactions in early (red) and late (blue) samples.
(F) IF of lung tissue stained for macrophages (CD68, red) and myofibroblasts (SM22, green), nuclei (DAPI, blue), and autofluorescence visible as faint gray. Macrophages are indicated by arrows, expanded SM22 foci are indicated by arrowheads, and asterisks denote erythrocyte filled capillaries in alveolar septa (scale bar, 50 μm; insert scale bar, 20 μm).
(G) Two representative MELC FOVs showing CD163+ macrophages (yellow), collagen (cyan), and nuclei (DAPI, magenta). Scale bar, 100 μm.
Figure S4.

Macrophages-fibroblast interactions in COVID-19 lungs, related to Figure 4
(A) Marker gene expression delineates the macrophage embedding in Figure 4A. Color shows the normalized mRNA counts.
(B) Dot plot showing marker genes used to annotate the fibroblast, SMC and pericyte subclusters. Related to Figure 4A (right).
(C) Dot plot depicting scaled average expression of profibrotic factors in fibroblasts and myofibroblasts split according to control and disease duration. Scaled expression levels are color coded and the percentage of cells expressing the gene is size coded. Significant differences between early (d < 30) and late (d > 30) patients are highlighted by a black circle. Genes highlighted in early/late patients indicate th e condition where the gene is upregulated.
(D) Autopsy lung tissue reveals close association between macrophages (CD68, red) and fibroblasts (SM22, green) in COVID-19 compared to control (left). Cell nuclei are stained with DAPI (blue), autofluorescence is visible in faint gray (Scale bar, 50 μm; Insert scale bar, 20 μm).
(E) Analysis of MELC-imaging displayed in Figure 4G. (Left) Center coordinates of CD163+ (blue) and CD163- (red) macrophage localizations in respect to collagen IV staining. (Right) Segregation of macrophages into localization areas named ‘in collagen IV’, ‘adjacent to collagen IV’ or ‘outside of collagen IV’.
(F) Proportions of CD163+ and CD163- macrophages per field of view of analyzed autopsy tissue localized ‘in’, ‘adjacent’ or ‘outside’ of collagen IV structures (∗∗ = Bonferroni corrected p value < 0.01, paired two-sided Wilcoxon signed rank test).
We next assessed tissue distribution of SM22+ myofibroblasts and CD68+ macrophages by IF in autopsy lung samples. Myofibroblasts were expanded compared to non-COVID-19 controls, and macrophages were frequently found in close proximity to SM22+ loci (Figures 4F and S4D). We also noted a marked co-localization of CD163+ macrophages and collagen deposits (Figures 4G, S4E, and S4F); however, expansion of both collagen areas and macrophages increases the probability of colocalization.
In summary, we found that pulmonary macrophages colocalized with collagen and myofibroblast loci and engaged in strong signal interactions with myofibroblasts, fibroblasts, and pericytes. Interactions between CD163/LGMN-Mφ and mesenchymal cells may thus contribute to a highly profibrotic milieu in COVID-19 ARDS.
COVID-19 is associated with pronounced fibroproliferative ARDS
Identification of fibrosis-associated transcriptional signatures in macrophages and their interactions with mesenchymal cells in COVID-19 ARDS prompted us to assess evidence of lung fibrosis in COVID-19. We analyzed a cohort of 16 patients with severe COVID-19-induced ARDS (60.5 years old [IQR 16.3], 94% male), defined by the requirement of veno-venous (vv)ECMO (Table S4). The mean duration of vvECMO therapy was 36.5 days (IQR 57), the median time from start of mechanical ventilation to initiation of vvECMO was 12.5 days (IQR 10), 68.8% of patients could be weaned from vvECMO, and the overall mortality was 56.3% (Table S4). Patients in this cohort had a PaO2 /FiO2 ratio of 98.3 mmHg (IQR 56.9) (Figure S5 A) and a median partial pressure of PaCO2 of 71.5 mmHg (IQR 15.9) (Figure S5B), measured 2 to 4 h prior to the initiation of vvECMO, indicating severe ARDS. The elevated PaCO2, while the patients were ventilated with a supranormal minute volume (8.7 l/min; IQR 3.5), indicated a pathologically increased dead space. This is consistent with fibroproliferative tissue remodeling in ARDS (Hendrickson et al., 2015). Inspiratory vital capacity (VCin) decreased continuously in severe ARDS on vvECMO support, indicating a progressive, restrictive ventilatory defect (Figure 5 A). To assess radiographic correlates of these restrictive defects, we compared the first available CT scan to images during severe ARDS on vvECMO treatment and to the last available CT scan. The majority of ARDS patients showed multilocular bilateral ground glass opacities (GGOs) and consolidations in the first available CT scan, typical for acute COVID-19 pneumonia (Figures 5B and S5C). Over the course of the disease, CT imaging revealed progressive consolidation and reticulation, indicative of fibroproliferative ARDS. Patients who died on vvECMO failed to resolve consolidations and fibrous stripes, whereas patients who could be successfully weaned from vvECMO and ultimately recovered showed a gradual resolution of fibrosis with residual reticulations in the last available CT (Figures 5B and S5C), which was also reflected in a normalized PaCO2 and PaO2/FiO ratio (Figure S5B).
Figure S5.

CT imaging and histopathology analysis of severe COVID-19-associated ARDS, related to Figure 5
(A) P/F ratio (horowitz index) before and after vvECMO. ARDS severity is indicated by dashed lines. Statistical significance determined by paired t test (∗p < 0.05; ∗∗p < 0.01).
(B) Arterial CO2 partial pressure before and after initiation of vvECMO therapy. Upper limit of normal pCO2 range is depicted by a dashed line. Statistical significance determined by Mann Whitney Test (∗p < 0.05; ∗∗p < 0.01).
(C) Representative computed tomography (CT) images of the apical (top row) and basal (bottom row) lung from 13 additional COVID-19 patients (cohort 1). Columns indicate the first, intermediate and last available images.
(D) Low power images of consecutive histological sections of autopsy lung tissue of fatal COVID-19 compared to control stained with H&E and chromogenic immunohistochemistry against collagen I. Scale bars represent 200 μm.
(E) High power images of consecutive histological sections (same field of view of Figure 5C) of autopsy lung tissue of fatal COVID-19 compared to control stained with chromogenic immunohistochemistry against collagen III and IV. Scale bars represent 50 μm.
(F) Quantification of collagen III and IV stained area in histological sections. Dots represent autopsy cases, significance of population shift of COVID-19 compared to control assessed by Mann Whitney Test (∗p < 0.05; ∗∗p < 0.01; ∗∗∗p < 0.001).
Figure 5.

Severe COVID-19 induces pronounced fibroproliferative ARDS
(A) Inspiratory vital capacity (VCin) in early phase, and acute vvECMO phase (paired t test ∗p < 0.05; ∗∗p < 0.01).
(B) (Left) Schematic representation indicating imaging planes of CT. (Middle) Healthy lung and denomination of anatomical structures. RLL, right lower lobe; RUL, right upper lobe; LUL, left upper lobe; LLL, left lower lobe; A, aorta; T, trachea; C, vena cava; RV, right ventricle; LV, left ventricle. (Right) Representative images from a case of severe COVID-19 ARDS, representing the first available (left column), one intermediate (middle column), and the last available (right column) CT scan.
(C) Histopathology of autopsy lung tissue of fatal COVID-19. High-power images of consecutive histological sections stained with H&E (top) and chromogenic IHC for collagen I (middle) and CD68 (bottom). Scale bar, 50 μm.
(D) Quantification of pulmonary fibrosis (Ashcroft score) and collagen-I-stained area. Dots represent individual autopsies (line at mean with SEM), and significance of population shift of COVID-19 compared to control assessed by Mann Whitney Test (∗∗p < 0.01; ∗∗∗p < 0.001).
(E) Transmission EM of healthy (1–2) and COVID-19 (3–6) autopsy lungs. 1: Alveolar septum between two alveolar lumina (Alv) with capillary (Cap), interstitium, and alveolar epithelium (Alvepi). The interstitium with interstitial cells (ICs) and a connective tissue network of collagen fibrils (col) and elastic fibers (el). 2: Alveolar macrophage with lysosomal vesicles. 3: Alveolar septum containing Cap and interstitium. The alveolar epithelium is only partly present, leaving the alveolar epithelial basal lamina denuded toward the alveolar lumen at sites of detachment. The septum is thickened due to swelling of the interstitium, containing cells, collagen fibrils, elastic fibers, and homogeneous matrix. ICs contain high numbers of vesicles. 4: Infolding of denuded alveolar epithelial basal lamina (bl) with collapsed alveolar lumen and partly “glued” opposing basal lamina (red arrowheads), features of collapse induration. 5: Foamy alveolar macrophages containing vesicles of varying size and content. Fibrin accumulations (fib) in close proximity. 6: Thickened alveolar septum containing capillaries with swollen endothelium. The alveolar epithelium is desquamated toward the alveolar lumen containing fibrin. Note vesicle-filled ICs with foamy appearance.
To assess the extent of fibrotic tissue remodelling, we analyzed 14 autopsy samples and one non-autopsy sample from 15 patients with COVID-19 ARDS (cohort 2) and seven non-COVID-19 samples from five autopsies and two non-autopsy cases (controls) (Figure S1A). Histopathological evaluation (H&E) revealed extensive diffuse alveolar damage and edema early on and increasing fibroproliferative tissue remodeling and fibrotic foci at later time points after the onset of ARDS (Figures 5C and S5D). Pulmonary fibrosis, scored by two independent experienced pathologists using a well-established semiquantitative fibrosis score (Ashcroft et al., 1988), was significantly increased in COVID-19 ARDS (Figure 5D). Pulmonary fibrosis is characterized by interstitial fibroblast proliferation and deposition of ECM proteins, particularly collagen. Here, we found extensive interstitial collagen type 1, 3, and 4 deposition in COVID-19-associated ARDS (Figures 5C, 5D, and S5D–S5F).
Transmission EM analysis of autopsy lung samples revealed thickened alveolar septa due to interstitial edema and an accumulation of connective tissue fibers, in particular, collagen fibrils and elastic fibers (Figure 5E). The alveolar epithelium was partly desquamated, resulting in a denuded alveolar epithelial basal lamina. Infoldings of the denuded basal laminae represent an ultrastructural characteristic of alveolar collapse and collapse induration, and these were frequently found in severe COVID-19 (Ochs et al., 2021). Collapse indurations were surrounded by deposits of collagen fibrils and elastic fibers. Interstitial cells within the thickened septa had a foamy appearance, containing membrane-bound vesicles of varying size. The vesicle contents appeared largely homogeneous, with low to moderate electron density. A distinction between interstitial macrophages and activated fibroblasts is difficult based solely on morphology, which is why we refer to these cells simply as interstitial cells. Alveolar macrophages also had a foamy appearance, but their vesicles also contained stacks of lipid lamellae, a typical feature in alveolar macrophages.
In conclusion, we revealed exacerbated fibroproliferative responses with clear ventilatory, radiographic, histological, and ultrastructural features of pulmonary scarring and fibrosis during severe COVID-19-associated ARDS.
SARS-CoV-2 triggers a fibrosis-associated transcriptional profile in monocytes
Key mediators of wound healing and fibrosis, including TGF-β, are induced in phagocytes upon tissue damage and uptake of apoptotic cells (Huynh et al., 2002). Profibrotic damage response signatures in macrophages may therefore result from extensive lung injury during ARDS and ventilator-induced lung injury. As SARS-CoV-2 transcripts were found in macrophages (Figures 1E and S2C), and particularly in CD163/LGMN-Mφ (Figure 2C), we tested whether viral contact might directly elicit fibrosis-associated signatures in monocytes. We stimulated classical (CD14+CD16–) monocytes isolated from healthy donors with SARS-CoV-2 for 18 h and analyzed the transcriptional responses by scRNA-seq with multiplexing of experimental conditions (by hashtag oligos [HTOs]) and donors (by single nucleotide polymorphism [SNP]) to minimize batch effects (Figures 6 A, S6 A, and S6B). We included ligands of viral RNA sensors, retinoic acid–inducible gene I (RIG-I), and melanoma differentiation-associated protein 5 (MDA5) agonist 3′-ppp-hairpin-RNA (3p-hpRNA) and R848, a dual agonist of Toll-like receptor (TLR)-7/-8, for comparison. We observed distinct responses to 3p-hpRNA, R848, and SARS-CoV-2 (Figure 6B; Table S5). The monocyte response to SARS-CoV-2 was distinct, however, partially overlapping with 3p-hpRNA stimulation, indicating the potential of SARS-CoV-2 to elicit modest type-I interferon (IFN) responses via RIG-I-like receptors (Figures 6C, S6B, and S6C). Notably, several genes characteristic of pulmonary macrophages identified both in COVID-19 and in lung fibrosis, including MRC1, CD163, MERTK, LGMN, and MMP9, were specifically induced upon exposure to SARS-CoV-2 (Figures 6C and S6D; Table S5). SARS-CoV-2 also induced TGF-β family genes NRP1 and TGFBI (Figures 6C and S6D). NRP1 promotes host cell binding and entry of SARS-CoV-2 (Cantuti-Castelvetri et al., 2020; Daly et al., 2020); yet, despite abundant viral transcripts in SARS-CoV-2-stimulated monocytes, we found no evidence of productive infection (unpublished data; Figure S6A). In contrast to R848, SARS-CoV-2 stimulation induced only limited expression of IL1B and no IL6 (Figures 6C and S6D). Transcription factor predictions revealed an overlap of SARS-CoV-2-stimulated monocytes with pulmonary CD163/LGMN-Mφ macrophages in COVID-19 ARDS, including a predicted involvement of TFEC, GLMP, and HLX (H2.0-like homeobox protein) (Figure S6E; Table S5).
Figure 6.

SARS-CoV-2 induces profibrotic programs in classical monocytes in vitro
(A) Schematic depiction of the experimental layout.
(B) UMAP embedding of 1,123 quality-filtered transcriptomes of human monocytes stimulated as outlined in (A).
(C) Dot plot displaying differentially expressed (DE) genes in the indicated stimulation conditions. Label color indicates gene categories. Adjusted p values are available in Table S5.
(D) Signature module score of IPF-expanded macrophages (IPFe-Mφ) and alveolar FABP4+Mφ (Ayaub et al., 2021) projected onto the UMAP embedding (top) and plotted as violin plots (bottom) across the clusters of stimulated monocytes. Numbers above violins show -log10 transformed adjusted p values (one-sided Wilcoxon test compared to average). Lines indicate median scores per cluster.
(E) Heatmap displaying -log10 transformed adjusted p values (one-sided Fisher’s Exact Test) comparing overlap between gene sets from stimulated monocytes with published transcriptional signatures of IPF-associated monocytes/macrophages. Cluster names and reference studies are indicated on the x axis; Table S3.
Figure S6.

Monocyte gene expression after stimulation with SARS-CoV-2, 3p-hpRNA, and R848
(A) SARS-CoV-2 mRNA counts projected onto the UMAP embedding (Figure 6B).
(B) Transcriptomes derived from two donors (indicated in blue and red) and two technical replicates (circles and triangles) are indicated in the UMAP embedding corresponding to Figure 6B.
(C) Heatmap displaying z-scores of log-normalized mRNA counts across all stimulation conditions. Differential expression (DE) cutoff was set at FDR of 1e-15.
(D) Marker gene expression projected onto the UMAP embedding as in Figure 6B.
(E) Heatmap showing the mean rank of ChEA3 transcription factor enrichment. Clusters (y axis) as in Figure 6B, transcription factors (x axis) ordered by cluster and mean rank. Input to ChEA3 were the DE genes shown in Figure S6C, TFs were selected by mean rank < 35.
(F) Signature module scores of IPF-associated monocyte/macrophage clusters derived from two published datasets (Morse et al., 2019; Reyfman et al., 2019) projected onto the UMAP embedding (top), and plotted as violin plots (bottom) across the clusters of stimulated monocytes (annotation in Figure 6B). Negative log10-transformed adjusted p values (one-sided wilcoxon test compared to average) are displayed above violins. Lines indicate median scores per cluster.
Given the overlap of gene expression in SARS-CoV-2-exposed monocytes and CD163/LGMN-Mφ, we assessed the potential enrichment of IPF-associated macrophage gene sets. Fibrosis-associated macrophage gene signatures were specifically enriched in SARS-CoV-2-exposed monocytes, but not in 3′-hpRNA-stimulated, R848-stimulated, or unstimulated control monocytes (Figure 6D and S6F). We found a high similarity of gene expression in SARS-CoV-2-stimulated monocytes and IPF-associated macrophages, including IPF-specific clusters (Figure 6E). These results indicate that SARS-CoV-2 directly triggers a transcriptional profile in human monocytes that resembles fibrosis-associated pulmonary macrophages.
SARS-CoV-2 triggers a profibrotic proteome profile in monocytes
To validate and specify these findings, we performed multiplexed quantitative shotgun proteomics, which can provide data with high relevance for cellular phenotypes (Buccitelli and Selbach, 2020). Monocytes isolated from healthy donors were stimulated with SARS-CoV-2 or IAV (H3N2), which has been well-studied at the proteome level (Bogdanow et al., 2019; Sadewasser et al., 2017) (Figure 7 A). Analysis at 1, 3, and 18 h post infection (hpi) reproducibly quantified 6,951 proteins and 5,299 phosphorylation sites in 2 replicates from 4 donors (Figure S7 A). Consistent with the ability of IAV to productively infect monocytes (Cline et al., 2017), we found an increase of IAV proteins over time (Figure 7B). In contrast, SARS-CoV-2 proteins remained constant or decreased (Figure 7B). Only SARS-CoV-2 M protein (VME1) showed a moderate increase, suggesting some residual viral transcription and translation (Figures 7B and S7B).
Figure 7.

Proteomic analyses of SARS-CoV-2-induced profibrotic phenotype in classical monocytes
(A) Schematic depiction of the experimental layout.
(B) Protein log-2-fold-changes over time for IAV (left, blue) and SARS-CoV-2 (right, red) and host proteins (gray).
(C) Heatmap of DE host proteins (ANOVA test, filtered by Benjamini-Hochberg adjusted p value < 5%). Protein clusters obtained by fuzzy-c-means clustering of Z-scored protein intensities are indicated in the figure, and corresponding profiles are reported below the heatmap.
(D) GSEA of protein intensity ratios of SARS-CoV-2 over IAV infection, calculated for the host proteome dataset. ∗FDR < 10%; ∗∗FDR < 5%; ∗∗∗FDR < 1%.
(E) Schematic presentation of selected proteins regulated by SARS-CoV-2 stimulation in monocytes, color-coded by log2-fold changes (infection versus control, 18 hpi).
(F) Heatmap representation of p-values (one sided Wilcoxon signed-rank test) for the enrichment of the indicated reference gene sets calculated by eCDF.
Figure S7.

Quantitative shotgun proteomics and phosphoproteomics of SARS-CoV-2- and IAV-infected monocytes, related to Figure 7
(A) Principal component analysis of proteome and phosphoproteome for SARS-CoV-2, IAV and mock infection.
(B) Annotated MS2 spectrum of one peptide identified from SARS-CoV-2 M protein (left) and heatmap representing the TMT reporter ion relative intensities for the specified peptide (right).
(C) Schematic presentation of selected proteins involved in the inflammatory response pathways in monocytes, color-coded by log2-fold changes (IAV-infection versus control, 18h time point).
(D) Heatmap for all CEBPB identified peptides (top panel) and schematic representation of peptide location within the CEBPB sequence (bottom panel).
(E) Annotated MS2 spectrum of the phosphopeptide identified from IRF7 (left) and heatmap representing the TMT reporter ion relative intensities for the specified peptide (right).
(F) Annotated MS2 spectrum of the phosphopeptide identified from CEBPB (left) and heatmap representing the TMT reporter ion relative intensities for the specified peptide (right).
(G) Secretion of selected proteins quantified by ELISA. Bars represent the mean across all corresponding measurements. Error bars represent the standard deviation. Symbols depict donor-specific measurements. All experiments were tested against mock for significance (one-sided t test, on log transformed data). Differences between SARS-CoV-2 and IAV-stimulated cells were tested for significance using a two-sided t test. Significance reported in the figure corresponds to Benjamini-Hochberg adjusted p values of: ∗; p < 10%, ∗∗; p < 5%, ∗∗∗; p < 1%.
(H) Empirical cumulative distributions of gene sets depicted in Figure 7F. Log2-fold-change distributions of the gene sets were tested against all other proteins by one-sided Wilcoxon signed-rank tests. p values are depicted next to each distribution.
SARS-CoV-2 and IAV induced distinct changes in the host proteome, particularly at 18 hpi (Figure 7C; Table S6). To identify SARS-CoV-2-specific responses, we performed gene set enrichment analysis (GSEA) on SARS-CoV-2 over IAV protein ratios (Subramanian et al., 2005). SARS-CoV-2-specific gene sets were related to innate immunity, antiviral defense, and RIG-I-like receptor signaling, while IAV induced viral gene expression- and replication-associated genes (Figure 7D; Table S6). Importantly, genes related to wound healing and fibrosis were upregulated in response to SARS-CoV-2 (Figure 7D).
For visualization, we mapped the proteomic data to antiviral and profibrotic pathways, revealing marked differences in the responses to IAV and SARS-CoV-2 (Figures 7E and S7C). SARS-CoV-2 induced upregulation of RIG-I-like receptors and double-stranded RNA (dsRNA) sensors, as well as scavenger receptors and related membrane proteins. Additionally, we observed an upregulation of transcription factors related to inflammation (NFkB, IRF7) and macrophage differentiation (MAFB, CEBPB) (Figures 7E and S7C). MAFB was highly expressed in CD163/LGMN-Mφ (Figure 2D), and it has been identified as a specific marker of macrophages in pulmonary fibrosis (Aran et al., 2019). CEBPB activation was predicted in SARS-CoV-2-stimulated monocytes (Figure S6E), and it has been shown to license differentiation of profibrotic macrophages (Satoh et al., 2017). Additionally, we observed upregulation of the transcriptionally active longer isoforms of the liver-enriched activator protein (LAP∗/LAP) and downregulation of the shorter inhibitory of ther liver-enriched inhibitory protein (LIP) isoform of CEBPB (Figure S7D). This isoform switch occurs via alternative translation initiation from the same mRNA and is only detectable at the protein level (Descombes and Schibler, 1991). An increased LAP:LIP ratio mediates macrophage differentiation (Calkhoven et al., 2000; Huber et al., 2012). Translation of the LAP∗/LAP isoform is induced upon activation of PKR, consistent with its induction by SARS-CoV-2 (Figure 7E). We further identified increased phosphorylation of specific sites on CEBPB and IRF7, suggesting an enhanced transcriptional activity (Figures 7E, S7E, and S7F).
Consistent with in vivo transcriptomic data (Table S2), we detected the induction of myeloid-cell-attracting and profibrotic chemokines CCL2, CCL8, CCL24, and CXCL8 (Figures 7E and S7G). Several secretory proteins involved in tissue remodeling and fibrosis were upregulated, including proteases (LGMN, MMP9, MMP14, CTSL), protease inhibitors (TIMP1), phospholipase PLA2G7, transglutaminase TGM2, and TGF-β downstream target TGFBI (Figure 7E). Similar to the transcriptomic data, IPF-specific macrophage signatures “IPFe-Mφ” (Ayaub et al., 2021), “SPP1+Mφ-IPF” (Morse et al., 2019), and “Mφ-fibrosis” (Reyfman et al., 2019) were highly enriched in monocytes stimulated with SARS-CoV-2 for 18 h, but not in IAV-infected cells (Figure 7F and S7H). Thus, detection of SARS-CoV-2, but not IAV, by human classical monocytes constitutes a trigger of fibrosis-associated differentiation programs.
Discussion
Pathomechanisms of severe COVID-19-associated ARDS remain incompletely understood (Fan et al., 2020). Here, we report the accumulation of monocyte-derived macrophages with an enrichment of fibrosis-associated gene signatures and significant similarity to macrophage populations found in IPF in the lung during severe COVID-19 (Adams et al., 2020; Ayaub et al., 2021; Morse et al., 2019; Reyfman et al., 2019). Notably, SARS-CoV-2 was sufficient to induce a similar differentiation program in classical monocytes in vitro, indicating that viral contact may constitute a trigger for profibrotic macrophage reprogramming. These findings were corroborated by quantitative proteomics and extended to posttranslational alterations including the CEBPB isoform ratio, which has also been associated with fibrosis. In line with these findings, we observed restrictive ventilatory defects and radiographic signs of consolidation and fibrotic remodelling, and histopathology revealed myofibroblast and fibroblast expansion and pronounced ECM deposition. These findings aligned with the clinical observation that patients with COVID-19 ARDS require protracted respiratory support and ECMO therapy and show increased mortality rates compared to other forms of ARDS. Our study describes a predominantly profibrotic profile of pulmonary macrophages in severe COVID-19, accompanied by profound fibrotic lung tissue remodeling. This is in line with previous reports of organizing pneumonia, scarring, and fibrosis in patients with COVID-19 ARDS and even in individuals with initially mild or moderate disease (Bharat et al., 2020; Combet et al., 2020; Pan et al., 2020; Schwensen et al., 2020; Spagnolo et al., 2020).
While IPF is characterized by chronically progressive, irreversible fibrosis, COVID-19-induced fibrotic tissue remodeling occurs rapidly and is at least partially reversible in the majority of survivors. Yet, both conditions share similar epidemiological risk factors, including older age, male sex, history of cigarette smoking, and other comorbidities. Viral infections have also been repeatedly implicated in the pathogenesis of IPF and as triggers of acute exacerbations (Meneghin and Hogaboam, 2007; Molyneaux and Maher, 2013; Naik and Moore, 2010; Sheng et al., 2020; Wootton et al., 2011). Moreover, acute exacerbations of IPF are characterized by bilateral GGOs and evidence of diffuse alveolar damage, which is suggestive of viral infection and subsequently enhanced fibrosis (Collard et al., 2007, 2016; Wootton et al., 2011). Our data reveal unexpected, common features of IPF and severe COVID-19 ARDS, namely, aberrant macrophage activation and inappropriate fibroproliferative responses in susceptible individuals (Morse et al., 2019; Schupp et al., 2015; Thompson et al., 2017). Monocytes and profibrotic macrophages play a critical role in the pathogenesis and progression of both ARDS and lung fibrosis (Gibbons et al., 2011; Herold et al., 2015; Misharin et al., 2017; Nouno et al., 2019; Scott et al., 2019; Thompson et al., 2017). Circulating monocyte numbers have been proposed as prognostic biomarkers in IPF, and genetic deletion of CCR2 or depletion of monocyte-derived macrophages protects mice from drug-induced lung fibrosis (Misharin et al., 2017; Moore et al., 2001; Brody et al., 2021; Teoh et al., 2020). The accumulation of CD163+ macrophages has been associated with poor outcomes in IPF (Brody et al., 2021; Nouno et al., 2019). CD163/LGMN-Mφ expressed high levels of Osteopontin (encoded by SPP1), a secreted ECM phosphoglycoprotein (Liaw et al., 1995), which also doubles as a cytokine that stimulates collagen-I production in fibroblasts and exerts profibrotic functions in IPF (Pardo et al., 2005; Urtasun et al., 2012). TGFB1 (encoding TGF-β), a master regulator of wound healing and organ fibrosis (Frangogiannis, 2020; Morse et al., 2019), and several TGF-β-related genes, including TGFBI and NRP1, were also highly expressed in CD163/LGMN-Mφ. Macrophage-derived TGFBI promotes collagen production in fibroblasts and inhibits collagen turnover by suppressing antifibrotic metalloproteinase 14 (MMP14) (Frangogiannis, 2020; Morse et al., 2019; Nacu et al., 2008). Legumain (LGMN) is an asparaginyl endopeptidase involved in MMP activation, TGF-β signaling, and ECM deposition and plays a prominent role in organ fibrosis (Bai et al., 2019; Ren et al., 2020). LGMN is highly expressed in CD163/LGMN-Mφ and in profibrotic macrophages in IPF (Ayaub et al., 2021; Morse et al., 2019), and it was strongly induced in monocytes upon exposure to SARS-CoV-2.
We demonstrated that exposure to SARS-CoV-2, but not IAV, induces transcriptome and proteome profiles with high similarity to those of IPF-associated macrophages, and we also detected SARS-CoV-2 transcripts in pulmonary macrophages. These findings suggest that SARS-CoV-2 may directly contribute to the profibrotic macrophage phenotype in severe COVID-19. Other factors likely propagate fibrogenic macrophage responses at later stages, but fibrotic tissue states can be triggered by strong initial impulses into pathological stability and typically resolve slowly (Adler et al., 2020). Recognition of tissue damage and uptake of apoptotic cells are known stimuli of wound healing and profibrotic responses, through the induction of TGF-β (Huynh et al., 2002). Pulmonary macrophages in COVID-19 expressed a range of scavenger receptors and proteins involved in efferocytosis, including MRC1, CD163, TREM2, and MERTK, among others, and high levels of TGFB1 and TGFBI. Hence, SARS-CoV-2 infection induces expression of genes that may directly and indirectly promote profibrotic functions of macrophages. These damage repair responses may be beneficial to control inflammatory tissue damage. Yet, unchecked and aberrant, they may cause enhanced fibroproliferation and protracted respiratory failure in susceptible individuals. In this regard, it will be important to assess the presence of CD163/LGMN-Mφ and their fate in patients with milder forms of COVID-19.
Pulmonary sequelae of COVID-19, including fibrosis, have been previously reported, but the exact disease burden remains unclear. A recent 6-month follow up of 1,733 patients previously hospitalized for COVID-19 revealed a reduced median 6-min walking distance and decreased diffusion capacity and total lung capacity, indicative of restrictive ventilatory defects. This was more pronounced following severe disease, excluding patients on ECMO or organ support (Huang et al., 2021). In addition, there are several reports of severe, progressive lung fibrosis following mild to moderate SARS-CoV-2 infection (Arjun et al., 2020; Combet et al., 2020; Schwensen et al., 2020). It will be important to identify patients at risk of developing fibrotic complications of COVID-19 and to devise early intervention strategies, including potentially antifibrotic therapies (George et al., 2020). Blockade of monocyte influx may also present an attractive strategy. On the other hand, it is clear that fibrotic lesions resolve, or partially resolve, over time in patients who survive COVID-19 ARDS. The recovery phase may therefore provide a unique window to investigate molecular mechanisms of fibrosis resolution.
Limitations of the study
We combined in vivo and in vitro analyses of transcriptional and proteomic profiles in COVID-19-associated macrophages and compared these to macrophage phenotypes in IPF. Causal links between the accumulation of specific macrophage populations and fibrotic tissue remodeling is difficult to establish in an observational study. The snRNA-seq analysis and cell communication inference indicated profibrotic functions of COVID-19-associated macrophages. Additionally, recent modeling of macrophage-fibroblast cell circuits during fibrosis predicted excessive macrophage tissue influx and a profibrotic macrophage setpoint to cause increased fibroproliferation as well as pathological fibrosis (Adler et al., 2020). We demonstrate direct effects of SARS-CoV-2 on profibrotic macrophage programs in vitro, but the relevance of virus-macrophage interactions during COVID-19 ARDS in vivo is challenging to determine in human studies. The molecular mechanisms underlying the induction of profibrotic genes by SARS-CoV-2 remain to be investigated in greater detail.
In conclusion, we describe a profound fibroproliferative tissue response in severe COVID-19 ARDS, associated with an accumulation of monocyte-derived macrophages with significant transcriptional similarities to profibrotic macrophages in IPF. We propose that SARS-CoV-2 promotes fibrosis-associated genetic programs in macrophages, which are further sustained and enhanced by responses to extensive tissue damage. It will be important to dissect the molecular mechanisms linking viral recognition to profibrotic macrophage responses in ARDS and in chronic organ fibrosis, as these may provide new targets for therapeutic intervention.
STAR★Methods
Key resources table
| REAGENT or RESOURCE | SOURCE | IDENTIFIER |
|---|---|---|
| Antibodies: MELC antibodies (Cohort 1) | ||
| DAPI | Roche | Cat# 10236276001, N/A |
| CCR2-PE | Miltenyi Biotec | Cat# 130-118-338, RRID:AB_2751486 |
| CD163-PE | Biolegend | Cat# 333605, RRID:AB_1134005 |
| CD56-PE | Miltenyi Biotec | Cat# 130-098-137, RRID:AB_2661200 |
| CD3-PE | Miltenyi Biotec | Cat# 130-113-139, RRID:AB_2725967 |
| CD169-PE | Miltenyi Biotec | Cat# 130-104-953, RRID:AB_2655537 |
| CD14-PE | Miltenyi Biotec | Cat# 130-113-709, RRID:AB_2726250 |
| CD45-PE | Miltenyi Biotec | Cat# 130-113-118, RRID:AB_2725946 |
| CXCR3-PE | Miltenyi Biotec | Cat# 130-101-379, RRID:AB_2655734 |
| CD16-PE | Miltenyi Biotec | Cat# 130-113-955, RRID:AB_2726428 |
| CD4-PE | Miltenyi Biotec | Cat# 130-113-214, RRID:AB_2726025 |
| TREM1-PE | Miltenyi Biotec | Cat# 130-101-033, RRID:AB_2657706 |
| CD20-PE | Miltenyi Biotec | Cat# 130-113-374, RRID:AB_2726143 |
| CD11b-PE | Miltenyi Biotec | Cat# 130-110-553, RRID:AB_2654665 |
| CD8-PE | Miltenyi Biotec | Cat# 130-113-720, RRID:AB_2726261 |
| CD1c-PE | Miltenyi Biotec | Cat# 130-113-864 RRID: AB_2726358 |
| CD68-PE | Miltenyi Biotec | Cat# 130-118-486, RRID:AB_2784270 |
| CD127-PE | Miltenyi Biotec | Cat# 130-113-414, RRID:AB_2733759 |
| CD11c-PE | Miltenyi Biotec | Cat# 130-113-580, RRID:AB_2726180 |
| CD57-PE | Miltenyi Biotec | Cat# 130-111-963, RRID:AB_2658747 |
| HLA-DR-PE | Miltenyi Biotec | Cat# 130-120-715, RRID:AB_2752176 |
| CD66b-PE | Miltenyi Biotec | Cat# 130-122-922, N/A |
| COL-IV-FITC | Antibodies-Online | Cat# ABIN376119, RRID:AB_10763557 |
| MRP14-PE | Miltenyi Biotec | Cat# 130-114-516, RRID:AB_2726684 |
| C1q-FITC | DAKO | Cat# F0254, RRID:AB_2335713 |
| Antibodies: Immunohistochemistry (Cohort 2) | ||
| Goat Anti-Type I Collagen | Southern Biotech | Cat# 1310-01; RRID:AB_2753206 |
| Goat Anti-Type III Collagen | Southern Biotech | Cat# 1330-01; RRID:AB_2794734 |
| Goat Anti-Type IV Collagen | Southern Biotech | Cat# 1340-01; RRID:AB_2721907 |
| Biotinylated rabbit anti-goat | Vector | Cat# BA-5000; RRID:AB_2336126 |
| Mouse anti-CD68 | Agilent | Cat# M0876; RRID:AB_2074844 |
| Rabbit anti-sm22 | Abcam | Cat# Ab14106; RRID:AB_443021 |
| Goat anti-rabbit Alexa 647 | Abcam | Cat# Ab150079; RRID:AB_2722623 |
| Mouse anti-CD163 | Cell Marque | Cat# 163M-17; RRID:AB_1159119 |
| Mouse anti-CD16 | Santa Cruz | Cat# sc-20052; RRID:AB_626925 |
| Antibodies: Antibodies for sorting | ||
| Brilliant Violet 785 anti-human HLA-DR Antibody | Biolegend | Cat# 307642 |
| FITC anti-human CD14 Antibody | Biolegend | Cat# 367116 |
| CD16 APC B73.1 | Biolegend | Cat# 360705 |
| PerCP anti-human CD19 Antibody SJ25C1 | Biolegend | Cat# 363013 |
| CD3 PerCP UCHT1 | Biolegend | Cat# 300427 |
| CD56 PerCP 5.1 h11 | Biolegend | Cat# 362526 |
| CD304 (BDCA-4)-PE-Vio770, human, AD5-17F6 | Miltenyi | Cat# 130-113-518 |
| BV510 Mouse Anti-Human CD141 Clone 1A4 (RUO) | BD | Cat# 563298 |
| CD1c PE AD5-8E7 | Miltenyi | Cat# 130-113-302 |
| Virus strains | ||
| BetaCoV/Munich/BavPat1/2020 (passage 2, no second site mutations) | This study | GISAID accession: EPI_ISL_406862 |
| A/Panama/2007/1999 | This study | N/A |
| Chemicals, peptides, and recombinant proteins | ||
| KAPA HiFi HotStart Ready Mix | Roche | KK2601 |
| Human Tru Stain FcX | Biolegend | 422301 |
| TE Buffer | Thermo Fisher | 120900115 |
| SPRIselect Reagent | Invitrogen | AM9937 |
| 10% Tween 20 | BIO-RAD | 1662404 |
| Buffer EB | QIAGEN | 19086 |
| Ethanol, Absolute | Fisher Bioreagents | BP2818-500 |
| Glycerol, 85% | Merck | 1040941000 |
| Bovine Serum Albumin | Jackson Immuno Research | 001-000-161 |
| RBC Lysis Buffer (10X) | Biolegend | 1662404 |
| TMTpro reagents | Thermo Fisher Scientific | A44520 |
| Complete Protease Inhibitor Cocktail | Roche | 11697498001 |
| Phosphatase Inhibitor Cocktail 2 | Sigma-Aldrich | P5726 |
| Phosphatase Inhibitor Cocktail 3 | Sigma-Aldrich | P0044 |
| Lysyl Endopeptidase, Mass Spectrometry Grade (Lys-C) | FUJIFILM Wako Pure Chemical Corporation | 125-05061 |
| Sequencing Grade Modified Trypsin | Promega | V5113 |
| Critical commercial assays | ||
| Qubit dsDNA HS Assay Kit | ThermoFisher | Q32854 |
| Chromium Next GEM Single Cell 3′ GEM, Library & Gel Bead Kit v3.1 | 10x genomics | 1000121 |
| Chromium Next GEM Chip G Single Cell Kit | 10x genomics | 1000120 |
| Single Index Kit T Set A | 10x genomics | 1000213 |
| High Sensitivity DNA Kit | Agilent Technologies | 5067-4626 |
| Pierce BCA Protein Assay Kit | Thermo Fisher Scientific | 23225 |
| EnV FLEX, High pH, (Link) | Agilent Technologies | K800021-2 |
| EnVision FLEX/ HRP goat anti-mouse (ready-to-use) | Agilent Technologies | K8000 |
| EnVision FLEX, High pH (Link), HRP. Rabbit/ Mouse | Agilent Technologies | DM802 |
| Opal 690 | Akoya Biosciences | FP1497001KT |
| Opal 650 TSA Plus | Akoya Biosciences | FP1496001KT |
| Opal 620 TSA Plus | Akoya Biosciences | FP1495001KT |
| Spectral DAPI | Akoya Biosciences | FP1490 |
| Human CCL24/Eotaxin-2/MPIF-2 DuoSet | R&D Systems | DY343 |
| Human CCL8/MCP-2 DuoSet ELISA | R&D Systems | DY281 |
| Human IL-6 DuoSet ELISA | R&D Systems | DY206 |
| Human CCL2/MCP-1 DuoSet | R&D Systems | DY279 |
| Human IL-1 beta/IL-1F2 DuoSet | R&D Systems | DY201 |
| Human CXCL5/ENA-78 DuoSet | R&D Systems | DY254 |
| Human IFN-beta DuoSet | R&D Systems | DY814-05 |
| RNAscope probe V-nCoV2019-S | Advanced Cell Diagnostics | #848561-C1 |
| Deposited data | ||
| UniProt Human protein database | Uniprot | https://www.uniprot.org/downloads |
| Uniprot SARS-CoV-2 protein database | Uniprot | https://www.uniprot.org/downloads |
| Uniprot Influenza A (Panama) protein database | Uniprot | https://www.uniprot.org/downloads |
| MSigDB v7.0 | Broad Institute | https://www.gsea-msigdb.org/gsea/index.jsp |
| scRNA-seq raw data | This paper | EGAS00001004928 EGAS00001005634 |
| snRNA-seq raw data | (Gassen et al., 2021) | EGAS00001004689 |
| RAW proteomics and phosphoproteomics data | This paper | PXD022709 |
| Experimental models: Cell lines | ||
| Vero E6 cells | ATCC | No. CRL-1586 |
| MDCKII cells | ATCC | No. CRL-2936 |
| Oligonucleotides | ||
| SI-PCR primer | IDT | AATGATACGGCGACCACCGAGATCTACA CTCTTTCCCTACACGACGC∗T∗C |
| HTO additive primer | IDT | GTGACTGGAGTTCAGACGTGTGC∗T∗C |
| D701_S | IDT | CAAGCAGAAGACGGCATACGAGATCGAGT AATGTGACTGGAGTTCAGACGTGT∗G∗C |
| D702_S | IDT | CAAGCAGAAGACGGCATACGAGATTCTCC GGAGTGACTGGAGTTCAGACGTGT∗G∗C |
| D703_S | IDT | CAAGCAGAAGACGGCATACGAGATAATGAG CGGTGACTGGAGTTCAGACGTGT∗G∗C |
| D705_S | IDT | CAAGCAGAAGACGGCATACGAGATTTCTGA ATGTGACTGGAGTTCAGACGTGT∗G∗C |
| Software and algorithms | ||
| MaxQuant 1.6.10.43 | Cox and Mann, 2008 | https://www.maxquant.org/ |
| R 3.6 | R Core Team, 2019 | https://www.r-project.org/ |
| GSEA 2.0 | Subramanian et al., 2005 | https://www.gsea-msigdb.org/gsea/index.jsp |
| R version 3.6.3 | R Core Team, 2020 | https://cran.r-project.org/ |
| R package Seurat version 3.2.2 | Stuart et al., 2019 | https://cran.r-project.org/web/packages/Seurat/index.html |
| R package leiden version 0.3.3 | Traag et al., 2019; Kelly, 2019 | https://cran.r-project.org/web/packages/leiden/index.html |
| R package scran version 1.14.6 | Lun et al., 2016 | https://bioconductor.org/packages/release/bioc/html/scran.html |
| R package ggplot2 version 3.3.2 | Wickham, 2016 | https://cran.r-project.org/web/packages/ggplot2/index.html |
| R package dplyr version 1.0.2 | Wickham et al., 2020 | https://cran.r-project.org/web/packages/dplyr/index.html |
| R package uwot version 0.1.8 | Melville, 2020 | https://cran.r-project.org/web/packages/uwot/index.html |
| R package clusterProfiler version 3.14.3 | Yu et al., 2012 | https://bioconductor.org/packages/release/bioc/html/clusterProfiler.html |
| R package ggpubr version 0.4.0 | Kassambara, 2020 | https://cran.r-project.org/web/packages/ggpubr/index.html |
| R package tidyr version 1.1.2 | Wickham, 2020 | https://cran.r-project.org/web/packages/tidyr/index.html |
| R package slingshot version 1.4.0 | Street et al., 2018 | https://bioconductor.org/packages/release/bioc/html/slingshot.html |
| R package rgl version 0.100.19 | Adler et al., 2019 | https://cran.r-project.org/web/packages/rgl/index.html |
| R package readr version 1.4.0 | Wickham and Hester, 2018 | https://cran.r-project.org/web/packages/readr/index.html |
| R package ggalluvial version 0.12.2 | Brunson, 2020 | https://cran.r-project.org/web/packages/ggalluvial/index.html |
| R package pheatmap version 1.0.12 | Raivo, 2019 | https://cran.r-project.org/web/packages/pheatmap/index.html |
| R package httr version 1.4.2 | Wickham, 2020a | https://cran.r-project.org/web/packages/httr/index.html |
| R package jsonlite version 1.7.1 | Ooms, 2014 | https://cran.r-project.org/web/packages/jsonlite/index.html |
| R package stringr version 1.4.0 | Wickham, 2019 | https://cran.r-project.org/web/packages/stringr/index.html |
| R package ggnewscale version 0.4.5 | Campitelli, 2021 | https://cran.r-project.org/web/packages/ggnewscale/index.html |
| R package viridis version 0.5.1 | Garnier, 2018 | https://cran.r-project.org/web/packages/viridis/index.html |
| R package grid version 3.6.3 | R Core Team, 2020 | https://www.R-project.org/ |
| R package raster version 3.4 | Hijmans, 2020 | https://cran.r-project.org/web/packages/raster |
| R package sf version 0.9 | Pebesma, 2018 | https://cran.r-project.org/web/packages/sf |
| Python 3.7.8 | Van Rossum and Drake, 2009 | https://www.python.org/ |
| SCANPY version 1.7.2 | Wolf et al., 2018 | https://scanpy.readthedocs.io/en/stable/ |
| scVI version 0.6.7 | Gayoso et al., 2021 | https://scvi-tools.org/ |
| Python package seaborn version 0.10.1 | Waskom, 2021 | https://seaborn.pydata.org/ |
| Python package scipy version 1.5.2 | Virtanen et al., 2020 | https://scipy.org/ |
| Python package numpy version 1.20.3 | Harris et al., 2020 | https://numpy.org/ |
| Python package matplotlib version 3.3.3 | Hunter, 2007 | https://matplotlib.org/ |
| Other | ||
| QExactive HF-x Orbitrap MS | Thermo Fisher Scientific | IQLAAEGAAPFALGMBFZ |
| Waters XBridge Peptide BEH C18 (130A, 3.5μm; 2.1mm x 250mm) | Waters | 186003566 |
| Bravo Automated Liquid Handling Platform | Agilent | G5409-90006 |
| AssayMAP Fe(III)-NTA cartridges | Agilent | G5496-60085 |
| EASY-nLC 1200 | Thermo Fisher Scientific | LC140 |
| Image Cycler MM3 (TIC) | MelTec GmbH & Co.KG | N/A |
| QuPath | Bankhead et al., 2017 | 0.2.3 |
| ZEN 3.0 black edition | Carl Zeiss AG | N/A |
| InForm | Akoya Biosciences | N/A |
| GraphPad Prism | GraphPad Software | Version 5.01 |
Resource availability
Lead contact
Further information and requests for resources and reagents should be directed to and will be fulfilled by the Lead Contact, Leif E. Sander (leif-erik.sander@charite.de).
Materials availability
This study did not generate new unique reagents.
DeCOI consortium members
Janine Altmüller, Angel Angelov, Anna C Aschenbrenner, Robert Bals, Alexander Bartholomäus, Anke Becker, Mattias Becker, Michael Beckstette, Daniela Bezdan, Michael Bitzer, Helmut Blum, Conny Blumert, Ezio Bonifacio, Peer Bork, Bunk Boyke, Nicolas Casadei, Thomas Clavel, Maria Colome-Tatche, Markus Cornberg, Inti Alberto De La Rosa Velázquez, Andreas Diefenbach, Alexander Dilthey, Nicole Fischer, Konrad Förstner, Sören Franzenburg, Julia-Stefanie Frick, Gisela Gabernet, Julien Gagneur, Tina Ganzenmüller, Marie Gauder, Janina Geißert, Alexander Goesmann, Siri Göpel, Adam Grundhoff, Hajo Grundmann, Torsten Hain, Frank Hanses, Ute Hehr, André Heimbach, Marius Höper, Friedmann Horn, Daniel Hübschmann, Michael Hummel, Thomas Iftner, Angelika Iftner, Thomas Illig, Stefan Janssen, Jörn Kalinowski, René Kallies, Birte Kehr, Andreas Keller, Oliver T. Keppler, Sarah Kim-Hellmuth, Christoph Klein, Michael Knop, Oliver Kohlbacher, Karl Köhrer, Jan Korbel, Peter G. Kremsner, Denise Kühnert, Ingo Kurth, Markus Landthaler, Yang Li, Kerstin U. Ludwig, Oliwia Makarewicz, Manja Marz, Alice McHardy, Christian Mertes, Maximilian Münchhoff, Sven Nahnsen, Markus Nöthen, Francine Ntoumi, Peter Nürnberg, Uwe Ohler, Stephan Ossowski, Jörg Overmann, Silke Peter, Klaus Pfeffer, Isabell Pink, Anna R Poetsch, Ulrike Protzer, Alfred Pühler, Nikolaus Rajewsky, Markus Ralser, Kristin Reiche, Olaf Rieß, Stephan Ripke, Ulisses Rocha, Philip Rosenstiel, Antoine-Emmanuel Saliba, Leif Erik Sander, Birgit Sawitzki, Simone Scheithauer, Philipp Schiffer, Jonathan Schmid-Burgk, Wulf Schneider, Eva-Christina Schulte, Joachim L. Schultze, Nicole Schulz, Alexander Sczyrba, Mariam L. Sharaf, Yogesh Singh, Michael Sonnabend, Oliver Stegle, Jens Stoye, Fabian J. Theis, Thomas Ulas, Janne Vehreschild, Thirumalaisamy P. Velavan, Jörg Vogel, Sonja Volland, Max von Kleist, Andreas Walker, Jörn Walter, Dagmar Wieczorek, Sylke Winkler, John Ziebuhr.
Experimental model and subject details
Cohort 1 - Berlin cohort
ICU cohort Berlin
Patients treated at a single ICU with COVID-19 associated acute respiratory distress syndrome (ARDS) between March 17th, 2020 and March 17th, 2021 were included in this analysis. This cohort represents a sub-cohort of the Pa-COVID-19 study, a prospective observational cohort study assessing pathophysiology and clinical characteristics of patients with COVID-19 treated at Charité Universitätsmedizin Berlin (Kurth et al., 2020). The study was approved by the Institutional Review board of Charité (EA2/066/20). Written informed consent was provided by all patients or legal representatives for participation in this study.
Patients treated with severe COVID-19 ARDS with requirement for veno-venous vvECMO treatment, qualified for inclusion for the assessment of CT images and pulmonary gas exchange. Out of 18 identified patients, two patients were excluded from the analysis due to death less than 36h after vvECMO initiation. Information on age, sex, medication, commorbidities and outcome is provided in Table S1.
Pathology cohort Berlin
The autopsy study was approved by the Ethics Committee of the Charité (EA 1/144/13, EA2/066/20 and EA1/075/19) and was performed in compliance with the Declaration of Helsinki. For histology, we analyzed cryopreserved lung tissue from deceased patients with COVID-19. Patients were selected from an autopsy cohort at Charité described in Meinhardt et al. (2021). Inclusion criteria were presence of cryopreserved material and detectable SARS-CoV-2 RNA load in the lung tissue. Patients with detectable tumor infiltration and one case with graft-versus-host reaction after stem cell therapy were excluded from the analysis. Information on age, sex, medication, commorbidities is listed in Table S1.
Cohort 2 - Aachen cohort
The study was approved by the local ethics committee (EK 304/20, EK 119/20, and EK 092/20). We included 15 consecutive clinical autopsies of COVID-19 positive patients between March 9th, 2020 and January 1st, 2021. Each patient had a positive clinical SARS-CoV-2 PCR test from upper or lower respiratory tract prior to autopsy. Consent to autopsy was obtained by the legal representatives of the deceased patients. The autopsies were performed in two steps according to a modified standard protocol to further increase employee safety and sample acquisition (developed in the frame of the German Registry of COVID-19 autopsies – DeRegCOVID). As a control, five non-COVID clinical autopsy lung tissues from 2013 to 2015 were included. Additionally, one non-autopsy lung tissue from a COVID-19 positive patient and two non-autopsy lung tissues from non-COVID-19 patients for routine diagnostic histological assessment of surgical specimens were included into histological analyses.
Additional datasets used to perform data integration and snRNA-seq
For the proximity analysis the BAL scRNA-seq macrophage data of this study was integrated together with data originating from three previously published datasets (Adams et al., 2020) (GSE136831), (Morse et al., 2019) (GSE128033) and (Bharat et al., 2020) (GSE158127). A detailed cohort description can be found in the original publications. Briefly, the Adams et al. dataset encompasses lung sample data of 32 IPF, 28 smoker and non-smoker controls, and 18 chronic obstructive pulmonary disease (COPD). Morse et al. includes two samples each of explanted lungs of three IPF patients from upper and lower lobes that represent early and late disease progression respectively, as well as three healthy controls. (Bharat et al., 2020) comprises overall three whole lung single-cell RNA-seq datasets, one originating from a patient that underwent bilateral lung transplantation (‘case 1’ in the in the original paper), and two originating from post-mortem lung biopsies from two patients who had died from severe COVID-19 (‘PMB 1 and 2′ in the original paper). Raw snRNA-seq data (6 COVID-19 and 1 control) originates from Gassen et al. (2021) accessible under the repository EGAS00001004689. Two additional controls were added from Lukassen et al. (2020) accessible under the repository EGAS00001004419 (Patient ID: JVV9L8ng/SAMEA6848761; S4ECX8ng/SAMEA6848765).
Method details
Clinical investigation
VCin measurement
An automated inspiratory/expiratory pressure volume curve was performed using the ventilator (S1, Hamilton Medical, Bonaduz, Switzerland). Pressure was increased from 0 mbar up to 45 mbar and then released to 0 mbar again in steps of 2 mbar/second. The inflated volume at 45 mbar was defined as the inspiratory vital capacity (VCin). All measurements were performed in supine position under deep sedation thereby avoiding spontaneous breathing attempts of the patients during the maneuver. In five patients of cohort 1 with VCin measurements available, the highest VCin in the early phase (from intubation until day 7 of vvECMO support) and the lowest during the late vvECMO phase (> 7 days of vvECMO support) (acute vvECMO phase) was determined.
CT Scans
Computed tomographic (CT) scanning was performed in supine position. When available one CT scan in the acute phase within 7 days after submission to intensive care, one around the time point of vvECMO initiation and the last one available of the patient (either before death, dismission from the hospital or end of the follow up period). CT scans were evaluated and annotated by two board certified pulmonologists.
Viral Stocks
SARS-CoV-2 stock for scRNASeq
100 μl of passage 0 virus isolate of the BetaCoV/Munich/BavPat1/2020 EPI_ISL_406862 strain was diluted in 20 mL Dulbecco modified Eagle medium (DMEM) containing 1% sodium pyruvate, 1% non-essential amino acids and 2% fetal calf serum (FCS, GIBCO). Approximately 1x10⁶ VeroE6 cells (ATCC CRL-1586) were infected with 20 mL of the diluted virus. At 3 dpi, supernatant was harvested and the virus was purified by membrane ultracentrifugation (Vivaspin 100 kDa MWCO, GE Healthcare). Briefly, the column was equilibrated with 10 mL PBS, followed by centrifugation for 10 min and 3.000 g. Flow-through was discarded and 20 mL of virus-containing supernatant was added to the column and centrifuged for 60 min at 3.000 g. The concentrated virus (approximately 0.5 ml) was resuspended in 3 mL OptiPro serum-free medium (GIBCO), which was then further diluted 1:2 in virus preservation medium (OptiPro containing 0.5% gelatin), aliquoted and stored at −80°C. To determine virus titer, all stocks were plaque titrated in three independent experiments as described previously (Niemeyer et al., 2018). The absence of any second site mutations was confirmed by next generation sequencing.
SARS-CoV-2 stock for proteomics
Approximately 1x10⁷ VeroE6 cells (ATCC No. CRL-1586) were infected with BetaCoV/Munich/BavPat1/2020 strain (GISAID accession: EPI_ISL_406862) passage 1 at an MOI of 0,01 in 12 mL Dulbecco modified Eagle medium (DMEM) supplemented with 10% fetal bovine serum, 2 mM L-glutamine, 100 U/ml penicillin, 100 μg/ml streptomycin, 1x non-essential amino acids and 1 mM sodium pyruvate and incubated at 37°C and 5% CO2 for 48 h. Following centrifugation at 3.500 rpm for 5 min. to remove cell debris, virus-containing supernatant was added to Amicon Ultra Centrifugal Filters (100 kDa MWCO, Merck, Germany). Spin filters were centrifuged at 4.000 g for 15 min and subsequently culture medium was added to the concentrated virus suspension to a final volume of 4 ml. Viral stocks were re-sequenced after passaging to rule out cell culture adaptation mutations.
Influenza A/Panama/2007/1999
Virus stock was grown on MDCKII cells (ATCC No. CRL-2936) in minimum essential medium (MEM) supplemented with 0,2% BSA, 2mM L-glutamine, 100 U/ml penicillin, 100 μg/ml streptomycin and 1 μg/ml TPCK-treated trypsin. Cells were infected at an MOI of 0,01 and incubated for 48h at 37°C and 5% CO2. Virus-containing supernatant was centrifuged for 5 min at 3.500 rpm. Virus titers were determined by plaque assay on Vero E6 cells for SARS-CoV 2 and MDCKII cells for Influenza A/Panama/2007/1999 using Avicel overlay as described previously (Matthaei et al., 2013; Niemeyer et al., 2018). Virus stocks were stored at −80°C.
Histology, Immunohistochemistry, Immunofluorescence and SARS-CoV-2 RNA in situ hybridization
Histological analysis
The samples of the central and peripheral lung from each lobe, 4% formaldehyde-fixed and paraffin-embedded (FFPE), were further processed and histologically evaluated. FFPE blocks were cut to 1 μm thick sections, deparaffinized, rehydrated, and stained with hematoxylin-eosin (H&E) staining according to standard protocol using an automated staining system (Tissue-Tek Prisma® Plus & Tissue-Tek Film®, Sakura).
Semiquantitative estimation of pulmonary fibrosis
To estimate pulmonary fibrosis, a semiquantitative score (Ashcroft Score) was used as previously described (Ashcroft et al., 1988). Briefly, an H&E section of the lung was examined systematically at 10x magnification. Each patient was assigned a score between 0 and 8 using a predetermined scale of severity (0 = normal lung, 8 = total fibrous obliteration of the field), based on the predominant degree of fibrosis on the lung section. Fields predominantly occupied by large bronchi or vessels, or by malignant tumor deposits were not counted. Inflammatory cells in airspaces were ignored, but organized exudate was treated as fibrosis. Two experienced pathologists scored each case independently and a mean value was calculated from the two scores for each patient.
Immunohistochemistry and immunofluorescence
For immunohistochemistry (collagens I, III, IV, CD68), FFPE blocks were cut to 1 μm thin sections, deparaffinized, rehydrated and washed in phosphate-buffered saline (PBS). Slides underwent heat-induced epitope retrieval in citrate buffer (pH 6.0, Antigen Unmasking Solution, Citric Acid-Based (Vector, H-3300)), were quenched with 3% H2O2, incubated in a humidified chamber with primary antibodies (Key resources table) (dilutions: anti- type I collagen, 1:100; anti- type III collagen, 1:200; anti- type IV collagen, 1:250, anti-CD68, 1:100) for one hour followed by incubation with a secondary antibody (dilution 1:300 or ready-to-use, Key resources table) (30 minutes), followed by ABC complex (30 minutes), followed by 3-3′-Diaminobenzidine (DAB) for 10 minutes, and counterstained with methyl green. CD68-/Sm22-costaining was performed accordingly with the following differences: no H2O2-blocking, ABC complex and DAB incubation were performed and slides were not counterstained with methyl green. Dilutions of primary antibodies were 1:100. After incubation of the secondary antibody (ready-to-use or dilution 1:300, Key resources table) DAPI was used to highlight nuclei.
To analyze Macrophage subtypes, we used the VECTRA automated quantitative pathology imaging system, and stained using our pre-established protocol as followed: slides underwent antigen retrieval in citrate buffer (EnVision FLEX TARGET RETRIEVAL SOLUTION LOW pH, from Agilent: K8005) using the pT-Link module (Agilent, Santa Clara, USA). After fixation in 4% formaldehyde for 10 min, slides were washed and blocking was performed with H2O2 (DAKO REAL PEROXIDASE-BLOCKING SOLUTION, Agilent, Santa Clara, USA: S2023) followed by 30 min incubation with antibody diluent (DAKO REAL ANTIBODY DILUENT, Agilent, Santa Clara, USA: S2022). Immunofluorescence multiplex staining was performed with Opal 7-Color Manual IHC Kit (AKOYA Biosciences, Menlo-Park, USA: NEL811001KT). The slides were incubated for 1 hour with primary antibodies: CD68 (Agilent, Santa Clara, USA: M0876), CD163 (Cell Marque: 163M-17) and CD16 (Santa Cruz Biotechnology, Dallas, USA: DJ130c; Key resources table), followed by incubation with EnVision FLEX HRP (Agilent, Santa Clara: DM802) and visualized with Opal 690 TSA Plus, using Opal 650 TSA Plus, and Opal 620 TSA Plus, respectively (all from AKOYA Biosciences, Marlborough, USA). The nuclei were counterstained using Spectral DAPI (AKOYA Biosciences, Marlborough, USA).
Analysis of immunohistochemistry and immunofluorescence
Immunohistochemistry slides were scanned with the 40x objective using an Aperio AT2 whole Slide Scanner (Leica Biosystems, Wetzlar, Germany). Immunohistochemistry whole slide images were evaluated using the latest stable QuPath (Bankhead et al., 2017) release (i.e., version 0.2.3) by first applying automated tissue detection and subsequently assessing the tissue area that showed 3,3’-Diaminobenzidine (DAB) positivity. DAB positive tissue was determined by applying a tissue classifier that counted all pixels as DAB-positive that showed a value of higher than 0.45 in the DAB channel. This threshold was used on all slides. The final readout was the proportion of DAB positive area of the complete tissue section. To quantify the amount of CD68-positive macrophages, we used QuPaths in-built positive cell detection algorithm with a single threshold. The final readout was the ratio between CD68 positive cells and all detected cells.
To subtype CD68 positive macrophages into CD163 positive and negative macrophages we scanned three regions of interest of lung tissue per sample using the 40x objective, corresponding to a tissue area of 753x103 μm2 each. Scanning was performed using the VECTRA automated quantitative pathology imaging system (Perkin Elmer, Waltham, USA). After deploying automated cell detection using the InForm Software (Akoya Biosciences, Marlborough, USA), we trained an in-built cell phenotyping algorithm to detect CD68+/CD163- and CD68+/CD163+ cells in our cohorts. From each cohort, one slide was used for training and manually annotated using the above mentioned phenotypes. This algorithm was then deployed on all samples to detect the above mentioned phenotypes. Measurement outputs of the inForm-Software were analyzed using the phenoptr and phenoptrReports packages in R version 4.0.3. Our final readout was the proportion of CD163 positive and negative cells within the CD68 positive cell proportion. Representative immunofluorescence pictures were obtained with a Zeiss Axio Imager 2 microscope using 40x objective and image analysis software ZEN 3.0 black edition (both Carl Zeiss AG, Oberkochen, Germany). Statistical analysis was performed using Mann Whitney Test on GraphPad Prism Version 5.01 (GraphPad Software, Inc).
SARS-CoV-2 RNA in situ hybridization
FISH was performed on 1 μm thin FFPE sections with the RNAscope® Multiplex Fluorescent Reagent Kit v2 assay (Advanced Cell Diagnostics, Inc., Hayward, USA). Briefly, we incubated the tissue sections with H2O2, performed heat-induced target retrieval followed by protease incubation with the reagents provided. RNA sequence of SARS-CoV-2 S gene was hybridized using RNAscope® probe V-nCoV2019-S (#848561-C1). After the amplifier steps according to the manual, Opal™ 650 fluorophore (Perkin Elmer, Waltham, USA) was applied to the tissues. Finally, nuclei were labeled with DAPI and the slides were mounted with ProLong™ Gold antifade reagent (Invitrogen, Waltham, USA). Representative images were obtained with a Zeiss Axio Imager 2 microscope using the 40x objective and the image analysis software ZEN 3.0 black edition, (both Carl Zeiss AG, Oberkochen, Germany). Colocalization with CD68 was performed by analyzing serial sections stained with CD68 and RNA Scope for the SARS-CoV-2 S gene.
Bronchoalveolar lavage (BAL)
Bronchoalveolar lavage (BAL) samples were obtained from mechanically ventilated COVID-19 patients at the Department of Infectious Diseases and Respiratory Medicine, Charité - Universitätsmedizin Berlin. BAL fluid was filtered through a 70 μm mesh and centrifuged (400 g, 10 min, 4°C). The supernatant was removed and cells were washed once with DPBS (GIBCO). Erythrocytes were then removed using the Red Blood Cell (RBC) lysis buffer (Biolegend). The cells were washed twice and resuspended in DPBS (GIBCO) and cells were passed through a 40 μm mesh (Flowmi™ Cell Strainer, Merck). The cell suspension was then adjusted to a concentration of 700-1200 cells/μl to load a total of 16.500 cells/reaction into the 10x Genomics Chromium controller for scRNA-seq. Single Cell 3′ reagent kit v3.1 was used for reverse transcription, cDNA amplification and library construction following the detailed protocol provided by 10x Genomics. Libraries were quantified by QubitTM 2.0 Fluorometer (ThermoFisher) and quality was checked using 2100 Bioanalyzer with High Sensitivity DNA kit (Agilent). Sequencing was performed in paired-end mode with S1 and S2 flow cells (2 × 50 cycles kit) using NovaSeq 6000 sequencer (Illumina).
Monocytes isolation and infection
Isolation of primary classical monocytes
Peripheral blood mononuclear cells were isolated by gradient centrifugation (1.077 g/ml Pancoll, PAN Biotech) from fresh EDTA blood or buffy coats (German Red Cross Blood Transfusion Service, Berlin) of healthy donors, followed by immunomagnetic depletion of CD3+/CD19+/CD20+/CD56+/CD235a+ cells using biotinylated antibodies (Biolegend) and MagniSort Streptavidin Negative Selection Beads (Invitrogen) (Key resources table). Subsequently monocyte subsets were sorted using a BD FACSAria SORP cell sorter (BD Biosciences) starting with HLA-DR+, CD3-/CD19-/CD20-/CD56- cells following diverse gating strategies: classical monocytes (CD14+, CD16-), non-classical monocytes (CD14dim CD16+), myeloid dendritic cells (cDC2) (CD14-/CD16-/CD141-/CD304-, CD1c+), and plasmacytoid dendritic cells (CD14-/CD16-/CD141-/CD1c-, CD304+). Cells were washed in RPMI 1640 (GIBCO) supplemented with 10% (v/v) FCS (Sigma), 1% (v/v) non-essential amino acid solution (Sigma), 1% (v/v) HEPES (Sigma), 1% (v/v) Glutamine solution (GIBCO) and 1% (v/v) sodium pyruvate (GIBCO).
Infection assays
Sorted monocytes were washed and resuspended in complete medium (RPMI 1640, GIBCO), 10% (v/v) heat-inactivated FCS (Sigma), 1% (v/v) non-essential amino acid solution (Sigma), 1% (v/v) HEPES (Sigma), 1% (v/v) Glutamin solution (GIBCO), 1% (v/v) Sodium Pyruvate (GIBCO). For the scRNA-Seq experiments, 1x10⁵ cells were seeded per well into a 96-well plate. For the proteomics experiment 1x10⁶ cells/well were seeded into a 12 well plate. The cells were rested for one hour at 37°C and 5% CO2. For the scRNA-seq experiments, the concentrated 2020 EPI_ISL_406862 SARS-CoV-2 isolate (see ‘Viral Stock’ section) was added at a ratio of cells to virus (plaque forming units; PFUs) of 5 (MOI = 5) and adjusted to a total volume of 100 μl. For the proteomic experiments SARS-CoV-2 (EPI_ISL_406862, passage 2) and Influenza A (passage 3, isolate: Panama/2007/1999) were added at a multiplicity of infection of 30, and 10 respectively in a total volume of 1,5 ml. For scRNA-Seq experiments R848 (InvivoGen) was added at a final concentration of 1,2 ug/ml and pre-complexed 3p-hpRNA (LyoVec) was added with a concentration of 16 ng/ml. Infected/stimulated cells were incubated at 37°C and 5% CO2 before being harvested by rinsing of with ice-cold PBS supplemented with 10 mM EDTA at 16 h for scRNA-seq or 1 h, 3 h and 18 h for proteomics.
scRNA-seq library preparation and sequencing
Primary cells were prepared and stimulated as described above. Afterward, each condition was hashtagged with TotalSeq-A antibodies (Biolegend) according to the manufacturer’s protocol for TotalSeq-A antibodies and cell hashing with 10X Single Cell 3′ Reagent Kit v3.1. 50 μL cell suspension with 1x10⁶ cells/ml were resuspended in staining buffer (2% BSA, Jackson Immuno Research; 0,01% Tween-20, Sigma-Aldrich; 1x DPBS, GIBCO). 1 μg unique TotalSeq-A antibody in 50 ul staining buffer was added to each sample and incubated for 20 minutes at 4°C. After the incubation 1,5 mL staining buffer was added and centrifuged for 5 minutes at 350 g and 4°C. Washing was repeated for a total of 3 washes. Subsequently, the cells were resuspended in an appropriate volume of 1x DPBS (GIBCO), passed through a 40 μm mesh (Flowmi™ Cell Strainer, Merck) and counted, using a Neubauer counting chamber (Marienfeld). Cell counts were adjusted and hashtagged cells were pooled equally. The cell suspension was then loaded in the Chromium™ Controller (10x). Single Cell 3′ reagent kit v3.1 was used for reverse transcription, cDNA amplification and library construction following the detailed protocol provided by 10x Genomics. Hashtag libraries were prepared according to the cell hashing protocol for 10x Single Cell 3′ Reagent Kit v3.1 provided by Biolegend, including primer sequences and reagent specifications. A Biometra Trio Thermal Cycler was used for amplification and incubation steps (Analytik Jena). Libraries were quantified by Qubit™ 2.0 Fluorometer (ThermoFisher) and quality was checked using 2100 Bioanalyzer with High Sensitivity DNA kit (Agilent). Sequencing was performed in paired-end mode with S1 and S2 flow cells (2 × 50 cycles kit) using NovaSeq 6000 sequencer (Illumina).
Multi-epitope-ligand cartography (MELC)
Tissue preparation for MELC
Fresh frozen tissue was cut in 5 μm sections with a MH560 cryotome (ThermoFisher, Waltham, Massachusetts, USA) on cover slides (24 × 60 mm; Menzel-Gläser, Braunschweig, Germany) that had been coated with 3-aminopropyltriethoxysilane (APES). Samples were fixed for 10 minutes at room temperature (RT) with 2% paraformaldehyde (methanol- and RNase-free; Electron Microscopy Sciences, Hatfield, Philadelphia, USA). After washing, samples were permeabilized with 0.2% Triton X-100 in PBS for 10 min at room temperature and unspecific binding was blocked with 10% goat serum and 1% BSA in PBS for at least 20 minutes. Afterward, a fluid chamber holding 100 μL of PBS was created using “press-to-seal” silicone sheets (Life technologies, Carlsbad, California, USA; 1.0 mm thickness) with a circular cut-out (10 mm diameter), which was attached to the coverslip surrounding the sample.
MELC image acquisition
MELC image acquisition was performed as previously shown (Holzwarth et al., 2018; Pascual-Reguant et al., 2021). We generated the multiplexed histology data on a modified Toponome Image Cycler® MM3 (TIC) originally produced by MelTec GmbH & Co.KG Magdeburg, Germany (Schubert et al., 2006). The ImageCycler is a robotic microscopic system with 3 main components: (1) an inverted widefield (epi)fluorescence microscope Leica DM IRE2 equipped with a CMOS camera and a motor-controlled XY-stage, (2) CAVRO XL3000 Pipette/Diluter (Tecan GmbH, Crailsheim, Germany), and (3) a software MelTec TIC-Control for controlling microscope and pipetting system and for synchronized image acquisition. The MELC run is a sequence of cycles, each containing the following four steps: (i) pipetting of the fluorescence-coupled antibody onto the sample, incubation and subsequent washing; (ii) cross-correlation auto-focusing based on phase contrast images, followed by acquisition of the fluorescence images 3D stack (+/− 5 z-steps); (iii) photo-bleaching of the fluorophore; and (iv) a second auto-focusing step followed by acquisition of a post-bleaching fluorescence image 3D stack (+/− 5 z-steps). In each four-step cycle up to three fluorescence-labeled antibodies were used, combining PE, FITC and DAPI. After the sample was labeled by all antibodies of interest as described above, the experiment is completed. The antibodies used for multiplexed immunofluorescence histology of lung samples are listed in the Key resources table. The antibodies were stained in the indicated order.
Transmission electron microscopy (TEM)
Samples for TEM from two deceased patients that were tested positive for SARS-CoV-2 RNA via PCR were processed as described previously (Ochs et al., 2021). Briefly, samples were fixed with 3% formaldehyde 0.1 M cacodylate buffer for 12 h followed by changing the fixative for another 12 h. Smaller tissue samples were cut for TEM and fixed with 1.5% glutaraldehyde / 1.5% paraformaldehyde in 0.15 M HEPES buffer and post-fixed with 1% OsO4 for 1 h followed by 0.1% tannic acid for 0.5 h. Samples were finally dehydrated in ethanol and embedded in Epon. Ultrathin sections were counterstained with lead citrate and examined with a Leo 906 TEM (Zeiss, Oberkochen, Germany).
Proteomics
Sample preparation
Proteomics and phosphoproteomics were prepared using a strategy adapted from Mertins et al. (Mertins et al., 2018). Lysates were cleared via centrifugation (20,000 g, 15min, 4°C) and protein content in the supernatant was measured via BCA assay (Thermo Fisher Scientific, 23225). Samples were diluted to the same protein concentration with lysis buffer (8M urea, 150mM NaCl, 50mM Tris HCl pH 8.0, 1mM EDTA, cOmplete Protease Inhibitor Cocktail (Roche, 11697498001), Phosphatase Inhibitor Cocktail 2 and 3 (Sigma-Aldrich, P5726 and P0044)) and subsequently reduced and alkylated via incubation with 5mM DTT and 10mM iodoacetamide, respectively. Samples were diluted to 2M Urea with 50Mm Tris pH 8.0, then pre-treated with LysC (Wako Chemicals) at 1:50 (w/w) ratio for 2 hours at room temperature, then trypsin (Promega) was added at 1:50 (w/w) ratio and samples were digested overnight at room temperature. Digests were acidified with formic acid (FA) and centrifuged (20,000 g, 15min) to remove the precipitated urea. Approximately 30 μg of protein digest were desalted using STop-And-Go Extraction tips (Stage-tips) (Rappsilber et al., 2007). 3 disks of C18 (3M Empore) material were inserted in a 200 μL p pipette tip, activated via methanol which was subsequently washed away with a solution of 50% acetonitrile (ACN) and 0.1% FA, followed by a wash with 1% FA. Samples were loaded onto the Stage-tips and the retained peptides were washed twice with 0.1% trifluoroacetic acid (TFA) followed by a wash with 1% FA. Finally, peptides were eluted from the C18 material with a solution of 50% ACN / 0.1%FA. Desalted digests were dried and resuspended in 50mM HEPES pH 8.5. Peptide concentration was evaluated with BCA assay, and equal amounts of peptides were brought to the same concentration using 50mM HEPES pH 8.5. Prior to TMT labeling, we randomly assigned a TMTpro channel per experiment as follows: CoV2 1hr rep A- > 126; R848 1hr rep B- > 127N; IAV 1hr rep A- > 127C; CoV2 3hr rep A- > 128N; mock 1hr rep A- > 128C; CoV2 18hr rep A- > 129N; IAV 1hr rep B- > 129C; CoV2 18hr rep B- > 130N; R848 1hr rep A- > 130C; IAV 18hr rep B- > 131N; CoV2 3hr rep B- > 131C; IAV 18hr rep A- > 132N; IAV 3hr rep A- > 132C; CoV2 1hr rep B- > 133N; mock 1hr rep B- > 133C; IAV 3hr rep B- > 134N. Samples were then labeled using TMTpro reagents (Thermo Fisher Scientific; product number A44520, lot number UL297970) with a 1:10 peptide weight to TMT reagents weight ratio and approx. 17% ACN concentration, for 1 hour at room temperature, and the reactions were quenched by addition of 1M Tris pH 8.0 to a final concentration of 5mM. All the reactions were combined with equivalent peptide amounts and desalted via SepPak (Waters) tC18 column. The C18 material was first activated with 100% ACN, then the solvent was removed via washes with 50% ACN / 0.1% FA, followed by washes with 0.1% TFA. Samples were loaded onto the column and desalted via washes with 0.1% TFA followed by washes with 0.1%FA. Finally, TMT-labeled peptides were eluted from the C18 material with 50% ACN / 0.1% FA. The labeled peptides were dried and resuspended in high pH buffer A (5mM ammonium formate, 2% ACN) prior to offline high pH Reverse phase fractionation by HPLC on an Agilent 1290 Infinity II. The separation was performed on a XBridge Peptide BEH C18 (130Å, 3.5μm; 2.1mm x 250mm) column (Waters) on a multi-step gradient from 0 to 60% High pH buffer B (5mM ammonium formate, 90% ACN) 96 minutes long and collected in 96 fractions (1 fraction/min). The fractions were then manually pooled into 29 fractions as follows: the first 12 fractions were pooled together, while every other x fraction was pooled with x+28 and x+56. Of each pooled fraction approximately 1μg of peptide was subjected to mass spectrometric (MS) analysis for total proteome measurement. The remaining amounts were further pooled into 5 fractions and used as input for a phosphopeptide enrichment via immobilized metal affinity chromatography (IMAC), which was performed by the Bravo Automated Liquid Handling Platform (Agilent) with AssayMAP Fe(III)-NTA cartridges. The flow-through of the first IMAC enrichment was further pooled into 2 fractions and subjected to a second IMAC enrichment with the same system.
Liquid chromatography mass spectrometry
All mass spectrometry samples were online-fractionated on a EASY-nLC 1200 and acquired on a Q-Exactive HFx (Thermo Fisher Scientific) on a profile-centroid mode. Peptides were separated on a fused silica, 25cm long column packed in-house with C18-AQ 1.9μm beads (Dr. Maisch Reprosil Pur 120) kept to a temperature of 45°C. Mobile phase A consisted of 0.1% FA and 3% ACN in water, while mobile phase B consisted of 0.1% FA and 90% ACN. After quilibritrating the column with 5μl mobile phase A, peptides were separated with a 250μl/min flow on a 110min gradient: mobile phase B increased from 4% to 30% in the first 88 minutes, followed by an increase to 60% in the following 10 minutes, to then reach 90% in one minute, which was held for 5 minutes. For total proteome analysis, the MS was operated in data dependent acquisition, with MS1 scans from 350 to 1500 m/z acquired at a resolution of 60,000 (measured at 200 m/z), maximum injection time (IT) of 10ms and an automatic gain control (AGC) target value of 3 × 10⁶. The 20 most intense precursor ion peaks with charges from +2 to +6 were selected for fragmentation, unless present in the dynamic exclusion list (30 s). Precursor ions were selected with an isolation window of 0.7 m/z, fragmented in an HCD cell with a normalized collision energy of 30% and analyzed in the detector with a resolution of 45,000 m/z (measured at 200 m/z), AGC target value of 105, maximum IT of 86 ms. For phosphoproteome analysis, the MS was operated using the same parameters with the exception of MS2 maximum IT that was set to 240ms.
ELISA
Supernatants of infected or stimulated monocytes were analyzed using DuoSet ELISA Kits for human CCL24, CCL8, IL-6, MCP-1, IL1-β, CXCL5 and IFNβ (R&D Systems) according to manufacturer’s instructions. The concentrations were calculated with GraphPad Prism using the protein standard included in the ELISA kits.
Quantification and statistical analysis
MELC data analysis
Image pre-processing
All images were aligned by cross-correlation based on the reference phase contrast image taken at the beginning of the measurement. Afterward, each fluorescence MELC image was processed by background subtraction and illumination correction, based on the signal of the bleaching images (Schubert et al., 2006). In order to account for slice thickness, an “Extended Depth of Field” algorithm was applied on the 3D fluorescence stack in each cycle (Pertuz et al., 2013). Images were then normalized in Fiji (Schindelin et al., 2012), where a rolling ball algorithm was used for background estimation, edges were removed (accounting for the maximum allowed shift during the autofocus procedure) and fluorescence intensities were stretched to the full intensity range (16 bit = > 216). The 2D fluorescence images generated in this way were subsequently segmented and analyzed.
Cell segmentation and single-cell feature extraction
Segmentation was performed in a two-step process, a signal-classification step using Ilastik 1.3.2 (Berg et al., 2019) followed by an object-recognition step using CellProfiler 3.1.8 (Carpenter et al., 2006), as described elsewhere (Schapiro et al., 2017). Ilastik was used to classify pixels into three classes (nuclei, membrane, and extracellular matrix –ECM-) and to generate probability maps for each class. Classification of images regarding membranes and ECM was performed by summing up a combination of images, using markers expressed in the respective compartments, while only the DAPI signal was used to classify nuclei. The random forest algorithm (machine-learning, Ilastik) was trained by manual pixel-classification in a small region of each data-set (approx. 6% of the image). CellProfiler was subsequently used to segment the nuclei and membrane probability maps and to generate nuclei and cellular binary masks, respectively. These masks were superimposed on the individual fluorescence images acquired for each marker, in order to extract single-cell information, i.e., mean fluorescence intensity (MFI) of each marker per segmented cell.
Data analysis
Mean fluorescence intensities were normalized to the full 16-bit range in Fiji, brought to a 0 to 1 scale in CellProfiler and transformed using the hyperbolic arcsine (cofactor/scale argument = 0.2) prior to clustering analysis. All CD45 expressing cells were selected and data was imported into R version 3.6.3 (https://cran.r-project.org/src/base/R-3/). A total of 22 markers per cell were included in the panel, normalized by the total fluorescence intensity across all markers per cell, scaled (z-scores), and used to compute a two dimensional Uniform Manifold Approximation and Projection (McInnes et al., 2018) embedding using the R package uwot (n,neighbors = 50, n_epochs = 500, n_trees = 100, init = “pca,” min.dist = −0.1, metric = “euclidean”). For unsupervised clustering, a shared nearest neighbor tree was calculated using the scran (Lun et al., 2016) function buildSNNGraph. The Leiden algorithm (Traag et al., 2019; Kelly, 2019) was applied on the graph object with the resolution parameter 0.9 and seed 1993. Unless otherwise stated, all algorithms were used with default settings.
For Macrophage-Collagen IV distance measurements Collagen 4 layer .tif-files were converted into raster objects using the r library “raster.” Euclidean distances of Cellprofiler cell coordinates to the closest Collagen IV structures were calculated with the R package “sf.” Cells were grouped into the groups “in collagen,” “adjacent to collagen,” and “out of collagen” by clustered pixel distances that best represented the visual localizations over all fields of view. Proportions of CD163+ and CD163- macrophages per field of view and localization were computed. Population mean rank differences were tested by paired, two-sided Wilcoxon signed rank test adjusted for multiple testing by the Bonferroni correction.
Single-cell RNA-seq data analysis
Cell Ranger
The Cell Ranger version 3.0.1 software suite was obtained from 10x Genomics. Raw sequencing data was first de-multiplexed and quality-checked using the Cell Ranger ‘mkfastq’ script. For all sample libraries, alignment and transcript quantification was performed with the standard Cell Ranger ‘count’ script against a custom made genome reference containing the GRCh38 human genome assembly and the SARS-CoV-2 genome. Multiple datasets belonging to the same experiment were combined with the Cell Ranger ‘aggr’ script.
Quality control
Count matrices were loaded into R and low quality transcriptomes (e.g., dead or ruptured cells) were removed. Thresholds for the number of genes, number of unique RNA molecules (UMI) and percent mitochondrial genes for each dataset are available in Table S3. In addition, cells were removed after clustering (Waltman and van Eck, 2013) based on low amount of genes and high percentage of mitochondrial genes per cell across clusters (code is available in the GitHub repository).
Normalization and feature selection
Expression matrices were separated from antibody-derived counts and treated separately. For the BAL datasets, the Seurat functions NormalizeData, FindVariableFeatures (n.features = 3000) and ScaleData were used. For the APC datasets, the Seurat function SCTransform (variable.features.n = 3000) was used. Viral mRNA counts were stored in a separated assay.
Demultiplexing of experimental conditions
Hashtag counts were normalized using the Seurat function NormalizeData(method = “CLR”). Cutoffs were chosen by k-means clustering of cells for each hashtag. Uniquely called hashtags were annotated with the experimental condition, double stained (doublet) and unstained (negative) cells were removed (code is available on the GitHub repository).
Demultiplexing of donors
Donors of PBMCs were demultiplexed using the souporcell algorithm (Heaton et al., 2020) based on the BAM files & barcodes exported by CellRanger count.
Dimensional reduction and clustering
Principal component analysis (PCA) was calculated for each dataset using the Seurat function RunPCA based on the highly variable genes. Batch correction (if applied) was performed during the PCA using the batchelor (Haghverdi et al., 2018) function fastMNN using patient identifiers as batch covariate. Uniform manifold approximation and projection (McInnes et al., 2018) embeddings were computed based on differing numbers of principal components using the Seurat function RunUMAP. Nearest neighbor graphs were constructed based on differing numbers of principal components using the Seurat function FindNeighbors. Clusters were identified using the SLM or Leiden algorithms with different resolution parameters using the Seurat function FindClusters (method = igraph) based on the nearest neighbor graph. The specific settings used for each dataset are available in Table S3.
scRNA-seq analysis of BAL data from recovering patients
Cellranger output files were loaded into R (4.0.3) using the Read10X function from Seurat. Low quality transcriptomes were removed from further analysis by filtering for cells with at least 150 unique features and a mitochondrial gene percentage lower than 30%. Subsequently, normalization, variable feature detection and scaling of the data were performed by using the Seurat implemented functions LogNormalization, FindVariableFeatures function (n.features = 2000) and ScaleData. For dimensional reduction, the RunPCA function was used based on the highly variable genes. To account for the batch-effect observed by sample, the “harmony” algorithm (RunHarmony function) (Korsunsky et al., 2019) was applied. For two-dimensional data visualization, UMAP was performed based on the first 50 principal components of the “harmony” data reduction. Subsequently, the cells were clustered using the Louvain algorithm based on the first 30 “harmony” dimensions with a resolution of 0.4. Resulting clusters were annotated for cell types using literature-based markers. For analysis of the monocyte/Mφ compartment, the cells in the respective clusters were subsetted and basic steps (NormalizeData, FindVariableFeatures, ScaleData, RunPCA, RunHarmony, RunUMAP) and Louvain clustering with a resolution of 1.5 was performed. Resulting clusters were annotated to the respective monocyte/Mφ subtype according to the previously identified markers.
Gene set enrichment
Scores for gene expression programs were computed using the Seurat function AddModuleScore (seed = 1993). The top 50 genes of different reference datasets were used, if the list contained less than 50 genes all of them were used as input. Statistical significance of population shifts between clusters were assessed by pairwise, one-sided (alternative = “greater”), two-sample Wilcoxon rank sum test (wilcox.test) of each cluster compared to the average.
Overrepresentation analysis of genes between two gene sets was performed by one-sided (alternative = “greater”) Fisher’s exact test (fisher.test). P values were adjusted for multiple comparisons (p.adjust). All functions were used with default settings unless specified otherwise.
Differential gene expression (DE) analysis
Statistical analysis of differential gene expression was performed using the scran function findMarkers (pval.type = “some,” test.type = “wilcox,” direction = “up”), the block argument was used for patients in the BAL dataset and donors in the stimulated monocytes. Genes with a FDR below 10−15 were considered differentially expressed.
Trajectory inference and pseudotime
Trajectories with pseudotime were computed using the slingshot (Street et al., 2018) R package (version 1.4.0). Input were the UMAP coordinates and cluster annotations (Settings: allow.breaks = TRUE).
Transcription factor enrichment analysis (ChEA3)
Transcription factor (TF) enrichment was performed based on the ChEA3 (Keenan et al., 2019) query in R. The differentially expressed genes (FDR < 1e-15) for each cluster were used as input. The mean rank score was used for TF selection (cutoffs are specified in the figure legends and TFs highlighted in Tables S2 and S5) as recommended by the authors.
Data visualization
Plots were generated in R (version 3.6.3) using custom code based on the ggplot2 version 3.3.2 (https://cran.r-project.org/web/packages/ggplot2/index.html) and pheatmap version 1.0.12 (https://cran.r-project.org/web/packages/pheatmap/index.html). Data wrangling was performed using the dplyr (1.0.2), tidyr (1.1.2) and stringr (1.4.0) packages.
Single-nucleus RNA-seq
Refined cell type annotation was performed on the macrophage, and mesenchymal (fibroblast, SMC, and pericyte) clusters. They were each subsetted from the entire dataset and re-processed to find underlying subclusters by repeating the previous steps of CCA, PCA, UMAP, and clustering on the selected cells. Markers from the scRNA-seq BAL dataset were used to annotate the different macrophages, while mesenchymal markers from previously published scRNA-seq lung atlases were applied to identify fibroblasts, SMC, and pericytes (Adams et al., 2020; Reyfman et al., 2019).
Potential cell-cell interactions between the different subclusters of macrophages and mesenchymal cells were identified using CellChat v0.5.5 (Jin et al., 2021). Differential interactions between patient groups were calculated using mergeCellChat() and compareInteractions() functions iteratively per comparison. Intercellular communication networks are weighted directed graphs composed of significant interactions between cell groups, where “interaction strength” is defined as the communication probability of the computed networks (Jin et al., 2021). Differentially enriched interaction pathways were determined for early and late postmortem SARS-CoV-2 cases by using the rankNet() function. Significance was determined by the function by performing a paired Wilcoxon test. Information flow is the overall communication probability, where it is the summation of the probability among all pairs of cell groups in the inferred network.
Data integration
Single cells from this study and three previous studies were integrated into a single embedding. Briefly, macrophage cells from (Adams et al., 2020) and (Morse et al., 2019) were selected using their published annotations (Adams: all cells with the keyword “Macrophage” in the column “Subclass_Cell_Identity”; Morse: SPP1hi Macrophages, and FABP4hi Macrophages; (Bharat et al., 2020): AM1/2, MoM1/2/3, and Monocytes), and integrated with monocyte-derived cells annotated in this work (annotations: FCN1 Mono, Mono/Mφ, SPP1/LGMN-Mφ, SPP1/TREM2-Mφ, INHBA-AMφ, and Prolif-AMφ, Low Quality). To minimize cell number bias possibly linked to high cell numbers in Adams, we downsampled cells from Adams to maintain an equal number of IPF, control and COPD cells (30,159 in each category). This gives a total of 90,477 cells from Adams (18 COPD, 32 IPF and 28 control), 17,551 from Morse (6 IPF and 3 control), and 22,810 cells from (Bharat et al., 2020) (1 case and 2 postmortem biopsies of patients that underwent lung transplantation after COVID-19 infections), with macrophage annotations and balanced condition, respectively. These cells were integrated with 7,503 monocyte-derived cells from this study. The integration of the three datasets was done using single-cell variational inference (scVI) as implemented scvi-tools (version 0.6.7) (Lopez et al., 2018), using patient identifiers in Adams (one per patient), sample identifiers in Morse (one or more per patient), and patient identifiers in (Bharat et al., 2020) (one per patient) as batch covariates, respectively. scVI was chosen for integration since it was a scalable top performer in a recent batch integration benchmark (Luecken et al., 2020). The network architecture had the following parameters: n_latent = 30, n_hidden = 128, and n_layers = 2. We trained this network for 400 epochs and used the latent representation as a low dimensional embedding to compute a k-nearest neighbor graph for the integrated cells with k = 15, using SCANPY (Wolf et al., 2018) (version 1.6.0; anndata version 0.7.4) and calculate a UMAP layout (McInnes et al., 2018).
To assess the similarity of monocyte-derived macrophages from patients with COVID-19 to these cells from other diseases, we mapped condition labels (i.e., fibrosis, COPD, and control) from our reference to the COVID-19 monocyte-derived macrophages. To reach a robust result, we treated the (Bharat et al., 2020) study as a replicate of this study and thus repeated the same experiment with each dataset. Thus, cells from (Bharat et al., 2020), were held out for the analysis of cells from this study, and vice versa for the analysis of cells from (Bharat et al., 2020). Specifically, we mapped condition labels onto monocyte-derived macrophages from either COVID-19 study via local majority voting: briefly, based on the kNN graph built from the joint embedding, all nearest neighbors from other non-COVID-19 studies were retrieved for each monocyte-derived cell from the study. The most common condition label (IPF/control/COPD) across these neighbors was then projected onto the cell. We did not consider the monocyte-derived macrophage “Low Quality” category for this analysis, to allow easier interpretation. Furthermore, as cells from COPD were underrepresented in the integrated dataset despite previous down-sampling, we did not consider cells assigned to COPD for further analysis as these would be underrepresented purely due to the background distribution. To ensure a completely separate analysis of both COVID-19 studies, we annotated cells from our study after removing (Bharat et al., 2020) cells from the integrated embedding and recalculated nearest neighbors, and vice versa for mapping cells in (Bharat et al., 2020).
To assess the enrichment of specific condition labels for each monocyte-derived macrophage subtype, we calculated the enrichments of each monocyte-derived macrophage and condition combination using 2 × 2 contingency tables. Significance of observed odds ratios were calculated using Fisher’s exact tests, one-tailed, and adjusting p values using Benjamini Hochberg’s procedure (Benjamini and Hochberg, 1995).
Proteomics data analysis
RAW files were analyzed using MaxQuant (Tyanova et al., 2016) v1.6.10.43, where TMTpro was manually included as a fixed modification and quantitation method. Correction factors for each TMT channel were added to account for channel spillage and minimum reporter precursor intensity fraction was set to 0.5. The MS scans were searched against human, influenza A and SARS-CoV-2 uniprot databases (Jan 2020, Apr 2020 and Mar 2020 respectively) using the Andromeda search engine. FDR was calculated based on searches on a pseudo-reverse database and set to 0.05. The search included as fixed modifications carbamidomethylation of cysteine and as variable modifications methionine oxidation, N-terminal acetylation, and asparagine and glutamine deamidation. Trypsin/P was set as protease for in-silico digestion. Total proteome and IMAC-enriched phosphopeptides samples were analyzed in the same MaxQuant run in separate parameter groups with the same settings, except for the IMAC-enriched samples also Phospho (STY) was added as variable modification. Contaminants, hits in the reverse database, only identified by modified site and identified by less than two peptides of which one unique were removed from the ProteinGroups result table. Phosphosites were filtered by hits in the reverse database, potential contaminants and sites with localization probability lower than 50%. Differences in protein intensities across the samples were evaluated using an ANOVA test and results were filtered for Benjamini-Hochberg adjusted p values lower than 5%. Proteins passing this filtering were clustered using fuzzy-c-means clustering. Gene Set Enrichment Analysis was performed with the R GSEA suite (v2.0) of the Broad Institute using the Molecular Signature Database (MSigDB, v7.0) with the ontology and immunologic gene set collections. Data analysis was done using custom scripts and with the following packages: rawDiag (Trachsel et al., 2018) and data.table (Dowle and Srinivasan, 2019). Proteomic data was mapped to three different gene signatures and analyzed using the stat_ecdf function as implemented in the stats R-package. The signatures we tested originated from: genes identified as upregulated from scRNA-seq of macrophages in patients with pulmonary fibrosis (listed with a FC > 0) in supplementary_table_3_human_sc_de.xlsx table from (Reyfman et al., 2019); SPP1-expressing macrophages identified in idiopathic pulmonary fibrosis (Morse et al., 2019); genes characterizing IPF-expanded macrophages, identified from scRNA-seq analysis of patients with idiopathic pulmonary fibrosis, taken from Figure 3A of (Ayaub et al., 2021). All gene set distributions were tested for average upregulation for each time point compared to all other quantified proteins using a one-sided wilcoxon rank sum test using the wilcox.test function implemented in R (Version 3.6.3).
Acknowledgments
The members of the DeCOI network are listed in the supplemental information. The authors are grateful to all patients and their relatives for consenting to biosampling and data collection. COVID-19 research at Charité - Universitätsmedizin Berlin was facilitated by the PA-COVID-19 study group (Kurth et al., 2020). Autopsy studies were facilitated by the Biobank of the Department of Neuropathology at Charité and by the Institute of Pathology, RWTH Aachen University Hospital, Aachen, Germany. We thank Achim Leutz (MDC) for valuable comments and Philipp Mertins and the MDC/BIH proteomics core unit team for supporting proteomic sample preparation.
The authors are indebted to the Clinical Study Center (CSC) at the Berlin Institute of Health (BIH) and Charité, particularly Christof von Kalle, Alexander Krannich, Uwe Behrens, Sein Schmidt, Chantip Dang-Heine, Saskia Zvorc, and Maria Rönnefahrt; and to the Central Biobank of the BIH (ZeBanC), particularly Michael Hummel, Denise Treue, and Dana Briesemeister, for ongoing support of the PA-COVID-19 Study. We thank Petra Schrade for expert technical assistance.
This work was supported by the German Ministry of Education and Research (BMBF) and the German Network University Medicine NUM FKZ 01KX2021 (COVIM to L.E.S., F.K., B.S., N.S., J.L.S., and S. Herold; DEFEAT PANDEMIcs to P.B. and F.L.H.; OrganoStrat to A.-E.S., M.L., E.W., S.H., A.H., F.L.H. and C.G.; NAPKON to M.W.); the BMBF CAPSyS- (01ZX1304B to M.W.); CAPSyS-COVID- (01ZX1604B to M.W.); SYMPATH- (01ZX1906A to M.W.); PROVID- (01KI20160A to M.W., C.D., L.E.S., S. Hippenstiel); RECAST- (01 Kl20337 to B.S. and L.E.S.); and RAPID-consortia (01KI2006F to T.W.); the national research node MSTARS (031L0220B to M.S.); and the Comprehensive Heart Failure Center Würzburg (BMBF 01EO1504 to C.C. and A.-E. S.); BMBF (01DG14009 to M.O.); BMBF (01GM1901A to P.B.); BMBF (CompLS HOPARL 031L0289B to F.J.T. and A.-E.S.) and Deutsche Forschungsgemeinschaft (DFG): GRK 2157 (to O.D. and A.-E.S.); SFB-TR84 114933180 (B2 to T.W. and S. Herold, C6+C9 to M.W., C8+C10 to L.E.S., B6 to S.H. and A.H., and B9 to S. Herold); SPP1937 (HA5354/8-2 HA5354/10-1 to A.E.H.); SFB1021 (C5 to S. Herold); KFO309 (P2/P8 to S. Herold); TRR130 (TP17 and C01 to A.E.H. and H.R.); SFB-TRR 167 and HE 3130/6-1 to F.L.H.; SFB1449 (B2 to M.W.); Germany’s Excellence Strategy (EXC2151 – 390873048 to J.L.S., INST 37/1049-1, INST 216/981-1, INST 257/605-1, INST 269/768-1, INST 217/988-1, and INST 217/577-1 to J.L.S.; EXC - 2049-390688087 to F.L.H., EXC2026 – 390649896 to S. Herold); SFB/TRR219 (Project-ID 322900939) and Project-ID 454024652 to P.B.; DJ100/1-1 to S.D. (Project-ID 432698239); Project-ID 445703531 to S.D. and P.B.; the EU Horizon 2020 grant 874656-DiscovAIR to J.L.S.; European Research Council (ERC CoG-101001791 to P.B.); the Berlin University Alliance (BUA: 501_Elektronenmikroskopie to M.O.); the German Registry of COVID-19 Autopsies (DeRegCOVID); the Federal Ministry of Health (BMG) (ZMVI1-2520COR201 to P.B.); and the Medical Faculty of RWTH Aachen University (START 125/17 to S.v.S.). The clinical study is supported by the Berlin Institute of Health (BIH) PA-COVID-19 study. This work was also supported by the Department of Genomics & Immunoregulation at LIMES Institute (to A.C.A.), IZKF at University Hospital Würzburg (IZKF-E-353 to C.C.), and the government of Bavaria (Bayerische Staatsregierung, FOR-COVID to A.E.S.). A.L.H. and D.W. were supported by the Jürgen Manchot Foundation, and M.M. is supported by the BIH-Charité Digital Clinician Scientist Program.
Author contributions
Conceptualization, D.W., O.D., T.M., S.v.S., M.D.L., P.B., M.S., A.-E.S., and L.E.S.; methodology, D.W., O.D., T.M., S.v.S., I.L.I., S.B., T.K., A.P.R., R.G., A.E.H., and M.D.L.; software/data analysis, D.W., O.D., T.M., S.v.S., I.L.I., R.L.C., H.Z., A.L.H, A.P.R., R.M., R.D.B., A.M.L., F.E., A.E.H., M.D.L., F.J.T., C.C., M.S., A.-E.S., and L.E.S.; resources, S.v.S., M.M, C.M., A.P.R., R.M., R.D.B., J.S., S.D., F.P., J.K., J.R., P.P., K.B., C. Conrad, A.C.A., B.S., M.L., E.W., D.H., S. Hippenstiel, A.H., F.L.H., A.U., C.G., F.M., S. Herold, S.E., C.T., M.W., C. Cochain, N.S., C.D., C.G., F.K., J.L.S., H.R., R.E., H.M.R., T.W., P.B., S.T., and M.O.; supervision, P.B., M.S., A.-E.S., and L.E.S.; writing – original draft, M.S., A.-E.S., and L.E.S.; writing – review & editing, D.W., O.D., T.M., S.v.S., A.C.A., J.L.S., M.S., A.-E.S., and L.E.S.
Declaration of interests
The authors declare no competing interests.
Published: November 27, 2021
Footnotes
Supplemental information can be found online at https://doi.org/10.1016/j.cell.2021.11.033.
Supplemental information
Data and code availability
scRNA-seq data generated during this study are deposited at the European Genome-phenome Archive (EGA) under the accession numbers EGAS00001004928 and EGAS00001005634, which is hosted by the EBI and the CRG. snRNA-seq data generated previously (Gassen et al., 2021) are accessible under the accession number EGAS00001004689. The mass spectrometry proteomics data have been deposited to the ProteomeXchange Consortium via the PRIDE partner repository with the dataset identifier: PXD022709.
R code used for the analysis of scRNA-seq data has been deposited on GitHub: https://github.com/OliverDietrich/SARS-CoV-2-infection-triggers-profibrotic-macrophage-responses-and-lung-fibrosis
Count matrices and Seurat objects have been deposited via Nubes: https://nubes.helmholtz-berlin.de/s/XrM8igTzFTFSoio.
Python code used for scRNA-seq data integration has been deposited on GitHub: https://github.com/theislab/covid_macrophages_integration
References
- Adams T.S., Schupp J.C., Poli S., Ayaub E.A., Neumark N., Ahangari F., Chu S.G., Raby B.A., DeIuliis G., Januszyk M., et al. Single-cell RNA-seq reveals ectopic and aberrant lung-resident cell populations in idiopathic pulmonary fibrosis. Sci. Adv. 2020;6:eaba1983. doi: 10.1126/sciadv.aba1983. [DOI] [PMC free article] [PubMed] [Google Scholar]
- Adler D., Murdoch D., Nenadic O., Urbanek S., Chen M., Gebhardt A., Senger A. 2019. rgl: 3D Visualization Using OpenGL. R package version 0.100.19. [Google Scholar]
- Adler M., Mayo A., Zhou X., Franklin R.A., Meizlish M.L., Medzhitov R., Kallenberger S.M., Alon U. Principles of Cell Circuits for Tissue Repair and Fibrosis. iScience. 2020;23:100841. doi: 10.1016/j.isci.2020.100841. [DOI] [PMC free article] [PubMed] [Google Scholar]
- Aran D., Looney A.P., Liu L., Wu E., Fong V., Hsu A., Chak S., Naikawadi R.P., Wolters P.J., Abate A.R., et al. Reference-based analysis of lung single-cell sequencing reveals a transitional profibrotic macrophage. Nat. Immunol. 2019;20:163–172. doi: 10.1038/s41590-018-0276-y. [DOI] [PMC free article] [PubMed] [Google Scholar]
- Arjun S., Patel D., Sanivarapu R., Iqbal J., Anjum F. Case report of severe pulmonary fibrosis as a sequelae of COVID-19 infection. Chest. 2020;158:A433–A434. [Google Scholar]
- Arredouani M.S., Palecanda A., Koziel H., Huang Y.-C., Imrich A., Sulahian T.H., Ning Y.Y., Yang Z., Pikkarainen T., Sankala M., et al. MARCO is the major binding receptor for unopsonized particles and bacteria on human alveolar macrophages. J. Immunol. 2005;175:6058–6064. doi: 10.4049/jimmunol.175.9.6058. [DOI] [PubMed] [Google Scholar]
- Ashcroft T., Simpson J.M., Timbrell V. Simple method of estimating severity of pulmonary fibrosis on a numerical scale. J. Clin. Pathol. 1988;41:467–470. doi: 10.1136/jcp.41.4.467. [DOI] [PMC free article] [PubMed] [Google Scholar]
- Ayaub E.A., Poli S., Ng J., Adams T., Schupp J., Quesada-Arias L., Poli F., Cosme C., Robertson M., Martinez-Manzano J., et al. Single cell RNA-seq and mass cytometry reveals a novel and a targetable population of macrophages in idiopathic pulmonary fibrosis. bioRxiv. 2021 doi: 10.1101/2021.01.04.425268. [DOI] [Google Scholar]
- Bai P., Lyu L., Yu T., Zuo C., Fu J., He Y., Wan Q., Wan N., Jia D., Lyu A. Macrophage-Derived Legumain Promotes Pulmonary Hypertension by Activating the MMP (Matrix Metalloproteinase)-2/TGF (Transforming Growth Factor)-β1 Signaling. Arterioscler. Thromb. Vasc. Biol. 2019;39:e130–e145. doi: 10.1161/ATVBAHA.118.312254. [DOI] [PubMed] [Google Scholar]
- Bankhead P., Loughrey M.B., Fernández J.A., Dombrowski Y., McArt D.G., Dunne P.D., McQuaid S., Gray R.T., Murray L.J., Coleman H.G., et al. QuPath: Open source software for digital pathology image analysis. Sci. Rep. 2017;7:16878. doi: 10.1038/s41598-017-17204-5. [DOI] [PMC free article] [PubMed] [Google Scholar]
- Barbaro R.P., MacLaren G., Boonstra P.S., Iwashyna T.J., Slutsky A.S., Fan E., Bartlett R.H., Tonna J.E., Hyslop R., Fanning J.J., et al. Extracorporeal Life Support Organization Extracorporeal membrane oxygenation support in COVID-19: an international cohort study of the Extracorporeal Life Support Organization registry. Lancet. 2020;396:1071–1078. doi: 10.1016/S0140-6736(20)32008-0. [DOI] [PMC free article] [PubMed] [Google Scholar]
- Benjamini Y., Hochberg Y. Controlling the False Discovery Rate: A Practical and Powerful Approach to Multiple Testing. J. R. Stat. Soc. B. 1995;57:289–300. [Google Scholar]
- Berg S., Kutra D., Kroeger T., Straehle C.N., Kausler B.X., Haubold C., Schiegg M., Ales J., Beier T., Rudy M., et al. ilastik: interactive machine learning for (bio)image analysis. Nat. Methods. 2019;16:1226–1232. doi: 10.1038/s41592-019-0582-9. [DOI] [PubMed] [Google Scholar]
- Bharat A., Querrey M., Markov N.S., Kim S., Kurihara C., Garza-Castillon R., Manerikar A., Shilatifard A., Tomic R., Politanska Y., et al. Lung transplantation for patients with severe COVID-19. Sci. Transl. Med. 2020;12:eabe4282. doi: 10.1126/scitranslmed.abe4282. [DOI] [PMC free article] [PubMed] [Google Scholar]
- Blanco-Melo D., Nilsson-Payant B.E., Liu W.-C., Uhl S., Hoagland D., Møller R., Jordan T.X., Oishi K., Panis M., Sachs D., et al. Imbalanced Host Response to SARS-CoV-2 Drives Development of COVID-19. Cell. 2020;181:1036–1045.e9. doi: 10.1016/j.cell.2020.04.026. [DOI] [PMC free article] [PubMed] [Google Scholar]
- Bogdanow B., Wang X., Eichelbaum K., Sadewasser A., Husic I., Paki K., Budt M., Hergeselle M., Vetter B., Hou J., et al. The dynamic proteome of influenza A virus infection identifies M segment splicing as a host range determinant. Nat. Commun. 2019;10:5518. doi: 10.1038/s41467-019-13520-8. [DOI] [PMC free article] [PubMed] [Google Scholar]
- Brody S.L., Gunsten S.P., Luehmann H.P., Sultan D.H., Hoelscher M., Heo G.S., Pan J., Koenitzer J.R., Lee E.C., Huang T., et al. Chemokine Receptor 2-targeted Molecular Imaging in Pulmonary Fibrosis. A Clinical Trial. Am. J. Respir. Crit. Care Med. 2021;203:78–89. doi: 10.1164/rccm.202004-1132OC. [DOI] [PMC free article] [PubMed] [Google Scholar]
- Brunson J. ggalluvial: Layered Grammar for Alluvial Plots. J. Open Source Softw. 2020;5(49):2017. doi: 10.21105/joss.02017. [DOI] [PMC free article] [PubMed] [Google Scholar]
- Buccitelli C., Selbach M. mRNAs, proteins and the emerging principles of gene expression control. Nat. Rev. Genet. 2020;21:630–644. doi: 10.1038/s41576-020-0258-4. [DOI] [PubMed] [Google Scholar]
- Calfee C.S., Delucchi K., Parsons P.E., Thompson B.T., Ware L.B., Matthay M.A., NHLBI ARDS Network Subphenotypes in acute respiratory distress syndrome: latent class analysis of data from two randomised controlled trials. Lancet Respir. Med. 2014;2:611–620. doi: 10.1016/S2213-2600(14)70097-9. [DOI] [PMC free article] [PubMed] [Google Scholar]
- Calkhoven C.F., Müller C., Leutz A. Translational control of C/EBPalpha and C/EBPbeta isoform expression. Genes Dev. 2000;14:1920–1932. [PMC free article] [PubMed] [Google Scholar]
- Campitelli Elio. 2021. ggnewscale: Multiple Fill and Colour Scales in ‘ggplot2’. R package version 0.4.5.https://CRAN.R-project.org/package=ggnewscale [Google Scholar]
- Cantuti-Castelvetri L., Ojha R., Pedro L.D., Djannatian M., Franz J., Kuivanen S., van der Meer F., Kallio K., Kaya T., Anastasina M., et al. Neuropilin-1 facilitates SARS-CoV-2 cell entry and infectivity. Science. 2020;370:856–860. doi: 10.1126/science.abd2985. [DOI] [PMC free article] [PubMed] [Google Scholar]
- Carpenter A.E., Jones T.R., Lamprecht M.R., Clarke C., Kang I.H., Friman O., Guertin D.A., Chang J.H., Lindquist R.A., Moffat J., et al. CellProfiler: image analysis software for identifying and quantifying cell phenotypes. Genome Biol. 2006;7:R100. doi: 10.1186/gb-2006-7-10-r100. [DOI] [PMC free article] [PubMed] [Google Scholar]
- Carsana L., Sonzogni A., Nasr A., Rossi R.S., Pellegrinelli A., Zerbi P., Rech R., Colombo R., Antinori S., Corbellino M., et al. Pulmonary post-mortem findings in a series of COVID-19 cases from northern Italy: a two-centre descriptive study. Lancet Infect. Dis. 2020;20:1135–1140. doi: 10.1016/S1473-3099(20)30434-5. [DOI] [PMC free article] [PubMed] [Google Scholar]
- Chua R.L., Lukassen S., Trump S., Hennig B.P., Wendisch D., Pott F., Debnath O., Thürmann L., Kurth F., Völker M.T., et al. COVID-19 severity correlates with airway epithelium-immune cell interactions identified by single-cell analysis. Nat. Biotechnol. 2020;38:970–979. doi: 10.1038/s41587-020-0602-4. [DOI] [PubMed] [Google Scholar]
- Cline T.D., Beck D., Bianchini E. Influenza virus replication in macrophages: balancing protection and pathogenesis. J. Gen. Virol. 2017;98:2401–2412. doi: 10.1099/jgv.0.000922. [DOI] [PMC free article] [PubMed] [Google Scholar]
- Collard H.R., Moore B.B., Flaherty K.R., Brown K.K., Kaner R.J., King T.E., Jr., Lasky J.A., Loyd J.E., Noth I., Olman M.A., et al. Idiopathic Pulmonary Fibrosis Clinical Research Network Investigators Acute exacerbations of idiopathic pulmonary fibrosis. Am. J. Respir. Crit. Care Med. 2007;176:636–643. doi: 10.1164/rccm.200703-463PP. [DOI] [PMC free article] [PubMed] [Google Scholar]
- Collard H.R., Ryerson C.J., Corte T.J., Jenkins G., Kondoh Y., Lederer D.J., Lee J.S., Maher T.M., Wells A.U., Antoniou K.M., et al. Acute Exacerbation of Idiopathic Pulmonary Fibrosis. An International Working Group Report. Am. J. Respir. Crit. Care Med. 2016;194:265–275. doi: 10.1164/rccm.201604-0801CI. [DOI] [PubMed] [Google Scholar]
- Combet M., Pavot A., Savale L., Humbert M., Monnet X. Rapid onset honeycombing fibrosis in spontaneously breathing patient with COVID-19. Eur. Respir. J. 2020;56:2001808. doi: 10.1183/13993003.01808-2020. [DOI] [PMC free article] [PubMed] [Google Scholar]
- Cox J., Mann M. MaxQuant enables high peptide identification rates, individualized p.p.b.-range mass accuracies and proteome-wide protein quantification. Nat. Biotechnol. 2008;26:1367–1372. doi: 10.1038/nbt.1511. [DOI] [PubMed] [Google Scholar]
- D’Alessio F.R., Heller N.M. COVID-19 and myeloid cells: complex interplay correlates with lung severity. J. Clin. Invest. 2020;130:6214–6217. doi: 10.1172/JCI143361. [DOI] [PMC free article] [PubMed] [Google Scholar]
- Daly J.L., Simonetti B., Klein K., Chen K.-E., Williamson M.K., Antón-Plágaro C., Shoemark D.K., Simón-Gracia L., Bauer M., Hollandi R., et al. Neuropilin-1 is a host factor for SARS-CoV-2 infection. Science. 2020;370:861–865. doi: 10.1126/science.abd3072. [DOI] [PMC free article] [PubMed] [Google Scholar]
- Descombes P., Schibler U. A liver-enriched transcriptional activator protein, LAP, and a transcriptional inhibitory protein, LIP, are translated from the same mRNA. Cell. 1991;67:569–579. doi: 10.1016/0092-8674(91)90531-3. [DOI] [PubMed] [Google Scholar]
- Dowle M., Srinivasan A. 2019. data.table: Extension of `data.frame`. R package version 1.13.0. [Google Scholar]
- Fan E., Beitler J.R., Brochard L., Calfee C.S., Ferguson N.D., Slutsky A.S., Brodie D. COVID-19-associated acute respiratory distress syndrome: is a different approach to management warranted? Lancet Respir. Med. 2020;8:816–821. doi: 10.1016/S2213-2600(20)30304-0. [DOI] [PMC free article] [PubMed] [Google Scholar]
- Ferguson N.D., Fan E., Camporota L., Antonelli M., Anzueto A., Beale R., Brochard L., Brower R., Esteban A., Gattinoni L., et al. The Berlin definition of ARDS: an expanded rationale, justification, and supplementary material. Intensive Care Med. 2012;38:1573–1582. doi: 10.1007/s00134-012-2682-1. [DOI] [PubMed] [Google Scholar]
- Frangogiannis N. Transforming growth factor-β in tissue fibrosis. J. Exp. Med. 2020;217:e20190103. doi: 10.1084/jem.20190103. [DOI] [PMC free article] [PubMed] [Google Scholar]
- Garnier S. 2018. viridis: Default Color Maps from “matplotlib”. R package version 0.5.1. [Google Scholar]
- Gassen N.C., Papies J., Bajaj T., Emanuel J., Dethloff F., Chua R.L., Trimpert J., Heinemann N., Niemeyer C., Weege F., et al. SARS-CoV-2-mediated dysregulation of metabolism and autophagy uncovers host-targeting antivirals. Nat. Commun. 2021;12:3818. doi: 10.1038/s41467-021-24007-w. [DOI] [PMC free article] [PubMed] [Google Scholar]
- Gayoso A., Lopez R., Xing G., Boyeau P., Wu K., Jayasuriya M., Mehlman E., Langevin M., Liu Y., Samaran J., et al. Scvi-tools: A library for deep probabilistic analysis of single-cell omics data. bioRxiv. 2021 doi: 10.1101/2021.04.28.441833. [DOI] [PubMed] [Google Scholar]
- George P.M., Wells A.U., Jenkins R.G. Pulmonary fibrosis and COVID-19: the potential role for antifibrotic therapy. Lancet Respir. Med. 2020;8:807–815. doi: 10.1016/S2213-2600(20)30225-3. [DOI] [PMC free article] [PubMed] [Google Scholar]
- Gibbons M.A., MacKinnon A.C., Ramachandran P., Dhaliwal K., Duffin R., Phythian-Adams A.T., van Rooijen N., Haslett C., Howie S.E., Simpson A.J., et al. Ly6Chi monocytes direct alternatively activated profibrotic macrophage regulation of lung fibrosis. Am. J. Respir. Crit. Care Med. 2011;184:569–581. doi: 10.1164/rccm.201010-1719OC. [DOI] [PubMed] [Google Scholar]
- Grant R.A., Morales-Nebreda L., Markov N.S., Swaminathan S., Querrey M., Guzman E.R., Abbott D.A., Donnelly H.K., Donayre A., Goldberg I.A., et al. NU SCRIPT Study Investigators Circuits between infected macrophages and T cells in SARS-CoV-2 pneumonia. Nature. 2021;590:635–641. doi: 10.1038/s41586-020-03148-w. [DOI] [PMC free article] [PubMed] [Google Scholar]
- Guimarães P.O., Quirk D., Furtado R.H., Maia L.N., Saraiva J.F., Antunes M.O., Kalil Filho R., Junior V.M., Soeiro A.M., Tognon A.P., et al. STOP-COVID Trial Investigators Tofacitinib in Patients Hospitalized with Covid-19 Pneumonia. N. Engl. J. Med. 2021;385:406–415. doi: 10.1056/NEJMoa2101643. [DOI] [PMC free article] [PubMed] [Google Scholar]
- Haghverdi L., Lun A.T.L., Morgan M.D., Marioni J.C. Batch effects in single-cell RNA-sequencing data are corrected by matching mutual nearest neighbors. Nat. Biotechnol. 2018;36:421–427. doi: 10.1038/nbt.4091. [DOI] [PMC free article] [PubMed] [Google Scholar]
- Harris C.R., Millman K.J., van der Walt S.J., Gommers R., Virtanen P., Cournapeau D., Wieser E., Taylor J., Berg S., Smith N.J., et al. Array programming with NumPy. Nature. 2020;585:357–362. doi: 10.1038/s41586-020-2649-2. [DOI] [PMC free article] [PubMed] [Google Scholar]
- Hasan S.S., Capstick T., Ahmed R., Kow C.S., Mazhar F., Merchant H.A., Zaidi S.T.R. Mortality in COVID-19 patients with acute respiratory distress syndrome and corticosteroids use: a systematic review and meta-analysis. Expert Rev. Respir. Med. 2020;14:1149–1163. doi: 10.1080/17476348.2020.1804365. [DOI] [PMC free article] [PubMed] [Google Scholar]
- He X., Lau E.H.Y., Wu P., Deng X., Wang J., Hao X., Lau Y.C., Wong J.Y., Guan Y., Tan X., et al. Temporal dynamics in viral shedding and transmissibility of COVID-19. Nat. Med. 2020;26:672–675. doi: 10.1038/s41591-020-0869-5. [DOI] [PubMed] [Google Scholar]
- Heaton H., Talman A.M., Knights A., Imaz M., Gaffney D.J., Durbin R., Hemberg M., Lawniczak M.K.N. Souporcell: robust clustering of single-cell RNA-seq data by genotype without reference genotypes. Nat. Methods. 2020;17:615–620. doi: 10.1038/s41592-020-0820-1. [DOI] [PMC free article] [PubMed] [Google Scholar]
- Henderson N.C., Rieder F., Wynn T.A. Fibrosis: from mechanisms to medicines. Nature. 2020;587:555–566. doi: 10.1038/s41586-020-2938-9. [DOI] [PMC free article] [PubMed] [Google Scholar]
- Hendrickson C.M., Crestani B., Matthay M.A. Biology and pathology of fibroproliferation following the acute respiratory distress syndrome. Intensive Care Med. 2015;41:147–150. doi: 10.1007/s00134-014-3580-5. [DOI] [PMC free article] [PubMed] [Google Scholar]
- Henry B.M., Lippi G. Poor survival with extracorporeal membrane oxygenation in acute respiratory distress syndrome (ARDS) due to coronavirus disease 2019 (COVID-19): Pooled analysis of early reports. J. Crit. Care. 2020;58:27–28. doi: 10.1016/j.jcrc.2020.03.011. [DOI] [PMC free article] [PubMed] [Google Scholar]
- Herold S., Becker C., Ridge K.M., Budinger G.R.S. Influenza virus-induced lung injury: pathogenesis and implications for treatment. Eur. Respir. J. 2015;45:1463–1478. doi: 10.1183/09031936.00186214. [DOI] [PubMed] [Google Scholar]
- Hijmans R.J. 2020. Geographic Data Analysis and Modeling. R package raster version 3.4-5. [Google Scholar]
- Hoffmann M., Kleine-Weber H., Schroeder S., Krüger N., Herrler T., Erichsen S., Schiergens T.S., Herrler G., Wu N.-H., Nitsche A., et al. SARS-CoV-2 Cell Entry Depends on ACE2 and TMPRSS2 and Is Blocked by a Clinically Proven Protease Inhibitor. Cell. 2020;181:271–280.e8. doi: 10.1016/j.cell.2020.02.052. [DOI] [PMC free article] [PubMed] [Google Scholar]
- Holzwarth K., Köhler R., Philipsen L., Tokoyoda K., Ladyhina V., Wählby C., Niesner R.A., Hauser A.E. Multiplexed fluorescence microscopy reveals heterogeneity among stromal cells in mouse bone marrow sections. Cytometry A. 2018;93:876–888. doi: 10.1002/cyto.a.23526. [DOI] [PubMed] [Google Scholar]
- Horby P., Lim W.S., Emberson J.R., Mafham M., Bell J.L., Linsell L., Staplin N., Brightling C., Ustianowski A., Elmahi E., et al. RECOVERY Collaborative Group Dexamethasone in Hospitalized Patients with Covid-19. N. Engl. J. Med. 2021;384:693–704. doi: 10.1056/NEJMoa2021436. [DOI] [PMC free article] [PubMed] [Google Scholar]
- Huang C., Huang L., Wang Y., Li X., Ren L., Gu X., Kang L., Guo L., Liu M., Zhou X., et al. 6-month consequences of COVID-19 in patients discharged from hospital: a cohort study. Lancet. 2021;397:220–232. doi: 10.1016/S0140-6736(20)32656-8. [DOI] [PMC free article] [PubMed] [Google Scholar]
- Huber R., Pietsch D., Panterodt T., Brand K. Regulation of C/EBPβ and resulting functions in cells of the monocytic lineage. Cell. Signal. 2012;24:1287–1296. doi: 10.1016/j.cellsig.2012.02.007. [DOI] [PubMed] [Google Scholar]
- Hunter J.D. Matplotlib: A 2D Graphics Environment. Comput. Sci. Eng. 2007;9:90–95. [Google Scholar]
- Huynh M.-L.N., Fadok V.A., Henson P.M. Phosphatidylserine-dependent ingestion of apoptotic cells promotes TGF-beta1 secretion and the resolution of inflammation. J. Clin. Invest. 2002;109:41–50. doi: 10.1172/JCI11638. [DOI] [PMC free article] [PubMed] [Google Scholar]
- Jin S., Guerrero-Juarez C.F., Zhang L., Chang I., Ramos R., Kuan C.-H., Myung P., Plikus M.V., Nie Q. Inference and analysis of cell-cell communication using CellChat. Nat. Commun. 2021;12:1088. doi: 10.1038/s41467-021-21246-9. [DOI] [PMC free article] [PubMed] [Google Scholar]
- Jones T.C., Biele G., Mühlemann B., Veith T., Schneider J., Beheim-Schwarzbach J., Bleicker T., Tesch J., Schmidt M.L., Sander L.E., et al. Estimating infectiousness throughout SARS-CoV-2 infection course. Science. 2021;373:eabi5273. doi: 10.1126/science.abi5273. [DOI] [PMC free article] [PubMed] [Google Scholar]
- Joshi N., Watanabe S., Verma R., Jablonski R.P., Chen C.-I., Cheresh P., Markov N.S., Reyfman P.A., McQuattie-Pimentel A.C., Sichizya L., et al. A spatially restricted fibrotic niche in pulmonary fibrosis is sustained by M-CSF/M-CSFR signalling in monocyte-derived alveolar macrophages. Eur. Respir. J. 2020;55:1900646. doi: 10.1183/13993003.00646-2019. [DOI] [PMC free article] [PubMed] [Google Scholar]
- Kassambara A. 2020. ggpubr: ‘ggplot2’ Based Publication Ready Plots. R package version 0.4.0. https://CRAN.R-project.org/package=ggpubr. [Google Scholar]
- Keenan A.B., Torre D., Lachmann A., Leong A.K., Wojciechowicz M.L., Utti V., Jagodnik K.M., Kropiwnicki E., Wang Z., Ma’ayan A. ChEA3: transcription factor enrichment analysis by orthogonal omics integration. Nucleic Acids Res. 2019;47(W1):W212–W224. doi: 10.1093/nar/gkz446. [DOI] [PMC free article] [PubMed] [Google Scholar]
- Kelly T. 2019. leiden: R implementation of the Leiden algorithm. R package version 0.3.3.https://github.com/TomKellyGenetics/leiden [Google Scholar]
- Kidani Y., Bensinger S.J. Liver X receptor and peroxisome proliferator-activated receptor as integrators of lipid homeostasis and immunity. Immunol. Rev. 2012;249:72–83. doi: 10.1111/j.1600-065X.2012.01153.x. [DOI] [PMC free article] [PubMed] [Google Scholar]
- Korsunsky I., Millard N., Fan J., et al. Fast, sensitive and accurate integration of single-cell data with Harmony. Nat Methods. 2019;16:1289–1296. doi: 10.1038/s41592-019-0619-0. [DOI] [PMC free article] [PubMed] [Google Scholar]
- Kurth F., Roennefarth M., Thibeault C., Corman V.M., Müller-Redetzky H., Mittermaier M., Ruwwe-Glösenkamp C., Heim K.M., Krannich A., Zvorc S., et al. Studying the pathophysiology of coronavirus disease 2019: a protocol for the Berlin prospective COVID-19 patient cohort (Pa-COVID-19) Infection. 2020;48:619–626. doi: 10.1007/s15010-020-01464-x. [DOI] [PMC free article] [PubMed] [Google Scholar]
- Leisman D.E., Ronner L., Pinotti R., Taylor M.D., Sinha P., Calfee C.S., Hirayama A.V., Mastroiani F., Turtle C.J., Harhay M.O., et al. Cytokine elevation in severe and critical COVID-19: a rapid systematic review, meta-analysis, and comparison with other inflammatory syndromes. Lancet Respir. Med. 2020;8:1233–1244. doi: 10.1016/S2213-2600(20)30404-5. [DOI] [PMC free article] [PubMed] [Google Scholar]
- Liao M., Liu Y., Yuan J., Wen Y., Xu G., Zhao J., Cheng L., Li J., Wang X., Wang F., et al. Single-cell landscape of bronchoalveolar immune cells in patients with COVID-19. Nat. Med. 2020;26:842–844. doi: 10.1038/s41591-020-0901-9. [DOI] [PubMed] [Google Scholar]
- Liaw L., Skinner M.P., Raines E.W., Ross R., Cheresh D.A., Schwartz S.M., Giachelli C.M. The adhesive and migratory effects of osteopontin are mediated via distinct cell surface integrins. Role of alpha v beta 3 in smooth muscle cell migration to osteopontin in vitro. J. Clin. Invest. 1995;95:713–724. doi: 10.1172/JCI117718. [DOI] [PMC free article] [PubMed] [Google Scholar]
- Lopez R., Regier J., Cole M.B., Jordan M.I., Yosef N. Deep generative modeling for single-cell transcriptomics. Nat. Methods. 2018;15:1053–1058. doi: 10.1038/s41592-018-0229-2. [DOI] [PMC free article] [PubMed] [Google Scholar]
- Luecken M.D., Büttner M., Chaichoompu K., Danese A., Interlandi M., Mueller M.F., Strobl D.C., Zappia L., Dugas M., Colomé-Tatché M., et al. Benchmarking atlas-level data integration in single-cell genomics. bioRxiv. 2020 doi: 10.1101/2020.05.22.111161. [DOI] [PMC free article] [PubMed] [Google Scholar]
- Lukassen S., Chua R.L., Trefzer T., Kahn N.C., Schneider M.A., Muley T., Winter H., Meister M., Veith C., Boots A.W., et al. SARS-CoV-2 receptor ACE2 and TMPRSS2 are primarily expressed in bronchial transient secretory cells. EMBO J. 2020;39:e105114. doi: 10.15252/embj.20105114. [DOI] [PMC free article] [PubMed] [Google Scholar]
- Lun A.T.L., McCarthy D.J., Marioni J.C. A step-by-step workflow for low-level analysis of single-cell RNA-seq data with Bioconductor. F1000Res. 2016;5:2122. doi: 10.12688/f1000research.9501.1. [DOI] [PMC free article] [PubMed] [Google Scholar]
- Matthaei M., Budt M., Wolff T. Highly pathogenic H5N1 influenza A virus strains provoke heterogeneous IFN-α/β responses that distinctively affect viral propagation in human cells. PLoS ONE. 2013;8:e56659. doi: 10.1371/journal.pone.0056659. [DOI] [PMC free article] [PubMed] [Google Scholar]
- McInnes L., Healy J., Saul N., Großberger L. UMAP: Uniform Manifold Approximation and Projection. J. Open Source Softw. 2018;3:861. [Google Scholar]
- Mehta P., McAuley D.F., Brown M., Sanchez E., Tattersall R.S., Manson J.J., HLH Across Speciality Collaboration, UK COVID-19: consider cytokine storm syndromes and immunosuppression. Lancet. 2020;395:1033–1034. doi: 10.1016/S0140-6736(20)30628-0. [DOI] [PMC free article] [PubMed] [Google Scholar]
- Meinhardt J., Radke J., Dittmayer C., Franz J., Thomas C., Mothes R., Laue M., Schneider J., Brünink S., Greuel S., et al. Olfactory transmucosal SARS-CoV-2 invasion as a port of central nervous system entry in individuals with COVID-19. Nat. Neurosci. 2021;24:168–175. doi: 10.1038/s41593-020-00758-5. [DOI] [PubMed] [Google Scholar]
- Melville J. 2020. uwot: The Uniform Manifold Approximation and Projection (UMAP) Method for Dimensionality Reduction. R package version 0.1.8. https://CRAN.R-project.org/package=uwot. [Google Scholar]
- Meneghin A., Hogaboam C.M. Infectious disease, the innate immune response, and fibrosis. J. Clin. Invest. 2007;117:530–538. doi: 10.1172/JCI30595. [DOI] [PMC free article] [PubMed] [Google Scholar]
- Mertins P., Tang L.C., Krug K., Clark D.J., Gritsenko M.A., Chen L., Clauser K.R., Clauss T.R., Shah P., Gillette M.A., et al. Reproducible workflow for multiplexed deep-scale proteome and phosphoproteome analysis of tumor tissues by liquid chromatography-mass spectrometry. Nat. Protoc. 2018;13:1632–1661. doi: 10.1038/s41596-018-0006-9. [DOI] [PMC free article] [PubMed] [Google Scholar]
- Messner C.B., Demichev V., Wendisch D., Michalick L., White M., Freiwald A., Textoris-Taube K., Vernardis S.I., Egger A.-S., Kreidl M., et al. Ultra-High-Throughput Clinical Proteomics Reveals Classifiers of COVID-19 Infection. Cell Syst. 2020;11:11–24.e4. doi: 10.1016/j.cels.2020.05.012. [DOI] [PMC free article] [PubMed] [Google Scholar]
- Misharin A.V., Morales-Nebreda L., Reyfman P.A., Cuda C.M., Walter J.M., McQuattie-Pimentel A.C., Chen C.-I., Anekalla K.R., Joshi N., Williams K.J.N., et al. Monocyte-derived alveolar macrophages drive lung fibrosis and persist in the lung over the life span. J. Exp. Med. 2017;214:2387–2404. doi: 10.1084/jem.20162152. [DOI] [PMC free article] [PubMed] [Google Scholar]
- Molyneaux P.L., Maher T.M. The role of infection in the pathogenesis of idiopathic pulmonary fibrosis. Eur. Respir. Rev. 2013;22:376–381. doi: 10.1183/09059180.00000713. [DOI] [PMC free article] [PubMed] [Google Scholar]
- Moore B.B., Paine R., 3rd, Christensen P.J., Moore T.A., Sitterding S., Ngan R., Wilke C.A., Kuziel W.A., Toews G.B. Protection from pulmonary fibrosis in the absence of CCR2 signaling. J. Immunol. 2001;167:4368–4377. doi: 10.4049/jimmunol.167.8.4368. [DOI] [PubMed] [Google Scholar]
- Morse C., Tabib T., Sembrat J., Buschur K.L., Bittar H.T., Valenzi E., Jiang Y., Kass D.J., Gibson K., Chen W., et al. Proliferating SPP1/MERTK-expressing macrophages in idiopathic pulmonary fibrosis. Eur. Respir. J. 2019;54:1802441. doi: 10.1183/13993003.02441-2018. [DOI] [PMC free article] [PubMed] [Google Scholar]
- Nacu N., Luzina I.G., Highsmith K., Lockatell V., Pochetuhen K., Cooper Z.A., Gillmeister M.P., Todd N.W., Atamas S.P. Macrophages produce TGF-beta-induced (beta-ig-h3) following ingestion of apoptotic cells and regulate MMP14 levels and collagen turnover in fibroblasts. J. Immunol. 2008;180:5036–5044. doi: 10.4049/jimmunol.180.7.5036. [DOI] [PMC free article] [PubMed] [Google Scholar]
- Naik P.K., Moore B.B. Viral infection and aging as cofactors for the development of pulmonary fibrosis. Expert Rev. Respir. Med. 2010;4:759–771. doi: 10.1586/ers.10.73. [DOI] [PMC free article] [PubMed] [Google Scholar]
- Niemeyer D., Mösbauer K., Klein E.M., Sieberg A., Mettelman R.C., Mielech A.M., Dijkman R., Baker S.C., Drosten C., Müller M.A. The papain-like protease determines a virulence trait that varies among members of the SARS-coronavirus species. PLoS Pathog. 2018;14:e1007296. doi: 10.1371/journal.ppat.1007296. [DOI] [PMC free article] [PubMed] [Google Scholar]
- Nouno T., Okamoto M., Ohnishi K., Kaieda S., Tominaga M., Zaizen Y., Ichiki M., Momosaki S., Nakamura M., Fujimoto K., et al. Elevation of pulmonary CD163+ and CD204+ macrophages is associated with the clinical course of idiopathic pulmonary fibrosis patients. J. Thorac. Dis. 2019;11:4005–4017. doi: 10.21037/jtd.2019.09.03. [DOI] [PMC free article] [PubMed] [Google Scholar]
- Ochs M., Timm S., Elezkurtaj S., Horst D., Meinhardt J., Heppner F.L., Weber-Carstens S., Hocke A.C., Witzenrath M. Collapse induration of alveoli is an ultrastructural finding in a COVID-19 patient. Eur. Respir. J. 2021;57:2004165. doi: 10.1183/13993003.04165-2020. [DOI] [PMC free article] [PubMed] [Google Scholar]
- Ooms J. The jsonlite Package: A Practical and Consistent Mapping Between JSON Data and R Objects. arXiv. 2014 https://arxiv.org/abs/1403.2805 1403.2805. [Google Scholar]
- Osuchowski M.F., Winkler M.S., Skirecki T., Cajander S., Shankar-Hari M., Lachmann G., Monneret G., Venet F., Bauer M., Brunkhorst F.M., et al. The COVID-19 puzzle: deciphering pathophysiology and phenotypes of a new disease entity. Lancet Respir. Med. 2021;9:622–642. doi: 10.1016/S2213-2600(21)00218-6. [DOI] [PMC free article] [PubMed] [Google Scholar]
- Pan Y., Guan H., Zhou S., Wang Y., Li Q., Zhu T., Hu Q., Xia L. Initial CT findings and temporal changes in patients with the novel coronavirus pneumonia (2019-nCoV): a study of 63 patients in Wuhan, China. Eur. Radiol. 2020;30:3306–3309. doi: 10.1007/s00330-020-06731-x. [DOI] [PMC free article] [PubMed] [Google Scholar]
- Pardo A., Gibson K., Cisneros J., Richards T.J., Yang Y., Becerril C., Yousem S., Herrera I., Ruiz V., Selman M., Kaminski N. Up-regulation and profibrotic role of osteopontin in human idiopathic pulmonary fibrosis. PLoS Med. 2005;2:e251. doi: 10.1371/journal.pmed.0020251. [DOI] [PMC free article] [PubMed] [Google Scholar]
- Pascual-Reguant A., Köhler R., Mothes R., Bauherr S., Hernández D.C., Uecker R., Holzwarth K., Kotsch K., Seidl M., Philipsen L., et al. Multiplexed histology analyses for the phenotypic and spatial characterization of human innate lymphoid cells. Nat. Commun. 2021;12:1737. doi: 10.1038/s41467-021-21994-8. [DOI] [PMC free article] [PubMed] [Google Scholar]
- Patel J., Beishuizen A., Ruiz X.B., Boughanmi H., Cahn A., Criner G.J., Davy K., de-Miguel-Díez J., Fernandes S., François B., et al. A randomized trial of otilimab in severe COVID-19 pneumonia (OSCAR) medRxiv. 2021 doi: 10.1101/2021.04.1421255475. [DOI] [PMC free article] [PubMed] [Google Scholar]
- Pebesma E. Simple Features for R: Standardized Support for Spatial Vector Data. The R Journal. 2018;10(1):439–446. doi: 10.32614/RJ-2018-009. [DOI] [Google Scholar]
- Pertuz S., Puig D., Garcia M.A., Fusiello A. Generation of all-in-focus images by noise-robust selective fusion of limited depth-of-field images. IEEE Trans. Image Process. 2013;22:1242–1251. doi: 10.1109/TIP.2012.2231087. [DOI] [PubMed] [Google Scholar]
- Polak S.B., Van Gool I.C., Cohen D., von der Thüsen J.H., van Paassen J. A systematic review of pathological findings in COVID-19: a pathophysiological timeline and possible mechanisms of disease progression. Mod. Pathol. 2020;33:2128–2138. doi: 10.1038/s41379-020-0603-3. [DOI] [PMC free article] [PubMed] [Google Scholar]
- R Core Team . 2019. R: A language and environment for statistical computing. [Google Scholar]
- R Core Team . 2020. R: A language and environment for statistical computing.https://www.R-project.org/ [Google Scholar]
- Raivo Kolde. 2019. pheatmap: Pretty Heatmaps. R package version 1.0.12.https://CRAN.R-project.org/package=pheatmap [Google Scholar]
- Rappsilber J., Mann M., Ishihama Y. Protocol for micro-purification, enrichment, pre-fractionation and storage of peptides for proteomics using StageTips. Nat. Protoc. 2007;2:1896–1906. doi: 10.1038/nprot.2007.261. [DOI] [PubMed] [Google Scholar]
- Remy K.E., Mazer M., Striker D.A., Ellebedy A.H., Walton A.H., Unsinger J., Blood T.M., Mudd P.A., Yi D.J., Mannion D.A., et al. Severe immunosuppression and not a cytokine storm characterizes COVID-19 infections. JCI Insight. 2020;5:e140329. doi: 10.1172/jci.insight.140329. [DOI] [PMC free article] [PubMed] [Google Scholar]
- Ren Y.-C., Zhao Q., He Y., Li B., Wu Z., Dai J., Wen L., Wang X., Hu G. Legumain promotes fibrogenesis in chronic pancreatitis via activation of transforming growth factor β1. J. Mol. Med. (Berl.) 2020;98:863–874. doi: 10.1007/s00109-020-01911-0. [DOI] [PubMed] [Google Scholar]
- Reyfman P.A., Walter J.M., Joshi N., Anekalla K.R., McQuattie-Pimentel A.C., Chiu S., Fernandez R., Akbarpour M., Chen C.-I., Ren Z., et al. Single-Cell Transcriptomic Analysis of Human Lung Provides Insights into the Pathobiology of Pulmonary Fibrosis. Am. J. Respir. Crit. Care Med. 2019;199:1517–1536. doi: 10.1164/rccm.201712-2410OC. [DOI] [PMC free article] [PubMed] [Google Scholar]
- Richardson S., Hirsch J.S., Narasimhan M., Crawford J.M., McGinn T., Davidson K.W., Barnaby D.P., Becker L.B., Chelico J.D., Cohen S.L., et al. the Northwell COVID-19 Research Consortium Presenting Characteristics, Comorbidities, and Outcomes Among 5700 Patients Hospitalized With COVID-19 in the New York City Area. JAMA. 2020;323:2052–2059. doi: 10.1001/jama.2020.6775. [DOI] [PMC free article] [PubMed] [Google Scholar]
- Rittling S.R. Osteopontin in macrophage function. Expert Rev. Mol. Med. 2011;13:e15. doi: 10.1017/S1462399411001839. [DOI] [PubMed] [Google Scholar]
- Sadewasser A., Paki K., Eichelbaum K., Bogdanow B., Saenger S., Budt M., Lesch M., Hinz K.-P., Herrmann A., Meyer T.F., et al. Quantitative Proteomic Approach Identifies Vpr Binding Protein as Novel Host Factor Supporting Influenza A Virus Infections in Human Cells. Mol. Cell. Proteomics. 2017;16:728–742. doi: 10.1074/mcp.M116.065904. [DOI] [PMC free article] [PubMed] [Google Scholar]
- Satoh T., Nakagawa K., Sugihara F., Kuwahara R., Ashihara M., Yamane F., Minowa Y., Fukushima K., Ebina I., Yoshioka Y., et al. Identification of an atypical monocyte and committed progenitor involved in fibrosis. Nature. 2017;541:96–101. doi: 10.1038/nature20611. [DOI] [PubMed] [Google Scholar]
- Schapiro D., Jackson H.W., Raghuraman S., Fischer J.R., Zanotelli V.R.T., Schulz D., Giesen C., Catena R., Varga Z., Bodenmiller B. histoCAT: analysis of cell phenotypes and interactions in multiplex image cytometry data. Nat. Methods. 2017;14:873–876. doi: 10.1038/nmeth.4391. [DOI] [PMC free article] [PubMed] [Google Scholar]
- Schindelin J., Arganda-Carreras I., Frise E., Kaynig V., Longair M., Pietzsch T., Preibisch S., Rueden C., Saalfeld S., Schmid B., et al. Fiji: an open-source platform for biological-image analysis. Nat. Methods. 2012;9:676–682. doi: 10.1038/nmeth.2019. [DOI] [PMC free article] [PubMed] [Google Scholar]
- Schneider C., Nobs S.P., Kurrer M., Rehrauer H., Thiele C., Kopf M. Induction of the nuclear receptor PPAR-γ by the cytokine GM-CSF is critical for the differentiation of fetal monocytes into alveolar macrophages. Nat. Immunol. 2014;15:1026–1037. doi: 10.1038/ni.3005. [DOI] [PubMed] [Google Scholar]
- Schubert W., Bonnekoh B., Pommer A.J., Philipsen L., Böckelmann R., Malykh Y., Gollnick H., Friedenberger M., Bode M., Dress A.W.M. Analyzing proteome topology and function by automated multidimensional fluorescence microscopy. Nat. Biotechnol. 2006;24:1270–1278. doi: 10.1038/nbt1250. [DOI] [PubMed] [Google Scholar]
- Schulte-Schrepping J., Reusch N., Paclik D., Baßler K., Schlickeiser S., Zhang B., Krämer B., Krammer T., Brumhard S., Bonaguro L., et al. Deutsche COVID-19 OMICS Initiative (DeCOI) Severe COVID-19 Is Marked by a Dysregulated Myeloid Cell Compartment. Cell. 2020;182:1419–1440.e23. doi: 10.1016/j.cell.2020.08.001. [DOI] [PMC free article] [PubMed] [Google Scholar]
- Schupp J.C., Binder H., Jäger B., Cillis G., Zissel G., Müller-Quernheim J., Prasse A. Macrophage activation in acute exacerbation of idiopathic pulmonary fibrosis. PLoS ONE. 2015;10:e0116775. doi: 10.1371/journal.pone.0116775. [DOI] [PMC free article] [PubMed] [Google Scholar]
- Schwensen H.F., Borreschmidt L.K., Storgaard M., Redsted S., Christensen S., Madsen L.B. Fatal pulmonary fibrosis: a post-COVID-19 autopsy case. J. Clin. Pathol. 2020;74:400–402. doi: 10.1136/jclinpath-2020-206879. [DOI] [PubMed] [Google Scholar]
- Scott M.K.D., Quinn K., Li Q., Carroll R., Warsinske H., Vallania F., Chen S., Carns M.A., Aren K., Sun J., et al. Increased monocyte count as a cellular biomarker for poor outcomes in fibrotic diseases: a retrospective, multicentre cohort study. Lancet Respir. Med. 2019;7:497–508. doi: 10.1016/S2213-2600(18)30508-3. [DOI] [PMC free article] [PubMed] [Google Scholar]
- Sheng G., Chen P., Wei Y., Yue H., Chu J., Zhao J., Wang Y., Zhang W., Zhang H.-L. Viral Infection Increases the Risk of Idiopathic Pulmonary Fibrosis: A Meta-Analysis. Chest. 2020;157:1175–1187. doi: 10.1016/j.chest.2019.10.032. [DOI] [PMC free article] [PubMed] [Google Scholar]
- Sinha P., Matthay M.A., Calfee C.S. Is a “Cytokine Storm” Relevant to COVID-19? JAMA Intern. Med. 2020;180:1152–1154. doi: 10.1001/jamainternmed.2020.3313. [DOI] [PubMed] [Google Scholar]
- Spagnolo P., Balestro E., Aliberti S., Cocconcelli E., Biondini D., Casa G.D., Sverzellati N., Maher T.M. Pulmonary fibrosis secondary to COVID-19: a call to arms? Lancet Respir. Med. 2020;8:750–752. doi: 10.1016/S2213-2600(20)30222-8. [DOI] [PMC free article] [PubMed] [Google Scholar]
- Speranza E., Williamson B.N., Feldmann F., Sturdevant G.L., Pérez-Pérez L., Mead-White K., Smith B.J., Lovaglio J., Martens C., Munster V.J., et al. SARS-CoV-2 infection dynamics in lungs of African green monkeys. bioRxiv. 2020 doi: 10.1101/2020.08.20.258087. [DOI] [PMC free article] [PubMed] [Google Scholar]
- Speranza E., Williamson B.N., Feldmann F., Sturdevant G.L., Pérez-Pérez L., Meade-White K., Smith B.J., Lovaglio J., Martens C., Munster V.J., et al. Single-cell RNA sequencing reveals SARS-CoV-2 infection dynamics in lungs of African green monkeys. Sci. Transl. Med. 2021;13:eabe8146. doi: 10.1126/scitranslmed.abe8146. [DOI] [PMC free article] [PubMed] [Google Scholar]
- Street K., Risso D., Fletcher R.B., Das D., Ngai J., Yosef N., Purdom E., Dudoit S. Slingshot: cell lineage and pseudotime inference for single-cell transcriptomics. BMC Genomics. 2018;19:477. doi: 10.1186/s12864-018-4772-0. [DOI] [PMC free article] [PubMed] [Google Scholar]
- Stuart T., Butler A., Hoffman P., Hafemeister C., Papalexi E., Mauck W.M., 3rd, Hao Y., Stoeckius M., Smibert P., Satija R. Comprehensive Integration of Single-Cell Data. Cell. 2019;177:1888–1902.e21. doi: 10.1016/j.cell.2019.05.031. [DOI] [PMC free article] [PubMed] [Google Scholar]
- Subramanian A., Tamayo P., Mootha V.K., Mukherjee S., Ebert B.L., Gillette M.A., Paulovich A., Pomeroy S.L., Golub T.R., Lander E.S., Mesirov J.P. Gene set enrichment analysis: a knowledge-based approach for interpreting genome-wide expression profiles. Proc. Natl. Acad. Sci. USA. 2005;102:15545–15550. doi: 10.1073/pnas.0506580102. [DOI] [PMC free article] [PubMed] [Google Scholar]
- Szabo P.A., Dogra P., Gray J.I., Wells S.B., Connors T.J., Weisberg S.P., Krupska I., Matsumoto R., Poon M.M.L., Idzikowski E., et al. Longitudinal profiling of respiratory and systemic immune responses reveals myeloid cell-driven lung inflammation in severe COVID-19. Immunity. 2021;54:797–814.e6. doi: 10.1016/j.immuni.2021.03.005. [DOI] [PMC free article] [PubMed] [Google Scholar]
- Teoh A.K.Y., Jo H.E., Chambers D.C., Symons K., Walters E.H., Goh N.S., Glaspole I., Cooper W., Reynolds P., Moodley Y., Corte T.J. Blood monocyte counts as a potential prognostic marker for idiopathic pulmonary fibrosis: analysis from the Australian IPF registry. Eur. Respir. J. 2020;55:1901855. doi: 10.1183/13993003.01855-2019. [DOI] [PubMed] [Google Scholar]
- Thompson B.T., Chambers R.C., Liu K.D. Acute Respiratory Distress Syndrome. N. Engl. J. Med. 2017;377:562–572. doi: 10.1056/NEJMra1608077. [DOI] [PubMed] [Google Scholar]
- Traag V.A., Waltman L., van Eck N.J. From Louvain to Leiden: guaranteeing well-connected communities. Sci. Rep. 2019;9:5233. doi: 10.1038/s41598-019-41695-z. [DOI] [PMC free article] [PubMed] [Google Scholar]
- Trachsel C., Panse C., Kockmann T., Wolski W.E., Grossmann J., Schlapbach R. rawDiag: An R Package Supporting Rational LC-MS Method Optimization for Bottom-up Proteomics. J. Proteome Res. 2018;17:2908–2914. doi: 10.1021/acs.jproteome.8b00173. [DOI] [PubMed] [Google Scholar]
- Tyanova S., Temu T., Cox J. The MaxQuant computational platform for mass spectrometry-based shotgun proteomics. Nat. Protoc. 2016;11:2301–2319. doi: 10.1038/nprot.2016.136. [DOI] [PubMed] [Google Scholar]
- Urtasun R., Lopategi A., George J., Leung T.-M., Lu Y., Wang X., Ge X., Fiel M.I., Nieto N. Osteopontin, an oxidant stress sensitive cytokine, up-regulates collagen-I via integrin α(V)β(3) engagement and PI3K/pAkt/NFκB signaling. Hepatology. 2012;55:594–608. doi: 10.1002/hep.24701. [DOI] [PMC free article] [PubMed] [Google Scholar]
- Van Rossum G., Drake F.L. Scotts Valley; 2009. Python 3 Reference Manual CreateSpace. [Google Scholar]
- Virtanen P., Gommers R., Oliphant T.E., Haberland M., Reddy T., Cournapeau D., Burovski E., Peterson P., Weckesser W., Bright J., et al. SciPy 1.0 Contributors SciPy 1.0: fundamental algorithms for scientific computing in Python. Nat. Methods. 2020;17:261–272. doi: 10.1038/s41592-019-0686-2. [DOI] [PMC free article] [PubMed] [Google Scholar]
- Walls A.C., Park Y.-J., Tortorici M.A., Wall A., McGuire A.T., Veesler D. Structure, Function, and Antigenicity of the SARS-CoV-2 Spike Glycoprotein. Cell. 2020;181:281–292.e6. doi: 10.1016/j.cell.2020.02.058. [DOI] [PMC free article] [PubMed] [Google Scholar]
- Waltman L., van Eck N.J. A smart local moving algorithm for large-scale modularity-based community detection. Eur. Phys. J. B. 2013;86:471. [Google Scholar]
- Waskom M. seaborn: statistical data visualization. J. Open Source Softw. 2021;6:3021. [Google Scholar]
- Webb B.J., Peltan I.D., Jensen P., Hoda D., Hunter B., Silver A., Starr N., Buckel W., Grisel N., Hummel E., et al. Clinical criteria for COVID-19-associated hyperinflammatory syndrome: a cohort study. Lancet Rheumatol. 2020;2:e754–e763. doi: 10.1016/S2665-9913(20)30343-X. [DOI] [PMC free article] [PubMed] [Google Scholar]
- Wickham H. Springer-Verlag; New York: 2016. ggplot2: Elegant Graphics for Data Analysis. [Google Scholar]
- Wickham Hadley. 2019. Hadley Wickham (2019). stringr: Simple, Consistent Wrappers for Common String Operations. R package version 1.4.0.https://CRAN.R-project.org/package=stringr [Google Scholar]
- Wickham Hadley. 2020. Hadley Wickham (2020). httr: Tools for Working with URLs and HTTP. R package version 1.4.2.https://CRAN.R-project.org/package=httr [Google Scholar]
- Wickham H. 2020. Tidy Messy Data. R package tidyr version 1.0.2. [Google Scholar]
- Wickham H., François R., Henry L., Müller K. 2020. A Grammar of Data Manipulation. R package dplyr version 1.0.2. [Google Scholar]
- Wickham Hadley, Hester Jim. 2018. Read Rectangular Text Data. R package readr version 1.4.0. [Google Scholar]
- Wolf F.A., Angerer P., Theis F.J. SCANPY: large-scale single-cell gene expression data analysis. Genome Biol. 2018;19:15. doi: 10.1186/s13059-017-1382-0. [DOI] [PMC free article] [PubMed] [Google Scholar]
- Wölfel R., Corman V.M., Guggemos W., Seilmaier M., Zange S., Müller M.A., Niemeyer D., Jones T.C., Vollmar P., Rothe C., et al. Virological assessment of hospitalized patients with COVID-2019. Nature. 2020;581:465–469. doi: 10.1038/s41586-020-2196-x. [DOI] [PubMed] [Google Scholar]
- Wootton S.C., Kim D.S., Kondoh Y., Chen E., Lee J.S., Song J.W., Huh J.W., Taniguchi H., Chiu C., Boushey H., et al. Viral infection in acute exacerbation of idiopathic pulmonary fibrosis. Am. J. Respir. Crit. Care Med. 2011;183:1698–1702. doi: 10.1164/rccm.201010-1752OC. [DOI] [PMC free article] [PubMed] [Google Scholar]
- Wynn T.A., Vannella K.M. Macrophages in Tissue Repair, Regeneration, and Fibrosis. Immunity. 2016;44:450–462. doi: 10.1016/j.immuni.2016.02.015. [DOI] [PMC free article] [PubMed] [Google Scholar]
- Yu G., Wang L.-G., Han Y., He Q.-Y. clusterProfiler: an R package for comparing biological themes among gene clusters. OMICS. 2012;16:284–287. doi: 10.1089/omi.2011.0118. [DOI] [PMC free article] [PubMed] [Google Scholar]
Associated Data
This section collects any data citations, data availability statements, or supplementary materials included in this article.
Supplementary Materials
Data Availability Statement
scRNA-seq data generated during this study are deposited at the European Genome-phenome Archive (EGA) under the accession numbers EGAS00001004928 and EGAS00001005634, which is hosted by the EBI and the CRG. snRNA-seq data generated previously (Gassen et al., 2021) are accessible under the accession number EGAS00001004689. The mass spectrometry proteomics data have been deposited to the ProteomeXchange Consortium via the PRIDE partner repository with the dataset identifier: PXD022709.
R code used for the analysis of scRNA-seq data has been deposited on GitHub: https://github.com/OliverDietrich/SARS-CoV-2-infection-triggers-profibrotic-macrophage-responses-and-lung-fibrosis
Count matrices and Seurat objects have been deposited via Nubes: https://nubes.helmholtz-berlin.de/s/XrM8igTzFTFSoio.
Python code used for scRNA-seq data integration has been deposited on GitHub: https://github.com/theislab/covid_macrophages_integration