

Abstract
ATP released into the bloodstream regulates immune responses and other physiological functions. Excessive accumulation of extracellular ATP interferes with these functions, and elevated plasma ATP levels could indicate infections and other pathological disorders. However, there is considerable disagreement about what constitutes normal plasma ATP levels. Therefore, we optimized a method to accurately assess ATP concentrations in blood. We found that rapid chilling of heparinized blood samples is essential to preserve in vivo ATP levels and that differential centrifugation minimizes inadvertent ATP release due to cell damage and mechanical stress. Plasma samples were stabilized with perchloric acid, etheno-derivatized, and delipidated for sensitive analysis of ATP and related compounds using high-performance liquid chromatography (HPLC) and fluorescence detection. We measured 33 ± 20 nM ATP, 90 ± 45 nM ADP, 100 ± 55 nM AMP, and 81 ± 51 nM adenosine in the blood of healthy human adults (n = 10). In critically ill patients, ATP levels were 6 times higher than in healthy subjects. The anticoagulant greatly affected results. ATP levels were nearly 8 times higher in EDTA plasma than in heparin plasma, while AMP levels were 3 times lower and adenosine was entirely absent in EDTA plasma. If EDTA blood was not immediately chilled, ATP, ADP, and AMP levels continued to rise, which indicates that EDTA interferes with the endogenous mechanisms that regulate plasma adenylate levels. Our optimized method eliminates artifacts that prevent accurate determination of plasma adenylates and will be useful for studying mechanisms that regulate adenylate levels and for monitoring of pathological processes in patients with infections and other diseases.
Supplementary Information
The online version contains supplementary material available at 10.1007/s11302-022-09842-w.
Keywords: ATP, Adenosine, Plasma adenylates, Purinergic signaling, HPLC
Introduction
ATP is a universal energy carrier that drives virtually all cellular processes needed for life. However, cells can also release ATP in order to communicate with adjacent cells [1]. When released into the extracellular space, ATP and its breakdown products act as messenger molecules that are recognized by P2X, P2Y, and P1 receptors [2]. These three receptor families comprise nineteen different members and are collectively referred to as purinergic receptors. All mammalian cell types express specific sets of these purinergic receptors that differ in their binding affinities for their respective ligands and that can therefore selectively recognize different concentrations of ATP, ADP, and adenosine in the extracellular environment [3, 4].
In addition to the paracrine role of ATP as an intercellular messenger, ATP that is released from cells can also act in an autocrine fashion, which helps regulate and fine-tune cell functions [5, 6]. The autocrine purinergic feedback mechanisms are fueled by focal ATP release that occurs at specific subcellular sites at the cell surface [7, 8]. Immune cells, for example, release ATP in response to various stimuli and form pericellular ATP hotspots that activate adjacent purinergic receptors and thereby help initiate and orchestrate subsequent functional cell responses such as cell migration, antigen recognition, and other important tasks needed for host defense [9–13].
However, cellular ATP can also be released in a disorganized fashion, for example, when cells are damaged by mechanical stress or as a result of tissue injury [5, 14]. Widespread cell damage can result in elevated extracellular ATP levels that are sufficiently high to overwhelm the autocrine purinergic signaling mechanisms at the surface of immune cells and disrupt normal immune cell function [15, 16]. Dysregulated extracellular ATP levels are thought to impair immune responses in many clinical settings such as in patients with trauma, ischemia, cancer, and chronic and acute inflammatory disorders like systemic lupus erythematosus, arthritis, asthma, viral infections, and sepsis [17–20]. Accurate measurement of plasma ATP levels could help diagnose these problems and monitor disease progression in these patients.
Several methods have been developed to assess concentrations of ATP in blood and other biological materials. Many of these methods are based on enzymatic reactions like luciferin/luciferase assays that generate light or fluorescent products in the presence of ATP, which allows detection of ATP with luminometric or fluorometric readout methods, respectively [21–24]. Some techniques can be used to simultaneously determine the concentrations of ATP and its breakdown products based on chromatographic or electrophoretic separation followed by detection of the separated compounds with photometric or mass spectrometric detectors. Among these methods, one is particularly sensitive and selective, which makes it highly suitable for the measurement of the relatively low extracellular ATP concentrations in blood samples. This method is based on the conversion of ATP and its breakdown products ADP, AMP, and adenosine to fluorescent derivatives that can be separated by high-performance liquid chromatography (HPLC) and quantified with a fluorescence detector [25–28].
Regardless of the method used, however, the reliable analysis of ATP levels in blood depends on the sample preparation technique. Sample preparation is complicated because ATP and its breakdown products are highly unstable in biological fluids. Another problem is the risk of ATP leakage from platelets or other blood cells due to blood clotting, cell damage, or mechanical stress associated with centrifugation and other sample preparation processes [29]. In order to address those problems, “stop solutions” are often added during blood collection and plasma preparation [30]. These stop solutions contain various combinations of inhibitors to prevent ATP release from platelets, to inhibit the hydrolysis of ATP by ectonucleotidases, or to attenuate the reuptake of adenosine by red blood cells. However, because these release, hydrolysis, and reuptake processes are integral aspects of the mechanisms that regulate in vivo adenylate levels, stop solutions distort the actual adenylate concentrations present in circulating blood. The use of such stop solutions and other unintended technical pitfalls are likely responsible for the widely diverging ATP levels that have been reported for human blood with ATP levels ranging from as low as 20 nM to as high as 10,000 nM [31–34].
The aim of the present study was to streamline sample preparation and HPLC analysis methods in order to eliminate the main sources of errors and the major pitfalls that interfere with reliable estimation of ATP, ADP, AMP, and adenosine levels in human blood.
Materials and methods
Materials and reagents
All solvents, reagents, and chemical compounds used in this study were of analytical- or HPLC-grade quality. HPLC-grade methanol and water (Hypergrade for LC–MS LiChrosolv®, product number (#) 1.06035 and # 1.15333), TLC Silica gel 60 plates (# 1.16835), ATP (# A6419), ADP (# A5285), AMP (# A1752), adenosine (# A9251), acetic acid (# 320,099), tetrabutylammonium bisulfate (# 86,853), perchloric acid (PCA, # 244,252), and chloroacetaldehyde (# 317,276) were from Millipore Sigma (Burlington, MA). Chloroform (# C298-500) was from Thermo Fisher Scientific (Waltham, MA). K2HPO4 (# 60,347), Na2HPO4, (# 71,629), NH4HCO3 (# 09,830), KH2PO4 (# 60,221), and HPLC-grade KOH solution (45%; # 03,564) were from Fluka (Honeywell, Charlotte, NC). Adenosine 5′-(α, β-methylene) diphosphate sodium salt (AMPCP; # 3633) used as an internal standard was obtained from R&D Systems (Minneapolis, MN). Nile red (# 30,787) was from Cayman Chemicals (Ann Arbor, MI) and Phree™ phospholipid removal columns (# 8B-S133-TAK) were from Phenomenex (Torrance, CA). HyperSep™ C18 cartridges (particle size 40 to 60 μm, 100 mg bed weight, 1-ml capacity, # 60,108–302) were from Thermo Fisher Scientific (Waltham, MA). Syringe filters (4-mm diameter, 0.2-µm pore size; # 431,212) were from Corning (Corning, NY). Lithium heparin vacutainer tubes (# 367,874) and EDTA vacutainer tubes (# 367,835) were from Becton Dickinson (Franklin Lakes, NJ).
Plasma collection and protein precipitation
All studies involving human subjects were approved by the Institutional Review Board of the Beth Israel Deaconess Medical Center (BIDMC), and written informed consent was obtained prior to blood draws. Mouse experiments were approved by the Institutional Animal Care and Use Committee of BIDMC and performed in accordance with the guidelines of the National Institutes of Health. Heparinized mouse blood was collected from male and female C57BL/6 mice (The Jackson Laboratory, Bar Harbor, ME) aged 25.6 ± 8 weeks by cardiac puncture of animals placed under deep anesthesia. Human blood samples from healthy volunteers were drawn into lithium heparin- or EDTA-containing vacutainer tubes. Unless otherwise mentioned, blood samples were chilled in an ice bath immediately after blood collection and kept there for at least 10 min to halt processes that could alter ATP levels. Aliquots of anticoagulated blood were transferred to prechilled microcentrifuge tubes and centrifuged for 10 min at 400 × g and 0 °C. The cell pellet was discarded, and the supernatant was centrifuged a second time for 5 min at 2,300 × g and 0 °C in order to remove the remaining platelets. The plasma was then collected and mixed 1:20 with PCA at a final concentration of 400 mM to denature nucleotidases and other enzymes that can break down ATP. At this stage, samples were maintained at a temperature of − 20 °C or lower for shipping or long-term storage. For HPLC analysis, samples were thawed on ice, and AMPCP was added at a final concentration of 250 nM to serve as an internal standard. These samples were then centrifuged for 10 min at 16,000 × g and 0 °C to precipitate proteins. The supernatants were transferred into new microcentrifuge tubes, neutralized with K2HPO4 (400 mM final concentration), and centrifuged once more for 10 min at 16,000 × g and 0 °C to remove insoluble precipitates and debris. These steps are summarized in detail in Tables 1 and 2.
Table 1.
Preparation of stable plasma samples that can be stored, shipped, or processed for immediate HPLC analysis
| Step | Take | of | and add | and | to get |
|---|---|---|---|---|---|
| Slow spin | 1,000 μl | Chilled blood | Spin at 400 g and 0 °C for 10 min | Plasma Free of most blood cells | |
| Fast spin | 350 μl | Plasma in new tube | Spin at 2,300 g and 0 °C for 5 min | Final plasma without platelets | |
| PCA precipitation | 300 μl | Final plasma | 15 μl PCA (8 M) | Vortex and chill | Nucleotidases denatured |
| PCA-sample storage | 315 μl | PCA-sample | Keep at 0 °C or at ≤ − 20 °C | Stabilized samples for shipping or long-term storage |
Table 2.
Steps to introduce internal standard and generate fluorescent etheno-derivatives in plasma samples
| Step | Take | of | and add | and | in order to |
|---|---|---|---|---|---|
| Internal standard addition | 315 μl | PCA-sample | 15 µl AMPCP (5 µM) | Thaw on ice | Spike sample with internal standard for HPLC analysis |
| Protein removal | 330 μl | PCA-sample with internal standard | Vortex and spin at 16,000 g and 0 °C for 10 min | Precipitate proteins from samples | |
| Neutralize pH | 200 μl | Supernatant in new tube | 20 μl K2HPO4 (4 M) | Vortex and spin at 16,000 g and 0 °C for 10 min | Neutralize pH and remove additional debris |
| Acidify pH | 150 μl | Plasma |
20 μl Na2HPO4 (250 mM, pH 5) |
Vortex | Acidify samples |
| Etheno-derivatization | 170 μl | Acidified sample | 32 μl chloro-acetaldehyde (1 M) | Vortex and incubate at 72 °C in water bath for 30 min | Generate fluorescent 1,N6-etheno-derivatives of adenylates |
| Termination of reaction | 202 μl | Reaction mixture | Chill on ice | Stop reactions | |
| Neutralization of samples | 202 μl | Reaction mixture | 50 μl NH4HCO3 (0.5 M, pH 8.5) | Vortex for 10 s | Neutralize sample |
Etheno-derivatization
ATP, ADP, AMP, and adenosine were converted to fluorescent 1,N6-etheno-derivatives as previously described [27]. Briefly, 150 μl of each sample was transferred into a fresh Eppendorf centrifuge tube. Then, 20 μl of a 250 mM Na2HPO4 solution (pH 4) and 32 μl of a 1 M chloroacetaldehyde solution were added, mixed, and samples were incubated in a water bath at 72 °C for 30 min to generate etheno-derivatives. Reactions were stopped by cooling the samples in an ice water bath and neutralizing their pH with 50 μl of a 0.5 M NH4HCO3 solution (pH 8.5) (Table 2).
Solid phase extraction
HyperSep™ C18 cartridges (Thermo Scientific) were used for solid-phase extraction (SPE) to clear lipids and other poorly soluble compounds from the samples in order to protect the analytical HPLC column and to improve separation efficiency. The procedure is described in Table 3. These SPE cartridges contain a separation medium similar to the stationary phase of the analytical column used for HPLC analysis. The SPE columns were activated with 200 μl methanol, followed by 100 μl HPLC-grade water and 1 ml HPLC buffer A (pH 6) consisting of 0.1 M KH2PO4 and 4 mM of the ion-pairing agent tetrabutylammonium (TBA) bisulfate. Etheno-derivatized samples were mixed 1:3 with HPLC buffer A, loaded onto the primed SPE columns, and allowed to flow through slowly using a vacuum manifold (Kinesis TELOS Column Sample Processing Manifold, Cole-Parmer, Vernon Hills, IL). Then, the SPE columns were rinsed twice with 100 μl HPLC buffer A, and the flow-through was discarded. The columns were then eluted four times with 100 μl of HPLC buffer B consisting of 30% methanol mixed with 70% HPLC buffer A (v/v). The eluates were collected in fresh microcentrifuge tubes, frozen at -80 °C, and dried using a SpeedVac concentrator (Savant SPD111V; Thermo Fisher Scientific). The dried samples were reconstituted in 10 μl of a 50 mM KOH solution and 30 µl of HPLC buffer A, vortexed vigorously, centrifuged for 3 min at 16,000 × g and 0 °C to remove any remaining debris, and filtered through syringe filters with a 0.2-µm pore size. Typically, 10 μl of the filtered samples were used for HPLC analysis.
Table 3.
Solid phase extraction to purify adenylate compounds and remove lipids that interfere with HPLC analysis
| Step | Take | of | and add | and | to get |
|---|---|---|---|---|---|
| Activate C18 SPE column | 1 | SPE column per sample | 200 μl HPLC-grade methanol | Wash slowly using vacuum or centrifugation | SPE column activated |
| Rinse SPE column | Activated SPE column | 100 μl HPLC-grade water | Wash | SPE column rinsed | |
| Prime SPE column | rinsed C18 SPE column | 1 ml HPLC buffer A containing tetrabutylammonium bisulfate as ion-pairing agent (4 mM) | Rinse slowly | Primed SPE column ready for use | |
| Loading samples | 252 μl | Etheno-derivatized sample | 750 μl HPLC buffer A | Mix and load on SPE column | Adenylates and lipids bound to SPE column |
| Washing adenylate samples | SPE column loaded with sample | Twice 100 μl HPLC buffer A | Wash out slowly | Salts and other contaminants removed | |
| Sample elution | SPE column loaded with sample | Four times 100 μl HPLC buffer B | Elute samples into new Eppendorf tubes | Lipid-free samples with adenylates | |
| Sample concentration | 400 μl | Eluted sample | freeze at -80 °C and dry in SpeedVac concentrator | concentrated sample | |
| Resuspension and debris removal | dried sample | 10 μl KOH (50 mM), 30 μl HPLC buffer A | Vortex vigorously, spin at 16,000 g and 0 °C for 3 min | Resuspended and concentrated clean sample | |
| Filtration | 40 μl | Supernatant | Filter through 0.2-µm syringe filters | Sample ready for HPLC injection |
HPLC analysis
Etheno-derivatized samples were separated using reversed-phase liquid chromatography on an Atlantis dC18 analytical column (3 mm × 150 mm, 3-µm particle size, # 186,001,307; Waters, Milford, MA) and analyzed with an Agilent 1260 Infinity HPLC system (Agilent Technologies, Inc., Santa Clara, CA) that was equipped with a micro vacuum degasser (G1379B), a binary pump (G1312B), a temperature-controlled column compartment (G1316A), and a thermostatted autosampler (G1367C) set to 4 °C. A Waters 474 scanning fluorescence detector set to an excitation and an emission wavelengths of 254 and 410 nm, respectively, was used to detect the etheno-derivatives eluted from the HPLC column. The chromatographic separation was carried out at a constant flow rate of 0.5 ml min−1 and at a column temperature of 40 °C. The column was equilibrated with HPLC buffer A (0.1 M KH2PO4, 4 mM TBA bisulfate, pH 6) for 8 min. Then, sample (10 μl) was injected and eluted for 2 min with 100% buffer A, followed by a linear gradient from 100% buffer A to 100% HPLC buffer B (comprised of 70% HPLC buffer A and 30% methanol, v/v) over 13 min. The column was then washed with 100% HPLC buffer B for 12 min before the mobile phase was switched back to 100% HPLC buffer A within a period of 1 min. The column was re-equilibrated with 100% HPLC buffer A for another 8 min before the next sample was injected. The HPLC conditions are outlined in Table 4. ChemStation software (B.04.03 SP1, Agilent) was used for instrument control and data analysis. A mixture of known concentrations of ATP, ADP, AMP, adenosine, and AMPCP (500 nM each) processed and run before and after each analysis session served as standard. The peak areas of ATP, ADP, AMP, and adenosine were normalized using AMPCP as internal standard, and sample concentrations were calculated based on the known concentrations of the standard mixture.
Table 4.
Conditions used to separate ATP, ADP, AMP, and adenosine with reverse-phase C18 HPLC chromatography
| Run time (min) | Flow rate (ml min−1) | % HPLC buffer A | % HPLC buffer B | Gradient shape | Purpose |
|---|---|---|---|---|---|
| 0 | 0.5 | 100 | 0 | - | Sample injection |
| 2 | 0.5 | 100 | 0 | - | Sample enrichment |
| 15 | 0.5 | 0 | 100 | linear | Gradient |
| 27 | 0.5 | 0 | 100 | - | Sample washout |
| 28 | 0.5 | 100 | 0 | linear | Gradient |
| 35 | 0.5 | 100 | 0 | - | Column reconditioning |
Lipid removal
Removal of plasma lipids from samples improves sensitivity and prolongs lifetime of the analytical column. We compared four commonly used lipid extraction methods with regard to their suitability to remove plasma lipids with minimal distortion of ATP, ADP, AMP, and adenosine concentrations. Besides the widely used chloroform/methanol and methanol extractions methods, we also compared a commercial product, namely, the Phree™ phospholipid removal kit with the SPE method described above. Plasma samples were depleted of protein with PCA and K2HPO4 as described above, and lipids were removed with these methods. Chloroform/methanol extraction was performed according to Folch et al. [35]. Briefly, deproteinized samples were thoroughly mixed with equal volumes of a chloroform/methanol mixture (2:1, v/v), centrifuged at 16,000 × g and 0 °C for 2 min, and the upper, aqueous phase was collected and subjected to two more extractions. For the methanol extraction method, methanol kept at − 80 °C for at least 6 h was added to deproteinized samples at a final methanol concentration of 80% (v/v). The mixtures were vortexed vigorously and kept at − 80 °C for 30 min to allow lipid separation. Then, samples were centrifuged for 10 min at 16,000 × g and 0 °C, and supernatants were collected. The Phree™ phospholipid removal method was carried out as recommended by the manufacturer. Briefly, deproteinized samples (100 µl) were mixed with methanol containing 1% formic acid (400 µl) and allowed to flow slowly through Phree™ devices using vacuum suction. The final products were concentrated by SpeedVac centrifugation and analyzed by HPLC as described above. For lipid analysis, samples were reconstituted in chloroform/methanol (2:1, v/v) at volumes equal to the original plasma volume and analyzed as described below.
Lipid analysis
Lipid extraction efficiencies were compared by examining the amounts of lipids that remained in processed samples using silica gel thin-layer chromatography (TLC) and Nile Red staining [36]. Silica gel TLC plates (TLC Silica gel 60, 5 × 10 cm, MilliporeSigma) were activated for 45 min in an oven at 100 °C. After spotting equal amounts of the samples (2 μl) onto the bottom of the TLC plates, the plates were placed into a solution of chloroform and methanol (2:1, v/v) containing 5% (v/v) glacial acetic acid. TLC plates were dried for 5 min at 100 °C, briefly dipped into a solution of 8 µg/ml Nile red in 80% (v/v) methanol and water, and dried again for 5 min at 100 °C. The plates were then dipped into a bleach solution (1:2,500 in water, v/v) to reduce background signal, and dried for 30 min at 100 °C. Lipids visualized under an ultraviolet light source appeared as intensely red fluorescent bands.
Statistical analyses
Unless otherwise stated, results are reported as mean values ± standard deviation (SD) of independent experiments. Differences between two groups were tested for statistical significance using a two-tailed t-test or the Mann–Whitney test for normally and not normally distributed data, respectively. Multiple group comparisons were done with one-way ANOVA. Differences were considered statistically significant at p < 0.05.
Results
Rapid chilling of blood samples minimizes ATP breakdown and metabolic processes that alter extracellular ATP, ADP, AMP, and adenosine levels
Circulating levels of ATP and its metabolites in blood can indicate pathological conditions such as inflammation and infection [37–40]. However, the reliable quantification of ATP and its breakdown products in blood is complicated because of several reasons. These include the risk of inadvertent release of ATP due to mechanical stress and cell damage during sample handling and plasma preparation. This can lead to grossly overestimated ATP concentrations. The breakdown of extracellular ATP by soluble enzymes and cell-bound ectoenzymes, on the other hand, can lead to underestimated ATP levels. Concentrative and equilibrative nucleoside transporters present on erythrocytes and other blood cells can interfere by removing plasma adenosine during sample preparation. We found that these processes can be extraordinarily rapid and efficient. ATP added to heparinized blood was virtually instantly converted to ADP, AMP, and adenosine (Fig. 1). Only about 10% of the added ATP remained detectable when blood samples were kept at 37 ºC, and virtually, all ATP and most of its breakdown products had disappeared after just 15 min. After 30 min, only a small portion of adenosine remained detectable in the extracellular space. These findings clearly demonstrate that complex and highly efficient mechanisms are in place to regulate extracellular ATP levels in blood, namely by rapid breakdown of ATP and efficient cellular uptake of the generated adenosine. After blood collection, these processes can lead to significant differences between measured and actual in vivo concentrations of ATP and its breakdown products in patients with inflammatory complications or other conditions that elevate systemic ATP levels. Therefore, we decided to optimize the we decided to sample preparation method in order to minimize artifacts that could skew adenylate concentrations in blood samples. We found that immediate chilling of blood samples to 0 °C is a key requirement to preserve extracellular ATP levels. Cooling greatly reduced the loss of ATP in heparinized whole blood samples (Fig. 1). Nevertheless, chilling of samples could not completely prevent the loss of ATP, particularly when samples were left unprocessed for 30 min. This underscores the need for rapid sample processing in addition to cooling in order to minimize the loss of plasma ATP (Fig. 1).
Fig. 1.

Rapid chilling of blood samples prevents ATP breakdown and adenosine uptake. a ATP (10 µM) was added to heparinized blood from a healthy human subject, and the blood was kept at 37 °C. After the indicated times, samples were chilled on ice, and plasma levels of ATP, ADP, AMP, and adenosine (ADO) were analyzed with HPLC. Data are representative of 3 experiments with blood from different healthy donors. b Chilling blood prevents ATP breakdown. ATP (10 µM) was added to heparinized human blood that was immediately chilled and processed for HPLC analysis or kept for 30 min either on ice or at 37 °C before processing. Results show means ± SD from 3 experiments with blood from different healthy donors. c Rapid chilling and processing of heparinized blood samples minimizes ATP breakdown. ATP at the indicated concentrations was added to chilled blood (n = 3 healthy donors) or kept in aqueous solution and analyzed by HPLC. Results show means ± SD
Dual centrifugation of chilled blood samples minimizes mechanically induced ATP release
A streamlined sample handling strategy is needed to allow for rapid plasma preparation even under challenging clinical conditions where access to laboratory equipment is limited (Fig. 2). Immediate cooling of heparinized blood samples is essential but does not require specialized laboratory equipment. Simple remedies like the use of a Styrofoam cup filled with crushed ice and water, for example, can help to rapidly chill blood samples to 0 °C until these samples can be processed in a laboratory. Mechanically induced ATP release is another problem that alters extracellular concentrations of ATP and its metabolites. While pipetting and centrifugation steps are needed to remove blood cells during plasma preparation, these steps cause shear stress and cell damage that can result in inadvertent ATP release [30]. Typical plasma centrifugation protocols (e.g., 2,300 × g for 15 min) generate sufficient mechanical stress that liberates considerable amounts of ATP from blood cells. In order to minimize this problem, we developed a two-step centrifugation procedure (Fig. 2). In a first step using low-speed centrifugation for 10 min at 400 × g, most red blood cells and leukocytes were removed. A second round of centrifugation at 2,300 × g for 5 min was then used to eliminate remaining cells and platelets. All centrifugation and pipetting steps were carried out at 0 °C using a refrigerated microcentrifuge and an ice bath. Following those precautions, the concentrations of ATP and its metabolites remained significantly lower than those obtained after conventional one-step centrifugation (Fig. 3).
Fig. 2.

Streamlined process of plasma preparation preserves in vivo adenylate concentrations. Heparinized blood samples must be immediately chilled and kept on ice until they can be transferred to the research laboratory where blood cells and platelets are removed using a two-step centrifugation procedure. Resulting plasma samples are then treated with perchloric acid (PCA) at a final concentration of 400 mM in order to denature proteins and inactivate enzymes that can alter concentrations of ATP and its breakdown products. Samples stabilized in that manner can be frozen for long-term storage or shipping
Fig. 3.
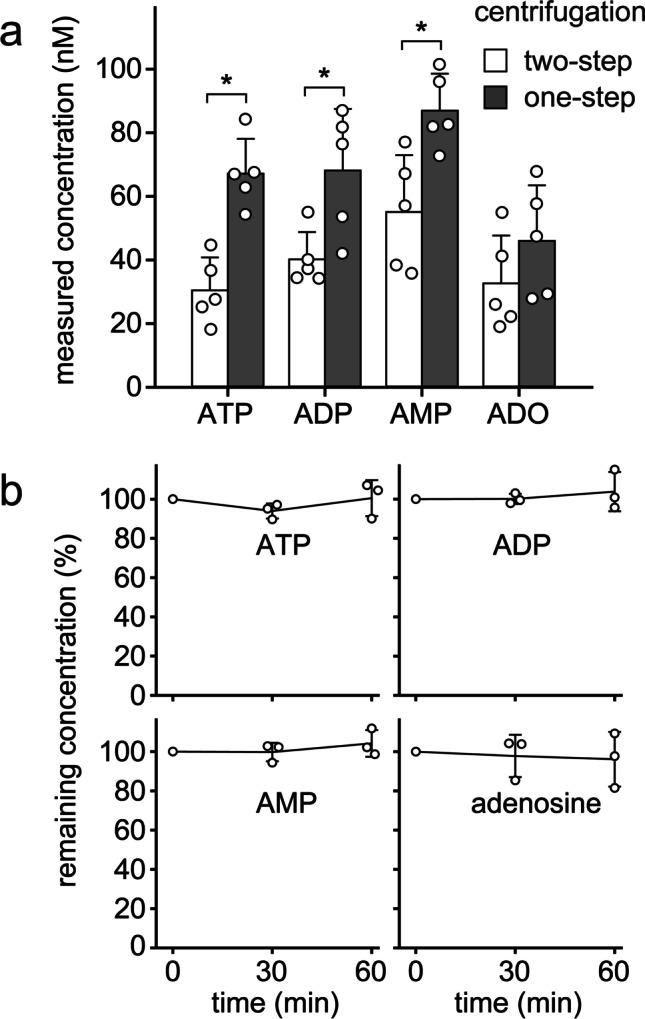
Two-step centrifugation and PCA precipitation preserve in vivo adenylate levels. a Differential centrifugation prevents mechanically induced in vitro ATP release. Chilled heparinized blood samples (0 °C) from healthy human subjects were subjected to a single high-speed (2300 × g for 15 min) or a dual centrifugation procedure consisting of a low-speed (400 × g for 10 min) and a brief high-speed (2300 × g for 5 min) centrifugation step. Then, ATP, ADP, AMP, and adenosine (ADO) concentrations were analyzed by HPLC. Data are expressed as means ± SD of independent experiments with blood from different donors (n = 5); *p < 0.05 (t test). b Stabilizing plasma with perchloric acid (PCA) prevents the breakdown of ATP and its metabolites in vitro. Plasma samples of different healthy human subjects (n = 3) were deproteinized with PCA (400 mM) and spiked with 500 nM ATP. Samples were kept on ice and ATP, ADP, AMP, and adenosine concentrations were determined with HPLC at the indicated times (one-way ANOVA, p > 0.05)
Perchloric acid prevents ATP breakdown
Protein precipitation with perchloric acid (PCA) is an effective way to preserve adenylate concentrations because PCA-treatment denatures ectonucleotidases and thereby prevents the hydrolysis of adenine nucleotides in plasma samples. We tested the stability of ATP in PCA-treated plasma samples and found that ATP added to ice-cold PCA-treated plasma remained largely unchanged for at least one hour (Fig. 3). However, PCA treatment may not always be possible because of various logistical limitations. Therefore, we wondered whether it is feasible to analyze plasma samples that were frozen without prior PCA treatment. We added PCA to such samples retrospectively while they were thawed in preparation for HPLC analysis. Under these conditions, however, nearly half of their ATP content was lost when compared to samples that were pretreated with PCA as described above (Supplemental Fig. 1a). In summary, our findings demonstrate that PCA treatment is a highly effective method to stabilize adenylate levels in plasma samples, but that PCA must be added prior to freezing and long-term storage of samples.
Optimized derivatization conditions to generate fluorescent etheno-adenylates
ATP and breakdown products can be converted to fluorescent etheno-derivatives and analyzed with a highly sensitive and selective HPLC method as previously described [25, 26]. We optimized the workflow for etheno-derivatization of plasma samples based on the method described by Lazarowski et al. [27]. A known amount of the internal standard AMPCP was added to the PCA-stabilized plasma samples prior to protein removal by centrifugation (Fig. 4). Na2HPO4 was added to adjust the pH for optimal yield of the etheno-derivatization reaction. Pilot experiments showed that incubating samples at pH 5–6 and 72 °C for 30 min yielded optimal results (Supplemental Fig. 1b). The reactions were stopped after 30 min by cooling samples on ice and re-adjusting the pH to 7 with 0.5 M NH4HCO3. At this stage, fluorescent adenine derivatives were stable for at least 24 h when kept at 4 °C and protected from light [28].
Fig. 4.

Processing of plasma samples for etheno-derivatization of ATP and metabolites. PCA-treated plasma samples were defrosted in an ice bath and spiked with AMPCP as internal standard (final concentration of 250 nM). After removal of precipitated proteins by centrifugation, the supernatants were neutralized with K2HPO4 (0.4 M). After another centrifugation to remove remaining precipitates, the pH was adjusted to 5, and samples were treated with chloroacetaldehyde (C2H3ClO; 158.4 mM) and incubated for 30 min at 72 °C to generate etheno-derivatives. Samples were neutralized by addition of NH4HCO3 (100 mM)
Removal of lipids and other components that interfere with HPLC analysis
Sample preparation for HPLC analysis requires the removal of plasma components that interfere with chromatographic performance and damage the analytical column. Removal of plasma proteins and lipids greatly improves the separation efficiency and lifetime of costly chromatographic columns. The PCA treatment described above efficiently eliminates proteins from plasma samples. For the removal of lipids from plasma samples, several methods have been reported. These methods include extraction of plasma with a chloroform–methanol mixture as described by Folch et al. [35], extraction with methanol (80%, v/v) [41, 42], and commercial Phree™ phospholipid removal columns. We tested how effective these methods are in removing lipids without shifting the relative distributions of ATP and its breakdown products in plasma samples. In addition, we tested a solid-phase extraction (SPE) method with C18 separation columns that contain a stationary phase similar to the analytical C18 column we used for HPLC analysis. This allowed ion-pairing enrichment of adenylates and the retention of poorly soluble lipids that would otherwise foul the analytical HPLC column (Fig. 5). In order to compare these different methods, equal amounts of PCA-treated and etheno-derivatized plasma samples spiked with internal standard (AMPCP), ATP, ADP, AMP, and adenosine were subjected to the different lipid extraction methods and analyzed by HPLC as described above. Lipid removal with Phree™ columns resulted in a substantial loss of ATP, ADP, AMPCP, and AMP (Supplemental Fig. 1c), which suggests that these devices are not suitable for our purpose. Next, we compared extraction with chloroform/methanol (Folch method), with methanol, or with the C18 SPE columns (Fig. 6). Similar to the Phree™ separation method, methanol extraction resulted in an unacceptable loss of polar adenylate compounds that could not be compensated with the use of the internal standard. Neither the Folch extraction method nor the C18 SPE method caused dramatic shifts in the distribution of ATP, ADP, AMP, AMCPC, and adenosine (Fig. 6). All three methods were highly effective in removing a large portion of plasma lipids (Fig. 6). However, the C18 SPE method was superior in eliminating the poorly soluble lipid compounds that are notorious for their damaging effects on analytical HPLC columns.
Fig. 5.

Solid-phase extraction (SPE) with C18 columns to enrich adenylates and remove lipids. PCA-treated plasma samples processed as described in Fig. 4 to generate etheno-derivatives of ATP, ADP, AMP, and adenosine were concentrated by C18 solid-phase extraction (SPE). Samples mixed with HPLC buffer A containing the ion-pairing reagent tetrabutylammonium bisulfate were applied to the SPE columns. Then, the columns were rinsed twice with HPLC buffer A to eliminate small molecular contaminants. Finally, adenylates were eluted using HPLC buffer B. SPE columns containing poorly soluble lipids were discarded, and the eluents containing compounds of interest were dried using SpeedVac centrifugation. The dried samples were dissolved with KOH and HPLC buffer A. Insoluble material was spun down, discarded, and the supernatants filtered and subjected to HPLC analysis
Fig. 6.

Solid-phase extraction with C18 columns effectively eliminates lipids without skewing levels of ATP and its metabolites. a PCA-treated plasma samples containing equal concentrations of ATP, ADP, AMP, adenosine (ADO), and AMPCP (1 µM, each) were subjected to C18 solid-phase extraction (SPE), chloroform/methanol (2:1 v/v; Folch method), or methanol (MeOH; 80%) extraction, analyzed by HPLC, and recovered adenylate concentrations were compared. Data are expressed as means ± SD of 3 separate experiments. b Equal amounts of plasma, PCA-treated plasma samples, and PCA-treated plasma samples that had been depleted from lipids by C18 SPE, the Folch extraction method, or by extraction with 80% methanol were separated by thin-layer chromatography. Lipids were visualized with Nile red staining. Results are representative of three experiments with similar results
Anticoagulants used for plasma preparation greatly affect adenylate levels
Heparin and EDTA are the anticoagulants most commonly used to prevent clotting of blood during plasma preparation. Therefore, we wondered how the choice of anticoagulants influences the levels of ATP and its metabolites. We found that ATP levels in EDTA plasma were significantly higher than in heparin plasma obtained from the same group of healthy volunteers (Fig. 7). This can be explained by the fact that EDTA chelates Ca2+ and Mg2+ ions that ectonucleotidases like CD39 need for ATP hydrolysis. At the same time, AMP and adenosine concentrations were significantly lower in EDTA plasma. In fact, adenosine was completely absent when EDTA was used as an anticoagulant. Overall, the sum of ATP and its breakdown products was nearly two times higher in EDTA plasma than in heparin plasma. These findings indicate that basal ATP release from blood cells and highly dynamic processes that convert the released ATP regulate extracellular concentrations of ATP, ADP, AMP, and adenosine in human blood. Because EDTA and heparin differ dramatically in how they influence these processes, the choice of the anticoagulant has a critical impact on the relative and absolute concentrations of ATP, ADP, AMP, and adenosine in plasma samples (Fig. 7; Table 5).
Fig. 7.
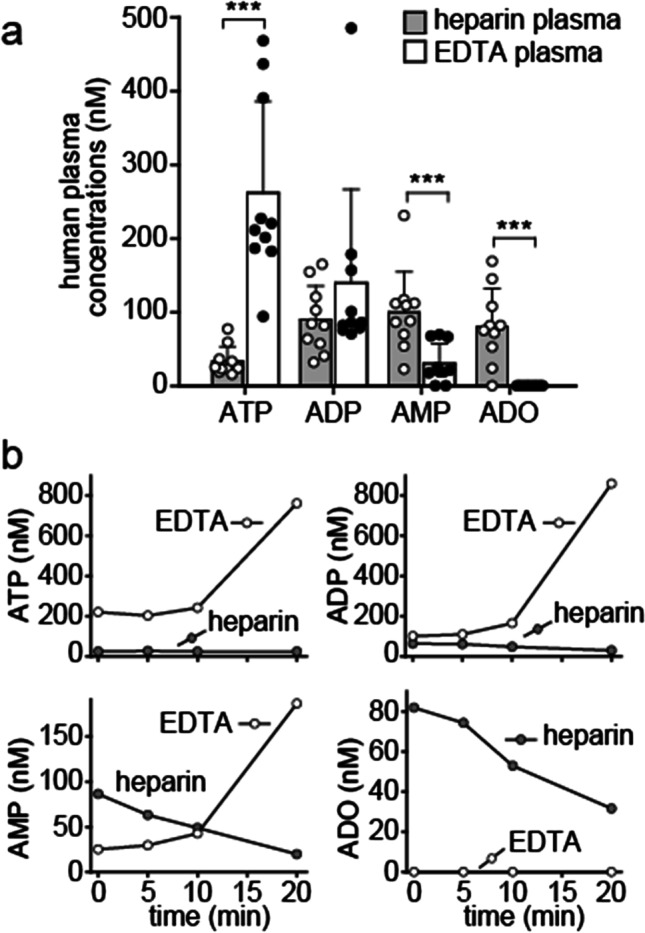
ATP breakdown is attenuated in EDTA-treated blood samples. a Venous blood was drawn into pre-chilled EDTA or lithium heparin vacutainer tubes and ATP, ADP, AMP, and adenosine (ADO) concentrations were determined by HPLC. Data shown are means ± SD of independent experiments with blood from 10 different healthy donors; ***p < 0.001, t test. b Blood cells continue to release and metabolize ATP when samples are not immediately chilled. Blood samples were anticoagulated with EDTA or heparin and kept at room temperature. At the indicated times, plasma samples were processed and ATP, ADP, and AMP, and adenosine concentrations were measured by HPLC. Data show representative results of five experiments
Table 5.
ATP, ADP, AMP, and adenosine (ADO) levels (mean ± SD) in plasma of healthy humans, cardiopulmonary arrest patients (data from reference 37), and healthy C57BL/6 mice
| Plasma samples | n | ATP (nM) | ADP (nM) | AMP (nM) | ADO (nM) |
|---|---|---|---|---|---|
|
Healthy human subjects (heparin plasma) |
10 | 33 ± 20 | 90 ± 45 | 100 ± 55 | 81 ± 51 |
| Cardiopulmonary arrest patients (heparin plasma) | 13 | 200 ± 122 | 378 ± 129 | 157 ± 117 | 100 ± 86 |
|
Healthy human subjects (EDTA plasma) |
10 | 262 ± 124 | 140 ± 127 | 30 ± 27 | 0 ± 0 |
| Healthy mice (heparin plasma) | 20 | 116 ± 82 | 87 ± 37 | 253 ± 336 | 395 ± 250 |
To further explore how these different anticoagulants affect analytical results, we collected blood from the same donor using either heparin or EDTA vacutainer tubes. These samples were then chilled and processed immediately or left at room temperature for different times to simulate delays that could occur in clinical routine settings. Interestingly, the already high ATP concentrations in EDTA plasma samples increased further when blood samples were not immediately chilled (Fig. 7). In fact, extracellular ATP levels increased up to nearly fourfold (mean, 2.7 ± 1.0, n = 5) when EDTA samples were left for 20 min at room temperature. ADP and AMP levels also rose, and adenosine remained undetectable throughout the observation period. In contrast to EDTA, heparin had less pronounced effects on adenylate levels of samples that were not immediately chilled. ATP levels did not change noticeably in 20 min, but the concentrations of ADP, AMP, and adenosine decreased when heparin-treated blood was left at room temperature.
Taken together, these findings show that the choice of anticoagulant must be carefully considered because EDTA in particular can significantly alter the concentrations of ATP and its breakdown products in human plasma samples. In addition, rapid chilling of blood samples is essential to preserve adenylate levels, particularly when EDTA is used to prevent blood clotting.
Scaling down to accommodate small blood sample volumes
We have successfully used our streamlined HPLC method to measure adenylate levels in various clinical studies. For example, in one study, we found that plasma ATP and ADP levels in patients with cardiopulmonary arrest are significantly higher than in healthy controls (Table 5). This study indicated that our HPLC analysis method can provide information that may help predict clinical outcome of these critical care patients [37]. Blood volumes available for HPLC analysis are, however, often limited. Therefore, we tested whether our method can be adapted accordingly, for example for use in preclinical studies with mice, where the available blood volume can often be as little as 100 µl or less. We scaled down the procedures outlined in Tables 1, 2, and 3 and found that our HPLC method was still sensitive enough to allow reliable analysis of ATP, ADP, AMP, and adenosine concentrations even with the limited sample volumes available from mice (Fig. 8). Interestingly, we also found that the concentrations of ATP and adenosine were significantly higher in heparin plasma of healthy mice when compared to healthy humans (Fig. 8; Table 5).
Fig. 8.

The optimized HPLC method is suitable for analysis of adenylate levels in mouse and human blood. Plasma samples from healthy C57BL/6 mice or from healthy human subjects were processed and analyzed by HPLC. a Representative chromatograms of HPLC standard, human plasma, and mouse plasma samples are shown. b Plasma ATP, ADP, AMP, and adenosine (ADO) concentrations differ markedly between human and murine subjects. Heparin blood samples from healthy human subjects (n = 10; age: 42 ± 9 years; data from Fig. 7) or healthy mice (n = 20, age 25.6 ± 8 weeks) were prepared and analyzed using the optimized HPLC assay. Data are shown as means ± SD, *p < 0.001, Mann–Whitney test
Discussion
ATP and its breakdown products have powerful effects on immune function [4, 43, 44]. Therefore, knowing the concentrations of these molecules in blood and other body fluids can help predict their influence on immune responses under normal physiological and pathological conditions. Extracellular ATP, ADP, and adenosine play also important roles in the vascular system itself, where they act as regulators of blood flow, vascular inflammation, and prothrombotic responses [45]. However, the measurement of adenylate concentrations in biological samples is challenging, and conflicting data have been reported for plasma levels in healthy human subjects [31].
We identified key technical hurdles that can affect results when ATP, ADP, AMP, and adenosine levels are analyzed in blood samples, and we developed simple yet effective strategies to address them. An obvious problem is the rapid breakdown of ATP and its metabolites by ubiquitous ectonucleotidases and other enzymes in plasma and on the surfaces of blood cells [46, 47]. Ectonucleoside triphosphate disphosphohydrolase (NTPDase) 1, also known as CD39, is abundantly expressed on many blood cells where it catalyzes the breakdown of ATP and ADP to AMP [45, 47–49]. The subsequent conversion of AMP to adenosine is mediated by ecto-5′-nucleotidase (CD73), which is expressed on the surface of various cell types but can also be found in soluble form in the blood [50]. In cell-free plasma, soluble ectonucleotide pyrophosphatase (ENPP) 1 also contributes to the breakdown of ATP to AMP [51]. In addition to those enzymes, adenylate kinases (AK) such as the AK1 isoform found in soluble form and nucleoside diphosphate kinases (NDPKs) can contribute to the regulation of plasma levels of ATP, ADP, and AMP through phosphotransfer reactions [52]. We found that cooling of blood samples can slow the activities of these enzymes and thereby preserve in vivo concentrations of ATP, ADP, AMP, and adenosine during plasma sample preparation.
Adenosine is one product of ATP breakdown. Adenosine can be rapidly taken up and recycled by erythrocytes [53]. Alternatively, adenosine can also be converted to inosine and hypoxanthine, which are considered markers of hypoxia [54]. Since these adenosine breakdown products cannot form fluorescent etheno-derivatives, they cannot be monitored with the method we describe here. This is a limitation that could be overcome with various modifications of our method such as the use of ultraviolet detectors or mass spectrometers instead of the fluorescence detector we used to quantify ATP and its breakdown products. The type of detector determines the sensitivity and selectivity of the method. However, regardless of the detector used, the sample preparation method ultimately determines how well the measured values reflect the actual in vivo concentrations of ATP and its breakdown products in blood. Cooling samples as soon as they are collected is an essential step that slows metabolic and enzymatic processes that can alter plasma nucleotide levels. In addition, cooling also reduces the risk of inadvertent ATP release in response to mechanical stimulation of blood cells. Mechanical stimuli have been shown to trigger ATP release via signaling mechanisms that involve Piezo1, Pannexin-1, TRPV4, and a number of other stretch-activated channels and release mechanisms [55–58]. Even the relatively minor mechanical forces caused by osmotic changes were shown to trigger cellular ATP release [59–61]. Sample preparation for HPLC analysis is impossible without centrifugation to separate plasma from blood cells. Because conventional centrifugation procedures can lead to marked ATP release, we developed a two-step process that minimizes the mechanical stress and the risk of cell rupture during plasma preparation. A low-speed centrifugation step to sediment leukocytes and red blood cells followed by a second high-speed centrifugation step gently but completely removes blood cells and platelets. Together with cooling, these precautions markedly improved the reliability and reproducibility of our analytical method because they prevent ATP breakdown and the unwanted release of ATP and other products from blood cells.
Cooling also slows other, less well-understood metabolic and enzymatic processes that define ATP levels in human blood. Our results showed that metabolically active blood cells continue to release ATP and that very rapid processes contribute to the scavenging of adenosine in the extracellular environment. This continued ATP release was particularly evident when blood was treated with EDTA as an anticoagulant. Even when we rapidly chilled EDTA-treated blood samples, ATP concentrations continued to rise, and plasma samples obtained from EDTA-treated blood showed ATP levels that were about 10 times higher than those found in plasma prepared from heparin-treated blood. AMP levels, on the other hand, decreased significantly in EDTA-treated blood, and adenosine was completely undetectable. Because EDTA and citrate are anticoagulants that act by chelating Ca2+ and Mg2+ ions, they not only prevent blood clotting but they also block ectonucleotidases that require those ions for their enzymatic activity [53]. Depletion of Ca2+ and Mg2+ therefore slows the breakdown of ATP and ADP. This can explain at least in part why EDTA increased ATP and ADP levels. The fact that adenosine disappeared indicates that adenosine uptake and hydrolysis are facilitated by mechanisms that are independent of Ca2+ and Mg2+. However, further studies are needed to fully define the mechanisms by which these processes regulate plasma levels of ATP and its breakdown products in human blood [45, 62].
A deeper understanding of the mechanisms that maintain the extracellular purinergic signaling environment may reveal novel aspects about the mechanisms that regulate immune cells and the many other physiological processes that are controlled by purinergic receptors (Fig. 9). Targeting components of these purinergic signaling networks, for example, with EDTA or other inhibitors found in so-called stop solutions could be used to modulate physiological functions by altering extracellular adenylate levels. These concepts are supported by the fact that actual in vivo concentrations of ATP and related mediators in human blood increase significantly in response to diseases. For example, we found significantly increased ATP concentrations in patients admitted to the emergency department following cardiopulmonary arrest [37]. Elevated ATP levels in patients may be caused by inflammation, infections, trauma, and tissue damage, as well as by metabolic changes that promote the release of cellular ATP. However, altered enzymatic properties of ENTPDases and other enzymes responsible for ATP hydrolysis may also be responsible for the increased ATP levels in those patients. Acute insults such as oxidative damage of ectoenzymes or the gradual loss of cofactors such Ca2+ and Mg2+ could all reduce the ATP breakdown kinetics and thereby contribute to the elevated circulating ATP levels in pathological settings.
Fig. 9.

ATP release, breakdown, adenosine uptake, and metabolic recycling regulate pericellular ATP levels in human blood. a Model by which pericellular and global ATP influence immune cell function. Extracellular ATP concentrations depend on ATP released from inflamed or damaged tissues and the pericellular ATP release from blood cells via pannexin 1 (panx1). ATP levels are also influenced by dilution in the extracellular space and by ectoenzymes such as CD39 and CD73 that generate ADP, AMP, and adenosine, which is returned for cellular recycling via concentrative (CNT) and equilibrative (ENT) nucleoside transporters (SLC28 and SLC29). Optimized methods for blood sample processing must minimize interference with these processes in order to avoid skewing of actual in vivo adenylate levels. b Local pericellular ATP levels are restricted to subcellular sites that regulate immune cell functions. Human neutrophils labeled with a membrane-bound fluorescence ATP probe [24] reveal local hotspots of ATP in the immediate pericellular environment
Differences in the expression of ectoenzymes are also likely to contribute to the different extracellular ATP levels in healthy subjects, in patients, and among different species. This could explain the differences between the adenylate levels we found in human and mouse plasma samples (Fig. 8; Table 5). It is possible that these differences help adapt and compensate for the differences in purinergic receptor expression levels that have been found in different species.
ATP release from immune cells occurs at subcellular domains where locally released ATP stimulates purinergic receptors that regulate functional cell responses [13, 63]. Such localized purinergic signaling domains are found on the surfaces of neutrophils, T cells, and other immune cells. The pericellular bursts of ATP at such domains promote activation events that orchestrate complex functional immune responses like cell migration, antigen recognition, and phagocytosis [8, 64]. Previous work with membrane-targeting ATP probes has shown that ATP levels in the bulk media are significantly lower than those in these pericellular regions at the cell surface of immune cells (Fig. 9) [8, 22, 65, 66]. EDTA interferes with ectonucleotidases that confine ATP to pericellular site. Therefore, EDTA likely promotes the convection of ATP into more distant extracellular zones. The use of EDTA as an anticoagulant therefore results in the gross overestimation of in vivo plasma ATP levels and in the underestimation of adenosine levels. Because heparin has less profound effects on ATP metabolism, samples prepared with heparin more likely reflect actual in vivo concentrations of ATP and adenosine in circulating blood [37]. However, when used along with our optimized HPLC method, the targeted use of EDTA and other inhibitors in so-called stop solutions may also reveal valuable novel insights into the complex network of mechanisms that control ATP levels in human blood.
Taken together, our findings support the hypothesis that continuous processes of cellular ATP release, ATP breakdown, and reuptake and recycling of adenosine constitute a system that fuels the extracellular and intracellular purinergic mechanisms that sustain cell metabolism and cell function (Fig. 9). Disruptions of these processes must be avoided during plasma sample preparation in order to facilitate accurate analysis of ATP and its breakdown products in human blood. We think that the optimized analytical method described here will help elucidate the complex purinergic signaling mechanisms that regulate a wide range of physiological and pathological processes that affect immune function, vascular tone, and platelet activation.
Supplementary Information
Below is the link to the electronic supplementary material.
Carola Ledderose
is an Instructor at the Department of Surgery at Beth Israel Deaconess Medical Center and Harvard Medical School in Boston. She received her DVM and PhD degrees at the Ludwig Maximilian University of Munich. Her research focuses on the role of purinergic signaling in the regulation of immune cells in inflammation, infection, and sepsis.
Funding
This work was funded in part by grants from the National Institutes of Health, HD-098363, GM-116162, and GM-136429 (to W.G.J.).
Data availability
The datasets generated and analyzed during the current study are available from the corresponding author on reasonable request.
Declarations
Ethical approval
All procedures performed in this study involving human participants were approved by the Institutional Review Board of Beth Israel Deaconess Medical Center (BIDMC). All animal experiments were approved by the Institutional Animal Care and Use Committee of BIDMC and performed according to the guidelines of the National Institutes of Health.
Informed consent
Informed consent was obtained from all individual participants included in the study.
Conflicts of Interest
Carola Ledderose declares that she has no conflict of interest.
Eleftheria-Angeliki Valsami declares that she has no conflict of interest.
Wolfgang G. Junger declares that he has no conflict of interest.
Footnotes
Publisher's Note
Springer Nature remains neutral with regard to jurisdictional claims in published maps and institutional affiliations.
References
- 1.Khakh BS, Burnstock G. The double life of ATP. Sci Am. 2009;301(84–90):92. doi: 10.1038/scientificamerican1209-84. [DOI] [PMC free article] [PubMed] [Google Scholar]
- 2.Burnstock G. Physiology and pathophysiology of purinergic neurotransmission. Physiol Rev. 2007;87:659–797. doi: 10.1152/physrev.00043.2006. [DOI] [PubMed] [Google Scholar]
- 3.Ralevic V, Burnstock G. Receptors for purines and pyrimidines. Pharmacol Rev. 1998;50:413–492. [PubMed] [Google Scholar]
- 4.Antonioli L, Blandizzi C, Pacher P, Haskó G. The purinergic system as a pharmacological target for the treatment of immune-mediated inflammatory diseases. Pharmacol Rev. 2019;71:345–382. doi: 10.1124/pr.117.014878. [DOI] [PMC free article] [PubMed] [Google Scholar]
- 5.Corriden R, Insel PA (2010) Basal release of ATP: an autocrine-paracrine mechanism for cell regulation. Sci Signal 3:re1. 10.1126/scisignal.3104re1 [DOI] [PMC free article] [PubMed]
- 6.Junger WG. Immune cell regulation by autocrine purinergic signaling. Nat Rev Immunol. 2011;11:201–212. doi: 10.1038/nri2938. [DOI] [PMC free article] [PubMed] [Google Scholar]
- 7.Ledderose C, Bao Y, Zhang J, Junger WG. Novel method for real-time monitoring of ATP release reveals multiple phases of autocrine purinergic signalling during immune cell activation. Acta Physiol (Oxf) 2015;213:334–345. doi: 10.1111/apha.12435. [DOI] [PMC free article] [PubMed] [Google Scholar]
- 8.Ledderose C, Liu K, Kondo Y, Slubowski CJ, Dertnig T, Denicoló S, Arbab M, Hubner J, Konrad K, Fakhari M, Lederer JA, Robson SC, Visner GA, Junger WG. Purinergic P2X4 receptors and mitochondrial ATP production regulate T cell migration. J Clin Invest. 2018;128:3583–3594. doi: 10.1172/JCI120972. [DOI] [PMC free article] [PubMed] [Google Scholar]
- 9.Chen Y, Yao Y, Sumi Y, Li A, To UK, Elkhal A, Inoue Y, Woehrle T, Zhang Q, Hauser C, Junger WG (2010) Purinergic signaling: a fundamental mechanism in neutrophil activation. Sci Signal. 3:ra45. 10.1126/scisignal.2000549 [DOI] [PMC free article] [PubMed]
- 10.Schenk U, Westendorf AM, Radaelli E, Casati A, Ferro M, Fumagalli M, Verderio C, Buer J, Scanziani E, Grassi F (2008) Purinergic control of T cell activation by ATP released through pannexin-1 hemichannels. Sci Signal 1:ra6. 10.1126/scisignal.1160583 [DOI] [PubMed]
- 11.Sáez PJ, Vargas P, Shoji KF, Harcha PA, Lennon-Duménil AM, Sáez JC (2017) ATP promotes the fast migration of dendritic cells through the activity of pannexin 1 channels and P2X(7) receptors. Sci Signal. 10:eaah7107. 10.1126/scisignal.aah7107 [DOI] [PubMed]
- 12.Borges da Silva H, Beura LK, Wang H, Hanse EA, Gore R, Scott MC, Walsh DA, Block KE, Fonseca R, Yan Y, Hippen KL, Blazar BR, Masopust D, Kelekar A, Vulchanova L, Hogquist KA, Jameson SC. The purinergic receptor P2RX7 directs metabolic fitness of long-lived memory CD8+ T cells. Nature. 2018;559:264–268. doi: 10.1038/s41586-018-0282-0. [DOI] [PMC free article] [PubMed] [Google Scholar]
- 13.Ledderose C, Bromberger S, Slubowski CJ, Sueyoshi K, Aytan D, Shen Y, Junger WG (2020) The purinergic receptor P2Y11 choreographs the polarization, mitochondrial metabolism, and migration of T lymphocytes. Sci Signal 13:eaba3300. 10.1126/scisignal.aba3300 [DOI] [PMC free article] [PubMed]
- 14.Idzko M, Ferrari D, Eltzschig HK. Nucleotide signalling during inflammation. Nature. 2014;509:310–317. doi: 10.1038/nature13085. [DOI] [PMC free article] [PubMed] [Google Scholar]
- 15.Wang X, Qin W, Xu X, Xiong Y, Zhang Y, Zhang H, Sun B. Endotoxin-induced autocrine ATP signaling inhibits neutrophil chemotaxis through enhancing myosin light chain phosphorylation. Proc Natl Acad Sci USA. 2017;114:4483–4488. doi: 10.1073/pnas.1616752114. [DOI] [PMC free article] [PubMed] [Google Scholar]
- 16.Li X, Kondo Y, Bao Y, Staudenmaier L, Lee A, Zhang J, Ledderose C, Junger WG. Systemic adenosine triphosphate impairs neutrophil chemotaxis and host defense in sepsis. Crit Care Med. 2017;45:e97–e104. doi: 10.1097/CCM.0000000000002052. [DOI] [PMC free article] [PubMed] [Google Scholar]
- 17.Giuliani AL, Sarti AC, Di Virgilio F. Ectonucleotidases in acute and chronic inflammation. Front Pharmacol. 2021;11:619458. doi: 10.3389/fphar.2020.619458. [DOI] [PMC free article] [PubMed] [Google Scholar]
- 18.Vuerich M, Harshe RP, Robson SC, Longhi MS. Dysregulation of adenosinergic signaling in systemic and organ-specific autoimmunity. Int J Mol Sci. 2019;20:528. doi: 10.3390/ijms20030528. [DOI] [PMC free article] [PubMed] [Google Scholar]
- 19.Cauwels A, Rogge E, Vandendriessche B, Shiva S, Brouckaert P. Extracellular ATP drives systemic inflammation, tissue damage and mortality. Cell Death Dis. 2014;5:e1102. doi: 10.1038/cddis.2014.70. [DOI] [PMC free article] [PubMed] [Google Scholar]
- 20.Di Virgilio F, Sarti AC, Falzoni S, De Marchi E, Adinolfi E. Extracellular ATP and P2 purinergic signalling in the tumour microenvironment. Nat Rev Cancer. 2018;18:601–618. doi: 10.1038/s41568-018-0037-0. [DOI] [PubMed] [Google Scholar]
- 21.Morciano G, Sarti AC, Marchi S, Missiroli S, Falzoni S, Raffaghello L, Pistoia V, Giorgi C, Di Virgilio F, Pinton P. Use of luciferase probes to measure ATP in living cells and animals. Nat Protoc. 2017;12:1542–1562. doi: 10.1038/nprot.2017.052. [DOI] [PubMed] [Google Scholar]
- 22.Pellegatti P, Falzoni S, Pinton P, Rizzuto R, Di Virgilio F. A novel recombinant plasma membrane-targeted luciferase reveals a new pathway for ATP secretion. Mol Biol Cell. 2005;16:3659–3665. doi: 10.1091/mbc.e05-03-0222. [DOI] [PMC free article] [PubMed] [Google Scholar]
- 23.Lee DH, Kim SY, Hong JI. A fluorescent pyrophosphate sensor with high selectivity over ATP in water. Angew Chem Int Ed Engl. 2004;43:4777–4780. doi: 10.1002/anie.200453914. [DOI] [PubMed] [Google Scholar]
- 24.Kurishita Y, Kohira T, Ojida A, Hamachi I. Organelle-localizable fluorescent chemosensors for site-specific multicolor imaging of nucleoside polyphosphate dynamics in living cells. J Am Chem Soc. 2012;134:18779–18789. doi: 10.1021/ja308754g. [DOI] [PubMed] [Google Scholar]
- 25.Kochetkov NK, Shibaev VN, Kost AA. New reaction of adenine and cytosine derivatives, potentially useful for nucleic acids modification. Tetrahedron Lett. 1971;12:1993–1996. doi: 10.1016/S0040-4039(01)96762-0. [DOI] [Google Scholar]
- 26.Katayama M, Matsuda Y, Shimokawa K, Tanabe S, Kaneko S, Hara I, Sato H. Simultaneous determination of six adenyl purines in human plasma by high-performance liquid chromatography with fluorescence derivatization. J Chromatogr B, Biomed Sci Appl. 2001;760:159–163. doi: 10.1016/s0378-4347(01)00265-1. [DOI] [PubMed] [Google Scholar]
- 27.Lazarowski ER, Tarran R, Grubb BR, van Heusden CA, Okada S, Boucher RC. Nucleotide release provides a mechanism for airway surface liquid homeostasis. J Biol Chem. 2004;279:36855–36864. doi: 10.1074/jbc.M405367200. [DOI] [PMC free article] [PubMed] [Google Scholar]
- 28.Bhatt DP, Chen X, Geiger JD, Rosenberger TA. A sensitive HPLC-based method to quantify adenine nucleotides in primary astrocyte cell cultures. J Chromatogr B Analyt Technol Biomed Life Sci. 2012;889–890:110–115. doi: 10.1016/j.jchromb.2012.02.005. [DOI] [PMC free article] [PubMed] [Google Scholar]
- 29.Ostrom RS, Gregorian C, Insel PA. Cellular release of and response to ATP as key determinants of the set-point of signal transduction pathways. J Biol Chem. 2000;275:11735–11739. doi: 10.1074/jbc.275.16.11735. [DOI] [PubMed] [Google Scholar]
- 30.Gorman MW, Marble DR, Ogimoto K, Feigl EO. Measurement of adenine nucleotides in plasma. Luminescence. 2003;18:173–181. doi: 10.1002/bio.721. [DOI] [PubMed] [Google Scholar]
- 31.Gorman MW, Feigl EO, Buffington CW. Human plasma ATP concentration. Clin Chem. 2007;53:318–325. doi: 10.1373/clinchem.2006.076364. [DOI] [PubMed] [Google Scholar]
- 32.Kirby BS, Crecelius AR, Voyles WF, Dinenno FA. Impaired skeletal muscle blood flow control with advancing age in humans: attenuated ATP release and local vasodilation during erythrocyte deoxygenation. Circ Res. 2012;111:220–230. doi: 10.1161/CIRCRESAHA.112.269571. [DOI] [PMC free article] [PubMed] [Google Scholar]
- 33.Harkness RA, Coade SB, Webster AD. ATP, ADP and AMP in plasma from peripheral venous blood. Clin Chim Acta. 1984;143:91–98. doi: 10.1016/0009-8981(84)90216-X. [DOI] [PubMed] [Google Scholar]
- 34.Sparks DL, Doelle H, Chatterjee C. Circulating nucleotide levels in health and disease. Receptor Clin Invest. 2014;1:e344. doi: 10.14800/rci.344. [DOI] [Google Scholar]
- 35.Folch J, Lees M, Sloane Stanley GH. A simple method for the isolation and purification of total lipids from animal tissues. J Biol Chem. 1957;226:497–509. doi: 10.1016/S0021-9258(18)64849-5. [DOI] [PubMed] [Google Scholar]
- 36.Fowler SD, Brown WJ, Warfel J, Greenspan P. Use of Nile red for the rapid in situ quantitation of lipids on thin-layer chromatograms. J Lipid Res. 1987;28:1225–1232. doi: 10.1016/S0022-2275(20)38612-0. [DOI] [PubMed] [Google Scholar]
- 37.Sumi Y, Ledderose C, Li L, Inoue Y, Okamoto K, Kondo Y, Sueyoshi K, Junger WG, Tanaka H. Plasma adenylate levels are elevated in cardiopulmonary arrest patients and may predict mortality. Shock. 2019;51:698–705. doi: 10.1097/SHK.0000000000001227. [DOI] [PMC free article] [PubMed] [Google Scholar]
- 38.Dixit A, Cheema H, George J, Iyer S, Dudeja V, Dawra R, Saluja AK. Extracellular release of ATP promotes systemic inflammation during acute pancreatitis. Am J Physiol Gastrointest Liver Physiol. 2019;317:G463–G475. doi: 10.1152/ajpgi.00395.2018. [DOI] [PMC free article] [PubMed] [Google Scholar]
- 39.Ramakers BP, Riksen NP, van den Broek P, Franke B, Peters WH, van der Hoeven JG, Smits P, Pickkers P. Circulating adenosine increases during human experimental endotoxemia but blockade of its receptor does not influence the immune response and subsequent organ injury. Crit Care. 2011;15:R3. doi: 10.1186/cc9400. [DOI] [PMC free article] [PubMed] [Google Scholar]
- 40.Martin C, Leone M, Viviand X, Ayem ML, Guieu R. High adenosine plasma concentration as a prognostic index for outcome in patients with septic shock. Crit Care Med. 2000;28:3198–3202. doi: 10.1097/00003246-200009000-00014. [DOI] [PubMed] [Google Scholar]
- 41.Yuan M, Breitkopf SB, Yang X, Asara JM. A positive/negative ion-switching, targeted mass spectrometry-based metabolomics platform for bodily fluids, cells, and fresh and fixed tissue. Nat Protoc. 2012;7:872–881. doi: 10.1038/nprot.2012.024. [DOI] [PMC free article] [PubMed] [Google Scholar]
- 42.Ser Z, Liu X, Tang NN, Locasale JW. Extraction parameters for metabolomics from cultured cells. Anal Biochem. 2015;475:22–28. doi: 10.1016/j.ab.2015.01.003. [DOI] [PMC free article] [PubMed] [Google Scholar]
- 43.Burnstock G, Boeynaems JM. Purinergic signalling and immune cells. Purinergic Signal. 2014;10:529–564. doi: 10.1007/s11302-014-9427-2. [DOI] [PMC free article] [PubMed] [Google Scholar]
- 44.Cekic C, Linden J. Purinergic regulation of the immune system. Nat Rev Immunol. 2016;16:177–192. doi: 10.1038/nri.2016.4. [DOI] [PubMed] [Google Scholar]
- 45.Yegutkin GG. Adenosine metabolism in the vascular system. Biochem Pharmacol. 2021;187:114373. doi: 10.1016/j.bcp.2020.114373. [DOI] [PubMed] [Google Scholar]
- 46.Deaglio S, Robson SC. Ectonucleotidases as regulators of purinergic signaling in thrombosis, inflammation, and immunity. Adv Pharmacol. 2011;61:301–332. doi: 10.1016/B978-0-12-385526-8.00010-2. [DOI] [PMC free article] [PubMed] [Google Scholar]
- 47.Zimmermann H, Zebisch M, Sträter N. Cellular function and molecular structure of ecto-nucleotidases. Purinergic Signal. 2012;8:437–502. doi: 10.1007/s11302-012-9309-4. [DOI] [PMC free article] [PubMed] [Google Scholar]
- 48.Heptinstall S, Johnson A, Glenn JR, White AE. Adenine nucleotide metabolism in human blood–important roles for leukocytes and erythrocytes. J Thromb Haemost. 2005;3:2331–2339. doi: 10.1111/j.1538-7836.2005.01489.x. [DOI] [PubMed] [Google Scholar]
- 49.Robson SC, Sévigny J, Zimmermann H. The E-NTPDase family of ectonucleotidases: structure function relationships and pathophysiological significance. Purinergic Signal. 2006;2:409–430. doi: 10.1007/s11302-006-9003-5. [DOI] [PMC free article] [PubMed] [Google Scholar]
- 50.Yegutkin GG, Samburski SS, Jalkanen S. Soluble purine-converting enzymes circulate in human blood and regulate extracellular ATP level via counteracting pyrophosphatase and phosphotransfer reactions. FASEB J. 2003;17:1328–1330. doi: 10.1096/fj.02-1136fje. [DOI] [PubMed] [Google Scholar]
- 51.Goding JW, Grobben B, Slegers H. Physiological and pathophysiological functions of the ecto-nucleotide pyrophosphatase/phosphodiesterase family. Biochim Biophys Acta. 2003;1638:1–19. doi: 10.1016/s0925-4439(03)00058-9. [DOI] [PubMed] [Google Scholar]
- 52.Yegutkin GG, Wieringa B, Robson SC, Jalkanen S. Metabolism of circulating ADP in the bloodstream is mediated via integrated actions of soluble adenylate kinase-1 and NTPDase1/CD39 activities. FASEB J. 2012;26:3875–3883. doi: 10.1096/fj.12-205658. [DOI] [PMC free article] [PubMed] [Google Scholar]
- 53.Möser GH, Schrader J, Deussen A. Turnover of adenosine in plasma of human and dog blood. Am J Physiol. 1989;256:C799–806. doi: 10.1152/ajpcell.1989.256.4.C799. [DOI] [PubMed] [Google Scholar]
- 54.Saugstad OD. Hypoxanthine as an indicator of tissue hypoxia. A study of plasma, cerebro-spinal and brain tissue concentrations. J Oslo City Hosp. 1977;27:29–40. [PubMed] [Google Scholar]
- 55.Dahl G. The Pannexin1 membrane channel: distinct conformations and functions. FEBS Lett. 2018;592:3201–3209. doi: 10.1002/1873-3468.13115. [DOI] [PubMed] [Google Scholar]
- 56.Cinar E, Zhou S, DeCourcey J, Wang Y, Waugh RE, Wan J. Piezo1 regulates mechanotransductive release of ATP from human RBCs. Proc Natl Acad Sci U S A. 2015;112:11783–11788. doi: 10.1073/pnas.1507309112. [DOI] [PMC free article] [PubMed] [Google Scholar]
- 57.Wan J, Ristenpart WD, Stone HA. Dynamics of shear-induced ATP release from red blood cells. Proc Natl Acad Sci U S A. 2008;105:16432–16437. doi: 10.1073/pnas.0805779105. [DOI] [PMC free article] [PubMed] [Google Scholar]
- 58.Yamamoto K, Imamura H, Ando J. Shear stress augments mitochondrial ATP generation that triggers ATP release and Ca2+ signaling in vascular endothelial cells. Am J Physiol Heart Circ Physiol. 2018;315:H1477–H1485. doi: 10.1152/ajpheart.00204.2018. [DOI] [PMC free article] [PubMed] [Google Scholar]
- 59.Sprague RS, Ellsworth ML, Stephenson AH, Kleinhenz ME, Lonigro AJ. Deformation-induced ATP release from red blood cells requires CFTR activity. Am J Physiol. 1998;275:H1726–H1732. doi: 10.1152/ajpheart.1998.275.5.H1726. [DOI] [PubMed] [Google Scholar]
- 60.Loomis WH, Namiki S, Ostrom RS, Insel PA, Junger WG. Hypertonic stress increases T cell interleukin-2 expression through a mechanism that involves ATP release, P2 receptor, and p38 MAPK activation. J Biol Chem. 2003;278:4590–4596. doi: 10.1074/jbc.M207868200. [DOI] [PubMed] [Google Scholar]
- 61.Murana E, Pagani F, Basilico B, Sundukova M, Batti L, Di Angelantonio S, Cortese B, Grimaldi A, Francioso A, Heppenstall P, Bregestovski P, Limatola C, Ragozzino D. ATP release during cell swelling activates a Ca2+-dependent Cl- current by autocrine mechanism in mouse hippocampal microglia. Sci Rep. 2017;7:4184. doi: 10.1038/s41598-017-04452-8. [DOI] [PMC free article] [PubMed] [Google Scholar]
- 62.Zimmermann H. History of ectonucleotidases and their role in purinergic signaling. Biochem Pharmacol. 2021;187:114322. doi: 10.1016/j.bcp.2020.114322. [DOI] [PubMed] [Google Scholar]
- 63.Bao Y, Chen Y, Ledderose C, Li L, Junger WG. Pannexin 1 channels link chemoattractant receptor signaling to local excitation and global inhibition responses at the front and back of polarized neutrophils. J Biol Chem. 2013;288:22650–22657. doi: 10.1074/jbc.M113.476283. [DOI] [PMC free article] [PubMed] [Google Scholar]
- 64.Bao Y, Ledderose C, Graf AF, Brix B, Birsak T, Lee A, Zhang J, Junger WG. mTOR and differential activation of mitochondria orchestrate neutrophil chemotaxis. J Cell Biol. 2015;210:1153–1164. doi: 10.1083/jcb.201503066. [DOI] [PMC free article] [PubMed] [Google Scholar]
- 65.Yegutkin GG, Mikhailov A, Samburski SS, Jalkanen S. The detection of micromolar pericellular ATP pool on lymphocyte surface by using lymphoid ecto-adenylate kinase as intrinsic ATP sensor. Mol Biol Cell. 2006;17:3378–3385. doi: 10.1091/mbc.e05-10-0993. [DOI] [PMC free article] [PubMed] [Google Scholar]
- 66.Conley JM, Radhakrishnan S, Valentino SA, Tantama M. Imaging extracellular ATP with a genetically-encoded, ratiometric fluorescent sensor. PLoS ONE. 2017;12:e0187481. doi: 10.1371/journal.pone.0187481. [DOI] [PMC free article] [PubMed] [Google Scholar]
Associated Data
This section collects any data citations, data availability statements, or supplementary materials included in this article.
Supplementary Materials
Data Availability Statement
The datasets generated and analyzed during the current study are available from the corresponding author on reasonable request.