

Abstract
Metastatic and castration-resistant disease is a fatal manifestation of prostate cancer (PCa). The mechanism through which resistance to androgen deprivation in PCa is developed remains largely unknown. Our understanding of the tumor microenvironment (TME) and key signaling pathways between tumors and their TME is currently changing in light of the generation of new knowledge with regard to cancer progression. A disintegrin and metalloproteinase domain-containing protein 9 (ADAM9) is a membranous bridge forming cell-cell and cell-matrix connections that regulate tumor aggressiveness and metastasis. However, it is not known whether ADAM9 expressed in the TME contributes to the CRPC phenotype. In this study, we aimed to investigate the expression patterns of ADAM9 in prostate cancer-associated fibroblasts (CAFs). We also intended to elucidate the effects of both stromal cell- and cancer cell-derived ADAM9 on the progression of CRPC and the implicated molecular pathways. By using both clinical specimens and cell lines, we herein showed that unlike the membrane anchored ADAM9 overexpressed by both PCa cells and prostate CAFs, the secreted isoform of ADAM9 (sADAM9) was strongly detected in CAFs, but rarely in tumor cells, and that could be a serum marker for PCa patients. We demonstrated that functionally sADAM9 are characterized as chemoattractant for the directed movement of androgen-independent PCa cells through integrin downstream FAK/AKT pathway, supporting that elevated sADAM9 by prostate CAFs could be responsible for the promotion of CRPC metastasis. Moreover, by stimulating PCa cells with sADAM9, we found that ubinuclein-2 (UBN2) expression was increased. A positive correlation of ADAM9 and UBN2 expression was observed in androgen receptor-expressing PCa cell lines and further confirmed in clinical PCa specimens. Using a genetic modification approach, we identified UBN2 as a downstream target gene of ADAM9 that is critical for the survival of androgen-dependent PCa cells in response to androgen deprivation, through the induction and effect of the aldo-keto reductase family 1 member C3 (AKR1C3). Collectively, our results reveal a novel action of ADAM9 on the transition of androgen-dependent PCa cells into an androgen-independent manner through the UBN2/AKR1C3 axis; the aforementioned action could contribute to the clinically-observed acquired androgen-deprivation therapy resistance.
Keywords: Prostate cancer, castration resistant prostate cancer (CRPC), tumor microenvironment, cancer-associated fibroblasts (CAFs), ADAM9, soluble ADAM9, ubinuclein-2 (UBN2), aldo-keto reductase family 1 member C3 (AKR1C3), androgen-deprivation therapy (ADT)
Introduction
Prostate cancer (PCa) is the second most commonly diagnosed cancer and the fourth leading cause of cancer-related deaths globally among men [1]. The initiation and progression of PCa are critically depend upon the androgen receptor (AR) signaling. As a result, the androgen-deprivation therapy (ADT) is the main treatment strategy for advanced PCa, by reducing circulating androgens to castration levels [2]. However, most hormone-sensitive PCa cases eventually develop resistance to ADT, and become castration-resistant PCa (CRPC); the latter takes place mostly within the 1st year of ADT in men with metastatic PCa [3]. The bones are the most common metastatic site in men with CRPC [4]. An epidemiological analysis of PCa has indicated that there is a 99% 5-year survival rate in cases characterized by local cancer development with no metastasis. However, the 5-year survival rate becomes <30% when PCa patients develop bone metastases [5]. Gaining a comprehensive understanding of the mechanism of tumor progression to the metastatic and CRPC stage is a necessary step toward the designing of effective therapeutic and reliable prognostic schemes.
Tumor-stroma interactions play a major role in both the primary tumor growth and the establishment of cancer metastasis [6]. With these dynamic interactions, tumor cells drive changes in their microenvironment by modifying both the cellular and the extracellular matrix (ECM) components, thereby providing a paracrine signaling-mediated favorable environment for tumor progression [7]. A tumor cell-induced switch of normal fibroblasts into cancer-associated fibroblasts (CAFs), that are the main cellular components of the tumor microenvironment (TME), contributes to cancer-associated ECM remodeling; the latter is known to foster the establishment of tumor metastasis [8,9]. During the process of ECM remodeling, both CAFs and tumor cells express increased levels of ECM-degrading proteases, including members of the matrix metalloproteinase (MMP) and a disintegrin and metalloproteinase (ADAM) families; these proteins cleave ECM macromolecules and release and activate matrix-bound growth factors, thus enabling tumor cell invasion and metastasis [10,11]. As such, ECM-degrading proteases have emerged as novel biomarkers and potential therapeutic targets for detecting and treating human cancers.
ADAM gene products are transmembrane cell surface proteins consisting of eight conserved domains, including a signal peptide, a prodomain, a metalloprotease domain, a disintegrin- or integrin-binding domain, a cysteine-rich region, an epidermal growth factor (EGF)-like domain, a transmembrane sequence, and a cytoplasmic tail [12]. The metalloprotease domains appear to serve two generic functions: (a) as ectodomain sheddases that release transmembrane-anchored cell surface proteins, and (b) as proteases that cleave and remodel ECM proteins. Their disintegrin- and cysteine-rich domains have adhesive activities that interact with integrins, heparan sulfate proteoglycans, and ECM components [13]. Our current understanding of cell-cell and cell-matrix interactions suggests a role for ADAMs in mediating tumor progression. In PCa, ADAM9 is a well-recognized ADAM protein whose levels can be found elevated in malignant (compared to benign) prostate tissues, and that is significantly associated with shorter disease-free relapse [14,15]. In addition to membrane-anchored ADAM9, a secreted variant of ADAM9 (sADAM9) generated through alternative splicing of ADAM9 transcripts was found to be expressed by activated liver stromal cells, and to be able to facilitate hepatic colon cancer metastasis [16]. However, it is not known whether sADAM9 is expressed by CAFs in the stroma of PCa tissues, and if so, whether it could contribute to the induction of aggressive tumor phenotypes through tumor-stromal interactions.
We have previously demonstrated that ADAM9 levels increase during PCa progression, and we have identified reactive oxygen species (ROS) as key mediators regulating ADAM9 expression in PCa cells [14,17]. We herein aimed to further investigate the expression patterns of ADAM9 variants in CAFs in the prostate TME. We also intended to elucidate the effects of both stromal cell- and cancer cell-derived ADAM9 on the aggressiveness of PCa cells, as well as to identify the implicated molecular pathways. In this study, we demonstrate that the elevated expression of sADAM9 by prostate CAFs is stimulated by ROS and is able to induce directional migration of PCa cells as a chemoattractant through the integrin receptor signaling. In addition to the pro-migratory effect of ADAM9, we report for the first time that ubinuclein-2 (UBN2), a member of a histone chaperone complex, is upregulated by ADAM9 in both the paracrine and autocrine mode by which androgen-dependent PCa cells gain a survival advantage to overcome androgen-deprivation; the latter is enabled through the downstream effect of aldo-keto reductase family 1 member C3 (AKR1C3). Our results identify an ADAM9/UBN2/AKR1C3 axis, and provide a novel mechanism through which PCa tumor progression to CRPC is facilitated.
Materials and methods
Cell lines and cell culture
Human prostate cancer cell lines including LNCaP (ATCC CRL-1740), C4-2 (ATCC CRL-3314), C4-2B (ATCC CRL-3315), 22Rv1 (ATCC CRL-2505), PC3 (ATCC CRL-1435), and DU145 (ATCC HTB-81) were originally obtained from American Type Culture Collection (Manassas, Va., USA), and have been frequently used in our studies [17-20]. The benign prostatic hyperplasia (BPH) epithelial cell line (BPH-1) was a kind gift from Dr. Sue-Hwa Lin at the University of Texas MD Anderson Cancer Center (Houston, TX, USA). The previously established pairs of patient-derived normal and cancer-associated prostate fibroblasts [21] were a gift from Dr. Leland W.K. Chung (Emory Winship Cancer Institute, Atlanta, GA, USA). All these cell lines were cultured in RPMI 1640 medium (Hyclone, Logan, UT, USA) supplemented with 10% fetal bovine serum (FBS) (VWR Life Science, Radnor, PA, USA), and 1% penicillin-streptomycin (Hyclone). To withdraw androgen, LNCaP cells were cultured in charcoal-stripped bovine serum (CSS) medium, comprising of phenol red-free RPMI 1640 medium (Hyclone) supplemented with 5% CSS (Sigma-Aldrich, St. Louis, MO, USA). The HEK 293FT cell line that was used for producing recombinant lentiviruses and sADAM9 was purchased from Invitrogen (Carlsbad, CA, USA), and was grown in Dulbecco’s modified Eagle medium (Hyclone).
Reagents and chemicals
Recombinant human ADAM9 protein (Cat# 939-AD-020) and human ADAM9 DuoSet ELISA (Cat# DY939) were obtained from R&D Systems (Minneapolis, MN, USA); doxycycline hyclate (Cat# D9891), R1881 (Cat# R0908) and enzalutamide (MDV3100; Cat# M199800) were purchased from Sigma-Aldrich.
Gene knockdown (KD) and overexpression
To generate stable gene KD cell lines, a short hairpin (sh)RNA lentiviral expression system was used. The lentiviral vector pLKO.1-puro carrying shRNA sequences, including shADAM9 (clone C01, TRCN0000046980, target sequence, GCCAGAATAACAAAGCCTATT; clone E01, TRCN0000046982, target sequence: CCCAGAGAAGTTCCTATATAT), shAKR1C3 (clone 1, TRCN0000278349, target sequence: CCTAGACAGAAATCTCCACTA; clone 2, TRCN0000278400, target sequence: CCAGAGGTTCCGAGAAGTAAA) and control shGFP (TRCN0000072178, target sequence: CAACAGCCACAACGTCTATAT), were obtained from the National RNAi Core Facility (Institute of Molecular Biology, Academia Sinica, Taipei, Taiwan). Lentiviral production and infection were performed as previously described [22]. Doxycycline-inducible LNCaP cells expressing shUBN2 (clone 1, target sequence: CCACTACCTCCAGTAACTATT; clone 2, target sequence: ATGACAGAGTTACCGTATTAA) were generated through the service of CRISPR Gene Targeting Core Lab of Taipei Medical University (Taipei, Taiwan). For AR KD, a small interfering (si)RNA set targeting AR (GCUGACAGUGUCACACAUUTT; AAUGUGUGACACUGUCAGCTT) was purchased from TOOLS Biotech (New Taipei City, Taiwan) and transfected into PC3 cells using the HiPerfect reagent (Qiagen, Hilden, Germany) according to the manufacturer’s instructions. For gene overexpression, pCMV6-Entry vectors containing the cDNA of UBN2 (NM_173569) and AKR1C3 (NM_003739) were obtained from OriGene (Rockville, MD, USA), and an ADAM9 transcript variant 2 (sADAM9; NM_001005845.1)-expression construct was synthesized by GenScript (New Jersey, USA). Plasmids were stably transfected into the indicated cells using the Maestrofectin reagent (Omics Bio, Taipei, Taiwan) following G418 selection. The pEGFP-N1 plasmid was used as negative control.
Cell growth assay
The short-termed cell growth test was undertaken by using the WST-1 (Roche, Mannheim, Germany) cell proliferation assay according to the manufacturer’s instructions. Cells were seeded into 96-well plates with 100 µL of growth medium per well. Cells were incubated with the WST-1 reagent for 90 min prior to absorbance measurements at 440 nm and 650 nm (as a reference) with a CLARIOstar microplate reader (BMG Labtech, Ortenberg, Germany). For measuring androgen-depleted cell growth, cells were grown in CSS medium for 7-10 days followed by crystal violet staining as described previously [19].
Cell migration assay
For the transwell migration assay, PC3 and LNCaP cells were seeded into transwell inserts (Millipore) in serum-free medium, and 0.5% FBS-containing medium with or without additional rADAM9 or conditioned medium collected from 293FT cells transfected with sADAM9 plasmid was placed in the bottom chamber as a chemoattractant. After incubation for 6 h (for PC3) or 24 h (for LNCaP), inserts were removed and the cells were fixed and subsequently stained with 0.5% crystal violet. Ten random fields of each insert were photographed at 20× magnification and quantified by cell counting. For real-time chemotaxis measurement, an µ-slide chemotaxis system (ibidi GmbH, Martinsried, Germany) was used following the manufacturer’s instruction. Briefly, PC3 cells (1.5×10⁶/ml) were seeded into the observation area of the µ-slide chamber with or without collagen I (2.5 μg/cm2) coating. After cell attachment, serum-free medium containing 0 or 5 µg/ml rADAM9 was added in one reservoir and pure serum-free medium in the other. A phase-contrast video of cell migration at ×10 magnification was recorded every 10 min for a period of 8 h using a JuLI Smart fluorescent cell analyzer (Digital Bio Technology, Boston, USA), and the data were imported into the Chemotaxis plugin for ImageJ software (version 2.3.0/1.53f) for analysis.
Western blot (WB) analysis
Proteins were extracted from cells with RIPA lysis buffer and quantified using a BCA protein assay kit (ThermoFisher Scientific). Conditioned media harvested from serum-free cultures was concentrated using Vivaspin ultracentrifugation devices with a 3 kDa cutoff (Sartorius AG, Germany). WB analyses were performed as previously described [22] with the primary antibodies listed in Table 1. After incubation with an HRP-conjugated secondary antibody (1:5000; Cell Signaling Technologies), the target proteins were detected with chemiluminescent detection kit (T-Pro Biotechnology, New Taipei, Taiwan), and signals were visualized using an Amersham Imager 600 (GE Healthcare Life). To normalize the secreted protein among conditioned media samples, the loading amount was adjusted to represent the same quantity of cell numbers (105 cells), and ponceau S stain of the nitrocellulose membranes was used to confirm equal levels of protein input.
Table 1.
List of antibodies used in the study
| Antibody | Source | CAT# |
|---|---|---|
| Anti-Active integrin β1 | Merck, Darmstadt, Germany | MAB2079Z |
| Anti-ADAM9 (for IHC) | Merck, Darmstadt, Germany | HPA004000 |
| Anti-ADAM9 (for WB) | R&D systems, Minneapolis, MN, USA | AF939 |
| Anti-AKR1C3 | Merck, Darmstadt, Germany | A6229 |
| Anti-AKT | Cell signaling technology, Danvers, MA, USA | 9272 |
| Anti-AR (N-20) | Santa Cruz Biotechnology, Dallas, TX, USA | SC-816 |
| Anti-EF1α Antibody, clone CBP-KK1 | Merck, Darmstadt, Germany | 05-235 |
| Anti-FAK | Cell signaling technology, Danvers, MA, USA | 3284 |
| Anti-Integrin β1 | Merck, Darmstadt, Germany | MABT529 |
| Anti-pAKT (Ser473) | Cell signaling technology, Danvers, MA, USA | 9271 |
| Anti-pFAK (Ser 397) and pFAK (Ser 576/577) | Cell signaling technology, Danvers, MA, USA | 3283 and 3281 |
| Anti-PSA | Santa Cruz Biotechnology, TX, USA | SC-7636 |
| Anti-UBN2 (for IHC) | Merck, Darmstadt, Germany | HPA019743 |
| Anti-UBN2 (WB) | ProSci, Fort Collins, CO, USA | 57-094 |
| Anti-β-actin | GeneTex, Irvine, CA, USA | GTX109639 |
| Donkey Anti-Goat IgG (H+L) | Jackson Immuno Research, West Grove, PA, USA | 705-215-147 |
| Donkey Anti-mouse IgG (H+L) | Jackson Immuno Research, West Grove, PA, USA | 715-195-150 |
| Donkey Anti-rabbit IgG (H+L) | Jackson Immuno Research, West Grove, PA, USA | 711-005-152 |
RNA extraction and real-time quantitative polymerase chain reaction (qPCR)
Total cellular RNAs were isolated with a NC RNA extraction reagent from EBL Biotechnology (New Taipei City, Taiwan). The extracted RNAs were reverse transcribed into cDNA by using a PrimeScript RT reagent kit (Takara Bio, Shiga, Japan). Real-time qPCR was performed using a TaqMan system with gene-specific primer-probe sets (Table 2) in a LightCycler 96 (Roche), as described in our previous study [22].
Table 2.
The sequence of primers used for qPCR
| Gene name | Sequence | Probe | |
|---|---|---|---|
| ADAM9 | Forward | TCC CCC AAA TTG TGA GAC TAA | 69 |
| Reverse | TCC GTC CCT CAA TGC AGT AT | ||
| UBN2 | Forward | ACC CTC GAA AAT CCT GAA CA | 25 |
| Reverse | TCC ACT GAT TGA GGG AAG TTG | ||
| AKR1C3 | Forward | CCA CAG ACC ATA TAA GAC TGC CTA | 63 |
| Reverse | CCT GCA AAC TGA ATG ATG GTT | ||
| HSPCB | Forward | AGC CTA CGT TGC TCA CTA TTA CG | 55 |
| Reverse | GAA AGG CAA AAG TCT CCA CCT | ||
Tissue microarray (TMA) and immunohistochemistry (IHC)
Paraffin-embedded tissue blocks were collected from prostatectomy of PCa patients who were diagnosed and treated at Shuang-Ho Hospital (New Taipei City, Taiwan) and gave informed consent to provide prostate tissue and data for research purposes. The use of human specimens was approved by the Institutional Review Board of Taipei Medical University (TMU-JIRB N201612052). After screening the hematoxylin- and eosin-stained slides for optimal tumor tissues, TMA slides were constructed through the services of Catching Micro-Tech (Taipei, Taiwan). IHC staining was performed using the Novolink Polymer Detection System (Leica Biosystems, Richmond, IL, USA) according to the manufacturer’s instructions. Digital images of stained slides were acquired with the use of a MoticEasyScan slide scanner (Motic, Hong Kong, China). The intensity of IHC staining was semi-quantified using IHC toolbox plugin in FIJI/imageJ software.
RNA-sequence (RNA-Seq) analysis
Total RNA was extracted from cells, and RNA quality and quantity were assessed using a bioanalyzer and Qubit. Ribosomal (r)RNAs were removed by a NEBNext rRNA depletion kit (NEBiolabs, Ipswich, MA, USA), and the remaining RNA was then ligated to an adaptor using an Illumina TruSeq Stranded mRNA Kit (San Diego, CA, USA) for further amplification. All library preparation was performed in the Translational Core Facility of Taipei Medical University. After sequencing was completed, the reads files (fastq) were mapped to the Hg19 reference using STAR (v2.6.1). Gene expression levels were assessed using RSEM (v1.3.1); the latter calculated the count for each gene. Differential expression genes (DEGs) were identified using the R (v3.6.1) and the Bioconductor package DESeq2 (v1.26.0) software. DEGs were then loaded into the Ingenuity Pathway Analysis (IPA, QIAGEN) in order to decipher gene ontologies and significant regulatory pathways.
Data availability
RNA-Seq dataset GSE8702 [23] and GSE21887 [24] were retrieved from the Gene Expression Omnibus. The mRNA expression profiles and clinical information from WCM 2016 [25], PRAD_TCGA [26], PRAD_MSKCC [27], and PRAD_SU2C_2019 [28] were downloaded from cBioportal (https://www.cbioportal.org/).
Statistical analysis
Data analyses were performed using the Prism 8.4.0 software (GraphPad, San Diego, CA, USA). The performed statistical tests including t-test, analysis of variance test, and Pearson correlation are indicated in the figure legends. All data are reported as the mean ± standard deviation (SD) or standard error of the mean (SEM). Differences with a two-tailed P value of ≤0.05 were considered to be statistically significant.
Results
Soluble ADAM9 (sADAM9) is elevated in PCa-associated stromal cells, and it is a serum marker for PCa
Our previous studies have demonstrated that ADAM9 is overexpressed in malignant PCa [14,18]. To further validate ADAM9 as a predictive biomarker of cancer progression in clinical specimens, we conducted a retrospective study by collecting paired benign and cancer tissues from six M0 (no metastasis after prostatectomy) and six M1 (metastasis after prostatectomy) stage PCa patients and submitting them to a tissue array. Immunohistochemical (IHC) staining of ADAM9 demonstrated an increased overall intensity of ADAM9 expression in M1 (as compared to M0) PCa tissues (Figure 1A). Notably, elevated ADAM9 expression was observed not only in cancerous epithelial cells, but also in the tumor stromal region when compared to the respective benign stromal region of the same patient (Figure 1B). Consistent with IHC results, an RT-qPCR analysis also revealed an increased expression of ADAM9 in three out of four cases of laser-captured microdissected PCa-associated fibroblasts (PCFs), compared to corresponding normal fibroblasts (PNFs) collected from the same PCa tissue (Figure 1C). Interestingly, a WB analysis of ADAM9 in two paired primary cell lines of prostate stromal fibroblasts established in a previous study [19], indicated no significant changes in cell lysate fraction between PCFs and PNFs. However, we were able to detect an increase in the expression of an ADAM9 of a smaller molecular weight (~50-kDa) in conditioned medium (CM) collected from cultured PCFs but not PNFs: this was the none other than the secreted variant of ADAM9. Strictly speaking, most PCa cell lines showed no detectable ADAM9 in the CM with the exception of DU145 cells (Figure 1D).
Figure 1.
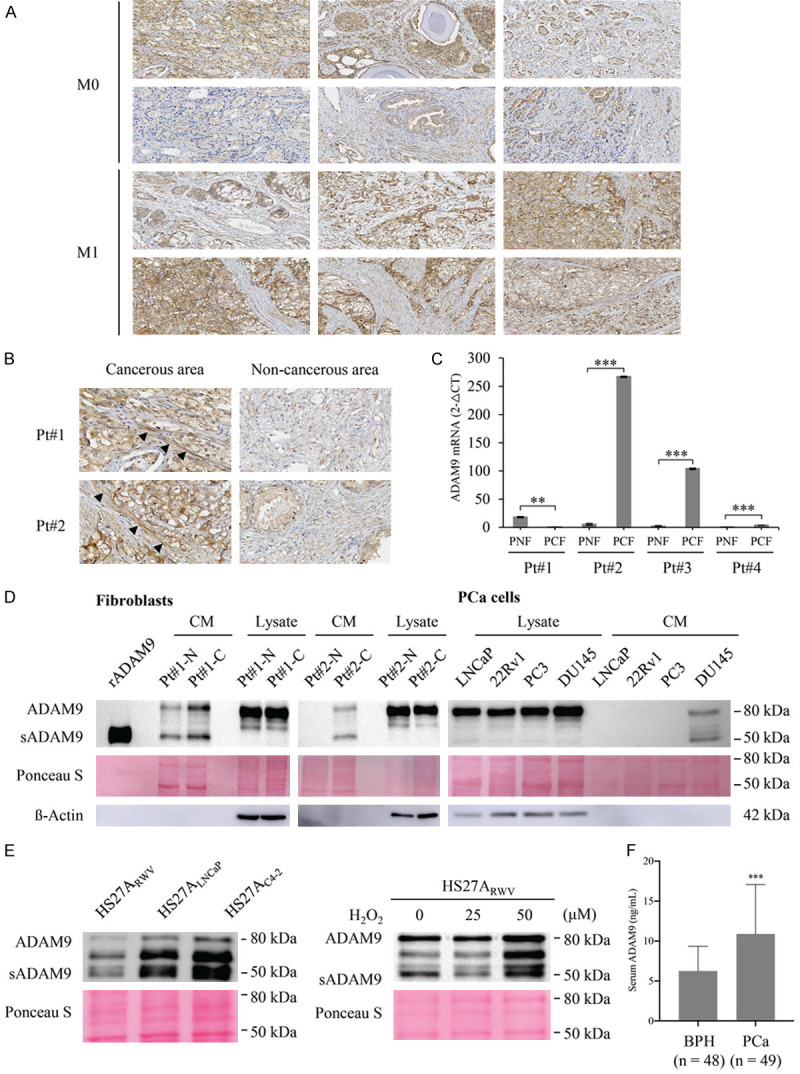
Detection of ADAM9 expression pattern in human prostate cancer and prostatic stromal cells. (A) IHC staining of ADAM9 in a PCa tissue microarray containing prostate tumors from patients who developed metastasis (M1) or not (M0) after prostatectomy, with a total of six samples in each group. (B) Enlarged IHC images of cancerous and non-cancerous areas in (A) M1 tissues from two individual patients at a magnification of 40×. The arrowheads indicate positive staining in the stromal cells. (C) Quantitative RT-PCR analysis of ADAM9 mRNA expression in LCM-isolated fibromuscular stroma surrounding normal (PNF) and tumor (PCN) prostatic tissues deriving from 4 patients (Pt#1-4). (D) WB analysis of ADAM9 expression in total lysates and conditioned media (CM) from PCa patient-derived normal (Pt#1-N and Pt#2-N) and cancer-associated (Pt#1-C and Pt#2-C) fibroblasts and PCa cell lines. A recombinant ectodomain of ADAM9 (rADAM9) was used as molecular weight marker of the mature soluble isoform (50 kDa) of ADAM9 (sADAM9). (E) WB analysis of ADAM9 from the HS27A-derived normal (HS27ARWV) and PCa-associated (HS27ALNCaP and HS27AC4-2) CM or from the H2O2-treated HS27ARWV CM. (F) ELISA determination of ADAM9 levels in the serum samples of patients diagnosed with benign prostatic hyperplasia (BPH) or PCa. WB of ß actin and Ponceau S staining are showed as the loading control of cell lysates and CM, respectively. Data are representative of three independent experiments and shown as mean ± SD. *P<0.05, **P<0.001, ***P<0.0001.
An elevation of secreted ADAM9 in PCF cells was also observed in our previously established genetically-relevant normal and PCa-associated HS27A bone stromal fibroblast cell lines deriving from a coculture cell model [20], in which the ADAM9 protein (Figure 1E, left panel) was secreted at higher levels by PCa-associated HS27A (HS27ALNCaP and HS27AC4-2) cells as compared to normal stromal fibroblasts (HS27ARWV). Moreover, in agreement with our previous finding that oxidative stress-generated intracellular ROS are able to induce ADAM9 expression in PCa cells [14,17], treatment of HS27A stromal cells with hydrogen peroxide markedly increased the amount of ADAM9 protein detected in the CM (Figure 1E, right panel).
Due to the finding that ADAM9 can be released into the culture medium by prostate CAFs, we sought to verify the possibility of detecting ADAM9 in patient sera. Sera from both BPH (n=48) and PCa (n=49) patients were obtained from the Joint Biobank of Taipei Medical University. An ELISA of serum ADAM9 demonstrated enhanced expression levels of sADAM9 in PCa patients (Figure 1F). The average serum ADAM9 concentration was 6.253±0.448 ng/mL in BPH patient samples versus 10.89±0.953 ng/mL in PCa patient samples (mean ± SEM, Student’s t-test, P<0.0001), suggesting that sADAM9 could be a potential serum marker for PCa.
Soluble ADAM9 serves as a chemoattractant for the promotion of CRPC cell migration
In order to determine the biological function of sADAM9 in CRPC progression, both cell growth and transwell migration assays were performed in CRPC-like and highly metastatic PC3 cells with recombinant human (r)ADAM9 protein containing only the ectodomain, as the latter mimics stromal cell-derived sADAM9. We found that although cell proliferation was not affected by culturing with rADAM9 (Figure 2A), a dose-dependent enhancement of rADAM9-induced cell migratory activities was observed, and the latter were antagonized by an ADAM9-neutralizing antibody against the ectodomain (Figure 2B). Consistently, cell migration was also induced following treatment of PCa cells with CM collected from HEK293 cells that were transfected with an sADAM9 expressing vector (Figure 2C). Furthermore, we were able to establish a gradient chemotaxis assay in order to differentiate the effect of sADAM9 on cell motility using μ-slide chemotaxis chambers [29]. In the negative control, both chambers were filled with serum-free medium without additional rADAM9, and directional cell migration was not visible, as illustrated by the cell trajectory (Figure 2D, left panel). Although while cell movement, as calculated as by either the accumulated distance (total cell path traveled) or the Euclidean distance (the length of the straight line between the cell start and end points) did not increase when compared to control, the Rayleigh test (P<0.0001) clearly revealed an inhomogeneous distribution of cell end points in the rADAM9 group, demonstrating a significant chemotactic migration toward rADAM9. On the other hand, when cells were seeded on collagen I (2.5 μg/cm2) coated slides (Figure 2D, right panel), the cell migration ability was found to be greater than that on no collagen coating regardless of the rADAM9 used; a finding that was expected due to the motility-promoting activity of collagen. Noticeably, upon the further addition of rADAM9, a significant increase in Euclidean distance and a much lower P-value in the Rayleigh test were obtained. Collectively, these results indicate that sADAM9 is a chemoattractant, but not a motility stimulator, for PC3 cells.
Figure 2.

Effects of sADAM9 on the cell growth and migratory ability of PCa cells. (A) WST-1 cell proliferation assay of PC3 cells cultured with different concentrations of rADAM9 for two days. (B) Transwell migration assay of PC3 cells incubated with different concentrations of rADAM9 in the presence of additional 1 μg/ml of an ADAM9 neutralizing antibody or control mouse IgG (mIgG). (C) Transwell migration assay of PC3 cells with the CM from 293FT cells transfected with a plasmid containing sADAM9 or EGFP cDNA. WB analysis of ADAM9 expression in these same CM is shown at the top. (D) Chemotaxis assay for PC3 cells toward rADAM9 using the μ-slide chemotaxis chamber, with or without collagen I slide coating. On average 47-53 cells were tracked per experiment for three independent experiments. Trajectory plots (upper panel) was generated by the analysis of migration paths of individual cells and by normalizing the starting point to x=0 and y=0. The y-axis represents the direction of the chemoattractant source. The Rayleigh test was used for controlling the uniformity of cell distribution. The data of the accumulated and the Euclidean distance are represented as a box-whisker plot (lower panel) (by a t-test). (E) WB analysis of the activation of integrin β1 and the migration-related signaling pathway in PC3 cells that were grown on collagen I-coated or uncoated plates, and were treated with 5 μg/ml rADAM9 at the indicated time points. (F) Transwell migration assay and (G) cell proliferation assay by WST-1 of LNCaP cells cultured with 0, 2, and 5 µg/mL of rADAM9 in 0.5% FBS-containing medium. (H) Cell growth assay and relative graph of LNCaP cells that were added with or without 5 µg/mL of rADAM9 in CSS medium for 7 days. Quantitative data in figure are shown as the mean ± SD of at least three independent experiments. The representative image of transwell migration (B, C) from each condition is shown at bottom. *P<0.05, **P<0.001, ***P<0.0001, ns: non-significant.
The disintegrin domain of ADAM9 is known to interact with the β1 subunit of multiple integrins, and to be able to modulate cell-adhesion and migration events [30,31]. To determine whether sADAM9-induced cancer cell migration is related to the integrin β1 downstream signaling, immunoblot analyses of integrin β1 and several kinase pathways associated with cell migration were conducted. We found stark increases in active integrin β1, phosphorylated focal adhesion kinase (FAK), and phosphorylated AKT (but not phosphorylated mammalian target of rapamycin; mTOR) in PCa cells within 60 min of rADAM9 treatment (Figure 2E), supporting that the induction of cell migration occurs through an activation of the integrin β1/FAK/AKT signaling pathways. Interestingly, additional treatment with rADAM9 reduced the ECM-induced integrin β1 activation, but still triggered the FAK/AKT signal pathway, as demonstrated by the group of cells grown on collagen I-coated plates.
Interestingly, unlike the effects of sADAM9 seen in PC3 cells, treatment of androgen-dependent LNCaP cells with rADAM9 caused no change in cell migration (Figure 2F) but protected cell growth from serum starvation (0.5% FBS) (Figure 2G). On the other hand, additional rADAM9 did not increase LNCaP cell proliferation under androgen deprivation condition (Figure 2H). Nevertheless, these results support the conclusion that the elevated sADAM9 expression by prostate CAFs could be responsible, at least in part, for the promotion of CRPC metastasis as demonstrated in our previous studies [20,21].
ADAM9 induces UBN2 expression in androgen-dependent and CRPC cells through isoform-dependent activities
In order to identify intracellular mediators triggered by environmental sADAM9, we conducted a mass spectrometry (MS)-based phosphoprotein proteomic analysis of PC3 cells treated for 2 h with rADAM9 under serum starvation conditions. The phosphoprotein with a high score of 47.23 and a 2.01-fold increased expression in the ADAM9-treated group (as compared to untreated control) was ubinuclein-2 (UBN2). This increase of UBN2 protein expression by sADAM9 was also validated in CRPC-like cell lines, including the AR-positive C4-2 cells and the 22Rv1 and AR-negative PC3 cells by WB analysis (Figure 3A). UBN2 belongs to the ubinuclein family and is identified as a component of the HIRA (histone regulator A) complex [32]. The relationship between UBN2 and tumorigenicity has not been well defined, and so far it has only been demonstrated in colorectal cancer [33,34]. Thus, we intended to investigate the possible involvement of UBN2 in the malignancy of PCa. We were able to identify a strong coexpression of UBN2 and ADAM9 in AR-positive PCa cell lines. In contrast, UBN2 expression was low in AR-negative cell lines, including BPH1, PC3, and DU145, and this expression was non-dependent upon the ADAM9 status (Figure 3B). According to an IHC analysis of PCa tissues, UBN2 expression was higher in PCa tumors that were strongly immunostained for ADAM9 in both the tumor cells and the surrounding stroma, than that in weakly-stained for ADAM9 PCa tissues (Figure 3C). The clinical relevance of the positive correlation between ADAM9 and UBN2 gene expressions was also obtained by analyzing publicly-available RNA Sequencing (RNA-seq) data from three independent cohorts of PCa patients: the WCM 2016, the PRAD_TCGA and the PRAD-MSKCC cohort (Figure 3D). In an attempt to assess the regulatory role of tumor-derived ADAM9 in UBN2 expression, we knocked down ADAM9 in LNCaP and its CRPC-like subline C4-2 by using a small hairpin (sh)RNA approach. Interestingly, while ADAM9 downregulation caused a significant reduction of UBN2 in both mRNA and protein levels in LNCaP, there was minor effect on the UBN2 protein level and no difference in terms of mRNA expression in the C4-2 series (Figure 3E). Collectively, these findings suggested a PCa subtype-dependent UBN2 production by environmental sADAM9 and tumor-derived ADAM9, by which UBN2 induction was largely driven by the paracrine effect of sADAM9 on CRPC cells and by the autocrine effect of ADAM9 on androgen-dependent PCa cells.
Figure 3.
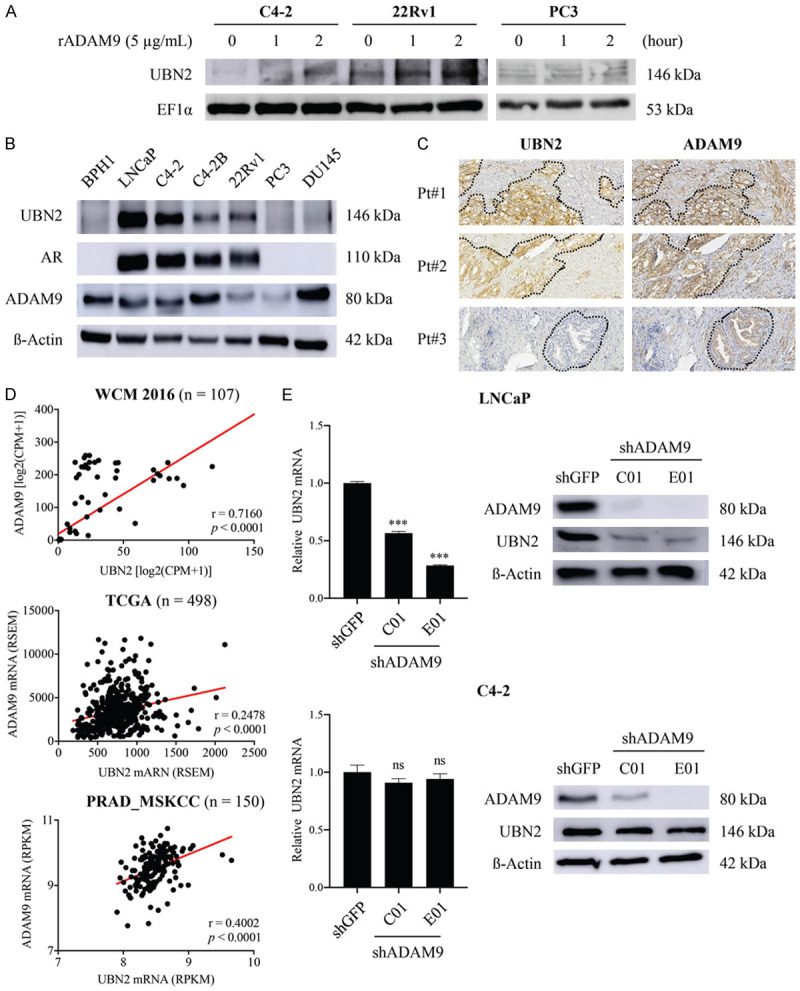
Characterization of the relationship between ADAM9 and UBN2 in PCa cells. A. WB analysis of the UBN2 induction in CRPC-like C4-2, 22Rv1, and PC3 cells after stimulation with rADAM9 for the indicated time points. EF1-α protein levels are shown for various loading quantities of cell lysates. B. WB analysis for the coexpression pattern of ADAM9 and UBN2 in PCa cell lines; β-actin was used as loading control. C. IHC analysis for UBN2 and ADAM9 in a serial section of the same tissues. The dashed lines indicate the junction between the tumor nests and the stroma. D. Pearson correlation analysis between ADAM9 and UBN2 using the indicated database resources. The solid line indicates the linear fit, while Pearson’s correlation coefficient (R) and the corresponding P value are indicated in the panel. E. Comparison of the UBN2 expression levels between ADAM9-knockdown (shADAM9) and control (shGFP) lines of androgen-dependent LNCAP and androgen-independent C4-2, as identified by qRT-PCR and WB analysis. C01 and E01 represent two shRNAs targeting different regions of ADAM9 gene. *P<0.05, **P<0.001, ***P<0.0001, ns: non-significant.
AR signaling modulates the coexpression of ADAM9 and UBN2 in PCa cells
ADAM9 expression has been shown to be mediated by AR in PCa cells [17]. In line with the expression pattern of UBN2 (that was highly expressed in AR-positive PCa cell lines), we investigated whether the AR pathway contributes to UBN2 expression as the upstream regulator. We initially validated the relationship between AR and UBN2 expression in clinical PCa specimens. Results of an IHC analysis of serial sections of PCa tissues (n=52) from two microarrays revealed an elevated UBN2 expression in malignant tissues as compared to normal prostatic glands, with the intensity correlating to that of AR staining (Figures 4A, 5). Other than protein levels, a moderate positive correlation with mRNA expression was also observed (Pearson’s r=0.28-0.56, P<0.0001) in public PCa databases (WCM, PRAD_MSKCC, PRAD_SU2C 2019, and PRAD_TCGA) (Figure 4B). In addition to assessing their association, we investigated whether the AR activation is important for UBN2 gene expression. In order to address this issue, we silenced the AR expression by siRNA in the AR-positive LNCaP and C4-2 cells, and the result showed that knocking-down the AR expression decreased UBN2 levels. Conversely, the forced AR expression in PC3 resulted in an increased UBN2 expression (as compared to the parental control) (Figure 4C). Furthermore, similarly to AR and the AR downstream target prostate-specific antigen (PSA), we found that the synthetic androgen R1881 was able to stimulate UBN2 expression in a dose-dependent manner in LNCaP cells, and that this induction was antagonized upon the addition of the AR antagonist enzalutamide (Figure 4D). On the other hand, consistent with ADAM9, UBN2 expressed by the bone metastatic LNCaP-derivative C4-2B (that harbors persistent AR signaling activity independent of the ligand binding) [35] exhibited much less sensitivity to either androgen withdrawal or supplementation than LNCaP (Figure 4E); the latter is supportive of the assumption that UBN2 expression in PCa cells is controlled, at least in part, by the AR signaling pathway.
Figure 4.
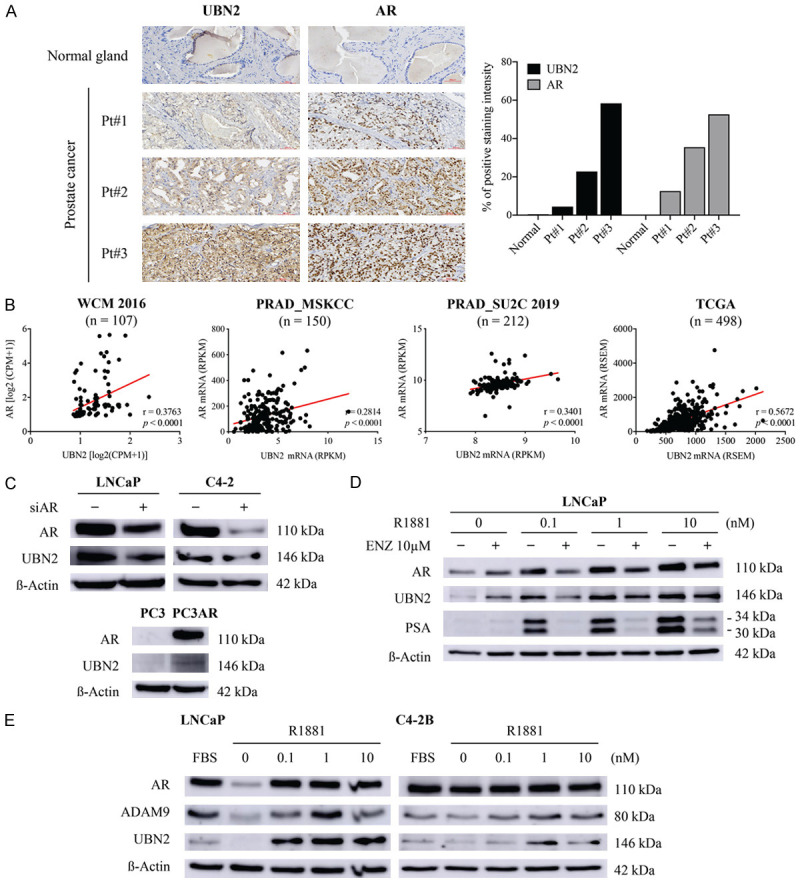
Effects of AR signaling on UBN2 expression in PCa cells. Detection of association between AR and UBN2 expression in PCa tissues by (A) IHC analysis of tissue microarrays, and (B) Pearson correlation analysis of public RNA-seq datasets. Comparison of UBN2 expression levels between (C) parental and AR knockdown (siAR) in LNCaP and C4-2 cells and AR-stably expressing PC3 cells (PC3-AR), (D) LNCaP cells treated with the indicated dose of R1881 in the presence and absence of additional enzalutamide (ENZ) in androgen-depleted medium for 72 h, and (E) LNCaP and C4-2B cells cultured under normal (FBS) and androgen withdrawal conditions (CSS) for 72 h; β-actin was used as WB loading control.
Figure 5.
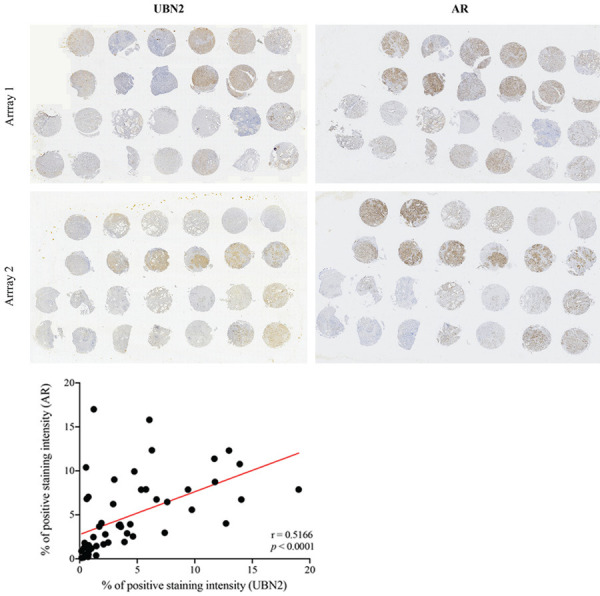
Low power view of tissue microarray slides immunostained with AR and UBN2 antibodies. The parallel in two TMAs immunostaining of prostatectomies from PCa patients. Correlation between the relative protein levels of AR and UBN2 in 52 PCa tissues is shown at the bottom.
ADAM9-induced UBN2 upregulation contributes to cell survival of androgen-dependent PCa cells during ADT
Considering our finding that the knockdown of ADAM9 causes extensive reduction of UBN2 expression in androgen-sensitive LNCaP but not its CRPC derivative C4-2 cells (Figure 3E), we thought that UBN2 might be one of the contributing factors to ADAM9-mediated androgen-dependent PCa progression. Interestingly, we found that although UBN2 was dramatically downregulated in LNCaP cells upon receiving a short-term (72 h) androgen deprivation (Figure 4E), the expression level was reversed and continually increased during the period of 2-6 weeks, and then dramatically dropped and remained at almost a consistent level during the additional 10 weeks of follow-up in a prolonged in vitro treatment (Figure 6A, left panel). A similar kinetic pattern was also observed for ADAM9 expression. This dynamic upregulation of ADAM9 and UBN2 mRNA levels in cultured LNCaP cells during long-term androgen-deprivation was also demonstrated by analyzing a dataset of GDS3358 (Figure 6A, right panel), indicating a role of the ADAM9/UBN2 axis in the process of CRPC development.
Figure 6.

Effects of the ADAM9/UBN2 axis on LNCaP cell proliferation. (A) Expression pattern of ADAM9 and UBN2 mRNA in LNCaP cells during a period of long-term culture in androgen-depleted media, as determined by RT-qPCR analysis in our cell model and by bioinformatic analysis of RNA-seq data from GDS3358 dataset. (B, D) Crystal violet staining assay for cell growth comparison. (B) The ADAM9 knockdown (shADAM9) LNCaP and C4-2 cells with or without overexpression of UBN2, and (D) the parental LNCaP cells stably expressing control (EGFP), UBN2, ADAM9 were cultured in androgen withdrawal media for 10 days and 1 week, respectively. A representative image of culture plates from each condition is shown on the left. (C) WST-1 cell proliferation assay of LNCaP shGFP and shUBN2 derivatives treated with or without DOX for UBN2 knockdown under normal culture conditions at the indicated time points. The WB analysis of the UBN2 knockdown efficiency by DOX (0.1 µg/mL) induction at different time points is shown at the top. (E) Comparison of the UBN2 mRNA levels at different stages of a PCa tumor growth during the ADT in a KUCaP xenograft model (GDS4107). The quantitative data are represented as mean ± SD of absorbance values of triplicate wells after dye extraction from one out of two independent experiments. *P<0.05, **P<0.001, ***P<0.0001, ns: non-significant. AD: androgen-dependent, CIRN: castration-induced regression nadir, CR: castration-resistant.
In order to further assess the biological function of ADAM9-mediated UBN2 expression during ADT, we compared the cell growth between ADAM9-knockdown (shADAM9) and shRNA control (shGFP) cells in LNCaP and C4-2, in the absence of androgen supply for 10 days. In agreement with previous studies showing that the inhibition of ADAM9 expression suppresses cell proliferation in many cancer types, silencing ADAM9 effectively inhibited cell growth in both LNCaP and C4-2 cells. However, ectopic overexpression of UBN2 was able to at least partially restore growth inhibition caused by ADAM9 knockdown in LNCaP but not C4-2 cells (Figure 6B), suggesting a novel mechanism of ADAM9 in supporting cell proliferation of androgen-dependent PCa cells under ADT through the induction of UBN2; a mechanism that is distinct from that in CRPC cells.
In our attempt to address the essential role of UBN2 in driving LNCaP cell proliferation in response to ADT, we intended to knockdown UBN2 for a functional assessment. Interestingly, a stable downregulation of UBN2 in LNCaP resulted in severe growth inhibition and cell death. Thus, a doxycycline (DOX)-inducible system was used in order to establish two LNCaP derivatives in which UBN2-shRNA was tightly controlled by DOX. We found that the cell proliferation capacity was significantly lower when UBN2 was downregulated (by DOX) (Figure 6C). Conversely, ectopic overexpression of UBN2 enhanced cell growth under androgen-deprivation culture conditions for 1 week, as compared to the respective EGFP control (Figure 6D, left), a result similar to that of induced by ADAM9 overexpression (Figure 6D, right). Our finding suggesting a functional involvement of UBN2 in antagonizing androgen-deprivation-induced senescence was supported by a KUCaP xenograft model (GDS4107), in which tumors at the stage of the castration-induced regression nadir showed highest levels of UBN2 expression than those at the stage of androgen-dependent growth, only to then significantly decrease at the stage of castration-resistant regrowth (Figure 6E).
AKR1C3 is a downstream effector for ADAM9/UBN2-mediated cell survival of androgen-dependent LNCaP in response to ADT
In order to better understand the pathophysiological role of UBN2 in PCa, we determined the signaling profile related to UBN2 using an RNA-Seq analysis of LNCaP-shUBN2 cells after DOX induction of UBN2 shRNA. A KEGG pathway enrichment analysis showed that downregulated DEGs upon UBN2-KD were related to 20 pathways. Among these, the steroid hormone biosynthesis signaling pathway, that is highly associated with resistance to anti-androgen treatment [36-38], might contribute to the effect of UBN2 in converting from androgen-dependence to CRPC. One of the most significantly downregulated genes found in this pathway was the aldo-keto reductase family 1 member C3 (AKR1C3) (p=0.0001); a key enzyme that converts weaker 17-keto androgenic precursors to more-potent 17-hydroxy androgens, and that is upregulated during the development of CRPC [39,40]. Both RT-qPCR and WB analyses confirmed the regulatory role of UBN2 and its upstream ADAM9 on AKR1C3 expression in our ADAM9- and UBN2-modulated LNCaP derivatives, in which knockdown of ADAM9 or UBN2 decreased and overexpression of ADAM9 or UBN2 increased AKR1C3 expression, respectively (Figure 7A-D). The clinical association between ADAM9/UBN2 and AKR1C3 was demonstrated by an analysis of the WCM dataset that further supported this relationship (Figure 7E). Moreover, the growth inhibition of LNCaP caused by a ADAM9 or UBN2 knockdown after 1 week of androgen removal was able to be reversed by the overexpression of AKR1C3 (Figure 7F, 7G). Taken together, these data indicate a causal relationship of ADAM9/UBN2/AKR1C3 axis on the cell survival of androgen-dependent PCa against ADT.
Figure 7.
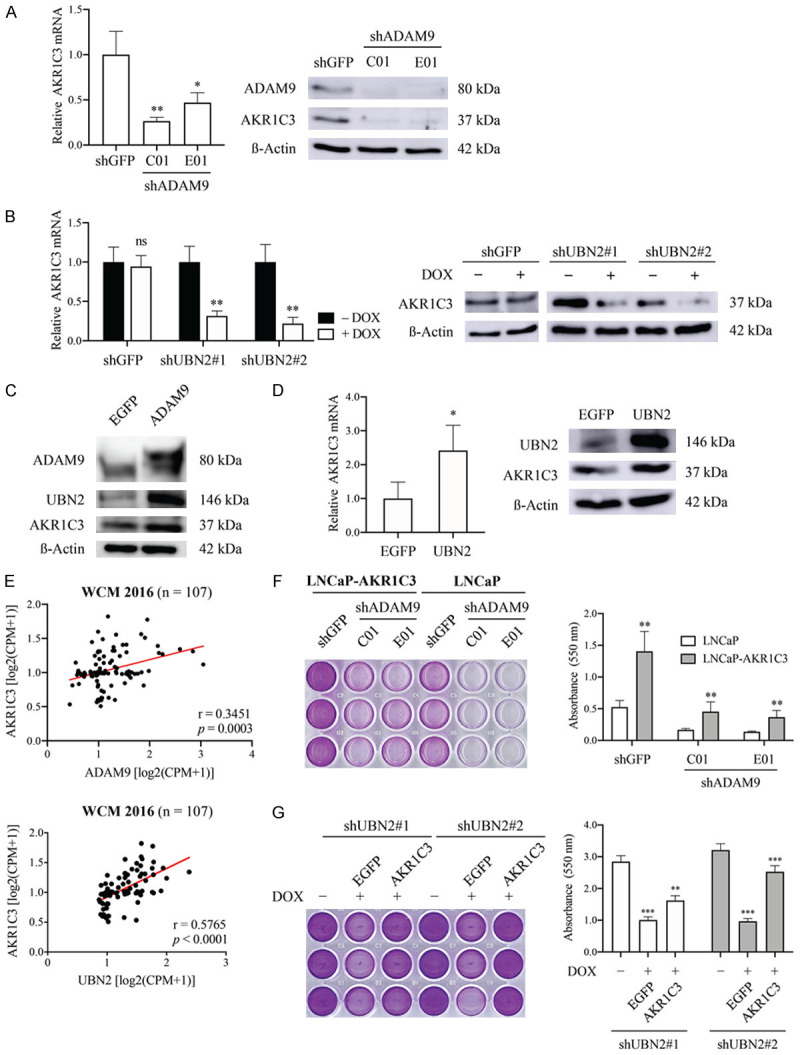
Characterization of the involvement of AKR1C3 in ADAM9/UBN2-mediated cell survival of LNCaP against ADT. Comparison of AKR1C3 expression in ADAM9- (A, C) and UBN2-modulated (B, D) LNCaP derivatives, as determined by RT-qPCR and WB analysis. (E) Pearson correlation analysis between ADAM9 or UBN2 and AKR1C3 mRNA expression using the WCM 2016 database. (F, G) Comparison of cell growth, (F) the ADAM9 knock down (shADAM9) in LNCaP cells with and without overexpression of AKR1C3 after 7 days and (G) UBN2 knockdown (shUBN2) LNCaP derivative (+DOX) transfected with AKR1C3 or EGFP (cells without DOX treatment were used as the UBN2 wild type control) after 10 days of culturing in androgen-depleted media by crystal violet staining analysis. *P<0.05, **P<0.001, ***P<0.0001, ns: non-significant.
Discussion
A critical role for ADAM9 in the pathogenesis of PCa was first revealed in ADAM9-deficient murine models [41], and then subsequently described in humans [14,15,42,43]. Previous mechanistic studies have demonstrated that ADAM9 knockdown in PCa cells leads to decreased cell proliferation and metastatic potential [18,44], and to increased sensitivity to radiation-induced cell death [45]; implying an ubiquitous contribution of ADAM9 to PCa tumor progression. Although using a relatively small sample size, we herein revealed a prognostic impact of ADAM9 tissue staining for the early prediction of metastasis progression in PCa patients; a finding that is supportive of the general notion of ADAM9 conferring metastatic potential to cancer cells. Given the the positive staining of ADAM9 in the stromal area surrounding tumors, we have recorded the production of its secreted isoform by CAFs, in what we believe is the first time in the case of PCa. The significant association of serum ADAM9 levels with PCa reported in this study provides proof of the feasibility of sADAM9 utilization as a noninvasive biomarker for PCa, and thereby patients could benefit from an sADAM9-based early diagnosis of tumor progression and recurrence.
It is well-established that ROS are the by-products of aberrant metabolism in the tumor epithelia, and that they are secreted by cancer cells in order to induce oxidative stress in CAFs [46]; as a result, upregulated sADAM9 seen in CAFs could be induced by the increased ROS [47]. Interestingly and in contrast to transmembrane ADAM9, the secreted form of the ADAM9 protein (~50-kDa) is very rarely detected in PCa tumor cells with the use of WB analysis; a fact demonstrated in PCa cell lines in the present study and in PCa tissue specimens in a previous study [15]. It is tempting to hypothesize that the intrinsic mechanism involved in the alternative splicing of ADAM9 is cell context-dependent. Further molecular identification of the controlling of spliced ADAM9 expression in CAFs remains to be investigated.
In agreement with the previous report suggesting that sADAM9 can induce a highly-invasive phenotype of colon carcinoma cells by directly binding to integrins on the surface of tumor cells through the disintegrin domain [16], our data demonstrated that sADAM9 directs PCa cell chemotactic migration and can significantly trigger the integrin β1 signaling pathway as evidenced by an increase of the active integrin β1 (130 kDa mature form) expression and the phosphorylation of FAK at Tyr 397 and of AKT at Ser 473. Interestingly, when cells were attached on a collagen I-coated surface, the strong activation of integrin β1 through the ECM-cell interaction was reduced, but the migration regulating FAK/AKT pathway was enhanced by the presence of additional sADAM9. The latter may be explained by the dominant action of sADAM9 on ECM substrates’ focal degradation via its metalloprotease activity [16], and thereby cells can freely migrate. Alternatively, integrins other than β1 also interact with ADAM9 and regulate downstream FAK activity. Unlike cancer-derived ADAM9 that is characterized by an ability to modulate tumor cell proliferation in a variety of cancer types [43], we found no effect of exogenous sADAM9 on PCa cell growth. This functional difference between these two forms of ADAM9 is most likely to be caused by the lack of the cytoplasmic domain of sADAM9; a structure critical for the ADAM9 catalytic activity on the ectodomain shedding of heparin-binding EGF-like factor (HB-EGF), and its subsequent activation of EGFR [48]. Collectively, our study paves the way for new insights into the molecular mechanisms through which ADAM9 drives PCa tumor metastasis within the stromal-tumor interaction.
The connection between UBN2 and tumorigenesis was recently described in colorectal cancer, in which UBN2 expression promoted tumor cells’ proliferation through the upregulation of the KRAS expression and signaling [33]. In this study, we identified a unique role for ADAM9 as an UBN2 regulator able to drive AKR1C3 gene expression; the latter being particularly critical for the survival of androgen-dependent LNCaP cells in long-term androgen-deprivation conditions. This finding is highly relevant to the clinical observation that ADAM9 is a negative prognostic marker associated with PSA relapse-free survival in patients who had previously received ADT [15]. UBN2 belongs to the ubinuclein family, and it was recently identified as a component of HIRA complex to specifically recognize and deposit histone H3.3 at cis-regulatory regions of active genes [32]. Thus, one could suggest that the transcriptional regulation of AKR1C3 by UBN2 might take place through epigenetic mechanisms involving histone chaperones. We are not yet aware of how ADAM9 contributes to UBN2 expression. However, given that UBN2 was induced by short-term exposure to sADAM9, it might be possible that ADAM9 signaling enhances UBN2 protein stability. This hypothesis might be able to explain why lower levels of the UBN2 protein (but not of the corresponding mRNA level) are found in C4-2 cells upon ADAM9 downregulation. The identification of UBN2 as an ADAM9 signaling downstream gene transducer provides the missing link between ADAM9 and REG4 expression in androgen-independent PCa cells, as demonstrated in our previous study [18].
Castration-resistant disease is a fatal manifestation of PCa. As androgen-deprivation is the standard systemic treatment for advanced PCa, it is important to identify and characterize patients at risk of developing hormone-refractory PCa, and to be able to propose preventive strategies in order to avert transition to this phase of the pathology. Previous studies on the biological activity of ADAM9 in CRPC progression have focused mainly on its effects upon promoting a more aggressive cellular phenotype in androgen-independent cells. In this study, we further discovered a regulatory axis of ADAM9, UBN2, and AKR1C3 in androgen-dependent PCa cells, suggesting a feedback mechanism that is able to counteract the impairing AR signaling activation during the ADT. The potentially contributing of CAF-derived sADAM9 in PCa metastasis as well as the ADAM9/UBN2/AKR1C3 axis to the onset of CRPC (Figure 8) also represents a novel therapeutic target for the improvement of ADT. Finally, in order to achieve an early prediction of the patient’s response to ADT, further clinical evaluation of the prognostic value of ADAM9 and UBN2, either alone or in combination, should be prioritized.
Figure 8.
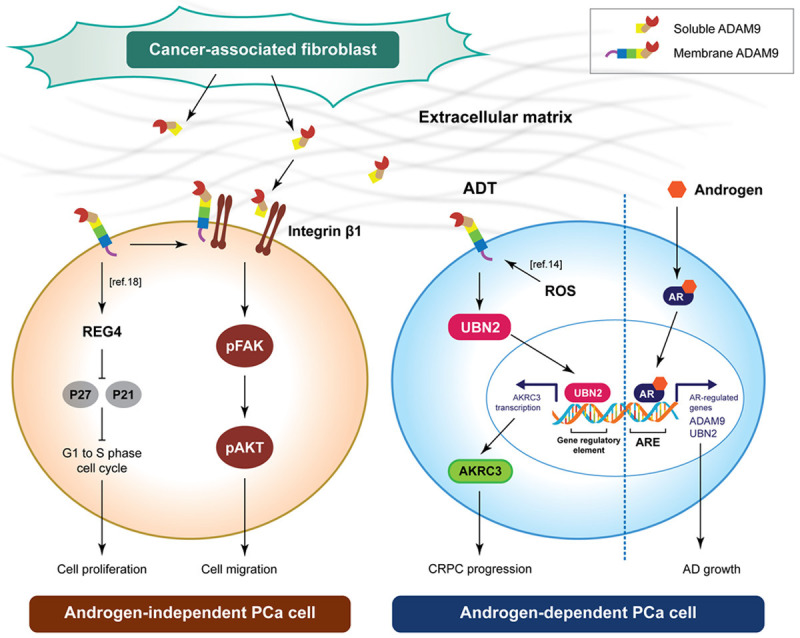
Model of ADAM9 and sADAM9 in androgen-independent and androgen-dependent PCa cell.
Acknowledgements
This work was supported in part by fundings from the Featured Areas Research Center Program within the framework of the Higher Education Sprout Project by the Ministry of Education (MOE) (grant number DP2-110-21121-01-K-03 and DP2-109-21121-03-C-02-02), Taipei Medical University Hospital (grant number 108-TMUH-SP-01), Ministry of Science and Technology (MOST 110-2314-B-038-136 and MOST 110-2314-B-038-137-MY3), and Ministry of Health and Welfare (grant number MOHW109-TDU-B-212-114007, MOHW110-TDU-B-212-124007, and MOHW110-TDU-B212-144026). We thank the Sequencing Core Facility and CRISPR Gene Targeting Core Lab at Taipei Medical University for providing technical support and Mr. Chamberlain Daniel Pickren and Enago (www.enago.com) for the English language review.
Disclosure of conflict of interest
None.
References
- 1.Mattiuzzi C, Lippi G. Current cancer epidemiology. J Epidemiol Glob Health. 2019;9:217–222. doi: 10.2991/jegh.k.191008.001. [DOI] [PMC free article] [PubMed] [Google Scholar]
- 2.Polotti CF, Kim CJ, Chuchvara N, Polotti AB, Singer EA, Elsamra S. Androgen deprivation therapy for the treatment of prostate cancer: a focus on pharmacokinetics. Expert Opin Drug Metab Toxicol. 2017;13:1265–1273. doi: 10.1080/17425255.2017.1405934. [DOI] [PubMed] [Google Scholar]
- 3.Varenhorst E, Klaff R, Berglund A, Hedlund PO, Sandblom G Scandinavian Prostate Cancer Group (SPCG) Trial No. 5. Predictors of early androgen deprivation treatment failure in prostate cancer with bone metastases. Cancer Med. 2016;5:407–414. doi: 10.1002/cam4.594. [DOI] [PMC free article] [PubMed] [Google Scholar]
- 4.Chung LW, Baseman A, Assikis V, Zhau HE. Molecular insights into prostate cancer progression: the missing link of tumor microenvironment. J Urol. 2005;173:10–20. doi: 10.1097/01.ju.0000141582.15218.10. [DOI] [PubMed] [Google Scholar]
- 5.Damodaran S, Kyriakopoulos CE, Jarrard DF. Newly diagnosed metastatic prostate cancer: has the paradigm changed? Urol Clin North Am. 2017;44:611–621. doi: 10.1016/j.ucl.2017.07.008. [DOI] [PMC free article] [PubMed] [Google Scholar]
- 6.Barron DA, Rowley DR. The reactive stroma microenvironment and prostate cancer progression. Endocr Relat Cancer. 2012;19:R187–R204. doi: 10.1530/ERC-12-0085. [DOI] [PMC free article] [PubMed] [Google Scholar]
- 7.Quail DF, Joyce JA. Microenvironmental regulation of tumor progression and metastasis. Nat Med. 2013;19:1423–1437. doi: 10.1038/nm.3394. [DOI] [PMC free article] [PubMed] [Google Scholar]
- 8.Heneberg P. Paracrine tumor signaling induces transdifferentiation of surrounding fibroblasts. Crit Rev Oncol Hematol. 2016;97:303–311. doi: 10.1016/j.critrevonc.2015.09.008. [DOI] [PubMed] [Google Scholar]
- 9.Winkler J, Abisoye-Ogunniyan A, Metcalf KJ, Werb Z. Concepts of extracellular matrix remodelling in tumour progression and metastasis. Nat Commun. 2020;11:5120. doi: 10.1038/s41467-020-18794-x. [DOI] [PMC free article] [PubMed] [Google Scholar]
- 10.Lu P, Takai K, Weaver VM, Werb Z. Extracellular matrix degradation and remodeling in development and disease. Cold Spring Harb Perspect Biol. 2011;3:a005058. doi: 10.1101/cshperspect.a005058. [DOI] [PMC free article] [PubMed] [Google Scholar]
- 11.Erdogan B, Webb DJ. Cancer-associated fibroblasts modulate growth factor signaling and extracellular matrix remodeling to regulate tumor metastasis. Biochem Soc Trans. 2017;45:229–236. doi: 10.1042/BST20160387. [DOI] [PMC free article] [PubMed] [Google Scholar]
- 12.Primakoff P, Myles DG. The ADAM gene family: surface proteins with adhesion and protease activity. Trends Genet. 2000;16:83–87. doi: 10.1016/s0168-9525(99)01926-5. [DOI] [PubMed] [Google Scholar]
- 13.White JM. ADAMs: modulators of cell-cell and cell-matrix interactions. Curr Opin Cell Biol. 2003;15:598–606. doi: 10.1016/j.ceb.2003.08.001. [DOI] [PubMed] [Google Scholar]
- 14.Sung SY, Kubo H, Shigemura K, Arnold RS, Logani S, Wang R, Konaka H, Nakagawa M, Mousses S, Amin M, Anderson C, Johnstone P, Petros JA, Marshall FF, Zhau HE, Chung LW. Oxidative stress induces ADAM9 protein expression in human prostate cancer cells. Cancer Res. 2006;66:9519–9526. doi: 10.1158/0008-5472.CAN-05-4375. [DOI] [PubMed] [Google Scholar]
- 15.Fritzsche FR, Jung M, Tölle A, Wild P, Hartmann A, Wassermann K, Rabien A, Lein M, Dietel M, Pilarsky C, Calvano D, Grützmann R, Jung K, Kristiansen G. ADAM9 expression is a significant and independent prognostic marker of PSA relapse in prostate cancer. Eur Urol. 2008;54:1097–1108. doi: 10.1016/j.eururo.2007.11.034. [DOI] [PubMed] [Google Scholar]
- 16.Mazzocca A, Coppari R, De Franco R, Cho JY, Libermann TA, Pinzani M, Toker A. A secreted form of ADAM9 promotes carcinoma invasion through tumor-stromal interactions. Cancer Res. 2005;65:4728–4738. doi: 10.1158/0008-5472.CAN-04-4449. [DOI] [PubMed] [Google Scholar]
- 17.Shigemura K, Sung SY, Kubo H, Arnold RS, Fujisawa M, Gotoh A, Zhau HE, Chung LW. Reactive oxygen species mediate androgen receptor- and serum starvation-elicited downstream signaling of ADAM9 expression in human prostate cancer cells. Prostate. 2007;67:722–731. doi: 10.1002/pros.20565. [DOI] [PubMed] [Google Scholar]
- 18.Liu CM, Hsieh CL, He YC, Lo SJ, Liang JA, Hsieh TF, Josson S, Chung LW, Hung MC, Sung SY. In vivo targeting of ADAM9 gene expression using lentivirus-delivered shRNA suppresses prostate cancer growth by regulating REG4 dependent cell cycle progression. PLoS One. 2013;8:e53795. doi: 10.1371/journal.pone.0053795. [DOI] [PMC free article] [PubMed] [Google Scholar]
- 19.Sung SY, Chang JL, Chen KC, Yeh SD, Liu YR, Su YH, Hsueh CY, Chung LW, Hsieh CL. Co-targeting prostate cancer epithelium and bone stroma by human osteonectin-promoter-mediated suicide gene therapy effectively inhibits androgen-independent prostate cancer growth. PLoS One. 2016;11:e0153350. doi: 10.1371/journal.pone.0153350. [DOI] [PMC free article] [PubMed] [Google Scholar]
- 20.Hsieh CL, Liu CM, Chen HA, Yang ST, Shigemura K, Kitagawa K, Yamamichi F, Fujisawa M, Liu YR, Lee WH, Chen KC, Shen CN, Lin CC, Chung LW, Sung SY. Reactive oxygen species-mediated switching expression of MMP-3 in stromal fibroblasts and cancer cells during prostate cancer progression. Sci Rep. 2017;7:9065. doi: 10.1038/s41598-017-08835-9. [DOI] [PMC free article] [PubMed] [Google Scholar]
- 21.Sung SY, Hsieh CL, Law A, Zhau HE, Pathak S, Multani AS, Lim S, Coleman IM, Wu LC, Figg WD, Dahut WL, Nelson P, Lee JK, Amin MB, Lyles R, Johnstone PA, Marshall FF, Chung LW. Coevolution of prostate cancer and bone stroma in three-dimensional coculture: implications for cancer growth and metastasis. Cancer Res. 2008;68:9996–10003. doi: 10.1158/0008-5472.CAN-08-2492. [DOI] [PMC free article] [PubMed] [Google Scholar]
- 22.Hung SC, Wu IH, Hsue SS, Liao CH, Wang HC, Chuang PH, Sung SY, Hsieh CL. Targeting L1 cell adhesion molecule using lentivirus-mediated short hairpin rna interference reverses aggressiveness of oral squamous cell carcinoma. Mol Pharm. 2010;7:2312–2323. doi: 10.1021/mp1002834. [DOI] [PubMed] [Google Scholar]
- 23.D’Antonio JM, Ma C, Monzon FA, Pflug BR. Longitudinal analysis of androgen deprivation of prostate cancer cells identifies pathways to androgen independence. Prostate. 2008;68:698–714. doi: 10.1002/pros.20677. [DOI] [PubMed] [Google Scholar]
- 24.Yoshida T, Kinoshita H, Segawa T, Nakamura E, Inoue T, Shimizu Y, Kamoto T, Ogawa O. Antiandrogen bicalutamide promotes tumor growth in a novel androgen-dependent prostate cancer xenograft model derived from a bicalutamide-treated patient. Cancer Res. 2005;65:9611–9616. doi: 10.1158/0008-5472.CAN-05-0817. [DOI] [PubMed] [Google Scholar]
- 25.Beltran H, Prandi D, Mosquera JM, Benelli M, Puca L, Cyrta J, Marotz C, Giannopoulou E, Chakravarthi BV, Varambally S, Tomlins SA, Nanus DM, Tagawa ST, Van Allen EM, Elemento O, Sboner A, Garraway LA, Rubin MA, Demichelis F. Divergent clonal evolution of castration-resistant neuroendocrine prostate cancer. Nat Med. 2016;22:298–305. doi: 10.1038/nm.4045. [DOI] [PMC free article] [PubMed] [Google Scholar]
- 26.Grossman RL, Heath AP, Ferretti V, Varmus HE, Lowy DR, Kibbe WA, Staudt LM. Toward a shared vision for cancer genomic data. N Engl J Med. 2016;12:1109–1112. doi: 10.1056/NEJMp1607591. [DOI] [PMC free article] [PubMed] [Google Scholar]
- 27.Taylor BS, Schultz N, Hieronymus H, Gopalan A, Xiao Y, Carver BS, Arora VK, Kaushik P, Cerami E, Reva B, Antipin Y, Mitsiades N, Landers T, Dolgalev I, Major JE, Wilson M, Socci ND, Lash AE, Heguy A, Eastham JA, Scher HI, Reuter VE, Scardino PT, Sander C, Sawyers CL, Gerald WL. Integrative genomic profiling of human prostate cancer. Cancer Cell. 2010;18:11–22. doi: 10.1016/j.ccr.2010.05.026. [DOI] [PMC free article] [PubMed] [Google Scholar]
- 28.Abida W, Cyrta J, Heller G, Prandi D, Armenia J, Coleman I, Cieslik M, Benelli M, Robinson D, Van Allen EM, Sboner A, Fedrizzi T, Mosquera JM, Robinson BD, De Sarkar N, Kunju LP, Tomlins S, Wu YM, Nava Rodrigues D, Loda M, Gopalan A, Reuter VE, Pritchard CC, Mateo J, Bianchini D, Miranda S, Carreira S, Rescigno P, Filipenko J, Vinson J, Montgomery RB, Beltran H, Heath EI, Scher HI, Kantoff PW, Taplin ME, Schultz N, Debono JS, Demichelis F, Nelson PS, Rubin MA, Chinnaiyan AM, Sawyers CL. Genomic correlates of clinical outcome in advanced prostate cancer. Proc Natl Acad Sci U S A. 2019;116:11428–11436. doi: 10.1073/pnas.1902651116. [DOI] [PMC free article] [PubMed] [Google Scholar]
- 29.Zengel P, Nguyen-Hoang A, Schildhammer C, Zantl R, Kahl V, Horn E. μ-slide chemotaxis: a new chamber for long-term chemotaxis studies. BMC Cell Biol. 2011;12:21. doi: 10.1186/1471-2121-12-21. [DOI] [PMC free article] [PubMed] [Google Scholar]
- 30.Mahimkar RM, Visaya O, Pollock AS, Lovett DH. The disintegrin domain of ADAM9: a ligand for multiple β1 renal integrins. Biochem J. 2005;385:461–468. doi: 10.1042/BJ20041133. [DOI] [PMC free article] [PubMed] [Google Scholar]
- 31.Seegar TC, Blacklow SC. Domain integration of ADAM family proteins: emerging themes from structural studies. Exp Biol Med. 2019;244:1510–1519. doi: 10.1177/1535370219865901. [DOI] [PMC free article] [PubMed] [Google Scholar]
- 32.Xiong C, Wen Z, Yu J, Chen J, Liu CP, Zhang X, Chen P, Xu RM, Li G. UBN1/2 of HIRA complex is responsible for recognition and deposition of H3.3 at cis-regulatory elements of genes in mouse ES cells. BMC Biol. 2018;16:110. doi: 10.1186/s12915-018-0573-9. [DOI] [PMC free article] [PubMed] [Google Scholar]
- 33.Zhao YL, Zhong SR, Zhang SH, Bi JX, Xiao ZY, Wang SY, Jiao HL, Zhang D, Qiu JF, Zhang LJ, Huang CM, Chen XL, Ding YQ, Ye YP, Liang L, Liao WT. UBN2 promotes tumor progression via the Ras/MAPK pathway and predicts poor prognosis in colorectal cancer. Cancer Cell Int. 2019;19:126. doi: 10.1186/s12935-019-0848-4. [DOI] [PMC free article] [PubMed] [Google Scholar]
- 34.Yang T, Guo Q, Li D, Bai G, Sun H, Wang W. MicroRNA-802 suppresses tumorigenesis of colorectal cancer via regulating UBN2. Cancer Manag Res. 2020;12:11219–11230. doi: 10.2147/CMAR.S267345. [DOI] [PMC free article] [PubMed] [Google Scholar]
- 35.Decker KF, Zheng D, He Y, Bowman T, Edwards JR, Jia L. Persistent androgen receptor-mediated transcription in castration-resistant prostate cancer under androgen-deprived conditions. Nucleic Acids Res. 2012;40:10765–10779. doi: 10.1093/nar/gks888. [DOI] [PMC free article] [PubMed] [Google Scholar]
- 36.Liu C, Lou W, Zhu Y, Yang JC, Nadiminty N, Gaikwad NW, Evans CP, Gao AC. Intracrine androgens and AKR1C3 activation confer resistance to enzalutamide in prostate cancer. Cancer Res. 2015;75:1413–1422. doi: 10.1158/0008-5472.CAN-14-3080. [DOI] [PMC free article] [PubMed] [Google Scholar]
- 37.Liu C, Armstrong CM, Lou W, Lombard A, Evans CP, Gao AC. Inhibition of AKR1C3 activation overcomes resistance to abiraterone in advanced prostate cancer. Mol Cancer Ther. 2017;16:35–44. doi: 10.1158/1535-7163.MCT-16-0186. [DOI] [PMC free article] [PubMed] [Google Scholar]
- 38.Liu Y, He S, Chen Y, Liu Y, Feng F, Liu W, Guo Q, Zhao L, Sun H. Overview of AKR1C3: inhibitor achievements and disease insights. J Med Chem. 2020;63:11305–11329. doi: 10.1021/acs.jmedchem.9b02138. [DOI] [PubMed] [Google Scholar]
- 39.Zeng CM, Chang LL, Ying MD, Cao J, He QJ, Zhu H, Yang B. Aldo-keto reductase AKR1C1-AKR1C4: functions, regulation, and intervention for anti-cancer therapy. Front Pharmacol. 2017;8:119. doi: 10.3389/fphar.2017.00119. [DOI] [PMC free article] [PubMed] [Google Scholar]
- 40.Yepuru M, Wu Z, Kulkarni A, Yin F, Barrett CM, Kim J, Steiner MS, Miller DD, Dalton JT, Narayanan R. Steroidogenic enzyme AKR1C3 is a novel androgen receptor-selective coactivator that promotes prostate cancer growth. Clin Cancer Res. 2013;19:5613–5625. doi: 10.1158/1078-0432.CCR-13-1151. [DOI] [PubMed] [Google Scholar]
- 41.Peduto L, Reuter VE, Shaffer DR, Scher HI, Blobel CP. Critical function for ADAM9 in mouse prostate cancer. Cancer Res. 2005;65:9312–9319. doi: 10.1158/0008-5472.CAN-05-1063. [DOI] [PubMed] [Google Scholar]
- 42.Karan D, Lin FC, Bryan M, Ringel J, Moniaux N, Lin MF, Batra SK. Expression of ADAMs (a disintegrin and metalloproteases) and TIMP-3 (tissue inhibitor of metalloproteinase-3) in human prostatic adenocarcinomas. Int J Oncol. 2003;23:1365–1371. [PubMed] [Google Scholar]
- 43.Chou CW, Huang YK, Kuo TT, Liu JP, Sher YP. An overview of ADAM9: structure, activation, and regulation in human diseases. Int J Mol Sci. 2020;21:7790. doi: 10.3390/ijms21207790. [DOI] [PMC free article] [PubMed] [Google Scholar]
- 44.Lin YW, Wen YC, Chu CY, Tung MC, Yang YC, Hua KT, Pan KF, Hsiao M, Lee WJ, Chien MH. Stabilization of ADAM9 by N-α-acetyltransferase 10 protein contributes to promoting progression of androgen-independent prostate cancer. Cell Death Dis. 2020;11:591. doi: 10.1038/s41419-020-02786-2. [DOI] [PMC free article] [PubMed] [Google Scholar]
- 45.Josson S, Anderson CS, Sung SY, Johnstone PA, Kubo H, Hsieh CL, Arnold R, Gururajan M, Yates C, Chung LW. Inhibition of ADAM9 expression induces epithelial phenotypic alterations and sensitizes human prostate cancer cells to radiation and chemotherapy. Prostate. 2011;71:232–240. doi: 10.1002/pros.21237. [DOI] [PMC free article] [PubMed] [Google Scholar]
- 46.Martinez-Outschoorn UE, Lin Z, Trimmer C, Flomenberg N, Wang C, Pavlides S, Pestell RG, Howell A, Sotgia F, Lisanti MP. Cancer cells metabolically “fertilize” the tumor microenvironment with hydrogen peroxide, driving the Warburg effect. Cell Cycle. 2011;10:2504–2520. doi: 10.4161/cc.10.15.16585. [DOI] [PMC free article] [PubMed] [Google Scholar]
- 47.Chan JS, Tan MJ, Sng MK, Teo Z, Phua T, Choo CC, Li L, Zhu P, Tan NS. Cancer-associated fibroblasts enact field cancerization by promoting extratumoral oxidative stress. Cell Death Dis. 2018;8:e2562. doi: 10.1038/cddis.2016.492. [DOI] [PMC free article] [PubMed] [Google Scholar]
- 48.Izumi Y, Hirata M, Hasuwa H, Iwamoto R, Umata T, Miyado K, Tamai Y, Kurisaki T, Sehara-Fujisawa A, Ohno S, Mekada E. A metalloprotease-disintegrin, MDC9/meltrin-gamma/ADAM9 and PKCdelta are involved in TPA-induced ectodomain shedding of membrane-anchored heparin-binding EGF-like growth factor. EMBO J. 1998;17:7260–7272. doi: 10.1093/emboj/17.24.7260. [DOI] [PMC free article] [PubMed] [Google Scholar]
Associated Data
This section collects any data citations, data availability statements, or supplementary materials included in this article.
Data Availability Statement
RNA-Seq dataset GSE8702 [23] and GSE21887 [24] were retrieved from the Gene Expression Omnibus. The mRNA expression profiles and clinical information from WCM 2016 [25], PRAD_TCGA [26], PRAD_MSKCC [27], and PRAD_SU2C_2019 [28] were downloaded from cBioportal (https://www.cbioportal.org/).