

Abstract
Tumor cells have a modified glycosylation profile that promotes their evolution and/or their maintenance in the tumor. Sialylation is a type of glycosylation that is often altered in cancers. RNA-Seq database analysis revealed that the sialyltransferase gene ST3GAL2 is significantly overexpressed at all stages of colorectal cancer (CRC). ST3GAL2 sialylates both glycoproteins and glycolipids. The aim of this work was to investigate the involvement of ST3GAL2 in CRC. Using the HT29 tumor cell line derived from a stage II of CRC, we decreased the expression of ST3GAL2 by specific shRNA, and then characterized these cells by performing functional tests. We found that ST3GAL2 knock down (KD) significantly decreases tumor cell proliferation, cell migration and invasiveness properties in vitro. The cell cycle of these cells is affected with a change in cell cycle distribution and an increase of cell apoptosis. The effect of ST3GAL2 KD was then studied in vivo, following xenografts into nude mice, in which the tumor progression was significantly reduced. This work demonstrates that ST3GAL2 is a major player in the behavior of colorectal tumor cells, by modifying the sialylation state of glycoproteins and glycolipids which remain to be specifically identified.
Keywords: ST3GAL2, colorectal cancer, HT29, xenografts, biopsies
Introduction
Colorectal cancer (CRC) is the third most diagnosed cancer worldwide all sex confounded (second in females and third in males), with 1.9 million new cases in 2020 (representing 10% of new cancer cases) and 935,173 deaths (World Health Organization). CRC develops in 5 main stages (0 to IV). A tumor is a heterogeneous mass of cells which are characterized by numerous changes like “Warburg Phenomenon” [1], a constitutive activation of different growth factors [2], a lower apoptosis through resistance to mitochondrial membrane permeabilization, or a deregulated replicative potential [3]. In addition to these metabolic disorders, it should be noted that cancer cells present important glycosylation changes. Glycosylation is the most important post translational modification (PTM). The carbohydrate formation results from coordinated actions of glycosyltransferases and glycosidases occurring mainly in endoplasmic reticulum (ER) and Golgi apparatus [4-6]. The majority of mammal proteins are glycosylated and these glycoproteins play important roles in many cell functions like pluripotency, cell-cell communication and interaction, protein folding, embryogenesis or cell death [7-10]. PTM are also known to participate to tumor process [11-13]. Abnormal glycosylation of proteins and/or lipids may increase tumorigenesis. This is the case, for example, for Notch receptor whose abnormal glycosylation by protein O-fucosyltransferase 1 (POFUT1) promotes CRC process by an enhanced Notch signaling [14]. In gastric and colorectal cancers, overexpression of POFUT1 could be a potential biomarker [15,16]. Some glycosylation alterations are known in CRC [17], particularly fucosylation and sialylation which increase in colorectal tumors, and in other cancers such as lung and oral cancers [18]. Indeed, a global sialylation modification occurs in CRC [19] and some abnormal sialylations contribute to apoptosis dysregulation. For example, abnormal α2-6 sialylation of Fas receptor by ST6GAL1 prevents apoptosis through inhibition of the association of Fas tails with FADD (Fas-associated protein with Death Domain) and a decrease of caspase 8 activation in colon carcinoma [20]. In ovarian cancer cell lines, a decrease in α2-3 sialylation by a knock-down of ST3GAL3 promotes apoptosis and increases sensitivity to cisplatin, an apoptosis inductor [21]. Sialyltransferase superfamily includes 20 members classified in four families: the members of the ST3GAL family transfer a sialic acid to a galactose residue through an α2,3-linkage [22]; sialic acid is transferred to galactose through an α2,6-linkage by ST6GAL family members [23]; the members of ST6GALNAC family transfer a sialic acid to a N-acetylgalactosamine though an α2,6-linkage [24]; and sialic acid is transferred to another sialic acid through an α2,8-linkage by ST8Sia family members [25].
It appears that some sialyltransferases, such as ST6GAL1 or ST6GALNAC1 as well as members of ST3GAL family, are overexpressed in CRC and lead to aberrant N-glycans and to the emergence of sTn, sLea and sLeX antigens. sLea is thus recognized as a CRC biomarker but with low sensitivity [26,27].
ST6GAL1 gene is known to be overexpressed in early stage of CRC. This abnormal sialylation promotes tumorigenesis by adding sialic acid on several membrane glycoproteins, mostly responsible of cell movement, cell death/survival and cell growth [28]. Recently ST6GALNAC1 was shown to be overexpressed in colorectal cancer stem cells (CSC) and to promote chemotherapy resistance of these cells by Akt pathway activation [29].
ST3GAL2 is an enzyme (EC 2.4.99.2) found in Golgi apparatus and known to add sialic acid on both O-glycoproteins and gangliosides, with a preference for the latter [30-32] and more particularly GD1a and GT1b [33]. The main interest in ST3GAL2 arose from one of its product, the Stage Specific Embryonic Antigen-4 (SSEA-4), a glycosphingolipid (GSL) only synthetized by ST3GAL2 [34,35]. This globo-serie ganglioside was originally studied in embryonic tissues and turns out to be a biomarker for several cancers, such as hepatocellular carcinoma where ST3GAL2 is overexpressed [36]. In prostate tumor, it appears that cells that express SSEA-4 have a fibroblastic rather than epithelial profile [37]. In breast cancer, ST3GAL2 overexpression lead to an increase of SSEA-4 antigen and to a chemotherapy resistance of tumor cells [38]. This GSL has been studied in glioblastoma too, where it could be a biomarker of a high grade glioblastoma [39]. All these studies targeted SSEA-4, i.e. the product of ST3GAL2, but none focused on the enzyme ST3GAL2 itself.
In this study, we used RNA-seq informations present in databases to detect an overexpression of ST3GAL2 in colorectal tumors. After knock-down (KD) by shRNA of ST3GAL2 in HT29 cell line, we performed in vitro functional tests with shST3GAL2 cells. We observed a decrease in proliferation, migration and invasion abilities of shST3GAL2 cells compared to parental cells. We also observed an increase of apoptosis and a dysregulation of cell distribution in phases of cell cycle. In vivo, these cells led to a dramatic reduction of tumor size when xenografted into nude mice. This study demonstrated for the first time the ST3GAL2 implication in colorectal tumor progression in vitro and in vivo.
Materials and methods
The cancer genome atlas data analysis
Data of colorectal cancer were extracted from FireBrowse database (http://www.firebrowse.org). A total of 626 tumor samples and 51 normal samples were studied. Gene expression levels were merged from COADREAD.uncv2.mRNAseq_RSEM_normalized_log2.txt found in COADREAD.mRNAseq_ Preprocess.Level file. Clinical features for each patient were determined from “CLI_years_to_birth”, “CLI_tumor_tissue_site”, “CLI_pathologic_stage”, and “CLI_gender” extracted from COADREAD-TP.samplefeatures.txt available in COADREAD-TP; Aggregate_AnalysisFeatures. Level metadata.
Cell culture and transfection
Human CRC HT29 cells were cultivated in Dulbecco’s Modified Eagle Medium (DMEM) (Thermofisher Scientific, Waltham, MA, USA) supplemented with 10% (v/v) fetal bovine serum (FBS) (Biowest, Eurobio, Courtaboeuf, France) and 0.5% (v/v) penicillin/streptomycin (Gibco, Carlsbad, CA, USA). Cell line was cultivated at 37°C in a humid atmosphere with 5% CO2. A first group of cells was transfected with 1.6 µg of a pool of 3 target-specific lentiviral vector plasmids each encoding 19-25 nucleotides shRNA designed to knock-down ST3GAL2 gene (sc-93118-SH, Santa Cruz Biotechnology, Dallas, Texas, USA). A second group of cells was transfected with 1.6 µg of a negative control shRNA Plasmid-A, encoding a scrambled shRNA sequence that will not lead to the specific degradation of any cellular mRNA (sc-108060, Santa Cruz Biotechnology, Dallas, Texas, USA). The transfections were carried out according to manufacturer’s protocol using X-TremGENETM DNA Transfection Reagent (Sigma-Aldrich, Saint Louis, MO, USA). Each used plasmid contains a puromycin resistance gene for the selection of cells stably expressing shRNAs. Selection was initiated by changing medium with complete DMEM containing 2 μg.ml-1 of puromycin (Thermofisher Scientific, Waltham, MA, USA), and then we obtained HT29-shST3GAL2 pool population. A clonal selection was performed with limited dilution method. Cells selected with puromycin were seeded in 96-well plate until get one cell per well. Each unique cell was grown separately in presence of puromycin until obtention of a clonal population.
Quantitative RT-PCR
Total RNA was extracted using RNeasy® Mini Kit (QIAGEN®, Hilden, Germany) and 2 µg RNA were retro-transcribed using High-Capacity cDNA Reverse Transcription Kit (Applied Biosystems™, California, USA) according to manufacturers’s instructions. Quantitative PCR was performed in 96-well plates (ThermoFisher Scientific, Waltham, MA, USA), using 20 ng cDNA, 10 µl Taqman® Gene Expression Master Mix (Applied Biosystems by ThermoFisher Scientific, Waltham, MA, USA) and 1 µl Taqman™ probe against ST3GAL2 (HS00199480-m1) or 18S (HS99999901-s1) and H2O up to a final volume of 20 µL. Then, the following program was applied: 2 minutes at 50°C and 10 minutes at 95°C, then 40 cycles (15 seconds at 95°C and 1 minute at 60°C, followed by a fluorescence measurement). Fluorescence was quantified using QuantStudio™ Design and Analysis Software v1.3 (AB ThermoFisher Scientific, Waltham, MA, USA). Relative quantity was calculated using the ΔΔCt method.
SSEA-4 detection by immunofluorescence
HT29-shST3GAL2 and HT29-shctrl cells were fixed with 4% paraformaldehyde (16% Formaldehyde Solution (w/v) methanol-free, ThermoFisher Scientific, Waltham, MA, USA) in PBS for 15 minutes at room temperature and permeabilized with HEPES Triton buffer (20 mM HEPES, 300 mM sucrose, 50 mM NaCl, 3 mM MgCl2, 0.5% Triton X-100 (v/v), pH 7.4) for 30 minutes at 4°C. After 3 washes with PBS, non-specific binding sites were saturated for 1 h at room temperature with a blocking solution (PBS complemented with 10% (v/v) goat serum, 1% BSA (w/v), 0.1% Triton X-100 (v/v)). After one wash with PBS buffer containing 0.2% BSA (w/v), immunolabelling was performed with anti SSEA-4 antibody (MC813 ab16287, Abcam, Cambridge, UK) diluted at 1:400 and PNA lectin (Peanut Agglutinin; DIG Glycan Differentiation Kit, Roche, Mannheim, Germany), which recognizes the disaccharide Galβ(1-3)-GalNAc diluted at 1:200 in PBS buffer containing 1% BSA (w/v) overnight at 4°C. After two washes with PBS buffer containing 0.2% BSA (w/v) and 0.1% Tween-20 (v/v), cells were incubated with the secondary antibody Alexa fluo® 546 conjugated (F(ab’)2 fragment of goat anti-mouse IgG (H+L), Molecular probes by Life Technologies, Eugene, Oregon, USA), and with the anti-digoxygenin Dylight 288 (Vector laboratories, Burlingame, CA, USA) used at 1:1000 in PBS-BSA for 15 minutes in dark at 37°C. After washes, nuclei were stained with DAPI (ThermoFisher Scientific, Waltham, MA, USA) at 1 µg.ml-1 in PBS, 5 minutes at room temperature in the dark. After three washes in PBS, cells were mounted on glass slides with Mowiol and sealed with glass coverslips. We used MetaMorph software (Molecular Devices, California, USA) to acquire images with a LEICA microsystem DMI6000B inverted epifluorescence microscope.
ST3GAL2 detection by immunohistochemistry
Paraffin-embedded blocks of four colorectal adenocarcinomas corresponding to four CRC clinical stages were obtained from the Tumor Bank (CRBiolim) of Limoges University Hospital. All samples were used in accordance with French bioethics laws regarding patient information and consent. Ethics approval (CRB-CESSION-2019-003) was obtained from the bioethics committee of the University Hospital Center of Limoges (“Comité médico-scientifique de la tumorothèque de l’Hôpital Dupuytren”). Immunohistochemical analysis was performed on five-μm-thick paraffin sections with anti-ST3GAL2 antibody (1/25, ab254726, Abcam, Cambridge, UK). Slides were automatically processed (Ventana Benchmark ULTRA, Roche, Meylan, France) according to the protocol supplied by the manufacturer. Hematoxylin/Eosin/Saffron (HES) staining was used for histological analyses, while Ki67 staining was used to assess cell proliferation. HES staining was performed with Tissue Tek (Sakura, Alphen aan den Rijn, Netherlands), Ki67 staining with BenchMark Ultra Ventana (Roche Diagnostics, Meylan, France). Images were acquired with NanoZoomer RS 2.0 Hamamatsu (Hamamatsu Photonics, Massy, France).
Cell migration assay
Cell migration assay was performed in a two wells silicone insert to generate a defined cell-free gap (Culture, Insert 2 well, Ibidi, Germany). Cells in suspension after trypsination (70 µl) were put in each well. When cells reached confluence, the insert was removed, and cells were cultivated in a 1% FBS (v/v) DMEM. Measurements of the gap size were performed every day using ImageJ software [40].
Cell invasion transwell assay
Cell invasion assay was performed in a transwell chamber system as described before [41]. Briefly, the membrane (upper side) of transwell chamber (Transwell® Permeable Supports 6.5 mm Insert, 24 Well Plate, 8.0 µm polycarbonate Membrane, Costar®, Corning Incorporated, USA) was precoated with 0.5 mg·ml-1 matrigel (Corning® Matrigel® Basement Membrane Matrix, 354234, Discovery Labware, Inc., Two Oak Park, Bedford, USA), and cells (1×10⁵) were placed in the top chamber. A serum-free medium solution (100 µl) was added in the top chamber, and the lower chamber was loaded with 750 µl of DMEM with 10% FBS (v/v). Cells were incubated during 24 h, 48 h, 72 h and 96 h at 37°C with 5% CO2. Transwell chambers were washed twice with PBS, and cells were fixed with 4% (w/v) paraformaldehyde in PBS during 15 minutes at room temperature. After two washes with PBS, cells were stained with crystal violet 0.2% (w/v) during 15 minutes at room temperature, then cells which remained on the membrane (top chamber side) were wiped out with a cotton swab before observation with binocular magnifying glass Nikon SNZ-745, membranes were illuminated with SCHOTT KL 1600 LED.
In vitro apoptosis detection
A first analysis of apoptosis was made using the Cell Death Detection ELISAPLUS kit (Roche Diagnostics, Sigma-Aldrich, Saint-Louis, MO 63103 USA) as previously described [42]. Chromatin fragments released from the nucleus during apoptosis were quantified from cytosol extracts, which were obtained according to the manufacturer’s protocol.
Apoptosis was also evaluated by flow cytometry using double staining with Annexin V and propidium iodide. Cells (250,000) were centrifuged 10 min at 140 g then washed with 1 ml of PBS/Ca2+. After a second centrifugation, cells were resuspended into 100 µl of PBS/Ca2+ and 5 µl of Annexin V (Thermofisher Scientific, Waltham, MA, USA) were added. After 15 min incubation in dark, 200 µl of PBS/Ca2+ were added. Cells were then labelled with propidium iodide (0.5 mg·ml-1) and 10,000 cells were immediately analyzed with a FACSCalibur (Becton Dickinson) cytometer.
In vitro spheroid formation
Spheroid formation was assesed using Nunclon Sphera 96U Bottom Plate (ThermoScientific™, Rockford, IL, USA). Five hundred cells, into free FBS DMEM medium were seeded per well. The plate was centrifuged 5 min at 1200 g at room temperature, then incubated at 37°C in a humid atmosphere with 5% CO2 for 5 days. Pictures were taken every 24 hours, and perimeters were calculated using ImageJ software.
Protein extraction and western blots
Colorectal tumor and normal tissue samples were first ground in presence of liquid nitrogen. Then total proteins were extracted by solubilizing shredded tissues in a RIPA lysis buffer (50 mM Tris-HCl, 150 mM NaCl, 1% Triton X-100 (v/v), 0.5% sodium deoxycholate (w/v), 0.1% sodium dodecylsulfate (v/v), pH 8) containing a cocktail of protease and phosphatase inhibitors (Roche Applied Science, Mannheim, Germany) for 2 h at 4°C. Total proteins from cell cultures were prepared by solubilizing cell pellets in the same RIPA lysis buffer for 2 h at 4°C. All lysates were centrifuged at 12,000 g for 15 min at 4°C, and the protein concentration in supernatant was determined using Pierce™BCA protein assay kit (ThermoScientific™, Rockford, IL, USA) with bovine serum albumin as a standard. Equal amounts of proteins (50 µg) were resolved by SDS-PAGE using 12% (v/v) polyacrylamide gels for 1 h at 24 mA. Proteins were transferred onto Amersham™ Protra® premium 0.45 µm nitrocellulose membrane (GE Healthcare, Buckinghamshire, UK) for 1 h 30 min at 0.8 mA/cm2. Membranes were blocked with TBST (50 mM Tris, 150 mM NaCl, pH 7.6, 0.1% Tween-20 (v/v)) supplemented with 5% (w/v) non-fat dry milk during 1 h at room temperature, then incubated with mouse anti-ST3GAL2 antibody (ST3Gal II (34-K) sc-100856, Santa Cruz Biotechnology, Dallas, Texas, USA) diluted at 1:1000 in TBST, 2% (w/v) non-fat dry milk or goat anti-GAPDH antibody (AF5718, R&D Systems Minneapolis, USA) diluted at 1:2000 in TBST, 2% (w/v) non-fat dry milk, overnight at 4°C. After three washes with TBST, membranes were incubated with secondary antibodies (anti-goat or anti-mouse HRP-conjugated IgG, Dako, Santa Clara, USA) diluted at 1:2000 in TBST, 2% (w/v) non-fat dry milk for 1 h at room temperature. After three washes in TBST, reactive proteins were visualized with ECL™PrimeWestern blotting system (GE Healthcare, Uppsala, Sweden). For detection and relative quantification of band intensities, we used Amersham Imager 600 device (GE Healthcare, Uppsala, Sweden).
Cell cycle analysis by flow cytometry
Cells (2×10⁶) were collected and centrifuged twice at 140 g for 10 minutes and pellet was resuspended with 2 ml of cold PBS. After a third centrifugation at 140 g for 10 minutes, cells were resuspended in 300 µl of cold PBS and rapidly fixed with 700 µl of cold ethanol (96%). Fixed cells were preserved at -20°C overnight. After three washes by centrifugation with 2 ml of cold PBS, cells were resuspended in 1 ml of PBS and treated with RNase A (Roche Diagnostics, Sigma-Aldrich, Saint-Louis, MO 63103 USA) at 20 units/ml (w/v) for 20 minutes at room temperature. Cells were then labelled with propidium iodide (0.5 mg·ml-1) and 20,000 cells were immediately analyzed by a FACSCalibur (Becton Dickinson) flow cytometer. To determine the percentage of cells analyzed in each phase of the cell cycle, we used the Modfit software.
Tumor xenograft in mice
To establish a subcutaneous xenograft model of human CRC, two groups of mice, each composed of 5 four-week-old female Balb/c nude mice, were used. Mice of the first group were xenografted with 5×10⁵ HT29-shctrl cells in 100 μL of 50/50 PBS-matrigel, injected subcutaneously in each side of the dorsal region. Mice of the second group, were xenografted with 5×10⁵ HT29-shST3GAL2 cells in 100 μL of 50/50 PBS-matrigel, injected in the same way. We measured tumor dimensions every three days by a caliper and calculated the volume with the formula (V=4π/3× LW2/8, where L is tumor length and W is tumor width) [43]. All mice were sacrificed on day 41 and tumors were harvested and weighted. Six tumors from HT29-shctrl cells and 7 tumors from HT29-shST3GAL2 cells were fixed in 4% paraformaldehyde to prepare paraffin sections. HES and Ki67 stainings were used as described in the previous section.
Ethical statement
Institutional review board approval was obtained from the Regional Animal Experimentation Ethics Committee (approval number: APAFIS 23 8 13). All animal experiments and experimental protocols were in accordance with the recommendations of the European Directive of 22 September 2010 (2010/63/EU) on the protection of animals used for scientific purposes. All efforts were made to reduce the number of animals used and to ensure their optimal conditions of well-being before and during each experiment.
Statistical analyses
Difference in sialyltransferase expression between normal and tumoral tissues were compared using Kruskal-Wallis test, performed with Past4 software and expressed as *P<0.05, **P<0.01 and ***P<0.001. Results were expressed as the mean of log2 RSEM (RNA-Seq by Expectation-Maximization) extracted from Firebrowse database (see section 4.1) ± standard error of the mean (SEM). The same statistical tests were used to compare ST3GAL2 gene expression levels according to gender, age and tumor location. (25 patients were not assigned for any CRC stage, so they were not included in this comparison).
For experiments performed in triplicate, statistical significance was evaluated by the two-tailed unpaired Student’s t-test and expressed as: *P<0.05; **P<0.01 and ***P<0.001. All quantitative results were expressed as the mean ± standard deviation (SD) of separate experiments. These statistical analyses were performed using GraphPad Prism 7.
Results
ST3GAL2 is overexpressed in colorectal tumors
We used the FireBrowse database to investigate the role of ST3GAL2 overexpression during colorectal cancer progression. This database contains RNAseq data from 626 patients with colorectal tumors and 51 colorectal normal tissues. The average age of patients is 66.3 years, with a repartition of 53% men and 47% women. We first investigated all sialyltransferase gene expression in colorectal tumor tissues. When we analyze the transcript amounts for each sialyltransferase gene, it appears that fifteen sialyltransferases are down-expressed in tumoral tissues compared to normal tissues (black stars). For four sialyltransferases, no difference has been found, and only ST3GAL2 gene is significantly overexpressed (red stars) in colorectal tumors compared to normal tissues (Figure 1A). ST3GAL2 is poorly documented in cancers. Among the 626 patients, there is no correlation between ST3GAL2 expression and tumor location (colon vs rectum), gender or age of the patients (Table 1). ST3GAL2 is overexpressed from stage I (P<0.001; Figure 1B), and its overexpression slightly increased at stages III and IV.
Figure 1.

ST3GAL2 overexpression in colorectal tumors. (A) COADREAD RNAseq data extracted from Firebrowse database, containing 626 tumor tissues and 51 normal tissues, show that among 20 sialyltransferases, ST3GAL2 is significantly overexpressed in colorectal tumors (red stars). (B) ST3GAL2 is overexpressed at all stages, and it seems slightly more expressed in the two last stages. Average age: 66.3 years; distribution is: 53% men, 47% women. For (A) and (B), bar graph represent mean of log2 RSEM ± SEM, *P<0.05, **P<0.01, ***P<0.001. (C) Expression level of ST3GAL2 was assessed by western blotting assays in colorectal tumor tissues compared to healthy sections of the same patients. (HT: Healthy Tissue; TmT: Tumoral Tissue).
Table 1.
Correlation between ST3GAL2 expression and clinical parameters in patients with CRC
| N | ST3GAL2 expression (Log2 RSEM) | P value | |||
|---|---|---|---|---|---|
| Stage I (105) | Gender | Men | 59 | 9.38 | 0.8921 |
| Women | 46 | 9.43 | |||
| Age | >60 | 76 | 9.46 | 0.08285 | |
| 35-60 | 29 | 9.24 | |||
| Tumor location | Colon | 74 | 9.37 | 0.5181 | |
| Rectum | 31 | 9.48 | |||
| Stage II (229) | Gender | Men | 121 | 9.37 | 0.8982 |
| Women | 108 | 9.34 | |||
| Age | >60 | 179 | 9.36 | 0.6172 | |
| 31-60 | 50 | 9.37 | |||
| Tumor location | Colon | 178 | 9.31 | 0.1938 | |
| Rectum | 51 | 9.51 | |||
| Stage III (179) | Gender | Men | 88 | 9.47 | 0.8287 |
| Women | 91 | 9.52 | |||
| Age | >60 | 120 | 9.48 | 0.4596 | |
| 31-60 | 59 | 9.54 | |||
| Tumor location | Colon | 128 | 9.49 | 0.7614 | |
| Rectum | 51 | 9.51 | |||
| Stage IV (88) | Gender | Men | 51 | 9.49 | 0.3863 |
| Women | 37 | 9.61 | |||
| Age | >60 | 55 | 9.53 | 0.5961 | |
| 35-60 | 33 | 9.56 | |||
| Tumor location | Colon | 64 | 9.52 | 0.743 | |
| Rectum | 24 | 9.59 |
ST3GAL2 expression was extracted from FireBrowse database which contains informations on 626 CRC patients and 51 healthy people. We classified these patients by CRC stages. For each group (stage) we considered ST3GAL2 expression according to gender, age and tumor location. We performed Kruskal-Wallis test to evaluate P value.
To confirm the overexpression of ST3GAL2 at the protein level, we performed western blots on colorectal tumor frozen samples corresponding to different clinical stages and on healthy frozen samples from the same patients using anti-ST3GAL2 antibody. Unfortunately, no biopsies from stage I were available, and the data concerning this stage are missing. ST3GAL2 appeared clearly overexpressed in tumor compared to normal tissues (at least 7.7-fold) whatever the stage analyzed (Figure 1C). The anti-ST3GAL2 antibody was also used for immunohistochemistry on FFPE (formalin-fixed, paraffin-embedded) paired samples. Regardless of the stage studied, there is a more intense ST3GAL2 labelling (brown staining in the Luberkhunien glands) into tumor section compared to healthy section where there is no ST3GAL2 labelling except in the lymphocytes surrounding the Luberkhunien glands (Figure 2). In normal tissue, Ki67 (a proliferation marker) staining was consistent with the proliferative nature of colonic epithelium (Figure 3). Cell proliferation was observed, via Ki67 staining, in the bottom of intestinal crypts as already described [44]. However, in tumor tissues this polarity was abolished and Ki67 staining was more pronounced compared to healthy section (Figure 3), which is in line with the proliferative nature of tumoral tissue. Histological analyses with HES (Hematoxylin Eosin Saffron) staining revealed a loss of glandular architecture and a loss of goblet cell differentiation in tumor section compared to normal section (Figure 3). ST3GAL2 is overexpressed regardless the stage, and this overexpression is associated to a tissue destructuring. These results suggest that ST3GAL2 may be implicated in colorectal tumor progression.
Figure 2.

Immunohistochemistry performed on biopsies from CRC patients. Immunohistochemistry analyses performed with anti-ST3GAL2 antibody on healthy section and tumoral section from biopsies from patients with colorectal tumors at different stages. Patient Pat 44 represents a stage 0 from a woman CRC. Patient Pat 34 represents a stage II from a man and patient Pat 25 represents a stage IV from man. For Pat 8 which represents stage III, healthy and tumoral tissues are present on the same biopsy. ST3GAL2 immunolabelling was more intense in tumoral section (brown staining) compared to healthy section where immunolabelling was only observed in lymphocytes surrounding the Luberkhunien glands. Scale bar: 100 µm. (TmT: Tumor Tissue, HT: Healthy Tissue, M: Muscle, l: intestinal lumina).
Figure 3.

HES and Ki67 stainings performed on biopsies from CRC patients. HES (left panels) and Ki67 (right panels) stainings on healthy and tumoral sections from different stage biopsies. HES staining revealed a classical architecture of healthy tissue with polarized epithelium invaginating in Lieberkühn crypts, while this structured architecture was totally abolished into tumoral section. Ki67 stainings, for their part, were more pronounced in tumoral section which is consistent with the proliferative nature of tumoral tissue. In healthy section, Ki67 staining was only observed in bottom pole of intestinal glands, consistent with the literature. Scale bar: 500 µm.
ST3GAL2 KD decreased tumoral capacities in vitro
To assess the contribution of ST3GAL2 in tumor evolution, we chose to use HT29, a CRC stage II-derived cell line which represents an intermediary stage, between initiation and metastatic stages of tumor. HT29 cell line knock-down (KD) for ST3GAL2 was established using a mix of 3 shRNA. We obtained a polyclonal population of KD cells (pool) with an approximately 60% decrease of ST3GAL2 expression. After clonal selection, we more precisely analyzed two clones, clone 1 which lost about 33% of ST3GAL2 mRNA expression, and the clone 2 which lost about 69% as shown by qRT-PCR in Figure 4A. We confirmed the decrease of ST3GAL2 expression at the protein level by western blotting using an anti-ST3GAL2 antibody (Figure 4B). In HT29-shST3GAL2 pool, clone 1 and clone 2 populations, the expected bands were significantly 3-fold less intense compared to control cells. We completed the characterization of HT29-shST3GAL2 cells by measuring the loss of epitope SSEA-4, the GSL exclusively synthesized by ST3GAL2. There is a lack of SSEA-4 labelling in the HT29-shST3GAL2 cells compared to HT29-shctrl cells, while we still detect SSEA-3, the acceptor substrate of ST3GAL2 (Figure 4C).
Figure 4.

ST3GAL2 KD validation. A. Relative mRNA levels of ST3GAL2 were measured by real time qPCR assays after transfection of shRNA control or shRNA against ST3GAL2 in the colorectal cell line HT29. Bar graph represents mean of ST3GAL2 mRNA relative quantity ± SD, *P<0.05; **P<0.01, ***P<0.001. B. Protein levels of ST3GAL2 were analyzed by western blotting assays in HT29 transfected with shRNA against ST3GAL2 compared to HT29 transfected with shRNA control. Western blots were performed in triplicate, the table shows the ST3GAL2/GAPDH ratio mean ± SD. p values are calculated for each KD cell populations vs HT29-shctrl. *P<0.05, **P<0.01. C. Immunofluorescence labelling of Stage Specific Embryonic Antigen 4 (SSEA-4) (red), SSEA-3 (green) and DNA with DAPI (blue), performed on the different HT29 cells knockdown for ST3GAL2 (HT29-shST3GAL2) and HT29 control cells (HT29-shctrl). Scale bar: 100 µm.
To assess the impact of ST3GAL2 KD on HT29 behavior, we performed functional tests. Preliminary tests were taken on the three HT29 populations (pool, clone 1 and clone 2 cells) to ensure that the effects of KD are not clone-dependent, due to a position effect of shRNA insertion (Figure 5). Proliferation capacities of HT29 cells were determined by counting cells every 24 h for 96 hours using two different methods (Figure 5). The KD of ST3GAL2 induced a cell proliferation decrease which began at 48 h and became significantly more pronounced at 72 h and 96 h (Figure 5A). At 72 h, the number of HT29-shST3GAL2 cl2 cells was 53.3×10³±5.6×10³ compared to 80.4×10³±6.8×10³ for control cells (P=0.037), and this difference increased at 96 h (72.2×10³±11.8×10³ vs 133.4×10³±9.3×10³, P=0.026). We hypothesized that this cell proliferation defect could be due to a disturbance of the cell cycle and/or of the cell death. Since the results obtained with the three populations were similar, we used the clone 2 population, which presented the most important decrease of ST3GAL2 expression, for further investigations.
Figure 5.
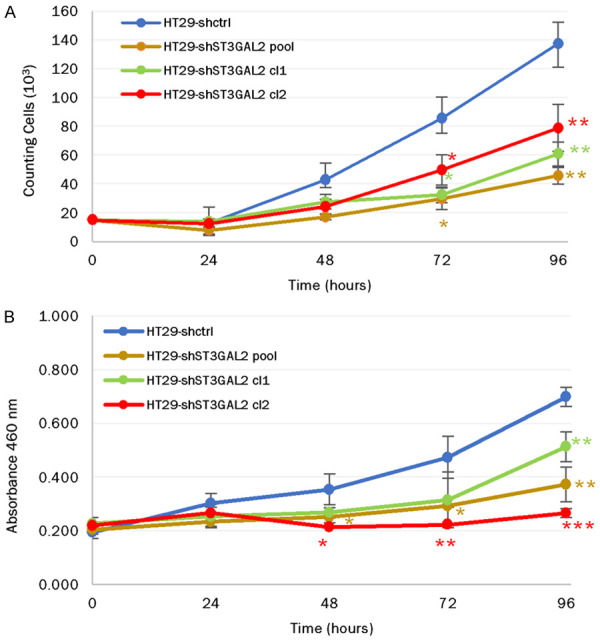
Proliferation assays on the different HT29 population cells: Proliferation capacities of HT29-shctrl, HT29-shST3GAL2 pool, HT29-shST3GAL2 cl1 and HT29-shST3GAL2 cl2 cells were assessed using two different methods, cell counting (A) and CCK8 kit assay (B). Proliferation test with CCK8 kit and counting method gave similar results. Data are represented as mean of counting cells per day ± SD (A) or mean of absorbance at 460 nm per day ± SD (B) from three independent experiments. *P<0.05, **P<0.01, ***P<0.001.
Cell cycle analysis by flow cytometry revealed that the distribution of cells in the different phases of the cell cycle was modified by ST3GAL2 KD (Figure 6A). Almost twice as many cells were in S phase for ST3GAL2 KD cells (49.4%±1.2%) compared to control cells (25.8%±0.2%, P<0.0001) at the expense of the G1 phase (only 39.6%±0.8% of cells for KD cells compared to 64.7%±1.3% (P<0.0001) for control cells).
Figure 6.

Functional tests on HT29 cells. A. Cell cycle analysis by flow cytometry of ST3GAL2 KD and control cells. The percentages correspond to cells in G1 phase, S phase and G2/M phases. B. DNA fragmentation in HT29-shctrl and HT29-shST3GAL2 cells was quantified by ELISA. DNA degradation is expressed relative to control cells. Graph bars represent mean ± SD. C. HT29 cells were stained with Annexin V-FITC and PI, and analyzed by flow cytometry. Percentages represent living cells in lower left panel, cells in apoptosis in lower right panel, and dead cells in upper right panel. D. Migration assays were performed in free FBS medium to detect the cell migration ability of HT29 cells. The gap closure was measured every day and converted in closure percentage. Graph bars represent means of percentage closure ± SD. from three independent experiments. *P<0.05, ***P<0.001. E. Invasion tests: cells were placed in the upper chamber of a transwell insert, and matrigel-transwell assays were performed to detect every 24 h the cell invasion ability of HT29 cells by crystal violet staining of cells on the underside of the membrane. *P<0.05, **P<0.01, ***P<0.001.
Apoptosis rate of HT29-shST3GAL2 was first determined by ELISA cell death based on cytoplasmic histone associated DNA fragments detection. Cells treated with diosgenin, a potent apoptosis inducer, were used as a control [45]. Apoptosis of HT29-shST3GAL2 cells was six-fold higher than for HT29-shctrl cells (Figure 6B). This result was confirmed by double staining Annexin-V/PI (Figure 6C). HT29-shctrl cells displayed a significantly lower proportion of cells in early apoptosis compared to HT29-shST3GAL2 (2.98%±0.41% vs 15.58%±4.16%; P=0.0065), and in late apoptosis (3.44%±0.96% vs 11.95%±1.35%; P=0.0009). Out of 10,000 cells analyzed, living cells represented 86.14%±5.40% of the cell population for HT29-shctrl cells, and only 59.36%±4.90% for HT29-shST3GAL2 cells (P=0.003). Therefore, the decrease in proliferation of HT29-shST3GAL2 cells could be attributed to either an accumulation of cells in S phase and to an increase of apoptosis.
Furthermore, cell migration, assessed with a four days healing test, was significantly reduced in HT29-shST3GAL2 cells compared to HT29-shctrl cells (24 h: 10.0%±0.3% vs 81.4%±18.6%, P=0.0185; 48 h: 23.2%±6.1% vs 100.0%, P=0.0002; 72 h: 70.0%±6.1% vs 100.0%, P=0.0211). Within 48 h, HT29-shctrl cells have completely filled the gap generated by the insert (Figure 6D), while only 23% of the gap was filled by HT29-shST3GAL2 cells after 48 h of culture. (Migration capacities for HT29-shST3GAL2 pool and cl1 were performed and are available on request from the corresponding author.) Invasion capacity was assessed using transwell assay with matrigel. ST3GAL2 silencing induced the loss of invasion ability compared to control cells for which a large number of cells crossed the membrane. Figure 6E shows that from 72 h, control cells crossed the membrane coated by matrigel, whereas only a few KD cells crossed this membrane as shown by the absence of stained cells. Consistently, these results showed that knockdown of ST3GAL2 expression reduced HT29 properties associated to tumor progress.
Knockdown of ST3GAL2 decreased tumor formation in vivo
ST3GAL2 KD highly changed the behavior of xenografted HT29 cells into nude mice. HT29-shctrl or HT29-shST3GAL2 cells (5×10⁵) were injected subcutaneously into both flanks of nude mice to assess tumor formation and growth. After 41 days, when the maximum size of 1 cm3 was reached, all mice were sacrificed, and tumors were harvested. HT29-shST3GAL2 cells formed significantly smaller (4.0-fold) and lighter (5.4-fold) tumors compared to HT29-shctrl cells (mean volume at 41 days: 224.0 mm3±20.7 vs 896.9 mm3±128.2, P<0.0001; mean weight at 41 days: 137.7 mg±18.6 vs 749.8 mg±164.3, P=0.0007) (Figure 7).
Figure 7.

Tumor growth into mice. In vivo tumor formation into nude mice xenografted with HT29-shctrl cells or HT29-shST3GAL2 cells was observed. Knock-down of ST3GAL2 reduced tumor growth in vivo (A). The tumor volume (B) and weight (C) were significantly lower with HT29-shST3GAL2 xenografts. Tumors were named with mice identification number and with letter r (right flank) or l (left flank). Graph bars represent means of volumes and weights ± SD. *P<0.05, **P<0.01, ***P<0.001.
ST3GAL2 detection by immunohistochemistry (Figure 8A, 8B) revealed a less intense labelling of ST3GAL2 (brown staining) within tumors from HT29-shST3GAL2 compared to tumors from HT29-shctrl cells (Figure 8A), which is consistent with the initial expression of ST3GAL2 in HT29 control and KD cells. We noticed that tumors from HT29-shctrl cells presented more necrotic zones (dark brown staining) than tumors from HT29-shST3GAL2 cells, probably due to a faster growth. In these same tumors, Ki67 staining (Figure 8C, 8D) showed that, a lower proportion of HT29-shST3GAL2 cells was under proliferation, which may explain the difference in tumor growth rate.
Figure 8.

Immunohistological analyses of mouse tumors. ST3GAL2 immunohistochemistry was performed on tumors derived from mice xenografted with HT29-shctrl (A) or HT29-shST3GAL2 (B). Ki67 staining of tumors from mice xenografted with HT29-shctrl (C) or HT29-shST3GAL2 (D) cells was also performed. Necrosis zones are indicated with red arrows. Scale bar: 50 µm.
Knock-down of ST3GAL2 impacts spheroid evolution in vitro
Additional experiments were performed to test spheroid formation capacities of HT29-shST3GAL2 cells compared to HT29-shctrl cells. We used specific 96-wells plates where only one spheroid can form into each well. Knock-down of ST3GAL2 did not affect spheroid formation but seems to alter its evolution. At 24 h of culture, spheroids formed from HT29-shctrl cells were more circular compared to HT29-shST3GAL2 spheroids for which we observed loose spheroids. After 120 h of culture, spheroids from HT29-shST3GAL2 cells were more widespread (Figure 9A). Perimeters of these spheroids showed that size of spheroids from HT29-shST3GAL2 cells did not increase compared to spheroids from HT29-shctrl cells (Figure 9B). Perimeters of HT29-shctrl spheroids decreased between 24 h and 48 h because of cell compaction, then spheroid size began to increase at 96 h. HT29-shST3GAL2 spheroids did not have size evolution during 120 h. This result suggests ST3GAL2 is implicated in spheroid evolution.
Figure 9.
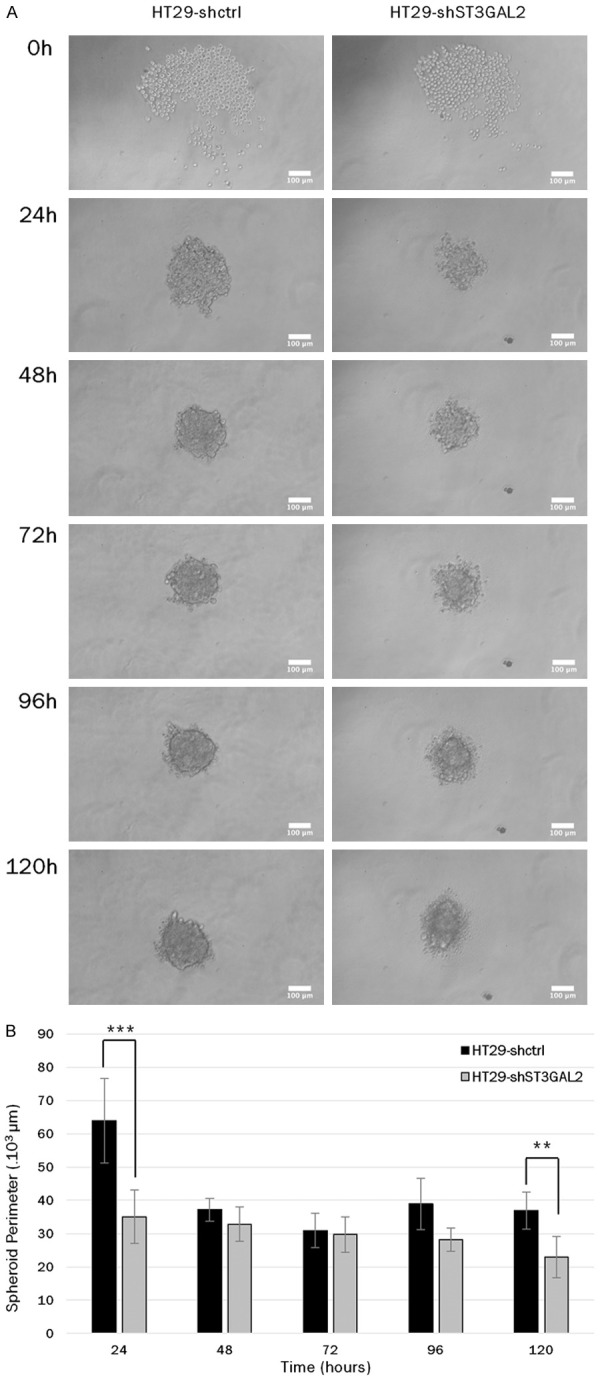
Spheroid formation capacities. A. Capacities of spheroid formation of HT29-shctrl cells and HT29-shST3GAL2 cl2 cells were tested during 120 h using specific 96 well plates. Only one spheroid can form per well, pictures were taken every 24 hours to compare spheroid evolution. Scale bar: 100 µm. B. Spheroid perimeters of HT29-shST3GAL2 were significantly smaller at 24 h and 120 h. **P<0.01, ***P<0.001.
Discussion
Cancer process is an addition of many cellular changes, like the regulation of cell proliferation/death, associated to variation of protein expression (increase of oncogenes and/or decrease of tumor suppressors) and post-translational modifications. All these changes lead to favor cancer cell proliferation, survival and invasion. Among these modifications, the alteration of glycosylation pattern plays a crucial role. Cancer cells are characterized by many changes in glycosylation which lead to heterogeneity in tumoral cell population [11]. Glycans carried by tumoral cells are implicated in several mechanisms of cancer progress such as cell adhesion, migration and invasion [46]. Among all glycosylations, sialylation mediated by ST6GAL1 was largely studied in cancers. ST6GAL1 was shown to be overexpressed in early stages of CRC and implicated in tumorigenesis by adding sialic acid on some membrane glycoproteins, mostly responsible of cell movement, cell death and survival [28]. α2-6 sialylation of β1 integrin by ST6GAL1 prevents cell adhesion to galectin-3 and hence protects cells against apoptosis promoted by galectin-3 [47]. Another α2,6-sialyltransferase, ST6GALNAC5, is responsible of biosynthesis of α-series gangliosides and is overexpressed in breast-metastasis found in brain [48]. Another ganglioside, SSEA-4, the product of ST3GAL2, is implicated in breast and ovarian cancers [38], and in prostate cancer [49]. The presence of this ganglioside favors chemotherapy resistance and the epithelio-mesenchymal transition of cancer cells [38].
In CRC, we observed variations in gene expression relating to sialyltransferases from RNA-Seq databases. One sialyltransferase gene stand outs, ST3GAL2, which is overexpressed in CRC compared to normal tissue. ST3GAL2 is overexpressed in all CRC stages (Figure 1). When we look at ST3GAL2 expression in HT29 cell line by western blot, we can observe comparable levels of ST3GAL2 expression between human CRC samples and HT29 cells. Thus, we chose to use this cell line, which represents an intermediary stage of CRC, as an in vitro model. To study the role of ST3GAL2, we created HT29 cells knock-down for ST3GAL2. We obtained a HT29 clone with a significant decrease of ST3GAL2 expression compared to HT29 control cells (70% decrease of mRNA and near 80% decrease of protein). These cells were used to make xenografts into nude mice. Our in vivo study showed that, when xenografted into nude mice, human CRC HT29-shctrl cells formed 4-fold bigger and 5.4-fold heavier tumors compared to HT29-shST3GAL2 cells. Ki67 staining of these tumors showed a decrease of proliferating cells compared to control cells. These results correlated well with the in vitro studies showing a decrease in proliferation capacities of HT29-shST3GAL2 cells, a higher cell proportion in the S phase of cell cycle, and a 4-fold increase in apoptosis (Figures 5 and 6). The knock-down of ST6GAL1 gave similar results on cell migration capacities and apoptosis rate in ovarian cancer [50]. In a different cellular model, SW948 colorectal cell line, ST6GAL1 overexpression induces an increase of migration capacities [51] but surprisingly abolishes tumorigenicity in vivo [51]. In fact, ST6GAL1 overexpression in SW948 cells increased migration capacities [51,52], while in SW480 cells, ST6GAL1 overexpression decreased migration capacities [52], but protect cells against apoptosis [47]. The effects of ST6GAL1 overexpression seem to be dependent on the cell line used and its origin (cancer stage) [53].
HT29 cells are known to form spheroids under appropriate conditions [54]. First investigations with spheroid experiments showed that ST3GAL2 knock-down altered spheroid evolution. We can suppose that ST3GAL2 overexpression is implicated in spheroid maintenance in vitro and so in tumor evolution. Similar results were observed with ST6GAL1 knock-down in pancreatic cells [55], where this KD altered spheroids growth.
α2-3 sialylation has already been studied in many cancers, like in ovarian cancer [56] where higher expression of ST3GAL1 enhanced migration and invasion capacity of ovarian cancerous cells. It was also studied in pancreatic cancer [57] where the KD of ST3GAL3 and ST3GAL4 in cancerous pancreatic cells led to a decrease of cell migration. We observed similar results with HT29-shST3GAL2 in our study, even if ST3GAL2 acts preferentially on gangliosides while the three other sialyltransferases act preferentially on glycoproteins. Furthermore, α2-3 sialylation catalyzed by ST3GAL2 has not been studied in colorectal cancer context. ST3GAL2 contributes to the synthesis of two gangliosides, GD1a and GT1b, which can, by additional sialylation, lead to three last forms of polysialylated gangliosides, GT1aα, GQ1aβ and GD1α [33,58]. Gangliosides overexpression were frequently observed in tumors, but the underlying mechanism is not fully understood [58]. GSL regulates many cell processes, like apoptosis, cell cycle or cell signaling. A previous study reported that the levels of GM3 ganglioside increased during apoptosis into cutaneous T lymphocyte model, and that a decrease of GM3 synthase (ST3GAL5) reduced apoptosis [59]. GM3 synthase allows (indirectly) synthesis of ganglioside GD2, this one is considered by authors as a receptor of cell death signal but how GD2 acts to transduce this signal is still unexplained [60]. As mentioned before, SSEA-4 is synthesized only by ST3GAL2 as GD1a and GT1b. However, the relative amounts of all of these products remain unknown. We can reasonably assume that colorectal tumor cells display more GD1a ganglioside compared to normal cells in view of ST3GAL2 overexpression. Interestingly, GD1a favors EGFR dimerization, and so activation of the signal transduction when EGF is added, leading to activation of different protein kinases which contribute to cell growth, proliferation and survival [61]. Gangliosides are also involved in cell cycle regulation. Exogenous treatment of mesangial cells with gangliosides GM1 and GM2 lead to a cell cycle arrest via an increase of cyclin dependent kinase inhibitor (CDKI) p21Waf1/Cip1 expression [62]. Thus, it may be assumed that GM1 and GM2 act as cell cycle inhibitors. However, GM1 and GM2 are precursors of GD1a produced by ST3GAL2. Due to the ST3GAL2 overexpression within tumor, we hypothesize that the amounts of GM1 and GM2 are reduced and so their inhibitory effects on cell cycle. Moreover, GD1a, which results from GM1 and GM2, is known to activate EGFR and thus to promote tumorigenesis. A high amount of SSEA-4, an another ganglioside, is associated to poor prognosis in several cancers such as breast cancer [38], liver cancer [36] or lung cancer [63]. Therefore, we can reasonably suppose that ST3GAL2 overexpression could contribute to tumorigenesis by generating more GD1a and SSEA-4.
Recently, Zhang et al. [64] demonstrated the implication of O-glycosylation and GSL-glycosylation in metastatic process of pancreatic cancer. Using a pancreatic metastatic cell line and a non-metastatic cell line as models, they demonstrated a change in expression of genes related to O-glycosylation and GSL-glycosylation, while no significant change was observed for N-glycosylation genes between the two cell lines [64]. For O-glycosylation and GSL-glycosylation, an abundance of α2-3 sialylation on galactose was observed in metastatic cell line compared to non-metastatic cell line [57]. The two sialyltransferases ST3GAL3 and ST3GAL4 are implicated in sLex and sLea synthesis carried by O-glycoproteins. A KD of the corresponding genes decreased invasion capacities and E-selectin binding of pancreatic tumor cells in vitro [57], but the underlying mechanism is not fully understood.
HT29 cells showed a high level of SSEA-4 (Figure 4), while in KD ST3GAL2 cells, SSEA-4 rate significantly decreases. The phenotypes of these modified cells are close to those observed with α2-6 sialylation inhibition due to KD of ST6GAL1. Consequently, the progression of CRC would depend on these two sialylations, α2-6 sialylation by ST6GAL1 and α2-3 sialylation by ST3GAL2.
In addition to GSL, O-glycoproteins can also be sialylated by ST3GAL2 [32]. Consequently, the results we observed are likely combined effects of α2-3 sialylation of GSL and O-glycoproteins. So far, no study has focused on O-glycoproteins sialylated by ST3GAL2 in CRC context. We hypothesize that identification of such O-glycoproteins in HT29 cells may help understanding of the observed changes in proliferation, invasion and migration. Moreover, these glycoproteins could constitute new biomarkers for early stages of CRC, since HT29 represents a stage 2 of this cancer.
Acknowledgements
We are grateful to Bertrand Liagre for his help with ELISA cell death. We are grateful to Alexis Parenté for his help in RNA extraction from tissues, and to Daniel Petit for his help with statistical analyses. This work was supported by a French Ministry of Higher Education and Research doctoral fellowship to MD. The “Ligue contre le cancer Haute-Vienne” partly funded the work.
Disclosure of conflict of interest
None.
References
- 1.Warburg O, Wind F, Negelein E. Über den Stoffwechsel von Tumoren im Körper. Klin Wochenschr. 1926;5:829–832. [Google Scholar]
- 2.Shaw RJ, Cantley LC. Ras, PI(3)K and mTOR signalling controls tumour cell growth. Nature. 2006;441:424–430. doi: 10.1038/nature04869. [DOI] [PubMed] [Google Scholar]
- 3.Kroemer G, Pouyssegur J. Tumor cell metabolism: cancer’s Achilles’ heel. Cancer Cell. 2008;13:472–482. doi: 10.1016/j.ccr.2008.05.005. [DOI] [PubMed] [Google Scholar]
- 4.Varki A, Cummings RD, Esko JD, Freeze HH, Stanley P, Bertozzi CR, Hart GW, Etzler ME, editors. Cold Spring Harbor (NY): Cold Spring Harbor Laboratory Press; 2009. Essentials of glycobiology. [PubMed] [Google Scholar]
- 5.Varki A, Kannagi R, Toole B, Stanley P. Glycosylation Changes in Cancer. In: Varki A, Cummings RD, Esko JD, Stanley P, Hart GW, Aebi M, Darvill AG, Kinoshita T, Packer NH, Prestegard JH, Schnaar RL, Seeberger PH, editors. Essentials of Glycobiology. 3rd edition. Cold Spring Harbor (NY): Cold Spring Harbor Laboratory Press; 2015. [Google Scholar]
- 6.Kornfeld R, Kornfeld S. Assembly of asparagine-linked oligosaccharides. Annu Rev Biochem. 1985;54:631–664. doi: 10.1146/annurev.bi.54.070185.003215. [DOI] [PubMed] [Google Scholar]
- 7.Jang H, Kim Tae W, Yoon S, Choi SY, Kang TW, Kim SY, Kwon YW, Cho EJ, Youn HD. O-GlcNAc regulates pluripotency and reprogramming by directly acting on core components of the pluripotency network. Cell Stem Cell. 2012;11:62–74. doi: 10.1016/j.stem.2012.03.001. [DOI] [PubMed] [Google Scholar]
- 8.Shental-Bechor D, Levy Y. Folding of glycoproteins: toward understanding the biophysics of the glycosylation code. Curr Opin Struct Biol. 2009;19:524–533. doi: 10.1016/j.sbi.2009.07.002. [DOI] [PubMed] [Google Scholar]
- 9.Varki A. Biological roles of glycans. Glycobiology. 2017;27:3–49. doi: 10.1093/glycob/cww086. [DOI] [PMC free article] [PubMed] [Google Scholar]
- 10.Iwahana H, Yakymovych I, Dubrovska A, Hellman U, Souchelnytskyi S. Glycoproteome profiling of transforming growth factorbeta (TGFbeta) signaling: nonglycosylated cell death-inducing DFF-like effector A inhibits TGFbeta1-dependent apoptosis. Proteomics. 2006;6:6168–6180. doi: 10.1002/pmic.200600384. [DOI] [PubMed] [Google Scholar]
- 11.Pinho SS, Reis CA. Glycosylation in cancer: mechanisms and clinical implications. Nat Rev Cancer. 2015;15:540–555. doi: 10.1038/nrc3982. [DOI] [PubMed] [Google Scholar]
- 12.Costa AF, Campos D, Reis CA, Gomes C. Targeting glycosylation: a new road for cancer drug discovery. Trends Cancer. 2020;6:757–766. doi: 10.1016/j.trecan.2020.04.002. [DOI] [PubMed] [Google Scholar]
- 13.Rodrigues JG, Balmaña M, Macedo JA, Poças J, Fernandes Â, de-Freitas-Junior JCM, Pinho SS, Gomes J, Magalhães A, Gomes C, Mereiter S, Reis CA. Glycosylation in cancer: selected roles in tumour progression, immune modulation and metastasis. Cell Immunol. 2018;333:46–57. doi: 10.1016/j.cellimm.2018.03.007. [DOI] [PubMed] [Google Scholar]
- 14.Du Y, Li D, Li N, Su C, Yang C, Lin C, Chen M, Wu R, Li X, Hu G. POFUT1 promotes colorectal cancer development through the activation of notch1 signaling. Cell Death Dis. 2018;9:995. doi: 10.1038/s41419-018-1055-2. [DOI] [PMC free article] [PubMed] [Google Scholar]
- 15.Dong S, Wang Z, Huang B, Zhang J, Ge Y, Fan Q, Wang Z. Bioinformatics insight into glycosyltransferase gene expression in gastric cancer: POFUT1 is a potential biomarker. Biochem Biophys Res Commun. 2017;483:171–177. doi: 10.1016/j.bbrc.2016.12.172. [DOI] [PubMed] [Google Scholar]
- 16.Chabanais J, Labrousse F, Chaunavel A, Germot A, Maftah A. POFUT1 as a promising novel biomarker of colorectal cancer. Cancers (Basel) 2018;10:411. doi: 10.3390/cancers10110411. [DOI] [PMC free article] [PubMed] [Google Scholar]
- 17.Holst S, Wuhrer M, Rombouts Y. Glycosylation characteristics of colorectal cancer. Adv Cancer Res. 2015;126:203–256. doi: 10.1016/bs.acr.2014.11.004. [DOI] [PubMed] [Google Scholar]
- 18.Vajaria BN, Patel PS. Glycosylation: a hallmark of cancer? Glycoconj J. 2017;34:147–156. doi: 10.1007/s10719-016-9755-2. [DOI] [PubMed] [Google Scholar]
- 19.Very N, Lefebvre T, El Yazidi-Belkoura I. Drug resistance related to aberrant glycosylation in colorectal cancer. Oncotarget. 2017;9:1380–1402. doi: 10.18632/oncotarget.22377. [DOI] [PMC free article] [PubMed] [Google Scholar]
- 20.Swindall AF, Bellis SL. Sialylation of the fas death receptor by ST6Gal-I provides protection against fas-mediated apoptosis in colon carcinoma cells. J Biol Chem. 2011;286:22982–22990. doi: 10.1074/jbc.M110.211375. [DOI] [PMC free article] [PubMed] [Google Scholar]
- 21.Wang X, Zhang Y, Lin H, Liu Y, Tan Y, Lin J, Gao F, Lin S. Alpha2,3-sialyltransferase III knockdown sensitized ovarian cancer cells to cisplatin-induced apoptosis. Biochem Biophys Res Commun. 2017;482:758–763. doi: 10.1016/j.bbrc.2016.11.107. [DOI] [PubMed] [Google Scholar]
- 22.Gillespie W, Kelm S, Paulson JC. Cloning and expression of the gal beta 1, 3GalNAc alpha 2,3-sialyltransferase. J Biol Chem. 1992;267:21004–21010. [PubMed] [Google Scholar]
- 23.Paulson JC, Colley KJ. Glycosyltransferases. Structure, localization, and control of cell type-specific glycosylation. J Biol Chem. 1989;264:17615–17618. [PubMed] [Google Scholar]
- 24.Kurosawa N, Kojima N, Inoue M, Hamamoto T, Tsuji S. Cloning and expression of gal beta 1,3GalNAc-specific GalNAc alpha 2,6-sialyltransferase. J Biol Chem. 1994;269:19048–19053. [PubMed] [Google Scholar]
- 25.Kojima N, Yoshida Y, Kurosawa N, Lee YC, Tsuji S. Enzymatic activity of a developmentally regulated member of the sialyltransferase family (STX): evidence for alpha 2,8-sialyltransferase activity toward N-linked oligosaccharides. FEBS Lett. 1995;360:1–4. doi: 10.1016/0014-5793(95)00059-i. [DOI] [PubMed] [Google Scholar]
- 26.Duffy MJ. Carcinoembryonic antigen as a marker for colorectal cancer: is it clinically useful? Clin Chem. 2001;47:624–630. [PubMed] [Google Scholar]
- 27.Park IJ, Choi GS, Jun SH. Prognostic value of serum tumor antigen CA19-9 after curative resection of colorectal cancer. Anticancer Res. 2009;29:4303–4308. [PubMed] [Google Scholar]
- 28.Zhang S, Lu J, Xu Z, Zou X, Sun X, Xu Y, Shan A, Lu J, Yan X, Cui Y, Yan W, Du Y, Gu J, Zheng M, Feng B, Zhang Y. Differential expression of ST6GAL1 in the tumor progression of colorectal cancer. Biochem Biophys Res Commun. 2017;486:1090–1096. doi: 10.1016/j.bbrc.2017.03.167. [DOI] [PubMed] [Google Scholar]
- 29.Ogawa T, Hirohashi Y, Murai A, Nishidate T, Okita K, Wang L, Ikehara Y, Satoyoshi T, Usui A, Kubo T, Nakastugawa M, Kanaseki T, Tsukahara T, Kutomi G, Furuhata T, Hirata K, Sato N, Mizuguchi T, Takemasa I, Torigoe T. ST6GALNAC1 plays important roles in enhancing cancer stem phenotypes of colorectal cancer via the Akt pathway. Oncotarget. 2017;8:112550–112564. doi: 10.18632/oncotarget.22545. [DOI] [PMC free article] [PubMed] [Google Scholar]
- 30.Tsuji S, Takashima S. ST3 Beta-Galactoside Alpha-2,3-Sialyltransferase 2 (ST3GAL2) In: Taniguchi N, Honke K, Fukuda M, Narimatsu H, Yamaguchi Y, Angata T, editors. Handbook of glycosyltransferases and related genes. Tokyo: Springer Japan; 2014. pp. 645–656. [Google Scholar]
- 31.Giordanengo V, Bannwarth S, Laffont C, Miecem V, Harduin-Lepers A, Delannoy P, Lefebvre JC. Cloning and expression of cDNA for a human Gal(beta1-3)GalNAc alpha2,3-sialyltransferase from the CEM T-cell line. Eur J Biochem. 1997;247:558–566. doi: 10.1111/j.1432-1033.1997.00558.x. [DOI] [PubMed] [Google Scholar]
- 32.Kim YJ, Kim KS, Kim SH, Kim CH, Ko JH, Choe IS, Tsuji S, Lee YC. Molecular cloning and expression of human Galb1,3GalNAc a2,3-sialyltransferase (hST3Gal II) Biochem Biophys Res Commun. 1996;228:324–7. doi: 10.1006/bbrc.1996.1660. [DOI] [PubMed] [Google Scholar]
- 33.Sturgill ER, Aoki K, Lopez PHH, Colacurcio D, Vajn K, Lorenzini I, Majić S, Yang WH, Heffer M, Tiemeyer M, Marth JD, Schnaar RL. Biosynthesis of the major brain gangliosides GD1a and GT1b. Glycobiology. 2012;22:1289–1301. doi: 10.1093/glycob/cws103. [DOI] [PMC free article] [PubMed] [Google Scholar]
- 34.Saito S, Aoki H, Ito A, Ueno S, Wada T, Mitsuzuka K, Satoh M, Arai Y, Miyagi T. Human α2,3-sialyltransferase (ST3Gal II) is a stage-specific embryonic antigen-4 synthase. J Biol Chem. 2003;278:26474–26479. doi: 10.1074/jbc.M213223200. [DOI] [PubMed] [Google Scholar]
- 35.Kannagi R, Cochran NA, Ishigami F, Hakomori S, Andrews PW, Knowles BB, Solter D. Stage-specific embryonic antigens (SSEA-3 and -4) are epitopes of a unique globo-series ganglioside isolated from human teratocarcinoma cells. EMBO J. 1983;2:2355–2361. doi: 10.1002/j.1460-2075.1983.tb01746.x. [DOI] [PMC free article] [PubMed] [Google Scholar]
- 36.Kuo HH, Lin RJ, Hung JT, Hsieh CB, Hung TH, Lo FY, Ho MY, Yeh CT, Huang YL, Yu J, Yu AL. High expression FUT1 and B3GALT5 is an independent predictor of postoperative recurrence and survival in hepatocellular carcinoma. Sci Rep. 2017;7:10750. doi: 10.1038/s41598-017-11136-w. [DOI] [PMC free article] [PubMed] [Google Scholar]
- 37.Sivasubramaniyan K, Harichandan A, Schilbach K, Mack AF, Bedke J, Stenzl A, Kanz L, Niederfellner G, Bühring HJ. Expression of stage-specific embryonic antigen-4 (SSEA-4) defines spontaneous loss of epithelial phenotype in human solid tumor cells. Glycobiology. 2015;25:902–917. doi: 10.1093/glycob/cwv032. [DOI] [PMC free article] [PubMed] [Google Scholar]
- 38.Aloia A, Petrova E, Tomiuk S, Bissels U, Déas O, Saini M, Zickgraf FM, Wagner S, Spaich S, Sütterlin M, Schneeweiss A, Reitberger M, Rüberg S, Gerstmayer B, Agorku D, Knöbel S, Terranegra A, Falleni M, Soldati L, Sprick MR, Trumpp A, Judde JG, Bosio A, Cairo S, Hardt O. The sialyl-glycolipid stage-specific embryonic antigen 4 marks a subpopulation of chemotherapy-resistant breast cancer cells with mesenchymal features. Breast Cancer Res. 2015;17:146. doi: 10.1186/s13058-015-0652-6. [DOI] [PMC free article] [PubMed] [Google Scholar]
- 39.Lou YW, Wang PY, Yeh SC, Chuang PK, Li ST, Wu CY, Khoo KH, Hsiao M, Hsu TL, Wong CH. Stage-specific embryonic antigen-4 as a potential therapeutic target in glioblastoma multiforme and other cancers. Proc Natl Acad Sci U S A. 2014;111:2482–2487. doi: 10.1073/pnas.1400283111. [DOI] [PMC free article] [PubMed] [Google Scholar]
- 40.Schneider CA, Rasband WS, Eliceiri KW. NIH image to ImageJ: 25 years of image analysis. Nat Methods. 2012;9:671–675. doi: 10.1038/nmeth.2089. [DOI] [PMC free article] [PubMed] [Google Scholar]
- 41.Zhao S, Sun H, Jiang W, Mi Y, Zhang D, Wen Y, Cheng D, Tang H, Wu S, Yu Y, Liu X, Cui W, Zhang M, Sun X, Zhou Z, Peng Z, Yan D. miR-4775 promotes colorectal cancer invasion and metastasis via the Smad7/TGFβ-mediated epithelial to mesenchymal transition. Mol Cancer. 2017;16:12. doi: 10.1186/s12943-017-0585-z. [DOI] [PMC free article] [PubMed] [Google Scholar]
- 42.Lepage C, Léger DY, Bertrand J, Martin F, Beneytout JL, Liagre B. Diosgenin induces death receptor-5 through activation of p38 pathway and promotes TRAIL-induced apoptosis in colon cancer cells. Cancer Lett. 2011;301:193–202. doi: 10.1016/j.canlet.2010.12.003. [DOI] [PubMed] [Google Scholar]
- 43.Lu J, Liong M, Li Z, Zink JI, Tamanoi F. Biocompatibility, biodistribution, and drug-delivery efficiency of mesoporous silica nanoparticles for cancer therapy in animals. Small. 2010;6:1794–1805. doi: 10.1002/smll.201000538. [DOI] [PMC free article] [PubMed] [Google Scholar]
- 44.Potten CS, Loeffler M. Stem cells: attributes, cycles, spirals, pitfalls and uncertainties. Lessons for and from the crypt. Development. 1990;110:1001–1020. doi: 10.1242/dev.110.4.1001. [DOI] [PubMed] [Google Scholar]
- 45.Sethi G, Shanmugam MK, Warrier S, Merarchi M, Arfuso F, Kumar AP, Bishayee A. Pro-apoptotic and anti-cancer properties of diosgenin: a comprehensive and critical review. Nutrients. 2018;10:645. doi: 10.3390/nu10050645. [DOI] [PMC free article] [PubMed] [Google Scholar]
- 46.Pinho SS, Reis CA, Paredes J, Magalhães AM, Ferreira AC, Figueiredo J, Xiaogang W, Carneiro F, Gärtner F, Seruca R. The role of N-acetylglucosaminyltransferase III and V in the post-transcriptional modifications of E-cadherin. Hum Mol Genet. 2009;18:2599–2608. doi: 10.1093/hmg/ddp194. [DOI] [PubMed] [Google Scholar]
- 47.Zhuo Y, Chammas R, Bellis SL. Sialylation of beta1 integrins blocks cell adhesion to galectin-3 and protects cells against galectin-3-induced apoptosis. J Biol Chem. 2008;283:22177–22185. doi: 10.1074/jbc.M8000015200. [DOI] [PMC free article] [PubMed] [Google Scholar]
- 48.Drolez A, Vandenhaute E, Delannoy CP, Dewald JH, Gosselet F, Cecchelli R, Julien S, Dehouck MP, Delannoy P, Mysiorek C. ST6GALNAC5 expression decreases the interactions between breast cancer cells and the human blood-brain barrier. Int J Mol Sci. 2016;17:1309. doi: 10.3390/ijms17081309. [DOI] [PMC free article] [PubMed] [Google Scholar]
- 49.Nakamura Y, Miyata Y, Matsuo T, Shida Y, Hakariya T, Ohba K, Taima T, Ito A, Suda T, Hakomori SI, Saito S, Sakai H. Stage-specific embryonic antigen-4 is a histological marker reflecting the malignant behavior of prostate cancer. Glycoconj J. 2019;36:409–418. doi: 10.1007/s10719-019-09882-2. [DOI] [PMC free article] [PubMed] [Google Scholar]
- 50.Ou L, He X, Liu N, Song Y, Li J, Gao L, Huang X, Deng Z, Wang X, Lin S. Sialylation of FGFR1 by ST6Gal-I overexpression contributes to ovarian cancer cell migration and chemoresistance. Mol Med Rep. 2020;21:1449–1460. doi: 10.3892/mmr.2020.10951. [DOI] [PMC free article] [PubMed] [Google Scholar]
- 51.Chiricolo M, Malagolini N, Bonfiglioli S, Dall’Olio F. Phenotypic changes induced by expression of beta-galactoside alpha2,6 sialyltransferase I in the human colon cancer cell line SW948. Glycobiology. 2006;16:146–154. doi: 10.1093/glycob/cwj045. [DOI] [PubMed] [Google Scholar]
- 52.Venturi G, Ferreira IG, Pucci M, Ferracin M, Malagolini N, Chiricolo M, Dall’Olio F. Impact of sialyltransferase ST6GAL1 overexpression on different colon cancer cell types. Glycobiology. 2019;29:684–695. doi: 10.1093/glycob/cwz053. [DOI] [PubMed] [Google Scholar]
- 53.Jung YR, Park JJ, Jin YB, Cao YJ, Park MJ, Kim EJ, Lee M. Silencing of ST6Gal I enhances colorectal cancer metastasis by down-regulating KAI1 via exosome-mediated exportation and thereby rescues integrin signaling. Carcinogenesis. 2016;37:1089–1097. doi: 10.1093/carcin/bgw091. [DOI] [PubMed] [Google Scholar]
- 54.Chung YC, Chiang HC, Chang H, Lin CC, Lo LT, Wang AY, Chou KF, Hsu CP. Longan flower proanthocyanidins induce apoptosis in HT-29 colorectal carcinoma spheroids. J Cancer Res Ther. 2018;14:S388–S393. doi: 10.4103/0973-1482.176170. [DOI] [PubMed] [Google Scholar]
- 55.Schultz MJ, Holdbrooks AT, Chakraborty A, Grizzle WE, Landen CN, Buchsbaum DJ, Conner MG, Arend RC, Yoon KJ, Klug CA, Bullard DC, Kesterson RA, Oliver PG, O’Connor AK, Yoder BK, Bellis SL. The tumor-associated glycosyltransferase ST6Gal-I regulates stem cell transcription factors and confers a cancer stem cell phenotype. Cancer Res. 2016;76:3978–3988. doi: 10.1158/0008-5472.CAN-15-2834. [DOI] [PMC free article] [PubMed] [Google Scholar]
- 56.Wen KC, Sung PL, Hsieh SL, Chou YT, Lee OK, Wu CW, Wang PH. α2,3-sialyltransferase type I regulates migration and peritoneal dissemination of ovarian cancer cells. Oncotarget. 2017;8:29013–29027. doi: 10.18632/oncotarget.15994. [DOI] [PMC free article] [PubMed] [Google Scholar]
- 57.Guerrero PE, Miró L, Wong BS, Massaguer A, Martínez-Bosch N, de Llorens R, Navarro P, Konstantopoulos K, Llop E, Peracaula R. Knockdown of α2,3-sialyltransferases impairs pancreatic cancer cell migration, invasion and e-selectin-dependent adhesion. Int J Mol Sci. 2020;21:6239. doi: 10.3390/ijms21176239. [DOI] [PMC free article] [PubMed] [Google Scholar]
- 58.Groux-Degroote S, Guérardel Y, Delannoy P. Gangliosides: structures, biosynthesis, analysis, and roles in cancer. Chembiochem. 2017;18:1146–1154. doi: 10.1002/cbic.201600705. [DOI] [PubMed] [Google Scholar]
- 59.De Maria R, Lenti L, Malisan F, d’Agostino F, Tomassini B, Zeuner A, Rippo MR, Testi R. Requirement for GD3 ganglioside in CD95- and ceramide-induced apoptosis. Science. 1997;277:1652–1655. doi: 10.1126/science.277.5332.1652. [DOI] [PubMed] [Google Scholar]
- 60.Doronin II, Vishnyakova PA, Kholodenko IV, Ponomarev ED, Ryazantsev DY, Molotkovskaya IM, Kholodenko RV. Ganglioside GD2 in reception and transduction of cell death signal in tumor cells. BMC Cancer. 2014;14:295. doi: 10.1186/1471-2407-14-295. [DOI] [PMC free article] [PubMed] [Google Scholar]
- 61.Liu Y, Li R, Ladisch S. Exogenous ganglioside GD1a enhances epidermal growth factor receptor binding and dimerization. J Biol Chem. 2004;279:36481–36489. doi: 10.1074/jbc.M402880200. [DOI] [PubMed] [Google Scholar]
- 62.Masson E, Wiernsperger N, Lagarde M, Bawab Samer E. Glucosamine induces cell-cycle arrest and hypertrophy of mesangial cells: implication of gangliosides. Biochem J. 2005;388:537–544. doi: 10.1042/BJ20041506. [DOI] [PMC free article] [PubMed] [Google Scholar]
- 63.Gottschling S, Jensen K, Warth A, Herth FJ, Thomas M, Schnabel PA, Herpel E. Stage-specific embryonic antigen-4 is expressed in basaloid lung cancer and associated with poor prognosis. Eur Respir J. 2013;41:656–663. doi: 10.1183/09031936.00225711. [DOI] [PubMed] [Google Scholar]
- 64.Zhang T, van Die I, Tefsen B, van Vliet SJ, Laan LC, Zhang J, Ten Dijke P, Wuhrer M, Belo AI. Differential O- and glycosphingolipid glycosylation in human pancreatic adenocarcinoma cells with opposite morphology and metastatic behavior. Front Oncol. 2020;10:732. doi: 10.3389/fonc.2020.00732. [DOI] [PMC free article] [PubMed] [Google Scholar]