

ABSTRACT
Evidence for the validity and reliability of the World Health Organization’s 10-item vaccine hesitancy scale (VHS) in different settings is not sufficient, especially for criteria validity. This study aimed to assess the validity and reliability of the VHS using child vaccination data in China. A cross-sectional survey was performed with parents of 19–48-month-old children at six vaccination clinics in Wuxi City between September and October 2020. The VHS was revised to category A (expanded program on immunization, EPI) VHS and category B (Non-EPI) VHS. Factor analysis was used to confirm the latent domain and to assess the model structure. The average variance extracted (AVE) was calculated to assess convergent validity, and Cronbach’s α and composite reliability (CR) were used to determine internal consistency. The association between VHS scores and children’s vaccination status was examined to assess criteria validity using logistic regression. The survey response rate was 75.3% (n = 802). Two factors were identified, explaining 64.60% and 63.34% of the common variance in categories A and B VHS, respectively. The Cronbach’s α of > 0.7 and CR of >0.7 in the scale indicated the VHS has acceptable internal consistency. The AVE values indicated that convergent validity was not ideal for the VHS. There were no statistically significant associations between VHS scores and vaccination status, indicating that the criterion validity was not ideal. The VHS needs improvement before becoming a standard survey tool.
KEYWORDS: Vaccine hesitancy scale, scale reliability, scale validity, China
Introduction
As early as the 18th century, people hesitated to vaccinate against smallpox.1 One of the most remarkable pieces of evidence of this is an anti-vaccine picture published in the magazine Punch during this time period.2 In the picture, people who received smallpox vaccination developed features of cows. In the mid-1970s, anti-vaccine movements reemerged because it was reported that 36 children experienced serious adverse effects after receiving the diphtheria, tetanus, and pertussis vaccine (DTP).2 In the 21st century, the Internet has become an unprecedented, rapid, and effective tool to propagate anti-vaccine messages.3 According to the World Health Organization (WHO), vaccine hesitancy was considered one of the ten issues threatening global health in 2019.4
Because vaccine hesitancy has the potential to contribute to a decrease in vaccine uptake, it could cause the emergence and reemergence of vaccine-preventable diseases. For example, more than 100,000 pertussis cases were reported in the UK after anti-vaccine movements against DTP emerged in the mid-1970s.2 The 2014–15 Disneyland measles outbreak, which reported the highest number of measles cases in the USA in two decades, attracted significant attention, and vaccine hesitancy was considered as the cause of this outbreak.5
In 2012, WHO defined the term “vaccine hesitancy” as follows: the refusal or delay in acceptance of vaccination despite availability of vaccination services.6 There is a continuum of vaccine hesitancy, between the two extremes of completely accepting and completely refusing all vaccines. It is influenced by complex factors, including confidence (including lack of confidence in vaccine and healthcare workers), complacency (such as not paying attention to the need for vaccines), and convenience (such as high price).6
Because of this complexity, it is crucial to develop a standardized survey tool to measure, evaluate, and compare vaccine hesitancy in different settings and over time. Work of this nature has been developed since 2011. Various survey tools, including the parent attitudes about childhood vaccines (PACV) scale with three domains,7 the vaccine confidence scale with three domains,8,9 the vaccination attitudes examination scale with three domains,10 the knowledge of vaccination scale with one domain,11 and caregiver vaccination attitudes scale with three domains,12 have been developed. Two systematic reviews evaluating tools measuring parental vaccine hesitancy found that there existed heterogeneity in the survey tools and many tools were not validated.13,14 In 2015, the 10-item vaccine hesitancy scale (VHS) was developed by the Strategic Advisory Group of Experts through various methods, including systematic review and expert consultation.15 This tool has been validated in several countries.16–20 However, these findings are inconsistent. Four studies reported two domains being identified in the VHS,16–19 and one study reported three domains being identified.20 Most studies suggested that some items need to be deleted to improve the scale’s construct validity, but the items to be deleted in the different studies varied. In addition to internal consistency and construct validity, criterion validity is also an important index. Only one study used vaccination records to explore the association between the scale and children’s vaccination status to evaluate the criteria validity of this scale.20 VHS scores were related to vaccination status and not related to on-time vaccination.20 The criteria validity of the VHS needs to be assessed in more studies. Meanwhile, this scale needs to be comprehensively validated in China. In China, immunization programs should be considered in the measurement. There are two types of vaccination programs in China: the Expanded Program on Immunization (EPI) and non-EPI vaccines. EPI vaccines, also known as category A vaccines, are free and mandatory, while non-EPI vaccines, also known as category B vaccines, are optional and billed. Different types of vaccines might result in different hesitancy levels and different vaccination statuses.
Our study aims to describe and examine the validity and reliability of the VHS using child vaccination data in China, including the scale’s structure, internal consistency, convergent validity, and criterion validity.
Methods
Study design and participants
This cross-sectional study was performed in Wuxi City, China, between September and October of 2020. Participants were recruited from local vaccination clinics. The study was approved by the Ethics Committee of the Wuxi Center for Disease Control and Prevention (2020No10). The sampling method for vaccination clinics has been shown in a previous study.21 Areas (counties) in Wuxi were divided into three groups according to gross domestic product in 2019 and one area was selected randomly in each group; then two clinics in each area were sampled using the simple randomization technique. All parents who brought their children to clinics received a paper-questionnaire and an informed consent form during the survey period. They were informed of the purpose of the investigation and anonymity of the data. The parents who agreed to participate in the survey signed the informed consent form and completed the questionnaire. Children aged 19–48 months were included in the survey because the previous study suggested that this age was a suitable time to collect parental views on vaccines, as the children would have received most of their vaccination doses by this age range.7 We excluded children who did not have a unique vaccination identification (ID) number or a child who was not born in Wuxi city. Parents were encouraged to respond to all questions and received a gift worth RMB 5 when they completed the questionnaire.
Measurement
The VHS was translated into Chinese. The scale was independently translated into Chinese by two researchers. These two editions were then translated back into English by two language professionals. An expert committee consisting of experienced researchers in vaccination work, language professionals, and sociologists reviewed the two editions and developed the first Chinese edition. The pilot study was performed in Wuxi City (approximately 50 respondents) to assess the first edition. The main purpose of the pilot study was to determine whether parents could understand the scale and the time needed to complete the scale. It was found that some parents were puzzled at items (L5 and L10) and about one minute was needed to complete this scale. The completing time was considered to be acceptable. Without changing the original meaning of the VHS, we adjusted the Chinese expression of items L5 and L10 and final edition was developed.
To distinguish category A and B vaccines, we added “category A” and “category B” before “vaccine” in the scale. For example, the description of the L2 item was “Childhood vaccines were effective. We revised it to “Category A childhood vaccines are effective” and “Category B childhood vaccines are effective.” A five-point Likert scale was used to answer the VHS (strongly disagree, 1 point; disagree, 2 points; not sure, 3 points; agree, 4 points; or strongly agree, 5 points). In addition to vaccine hesitancy, parents and children’s socio-demographics were also collected.
Vaccination records collection
Vaccination records were derived from an electronic information system using the ID number on November 18, 2020. There were eight types of category A vaccines in EPI: Bacillus Calmette–Guérin vaccine (BCG), hepatitis B vaccine (HepB), polio vaccine (PV), DTP, measles-containing vaccine (MCV), Japanese encephalitis vaccine (JEV), hepatitis A vaccine (HepA), and meningococcal polysaccharide vaccine type A (MPSV-A)/meningococcal polysaccharide vaccine type A and C (MPSV-AC).22 There are more than 20 types of category B vaccines in non-EPI, including enterovirus 71 vaccine (EV71), seasonal influenza vaccine (SIV), pneumococcal polysaccharide conjugate vaccine (PCV), Haemophilus influenzae type b vaccine (Hib), rotavirus vaccine, human papillomavirus vaccine (HPV), some combined vaccines (e.g., DTP and Hib combined vaccine; DTP–Hib), and some alternatives to category A vaccines.
Data analysis
Vaccination status
We calculated the delay status for the children’s category A vaccines. The delay calculation method was derived from previous studies.7,23 The delay was determined as the actual vaccination date minus the recommended vaccination date. Delays in BCG, HepB1, HepB2, HepB3, PV1, PV2, PV3, DTP1, DTP2, DTP3, MCV1, and JEV1 were included in the analyses. HepA was administered at 18 months, which was close to the minimum age of the included children, making it impossible to calculate this vaccine’s delay. The meningococcal polysaccharide-containing vaccines were also not included in the analyses because the recommended schedules of MPSV-A and MPSV-AC were different and there were corresponding alternative category B vaccines, making it difficult to calculate the delay. The vaccination schedules are provided in Table 1. Vaccination was regarded as the outcome indicator of category B vaccines, and we included EV71, SIV, and PCV in the analyses.20
Table 1.
Vaccination schedule in the Expanded Program on Immunization
| Vaccine | Dose | Recommended age | Age in days when delay count initiated | Maximum number of possible delay at 19 months (580 days) |
|---|---|---|---|---|
| BCG | 1 | 1 day | 31 | 580–31 = 549 |
| HepB | 1 | 1 day | 31 | 580–31 = 549 |
| 2 | 1 months | 62 | 580–62 = 518 | |
| 3 | 6 months | 214 | 580–214 = 366 | |
| PV | 1 | 2 months | 92 | 580–92 = 488 |
| 2 | 3 months | 122 | 580–122 = 458 | |
| 3 | 4 months | 153 | 580–153 = 427 | |
| DTP | 1 | 3 months | 122 | 580–122 = 458 |
| 2 | 4 months | 153 | 580–153 = 427 | |
| 3 | 5 months | 183 | 580–183 = 397 | |
| MCV | 1 | 8 months | 275 | 580–275 = 305 |
| JEV | 1 | 8 months | 275 | 580–275 = 305 |
*BCG: Bacillus Calmette-Guerin vaccine, HepB: hepatitis B vaccine, PV: polio vaccine, DTP: diphtheria-tetanus-pertussis vaccine, MCV: measles containing vaccine, JEV: Japanese encephalitis vaccine.
Validity and reliability analysis
Descriptive statistics were used to analyze the socio-demographics and VHS responses. The Kaiser–Meyer–Olkin value and Bartlett’s test of sphericity were used to examine correlations between the 10 items (whether approximate to perform factor analysis). The sample was randomly split into two halves, one for exploratory factor analysis (EFA) and another for confirmatory factor analysis (CFA). The socio-demographics between two groups were not statistically significant. In EFA, the factors with eigenvalues >1.0, were extracted with varimax rotation. According to the structure identified in EFA, CFA was used to confirm whether each latent domain (factor) was properly measured. The Chi square/DF index (χ2/DF), root mean square error of approximation, goodness-of-fit index, adjusted goodness-of-fit index, comparative fit index, Tucker–Lewis index, and standardized root mean square residual were used to evaluate the model fit. The items with low factor loadings would be deleted to determine whether the model fit could be improved. The average variance extracted (AVE) was calculated using the factor loadings to assess convergent validity in each domain. The square root of AVE and correlations between latent factors to assess the discriminant validity. Cronbach’s α and composite reliability (CR) was calculated to determine the internal consistency reliability for the items in each factor. The sum of scores to 10 items was calculated for category A and category B vaccine scales. The answers to L5, L9, and L10 were flipped because these three items were worded negatively and other items were worded positively.20 The maximum and minimum scores were 50 and 10 points, respectively. Higher scores represented lower vaccine hesitancy. The delaying status for category A vaccines was divided into six groups based on a previous study: 0 days, 1–7 days, 8–31 days, 1–2 months, 3–6 months, and >6 months.21 The administration status for category B vaccines was divided into four groups: 0 type (received none), 1 type (received one of three vaccines), 2 types (received two of three vaccines), and 3 types (received all three vaccines).
By adjusting the children’s and parents’ socio-demographics, we used logistic regression to examine the association between category A VHS scores and category A vaccine delay, and the association between category B VHS scores and category B vaccine administration status to assess the criteria validity. The association between each item in the VHS and vaccination status was also examined. To avoid too few answers for some options in some items, “strongly disagree,” “disagree” and “not sure” were combined into “Not sure and disagree,” “strongly agree” and “agree” were combined into “Agree.” Statistical significance was defined as a two-sided P value of <0.05. All analyses were performed using SPSS 23.0 (IBM Corp, New York, NY, USA) and AMOS 23.0 (IBM Corp, New York, NY, USA) software.
Results
Sample characteristic
Overall, 802 parents completed the questionnaire, with a response rate of 75.3% (Table 2). Approximately 76.7% of respondent parents were mothers, and 68.5% of respondent parents had an educational level of college or higher. More than 90.0% of respondents’ parents were not involved in the healthcare occupation.
Table 2.
Characteristics of participants*
| Variables | Data |
|---|---|
| Children | |
| Age, m, (Mean ± SD) | 30.32 ± 8.58 |
| Sex, N (%) | |
| Male | 412 (51.4%) |
| Female | 390 (48.6%) |
| Firstborn, N (%) | |
| Yes | 489 (61%) |
| No | 313 (39%) |
| Parents | |
| Relationship with child, N (%) | |
| Mother | 615 (76.7%) |
| Father | 187 (23.3%) |
| Age, y, (Mean ± SD) | 31.30 ± 4.24 |
| Age group, N (%) | |
| <26 | 57 (7.1%) |
| 26 -<31 | 314 (39.2%) |
| 31 -<36 | 302 (37.7%) |
| ≥36 | 129 (16.1%) |
| Educational level, N (%) | |
| Junior high school or below | 92 (11.5%) |
| High school graduate or equivalent | 161 (20.1%) |
| College or equivalent | 501 (62.5%) |
| Master’s Diploma or above | 48 (6.0%) |
| Annual household income (10,000 RMB), N (%) | |
| <5 | 52 (6.5%) |
| 5 -< 10 | 246 (30.7%) |
| 10 -<15 | 219 (27.3%) |
| ≥15 | 285 (35.5%) |
| Healthcare occupation, N (%) | |
| Yes | 60 (7.5%) |
| No | 742 (92.5%) |
*Referring to the per capita disposable income (RMB 54,847; USD 1 = RMB 6.8148) in Wuxi in 2019.
Vaccine hesitancy and vaccination status
The category A and B vaccine hesitancy scores were 40.81 ± 4.00 and 38.32 ± 5.08, respectively. Less than 1% of parents showed disagreement with L1, L2, L3, L4, L6, and L7 items in category A VHS (Figure 1). More than 20% of parents showed agreement with the L5 and L9 items in category B VHS. There were 29.93% of children with no delay in category A vaccines (Figure 2). Approximately 20% of the children were delayed for >6 months. Of the children, 47.38% received no category B vaccines, and 5.99% of children received all three category B vaccines. The category A VHS scores were 40.45 ± 4.41, 40.7 ± 3.68, 40.84 ± 3.62, 40.77 ± 3.86, 41.38 ± 3.64, and 41.01 ± 4.09, respectively in 0 days, 1–7 days, 8–31 days, 1–2 months, 3–6 months, and >6 months delay status. The category B VHS scores were 38.04 ± 5.03, 38.21 ± 5.32, 39.06 ± 4.81, and 39.15 ± 4.77, respectively in 0 type, 1 type, 2 types, and 3 types administration status.
Figure 1.
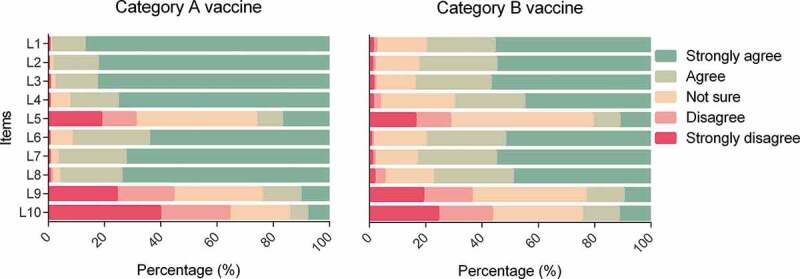
Parental vaccine hesitancy*.
*L1. Childhood vaccines are important for my child’s health, L2. Childhood vaccines are effective, L3. Having my child vaccinated is important for the health of others in my community, L4. All childhood vaccines offered by the government programme in my community are beneficial, L5. New vaccines carry more risks than older vaccines, L6. The information I receive about vaccines from the vaccine program is reliable and trustworthy, L7. Getting vaccines is a good way to protect my child/children from disease, L8. Generally I do what my doctor or health care provider recommends about vaccines for my child/children, L9. I am concerned about serious adverse effects of vaccines, L10. My child/children does or do not need vaccines for diseases that are not common anymore.
Figure 2.
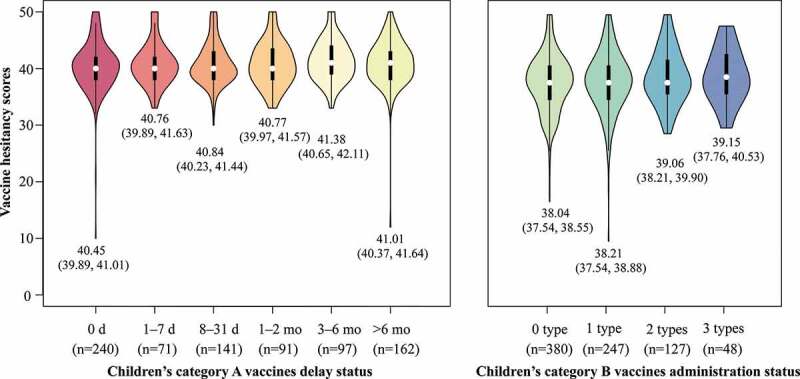
Parental vaccine hesitancy and children’s vaccination status.
VHS validation
Bartlett’s test of sphericity (P < .001) showed that correlations between items were sufficient to conduct a factor analysis. Two factors were identified with eigenvalues >1, which explained 64.60% and 63.34% of the common variance of the 10 items in category A and B VHS, respectively (Table S1). In category A and B VHS, there are seven items (L1-L4, L6-L8) loading on factor 1, which were related to vaccine confidence and three items (L5, L9, L10) loading on factor 2, which were related to vaccine risk and complacency. Most of the factor loadings of each item in the two scales were >0.7, except for item L8 in category B VHS (0.653).
In categories A and B, the model fit was acceptable according to a series index (Table 3). The model fit was not improved when items L2 and(or) L5 were deleted in category A VHS. The model fit was improved when items L8 and(or) L10 were deleted in category B VHS. In category A VHS, the AVE of 0.451 for Factor 1, and the AVE of 0.475 for Factor 2. In category B VHS, the AVE was 0.640 for Factor 1, and the AVE was 0.531 for Factor 2 (Table S2). The suggested values for AVE and CR were >0.5 and >0.7, respectively. The convergent validity of the VHS is not ideal. The correlation between two latent factors was significant and was lower than the square root of AVE, which indicated the discriminant validity was good in category A and B VHS.
Table 3.
Model fit of VHS
| Scale | X2/df | RMSEA | GFI | AGFI | IFI | TLI | SRMR |
|---|---|---|---|---|---|---|---|
| Category A VHS (10-item) | 3.392 | 0.055 | 0.954 | 0.926 | 0.832 | 0.773 | 0.109 |
| Category A VHS (9-item, excluded L5) | 3.805 | 0.060 | 0.946 | 0.906 | 0.822 | 0.747 | 0.180 |
| Category A VHS (9-item, excluded L2) | 3.603 | 0.057 | 0.960 | 0.931 | 0.848 | 0.785 | 0.143 |
| Category A VHS (8-item, excluded L2 and L5) | 4.097 | 0.097 | 0.954 | 0.913 | 0.843 | 0.763 | 0.190 |
| Category B VHS (10-item) | 4.063 | 0.062 | 0.934 | 0.894 | 0.839 | 0.783 | 0.074 |
| Category B VHS (9-item, excluded L8) | 3.871 | 0.060 | 0.950 | 0.913 | 0.877 | 0.828 | 0.065 |
| Category B VHS (9-item, excluded L10) | 3.601 | 0.057 | 0.947 | 0.908 | 0.882 | 0.834 | 0.068 |
| Category B VHS (8-item, excluded L8 and L10) | 2.959 | 0.049 | 0.966 | 0.936 | 0.930 | 0.895 | 0.050 |
| Suggested value for good fit | 2–5 | <0.06 | >0.90 | >0.90 | >0.90 | >0.90 | <0.08 |
*χ2/DF: Chi square/DF, RMSEA: root mean square error of approximation, GFI: goodness-of-fit index, AGFI: adjusted goodness-of-fit index, CFI: comparative fit index, TLI: Tucker-Lewis index, SRMR: standardized root mean square residual.
In category A VHS, Factor 1 consisted of seven items with a Cronbach’s α of 0.900, and factor 2 consisted of three items with Cronbach’s α of 0.718. In category B VHS, the Cronbach’s α of the seven items in Factor 1 was 0.894, and that of Factor 2 was 0.727. In category A VHS, the CR was 0.851 for Factor 1, and the CR was 0.727 for Factor 2. In category B VHS, the CR was 0.925 for Factor 1, and the CR was 0.770 for Factor 2. The low correlation between two latent factors being lower than square roof of AVE indicated that VHS has a good discriminant validity. (Table S3). The Cronbach’s α of >0.7 and CR of >0.7 indicated the VHS has an acceptable internal consistency.
We did not find a statistically significant association between category A VHS scores and category A vaccine delay status after adjusting for socio-demographics (Figure 3). No statistically significant association was found between category B VHS scores and category B vaccine administration status. Category B VHS was not related to EV71 or PCV administration status. However, category B VHS was related to influenza vaccination status. The parents were less likely to show hesitancy in the category B vaccine when their child was vaccinated against influenza (adjusted odds ratio [aOR]: 1.06, 95% CI: 1.02, 1.09, P = .003).
Figure 3.
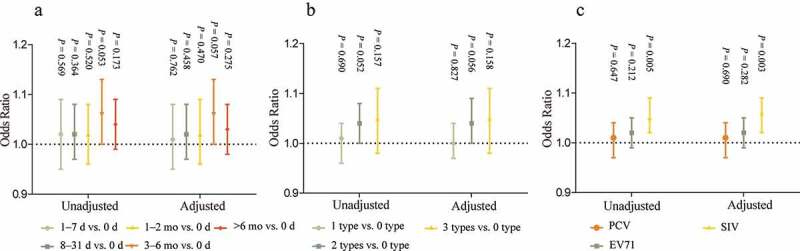
Association between Parental vaccine hesitancy and children’s vaccination status*.
*A: association between category A VHS and category A vaccine delay status, B: category B VHS and category B vaccine administration status, C: category B VHS and different category B vaccines. Adjusted for children age, m, children sex, firstborn of children, parent’s relationship with child, parent’s age, parent’s educational level, parent’s annual household income, and parent’s healthcare occupation.
Each item in category A VHS was also not found to be associated with a category A vaccine delay (Table S4). There was also no statistically significant being found in the association between each item in category B VHS and category B vaccine administration status (Table S5). Similarly, each item in category B VHS was not related to EV71 or PCV status (Table S6). Item L3 was statistically associated with influenza vaccination status (aOR: 1.72, 95% CI: 1.01, 2.95, P = .047).
Discussion
Our findings demonstrated that the VHS scale has two domains, and the model fit and internal consistency are acceptable in Chinese settings. The low correlation between two latent factors (<square roof of AVE) indicated that VHS has a good discriminant validity. Convergent validity requires improvement. However, there was no statistically significant association between VHS scores and vaccination status, indicating that criteria validity was not ideal.
Consistent with previous studies, two domains were identified in the VHS, factor 1: “vaccine confidence” and factor 2: “vaccine risk and complacency.”16–19 Most of the views on scale were deleting item L10: “My child/children does or do not need vaccines for diseases that are not common anymore.”17–19 The following items were controversial: L9, L3, L5, and L6.16,19 Our findings indicated that the model fit would be improved when item L8 and L10 were deleted in category B VHS.24***** However, the model fit seems not be improved when the items were deleted for category A VHS. The previous studies and our findings suggested that the items in VHS might be reviewed by WHO experts. Meanwhile, most studies suggested that items needed to be added to factor 2 “vaccine risk and complacency.” Laura et al. revised the VHS, and the modified version performed well psychometrically.25 They deleted one item from Factor 1 and one item from Factor 2, and added a new item to Factor 2 in the modified scale.25 However, some problems remain to be solved. Descriptions of some items in the VHS caused criticism. On the one hand, some items’ meanings (such as items L5 and L9) were ambiguous, which made it difficult for parents to respond and the answers to these items could not clearly represent vaccine hesitancy.18 On the other hand, negative items might conflate the content and direction of the scale.16 Item (L5), which attracted criticism, existed on the modified scale.
One of the strengths of our study is the use of children’s vaccination status to examine the criteria validity of VHS. However, our findings did not show an association between VHS scores and children’s vaccination status. A study in Argentina indicated that VHS scores were associated with vaccination status and were not related to on-time vaccination.20 Angela et al. ‘s findings and our work demonstrated that the criteria validity of VHS was not ideal. Unideal criteria validity of the VHS indicated that this tool cannot measure or predict vaccination behaviour. While measuring or predicting vaccination behaviour for the scale is an important function in practice. Other scales have examined criteria validity using vaccination data. PACV was found to be associated with delayed vaccination in children.7,23 The caregiver vaccine acceptance scale was found to be related to children’s delay in vaccination and administration status.12 Both scales included the “behaviours” domain. The VHS mainly surveyed parents’ attitudes toward childhood vaccines. This problem involved controversy in the measurement of vaccine hesitancy.26 Should vaccine hesitancy be considered an attitude, behavior, or a combination?26,27 Benin and his colleagues provided a view about “vaccine-hesitant,” presenting parents who accepted vaccination but showed concerns about vaccinating their child.28 This ambiguity may hinder the utility of the concept vaccine hesitancy.26 We suggest that WHO experts clarify it as soon as possible.
Our study had several limitations. First, parents need to take children to clinics to receive vaccination because category A vaccines are mandatory. We suggested that findings in vaccination clinics could be generalized. However, the proportion of respondents being fathers or respondents having low educational level is relatively small. The sample might be not representative of the entire population, though we adjusted the children’s and parents’ socio-demographics in the logistic regression. Some items might not be understood by respondents with low educational level, which might reduce the consistency and validity of the scale. Second, the cross-sectional study design may threaten the generalizability of the findings. The current vaccine hesitancy was used to explore the association with past vaccination behaviors. Parental vaccine hesitancy may vary over time. The significant association between VHS scores and vaccines administration status might be found when rigorous research design used such as longitudinal study. Third, the delay in category A vaccines may be influenced by many factors. Parental negligence or children falling ill during the recommended vaccination time, could both contribute to delay in vaccination which might cause the insignificant association between VHS scores and category A vaccines delay status.
Conclusion
In this study, the VHS included two domains and had acceptable internal consistency. However, construct validity and criterion validity were not ideal. There was no statistically significant association between the VHS scores and vaccination status. The VHS needs more improvement before becoming a standard survey tool.
Supplementary Material
Funding Statement
Supported by the Wuxi City Technology Development Fund [N2019100]; Postgraduate Research & Practice Innovation Program of Jiangsu Province [KYCX20_0153]; the Fundamental Research Funds for the Central Universities [3225002102D]; Public Health Research Center of Jiangnan University [JUPH201845]; and UK Foreign, Commonwealth and Development Office and Wellcome [215373/A/19/Z]. The funder/sponsor did not participate in the work.
Disclosure statement
No potential conflict of interest was reported by the author(s).
Contributors
QW, SXX, HJ, and LL conceptualized and designed the study, drafted the initial manuscript, and reviewed and revised the manuscript; QW, SXX, LQY, YH, TTC, NYS, MQL, YQY, CL, XWW, and WJZ designed the data collection instruments and collected data; QW and SXX carried out the initial analyses. All authors approved the final manuscript as submitted and agree to be accountable for all aspects of the work.
Supplementary material
Supplemental data for this article can be accessed on the publisher’s website at https://doi.org/10.1080/21645515.2021.2021060.
References
- 1.Poland GA, Jacobson RM.. The age-old struggle against the antivaccinationists. N Engl J Med. 2011;364(2):97–7. doi: 10.1056/NEJMp1010594. [DOI] [PubMed] [Google Scholar]
- 2.Dubé E, Vivion M, MacDonald NE. Vaccine hesitancy, vaccine refusal and the anti-vaccine movement: influence, impact and implications. Expert Rev Vaccines. 2015;14(1):99–117. doi: 10.1586/14760584.2015.964212. [DOI] [PubMed] [Google Scholar]
- 3.Johnson NF, Velásquez N, Restrepo NJ, Leahy R, Gabriel N, El Oud S, Zheng M, Manrique P, Wuchty S, Lupu Y, et al. The online competition between pro- and anti-vaccination views. Nature. 2020;582(7811):230–33. doi: 10.1038/s41586-020-2281-1. [DOI] [PubMed] [Google Scholar]
- 4.World Health Organization . Ten threats to global health in 2019. [accessed 2021 June 18]. https://www.who.int/newsroom/featurestories/ten‐threats‐toglobal‐health‐in‐2019.
- 5.Doll MK, Correira JW. Revisiting the 2014-15 Disneyland measles outbreak and its influence on pediatric vaccinations. Hum Vaccin Immunother. 2021:1–6. doi: 10.1080/21645515.2021.1972707. [DOI] [PMC free article] [PubMed] [Google Scholar]
- 6.MacDonald NE, SAGE Working Group on Vaccine Hesitancy . Vaccine hesitancy: definition, scope and determinants. Vaccine. 2015;33(34):4161–64. doi: 10.1016/j.vaccine.2015.04.036. [DOI] [PubMed] [Google Scholar]
- 7.Opel DJ, Taylor JA, Mangione-Smith R, Solomon C, Zhao C, Catz S, Martin D. Validity and reliability of a survey to identify vaccine-hesitant parents. Vaccine. 2011;29(38):6598–605. doi: 10.1016/j.vaccine.2011.06.115. [DOI] [PubMed] [Google Scholar]
- 8.Gilkey MB, Magnus BE, Reiter PL, McRee AL, Dempsey AF, Brewer NT. The vaccination confidence scale: a brief measure of parents’ vaccination beliefs. Vaccine. 2014;32:6259–65. doi: 10.1016/j.vaccine.2014.09.007. [DOI] [PMC free article] [PubMed] [Google Scholar]
- 9.Gilkey MB, Reiter PL, Magnus BE, McRee AL, Dempsey AF, Brewer NT. Validation of the vaccination confidence scale: a brief measure to identify parents at risk for refusing adolescent vaccines. Acad Pediatr. 2015;16(1):42–49. doi: 10.1016/j.acap.2015.06.007. [DOI] [PMC free article] [PubMed] [Google Scholar]
- 10.Martin LR, Petrie KJ. Understanding the dimensions of anti-vaccination attitudes: the vaccination attitudes examination (VAX) scale. Ann Behav Med. 2017;51(5):652–60. doi: 10.1007/s12160-017-9888-y. [DOI] [PubMed] [Google Scholar]
- 11.Zingg A, Siegrist M. Measuring people’s knowledge about vaccination:Developing a one-dimensional scale. Vaccine. 2012;30:3771–77. doi: 10.1016/j.vaccine.2012.03.014. [DOI] [PubMed] [Google Scholar]
- 12.Wallace AS, Wannemuehler K, Bonsu G, Wardle M, Nyaku M, Amponsah-Achiano K, Dadzie JF, Sarpong FO, Orenstein WA, Rosenberg ES, et al. Development of a valid and reliable scale to assess parents’ beliefs and attitudes about childhood vaccines and their association with vaccination uptake and delay in Ghana. Vaccine. 2019;37(6):848–56. doi: 10.1016/j.vaccine.2018.12.055. [DOI] [PMC free article] [PubMed] [Google Scholar]
- 13.Dyda A, King C, Dey A, Leask J, Dunn AG. A systematic review of studies that measure parental vaccine attitudes and beliefs in childhood vaccination. BMC Public Health. 2020;20(1):1253. doi: 10.1186/s12889-020-09327-8. [DOI] [PMC free article] [PubMed] [Google Scholar]
- 14.Cella P, Voglino G, Barberis I, Alagna E, Alessandroni C, Cuda A, D’Aloisio F, Dallagiacoma G, DE Nitto S, DI Gaspare F, et al. Resources for assessing parents‘ vaccine hesitancy: a systematic review of the literature. J Prev Med Hyg. 2020;61(3):E340–E373. doi: 10.15167/2421-4248/jpmh2020.61.3.1448. [DOI] [PMC free article] [PubMed] [Google Scholar]
- 15.Larson HJ, Jarrett C, Schulz WS, Chaudhuri M, Zhou Y, Dube E, Schuster M, MacDonald NE, Wilson R. Measuring vaccine hesitancy: the development of a survey tool. Vaccine. 2015;33(34):4165–75. doi: 10.1016/j.vaccine.2015.04.037. [DOI] [PubMed] [Google Scholar]
- 16.Domek GJ, O’Leary ST, Bull S, Bronsert M, Contreras-Roldan IL, Bolaños Ventura GA, Kempe A, Asturias EJ. Measuring vaccine hesitancy: field testing the WHO SAGE working group on vaccine hesitancy survey tool in Guatemala. Vaccine. 2018;36(35):5273–81. doi: 10.1016/j.vaccine.2018.07.046. [DOI] [PMC free article] [PubMed] [Google Scholar]
- 17.Shapiro GK, Tatar O, Dube E, Amsel R, Knauper B, Naz A, Perez S, Rosberger Z. The vaccine hesitancy scale: psychometric properties and validation. Vaccine. 2018;36(5):660–67. doi: 10.1016/j.vaccine.2017.12.043. [DOI] [PubMed] [Google Scholar]
- 18.Luyten J, Bruyneel L, van Hoek AJ. Assessing vaccine hesitancy in the UK population using a generalized vaccine hesitancy survey instrument. Vaccine. 2019;37(18):2494–501. doi: 10.1016/j.vaccine.2019.03.041. [DOI] [PubMed] [Google Scholar]
- 19.Ren J, Wagner AL, Zheng A, Sun X, Boulton ML, Huang Z, Zikmund-Fisher BJ. The demographics of vaccine hesitancy in Shanghai, China. PLoS One. 2018;13(12):e0209117. doi: 10.1371/journal.pone.0209117. [DOI] [PMC free article] [PubMed] [Google Scholar]
- 20.Gentile A, Pacchiotti AC, Giglio N, Nolte MF, Talamona N, Rogers V, Berenstein A, Castellano VE. Vaccine hesitancy in Argentina: validation of WHO scale for parents. Vaccine. 2021;39(33):4611–19. doi: 10.1016/j.vaccine.2021.06.080. [DOI] [PubMed] [Google Scholar]
- 21.Wang Q, Xiu S, Zhao S, Wang J, Han Y, Dong S, Huang J, Cui T, Yang L, Shi N, et al. Vaccine hesitancy: COVID-19 and influenza vaccine willingness among parents in Wuxi, China-A cross-sectional study. Vaccines (Basel). 2021;9(4):342. doi: 10.3390/vaccines904034. [DOI] [PMC free article] [PubMed] [Google Scholar]
- 22.Chinese Center for Disease Control and Prevention . National immunization program for children. [accessed 2021 May 3]. http://nip.chinacdc.cn/zstd/mycx/201807/t20180731_189375.htm.
- 23.Hu Y, Chen Y, Liang H, Wang Y. Reliability and validity of a survey to identify vaccine hesitancy among parents in Changxing county, Zhejiang province. Hum Vaccin Immunother. 2019;15(5):1092–99. doi: 10.1080/21645515.2019.1572409. [DOI] [PMC free article] [PubMed] [Google Scholar]
- 24.Luman ET, Barker LE, Shaw KM, McCauley MM, Buehler JW, Pickering LK. Timeliness of childhood vaccinations in the United States: days undervaccinated and number of vaccines delayed. JAMA. 2005;293(10):1204–11. doi: 10.1001/jama.293.10.1204. [DOI] [PubMed] [Google Scholar]
- 25.Helmkamp LJ, Szilagyi PG, Zimet G, Saville AW, Gurfinkel D, Albertin C, Breck A, Vangala S, Kempe A. A validated modification of the vaccine hesitancy scale for childhood, influenza and HPV vaccines. Vaccine. 2021;39(13):1831–39. doi: 10.1016/j.vaccine.2021.02.039. [DOI] [PubMed] [Google Scholar]
- 26.Quinn SC, Jamison AM, An J, Hancock GR, Freimuth VS. Measuring vaccine hesitancy, confidence, trust and flu vaccine uptake: results of a national survey of White and African American adults. Vaccine. 2019;37(9):1168–73. doi: 10.1016/j.vaccine.2019.01.033. [DOI] [PubMed] [Google Scholar]
- 27.Peretti-Watel P, Larson HJ, Ward JK, Schulz WS, Verger P. Vaccine hesitancy: clarifying a theoretical framework for an ambiguous notion. PLoS Curr. 2015;7:ecurrents.outbreaks.6844c80ff9f5b273f34c91f71b7fc289. doi: 10.1371/currents.outbreaks.6844c80ff9f5b273f34c91f71b7fc289. [DOI] [PMC free article] [PubMed] [Google Scholar]
- 28.Benin AL, Wisler-Scher DJ, Colson E, Shapiro ED, Holmboe ES. Qualitative analysis of mothers’ decision-making about vaccines for infants: the importance of trust. Pediatrics. 2006;117:1532–41. doi: 10.1542/peds.2005-1728. [DOI] [PubMed] [Google Scholar]
Associated Data
This section collects any data citations, data availability statements, or supplementary materials included in this article.