

Abstract
HIV prevention and treatment with injectable cabotegravir and/or rilpivirine administered once every four to eight weeks is an attractive alternative to daily therapy. Prescribed dosage and drug concentrations in plasma are based on patient data collected in clinical trials, but actual patients are expected to exhibit more variability in drug concentrations, which is important to quantify. Here, we demonstrate the first quantitative point-of-care assay with a miniature mass spectrometer to assess these drug concentrations in whole blood. Quantitative performance is obtained using paper spray ionization in combination with tandem mass spectrometry (MS/MS) in the clinically relevant concentration range of both drugs. Limits of quantitation (LoQs) of cabotegravir and rilpivirine are measured to be 750 ng/mL and 20 ng/mL, respectively. The assay turnaround time is < 4 minutes, and strong linear relationships are established between MS/MS responses and concentration, with % relative standard deviations (RSDs) that are <15% at concentrations above the LoQs. The speed, portability, low power consumption, and specificity offered by the miniature instrument should make it an appropriate platform for measuring drug concentrations in a walk-in clinic using small volumes of patient blood.
Keywords: HIV treatment, Ambient ionization, Paper spray, Antiretrovirals, Drug quantitation
Graphical Abstract

Introduction
In 2020, 27.5 million people living with HIV were accessing antiretroviral therapy (ART), which involves taking a combination of antiretroviral drugs every day [1]. While these tablet-based treatment regimens have had major success in HIV treatment and prevention, long-term daily adherence to prescribed treatment regimens is crucial to achieving virologic suppression and improving patient outcomes [2-4]. A major advance in HIV prevention and treatment was made in 2020, when the FDA approved injectable cabotegravir-rilpivirine (CAB/RPV) administered once every four weeks for the treatment of HIV injection [5]. These long term injectables could help overcome problems with patient adherence by maintaining plasma concentrations for months [6-10]. However, the one-size-fits-all strategy for dosage and frequency based on pharmacokinetic data collected in successful clinical trials may not be optimum for patients in uncontrolled settings [7], [8].
In particular, patients receiving these drugs are expected to exhibit more variability in concentrations compared with clinical trials, making it important to quantify the within-patient and between patient-variability of drug concentrations. As evidence for this point, data for 591 participants from two phase III registrational clinical trials, FLAIR and ATLAS, show that CAB/RPV concentrations varied by more than a factor of 10 at a single four-week post-injection time point [7], [8]. Further, of the six cases of confirmed virologic failure, all participants had received their injections on time; however, the plasma concentrations for these drugs were in the lowest quartile of the observed concentrations. On the other end of the spectrum, some patients experience very high concentrations and could benefit from less frequent injections. Thus, monitoring CAB/RPV concentrations in a real-world setting should help determine patient specific pharmacokinetics and, in the long term, enable clinicians to personalize dose-frequencies such that ‘target’ concentrations are achieved for maximal efficacy and patient/clinician convenience.
Current emphasis in drug monitoring is shifting towards point-of-care testing to empower clinicians to make fast decisions and simplify healthcare delivery [11], [12]. Although immunoassays and colorimetric screening have successfully been implemented with biofluid samples, mass spectrometers remain unrivalled in terms of their wide molecular applicability and in their sensitivity and specificity [13]. While LC-MS or LC-MS/MS methods can produce high-quality data, the high workload demanded for sample preparation and sample transfer between labs involves additional logistics that represents a major burden and slows down the entire process. Ambient ionization methods, wherein little to no sample preparation is required and ionization is performed outside the mass spectrometers under ambient conditions, address this serious limitation in the adoption mass spectrometers for on-site analysis [14-16]. Since the first reports of desorption electrospray ionization [17] and direct analysis in real time [18], many new ambient ionization methods have been developed for applications including illicit drug detection [19] and therapeutic drug monitoring [20]. Coated blade spray method combines solid-phase microextraction and ambient ionization, as demonstrated for quantitative analysis of urine and plasma samples [21]. Slug-flow microextraction was also reported for direct analysis of biofluids [22]. Paper spray ionization, in particular, has had major success as an ambient ionization method in obtaining excellent detection limits with several analytes in biofluids, including blood [20], [23-26]. This technique continues to advance, with excellent performance reported for a variety of novel substrates including polymers [27] and functionalized paper [28-30]. The 3-D version of this technique, cone spray ionization, enables the rapid analysis of solids including tablets [31], [32].
The two technical developments that are essential for point-of-care MS are the use of ambient ionization to simplify sample preparation and the availability of portable MS/MS capable instruments. In the recent past, continuous improvements in both these respects have led to noteworthy performance, both in laboratory and intra-operative setting [33-37]. Our current work further expands capabilities within this application space. We describe the assay development and show preliminary data for the quantitation of CAB/RPV using paper spray ionization with a home-built miniature mass spectrometer, the Mini-12 [38]. The method involves extraction of analyte from whole blood with organic solvent containing an internal standard, deposition of this extract onto a paper triangle followed by application of solvent and high voltage to the paper prior to mass analysis using the Mini-12. Quantitative results are obtained in only four minutes. This assay can easily be performed in a clinical provider’s office, for immediate feedback to patients and clinicians, potentially offering cost savings, and reducing the burden on patients and healthcare providers in the long-term.
Experimental
Chemicals
Fisherbrand Quantitative Grade Q5 Filter Paper Circles and Whatman Grade1 filter paper were purchased from Fisher Scientific. Whatman Cellulose Chromatography paper (SG 81) was purchased from Millipore Sigma. Cabotegravir, rilpivirine and their stable isotope labeled internal standards, cabotegravir-d5 and rilpivirine-d6, were purchased from Cayman Chemical. The chemical structures of cabotegravir, rilpivirine and their internal standards are shown in Figure S1. Human whole blood with K2 EDTA as anticoagulant was purchased from Innovative Research, Inc. and used within 2 weeks of receipt. Borosilicate glass capillaries were purchased from Sutter Instruments and pulled to nanotips of 5-μm-inner diameter using a P-97 tip puller from the same vendor. Copper clips were purchased from Mueller Electric. All solvents and other chemicals were purchased from Fisher Scientific.
Instrumentation
The Mini-12 custom-built miniature mass spectrometer was previously described [38]. The Mini-12 uses a rectilinear ion trap mass analyzer operated at a drive frequency of 1.001 MHz. A single conversion dynode with the electron multiplier at −1500 V was used for ion detection. The instrument employs a discontinuous atmospheric pressure interface (DAPI) that enables successful coupling of an ambient ionization source to a small instrument with limited pumping capacity [39]. The dc-endcap lenses were operated at 36 V and 25 V for CAB and RPV, respectively. The DAPI valve was opened for 14 ms to introduce ions, so raising the pressure in the ion trap to 10−1 Torr. The instrument was then allowed to pump down for 700 ms to decrease the pressure to 10−1 Torr for mass analysis. A stored waveform inverse Fourier transform (SWIFT) was used to isolate the protonated molecules (m/z 406 for CAB, m/z 411 for CAB-d5, m/z 367 for RPV, m/z 373 for RPV-d6) with an isolation window of 3 m/z units for each precursor ion. The precursor ions for CAB and RPV were isolated at Mathieu q-values of 0.5 and 0.4, respectively. The excitation frequencies for collision induced dissociation (CID) of CAB, CAB-d5, RPV and RPV-d6 were 150, 148, 129, and 127 kHz, respectively and their application for 60 ms was followed by a further 800 ms delay allowing the pressure to fall near the base value of 10−5 Torr. Mass selective instability scans were then performed with resonance ejection at 348 kHz. Customized electronics was used to apply the high voltages for ionization, ion introduction, ramping of the radiofrequency (rf) voltage, precursor ion isolation and excitation, and product ion mass analysis. Quantitative measurements were made using the Mini-12.
The Mini-12 data were analyzed after all the data for a set of calibration curves had been transferred into MATLAB. A custom program was written to (i) smooth the spectra using a Savitsky-Golay filter (ii) normalize the spectra using the Standard Normal Variate method and (iii) integrate peak areas of the analyte and internal standard peaks and calculate their ratio.
A TSQ Quantum Access MAX from Thermo Fischer Scientific was used to perform mass analysis in the solvent screening experiments used to develop the paper spray assay. These analyses were performed in the MRM mode with the transition m/z 406→263 being chosen to monitor cabotegravir and m/z 367→224 to monitor rilpivirine.
Solution and sample preparation
Calibration (Cal) and quality control (QC) solutions were prepared from separate stock solutions of CAB and RPV. For each Cal or QC, a 20x more concentrated solution of CAB and RPV was first prepared in acetonitrile/water (9:1, v/v), then diluted 20x into blank whole human blood and mixed well. Cal solution concentrations for CAB were 250, 500, 750, 1000, 1500, 2000 ng/mL with QCs at 900 and 1300 ng/mL. The concentrations of the RPV Cal solutions were 20, 30, 40, 50, 60, ng/mL with QCs at 35 and 65 ng/mL.
To quantify CAB, 100 μL of 1000 ng/mL CAB-d5 in acetonitrile was added to 100 μL of a blood sample spiked with CAB at the concentrations noted above in a 1.5 mL Eppendorf tube and shaken vigorously for one minute to precipitate proteins. Then 10 μL of the clear supernatant layer of CAB extract was pipetted onto the base of a triangular piece of filter paper secured with a copper clip at the base. For extraction of RPV, 100 μL of 70 ng/mL RPV-d6 in hexane/ethyl acetate (1:1, v/v) + 0.1% ammonium acetate was added to 100 μL of a blood sample spiked with RPV in a 1.5 mL Eppendorf tube and shaken vigorously to form two distinct layers. Then 50 μL of the top (organic phase) layer was pipetted in five aliquots onto the base of an isosceles Q5 paper triangle (1 cm base, 1.2 cm height) secured by a copper clip such that the deposited extract did not reach the paper tip where the ionization occurred.
Paper spray ionization methodology
The sample handling workflow is shown in Figure 1. After deposition of the organic extracts of the blood samples, 25 μL of acetonitrile/water (9:1, v/v) was pipetted onto the base of the paper triangle followed by the application of +3.7 kV to the copper clip holding the paper triangle to produce ions which were interrogated using a Mini-12 mass spectrometer.
Figure 1.

Point-of-care analysis of CAB and RPV in whole blood with paper spray ionization and a miniature mass spectrometer. (a) Add 100 μL of solvent with internal standard and shake for one minute. (b) Deposit the supernatant layer onto a triangular piece of Q5 filter paper. (c) Apply solvent and high voltage and acquire MS/MS spectra in the positive mode using the Mini-12.
Nano-electrospray ionization
Nano-electrospray ionization (nano-ESI) using concentrated CAB (1000 ng/mlL), CAB-d5 (1000 ng/mL), RPV (100 ng/mL), and RPV-d6 (100 ng/mL) solutions in acetonitrile/water (9:1, v/v) was performed in the positive mode at a spray voltage of 1700 kV to identify the best transitions to use in the quantitative blood extract analysis (Figure 2). The spectra for CAB and its internal standard were recorded in the mass range m/z 205 - 445, and the spectra for RPV and its internal standard were recorded in the mass range m/z 205 - 400. Each spectrum was an average of six scans recorded at the scanning speed of 3500 m/z per second. While the high sensitivity and stability of nano-ESI yields high quality MS/MS spectra for standard solutions, paper spray ionization was chosen for quantitative performance in blood matrix because it is far less susceptible to ion suppression.
Figure 2.
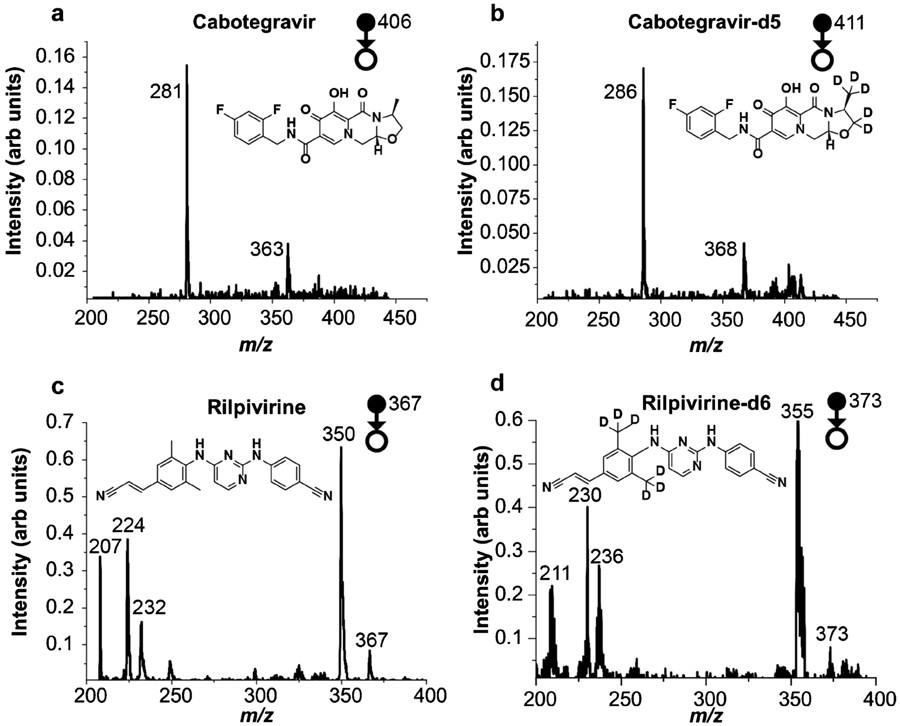
MS/MS spectra of the protonated forms of (a) 1000 ng/mL CAB (b) 1000 ng/mL CAB-d5 (c) 100 ng/mL RPV (d) 100 ng/mL RPV-d6 recorded using the Mini-12 with nanoESI in the positive ion mode. Spectra (a) and (b) were recorded in the mass range m/z 205 - 445, whereas (c) and (d) were recorded in the mass range m/z 205 - 400. Each spectrum is an average of six scans recorded at a scan speed of 3500 m/z per second.
Results and discussion
Sample considerations and development of the paper-spray assay
Point-of-care paper spray-based assays of viscous, non-volatile biofluid matrices such as blood could be performed after the biofluid had been dried onto the paper, or alternatively, by attaching cutout dried blood spots onto a paper triangle with a copper clip [25]. In some cases, immediate drying is desired, and this was achieved by blowing warm air onto the sample or by placing the sample in an incubator [40]. Analysis of wet blood samples with print paper or chromatography paper pretreated with the coagulating agent alum, can also serve to prevent cellular material from flowing to the tip of the paper [41]. However, in this study, we chose to extract the blood samples with organic solvents because (i) organic solvents were found to dry quickly on the paper substrate decreasing interference from cellular material flowing to the tip (ii) the extraction solvent could be made up with the internal standards which were pipetted directly into the sample.
Careful optimization of solvents and surface chemistry of the paper triangle are key to developing a sufficiently sensitive assay for the analytes of interest. This preliminary screening step was performed with a benchtop instrument (Thermo TSQ Quantum Access MAX) because of its stability, ruggedness, ease of use and data handling capabilities. Three paper substrates (Whatman 1, SG 81 and Q5) were evaluated with five different solvent systems (Figure S2) for each analyte. Among the three substrates, Q5 filter paper with the smallest pore sizes (< 2 μm) gave the highest sensitivity for both drugs with acetonitrile/water (9:1, v/v).
MS/MS analysis of CAB and RPV
Tandem mass spectrometry plays a key role in compound identification by reducing chemical noise and so increasing signal/noise and allowing quantitation. It is crucial that separation power of MS/MS be utilized in point-of-care miniature mass spectrometers which typically give only unit mass resolution. Figure 2 shows the MS/MS spectra of both drugs along with their isotopically labelled internal standards acquired using the Mini-12. The mass spectra were recorded in relatively larger mass windows (m/z 200 - 450 for CAB and CAB-d5; m/z 200 - 400 for RPV and RPV-d6) with unit resolution at a scan speed of 3500 m/z per second. These exploratory measurements on pure compounds were made to identify the most suitable product ions for quantitation. The major product ion peak observed for CAB, m/z 281 was chosen for quantitative analysis along with the corresponding ion for its isotopically labelled internal standard, CAB-d5, at m/z 286. For RPV, the combination of extensive conjugation and a large number of basic nitrogen atoms leads to the occurrence of rearrangement reactions, resulting in many product ions. Although m/z 350 was found to be the major product ion for this molecule, it is formed by loss of 17 Da corresponding to the loss of ammonia which was judged insufficiently specific for monitoring this molecule in a complex matrix. Thus, m/z 224 was chosen as the quantifier ion for subsequent quantitative analysis by paper spray along the corresponding ion for its isotopically labelled internal standard, RPV-d6, at m/z 230.
Quantitation using the Mini-12
Having established suitable target transitions for the standards by nano-ESI, the difficult task of quantification from whole blood was undertaken. While the high sensitivity and stability of nano-ESI yields high quality MS/MS spectra for standard solutions it gave poor performance for these samples in whole blood. Paper spray ionization was therefore selected because it is far less susceptible to ion suppression associated with complex matrices. The optimized conditions obtained for pure compounds using the benchtop TSQ were translated to the Mini-12. MS/MS spectra were recorded at a high scan rate (ca. 104 m/z per second) with a narrow mass window (m/z 235 - 310 for CAB and m/z 165 - 250 for RPV; covering the mass ranges of the product ions of interest) to maximize sensitivity.
Quantitative performance was explored by establishing calibration curves using paper spray for ionization, as shown in Figure 3. Two lines are drawn in red and green on the calibration curve to show possible thresholds corresponding to low and target clinical concentrations, respectively. These thresholds are clinically relevant as the drug concentrations below the ‘red’ lines (1120 ng/mL for CAB and 32.1 ng/mL RPV) and above the ‘green’ lines (2100 ng/mL and 54.3 ng/mL) represent the 25th and 75th percentiles of concentrations observed in the registrational clinical trials. Each aliquot of 100 μL blood sample was prepared and extracted with organic solvent containing the internal standard(s) as described above. Paper spray ionization and MS/MS analysis with the Mini-12 was used. Four analyses were repeated at each concentration, and the average of six MS/MS scans were taken in order to calculate the analyte to internal standard ratio (A/IS) for each standard solution. The limit of quantitation (LoQ) was defined as the concentration at which the ratio between the analyte signal was ten times the analyte signal for the blank. The extent of ion suppression was calculated by equation (1), where the ratio of the analyte signal obtained from a sample containing blood (processed according to the above workflow) to the same volume of a standard solution of the analyte in acetonitrile/water (9:1, v/v), followed by ionization and analysis was used for the calculations.
Figure 3.

Calibration curves of (a) CAB and (b) RPV with the Mini-12. Red and green lines correspond to 25th and 75th percentile concentrations observed in the registrational clinical trials. n=4 for each concentration.
| (1) |
For CAB, RSD values <15% were obtained for all calibration standards except Cal 1 and 2 (250 ng/mL and 500 ng/mL), where RSDs were ~30% and signal was less than 10 times the blank, both of which are unacceptable. The R2 value was 0.9851, the LoQ was 750 ng/mL, and 68% ion suppression was observed at 1000 ng/mL. Accuracy for the QC 1 (900 ng/mL) was within ±13% and for QC 2 (1300 ng/mL) it was within ±9%. For RPV, RSD values were <15% for all calibrators except for the LoQ at 20 ng/mL, for which it was <20%, which is acceptable. The extent of ion suppression was measured to be 39% at 60 ng/mL, and the R2 value was found to be 0.9783. Accuracy for QC 1 (35 ng/mL) was within ±10% and for QC 2 (65 ng/mL) the accuracy was within ±5%. Thus, good linearity was observed for each of the calibration curves in the ranges selected, viz. 750 - 2000 and 20 - 60 ng/mL for CAB and RPV, respectively. The linear range might be further expanded towards the higher concentration ranges for both drugs, but this is considered unnecessary for the proof-of-concept assays developed in this work.
Three-day trial using the Mini-12
Inter-day quantitative performance was assessed by plotting calibration curves for CAB and RPV in blood over three days using the same concentrations for the calibrators as in Figure 4, and the fit parameters shown in Table 1. For each day, we found that the R2 values for both drugs were ≥ 0.95, RSDs were <15% at all concentrations except for the LoQ where RSD <20% for both drugs. The limits of quantitation for CAB and RPV remained unchanged over the three days at 750 ng/mL and 20 ng/mL respectively. Slight differences were obtained for the slope and intercept values for the regression lines obtained between days, but the cumulative data was found to have a strong linear correlation with concentration (R2=0.9741 for CAB and 0.9957 for RPV). The RSDs of the cumulative data were found to be <25%. This performance is at or near the limits of capability of this (home-built) miniature mass spectrometer and the slight day-to-day deviations in MS/MS responses of the analyte and internal standard change the analyte to internal standard (A/IS) ratios and this is the reason for RSDs approach 25% and for the varying slopes, intercepts and R2 values between the three different days. Given the constraints imposed by using an ambient ionization method in combination with a miniature instrument, and day-to-day variation in responses and concentrations, these values are acceptable. The three-day quantitation further supports the fact that the limits of quantitation achieved for these drugs are suitable for clinical analysis. For CAB, which yielded satisfactory quantitative performance beyond 750 ng/mL, potential improvements should be possible with more advanced miniature mass spectrometric instrumentation.
Figure 4.

Comparison of quantitative performance over three different days for (a) CAB (b) RPV using the Mini-12; n = 4 for each data point.
Table 1.
Fit parameters and limits of quantitation for inter-day performance of CAB and RPV in blood with the Mini-12.
| Day 1 | Day 2 | Day 3 | Cumulative | |
|---|---|---|---|---|
| CAB | ||||
| Slope | 0.00087 | 0.00087 | 0.00072 | 0.00083 |
| Intercept | −0.0007 | −0.0715 | 0.2024 | 0.0345 |
| R2 | 0.9851 | 0.9522 | 0.9742 | 0.9741 |
| LoQ (ng/mL) | 750 | 750 | 750 | 750 |
| % RSD | <15% | <20% | <15% | <25% |
| RPV | ||||
| Slope | 0.01836 | 0.01921 | 0.01704 | 0.01757 |
| Intercept | −0.0966 | −0.1161 | 0.00868 | −0.0418 |
| R2 | 0.9783 | 0.9694 | 0.9454 | 0.9957 |
| LoQ (ng/mL) | 20 | 20 | 20 | 20 |
| % RSD | <20% | <20% | <15% | <25% |
Upon establishing that blood samples containing either CAB or RPV could be quantified separately as shown above, we also developed an instrumental method that used a single scan to detect both drugs in the same sample (2000 ng/mL CAB, 50 ng/mL RPV) as proof-of-concept (Figure S5). This capability is of major practical importance as CAB and RPV are often injected together during patient treatments. We have not assessed the quantitative performance of the method but given the good quantitative performance obtained when measuring the concentrations of these drugs individually, quantification both drugs in a single scan should give similar performance.
While exceptionally good detection limits are obtained with benchtop mass spectrometers for many analytes, these detection limits might not be met with miniature mass spectrometers given the design simplifications implemented for miniaturization (e.g., lack of ion optics as in the case of the Mini-12). UHPLC-MS/MS studies performed with CAB and RLP [42-43] gave LoQs of 30 ng/mL and 10 ng/mL, respectively [43]. The detection limits obtained with the Mini-12 are much higher, as expected with ambient ionization and the use of a miniature mass spectrometer. The speed of the ambient ionization/Mini MS combination outweighs the poorer detection limits. Given that samples of known concentrations were used in this study and correctly quantified, independent validation of the ambient ionization method coupled to a miniature mass spectrometer is only meaningful in actual point-of-care applications and this will need to await studies of actual samples.
Criteria for acceptable quantitative performance with miniature mass spectrometers
A reviewer has suggested that this topic be addressed here. Criteria for acceptable quantitative performance with benchtop mass spectrometers in the traditional laboratory setting (e.g. high R2 values and 10 - 15% RSD) cannot be expected with miniature mass spectrometers. These types of instruments offer important advantages of speed associated with minimal sample work-up and no sample transport which offset their lower performance criteria in other categories. The current rapid growth in the offerings of manufacturers, large (e.g., Waters and Agilent), intermediate (Advion) and small (BaySpec, PurSpec, 908 Devices, MassTech, etc.) points to confidence in a future larger market. As an initial set of guidelines when using these point-of-care high speed assays with portable mass spectrometers, we suggest that values for RSD <50% are acceptable for preliminary screening.
Conclusions
This work demonstrates that miniature mass spectrometers allow quantitative analysis at biologically significant trace concentrations of two antiretrovirals, cabotegravir and rilpivirine in blood. Strong linear relationships between responses and concentrations were obtained at the concentrations of interest, RSDs were <15 % above the assay LoQs. With spiked samples, as used in the study, the feasibility of on-site analysis using miniature MS systems for measurements of drug concentrations has been demonstrated. This method has the potential to be applied to clinical studies and may pave way to support a new paradigm in drug monitoring that will focus on providing immediate results to both patients and clinicians. While we have focused on cabotegravir and rilpivirine in blood in laboratory samples, we believe that these efforts lay the groundwork for (i) introduction of point-of-care assays with miniature mass spectrometers for measurement of cabotegravir and rilpivirine in patient samples in clinics and (ii) extension of miniature mass spectrometer-based assays to other long-acting therapies for adherence monitoring.
Supplementary Material
Acknowledgements
We acknowledge funding to P.L.A. from the National Institute of Health under award number R01AI122298. The authors also acknowledge support from Teledyne FLIR under FLIR Basic Research Award #18057244. The authors thank Mark Carlsen of the Jonathan Amy Facility for Chemical Instrumentation for electronics support. The authors also thank Lucas J. Szalwinski and Robert L. Schrader for assistance with instrumentation.
Footnotes
Conflict of interest statement
The authors declare that they have no conflicts of interest.
Publisher's Disclaimer: This AM is a PDF file of the manuscript accepted for publication after peer review, when applicable, but does not reflect post-acceptance improvements, or any corrections. Use of this AM is subject to the publisher's embargo period and AM terms of use. Under no circumstances may this AM be shared or distributed under a Creative Commons or other form of open access license, nor may it be reformatted or enhanced, whether by the Author or third parties. See here for Springer Nature's terms of use for AM versions of subscription articles: https://www.springernature.com/gp/open-research/policies/accepted-manuscript-terms
References
- 1.UNAIDS Global HIV & AIDS statistics — Fact sheet ∣ UNAIDS. In: UNAIDS 2021 Epidemiol. Estim 2021. https://www.unaids.org/en/resources/fact-sheet. Accessed 23 Sep 2021 [Google Scholar]
- 2.Paterson DL, Swindells S, Mohr J, Brester M, Vergis EN, Squier C, Wagener MM, Singh N, Hudson B. Adherence to protease inhibitor therapy and outcomes in patients with HIV infection. Ann Intern Med. 2000;133:21–30. 10.7326/0003-4819-133-1-200007040-00004 [DOI] [PubMed] [Google Scholar]
- 3.Lima VD, Harrigan R, Bangsberg DR, Hogg RS, Gross R, Yip B, Montaner JSG. The combined effect of modern highly active antiretroviral therapy regimens and adherence on mortality over time. J Acquir Immune Defic Syndr. 2009;50:529–536. 10.1097/QAI.0b013e31819675e9 [DOI] [PMC free article] [PubMed] [Google Scholar]
- 4.Ickovics JR, Cameron A, Zackin R, Basset R, Chesney M, Johnson VA, Kuritzkes DR. Consequences and determinants of adherence to antiretroviral medication: Results from Adult AIDS Clinical Trials Group protocol 370. Antivir Ther. 2002;7:185–193. 10.1177/135965350200700308 [DOI] [PubMed] [Google Scholar]
- 5.U.S. Food & drug administration FDA Approves Cabenuva and Vocabria for the Treatment of HIV-1 Infection. 2021. https://www.fda.gov/drugs/human-immunodeficiency-virus-hiv/fda-approves-cabenuva-and-vocabria-treatment-hiv-1-infection. Accessed 29 Sep 2021
- 6.National Institute of Allergy and Infectious Diseases The LATITUDE Study: Long-Acting Therapy to Improve Treatment Success in Daily Life. In: ClinicalTrials.gov. 2019. https://clinicaltrials.gov/ct2/show/NCT03635788?term=NCT03635788&rank=1. Accessed 22 Nov 2021
- 7.Swindells S, Andrade-Villanueva J-F, Richmond GJ, Rizzardini G, Baumgarten A, Masiá M, Latiff G, Pokrovsky V, Bredeek F, Smith G, Cahn P, Kim Y-S, Ford SL, Talarico CL, Patel P, Chounta V, Crauwels H, Parys W, Vanveggel S, Mrus J, Huang J, Harrington CM, Hudson KJ, Margolis DA, Smith KY, Williams PE, Spreen WR. Long-Acting Cabotegravir and Rilpivirine for Maintenance of HIV-1 Suppression. N Engl J Med. 2020;382:1112–1123. 10.1056/nejmoa1904398 [DOI] [PubMed] [Google Scholar]
- 8.Orkin C, Arasteh K, Górgolas Hernández-Mora M, Pokrovsky V, Overton ET, Girard PM, Oka S, Walmsley S, Bettacchi C, Brinson C, Philibert P, Lombaard J, St. Clair M, Crauwels H, Ford SL, Patel P, Chounta V, D’Amico R, Vanveggel S, Dorey D, Cutrell A, Griffith S, Margolis DA, Williams PE, Parys W, Smith KY, Spreen WR. Long-Acting Cabotegravir and Rilpivirine after Oral Induction for HIV-1 Infection. N Engl J Med. 2020;382:1124–1135. 10.1056/nejmoa1909512 [DOI] [PubMed] [Google Scholar]
- 9.Margolis DA, Gonzalez-Garcia J, Stellbrink H-J, Eron JJ, Yazdanpanah Y, Podzamczer D, Lutz T, Angel JB, Richmond GJ, Clotet B, Gutierrez F, Sloan L, Clair MS, Murray M, Ford SL, Mrus J, Patel P, Crauwels H, Griffith SK, Sutton KC, Dorey D, Smith KY, Williams PE, Spreen WR. Long-acting intramuscular cabotegravir and rilpivirine in adults with HIV-1 infection (LATTE-2): 96-week results of a randomised, open-label, phase 2b, non-inferiority trial. Lancet. 2017;390:1499–1510. 10.1016/S0140-6736(17)31917-7 [DOI] [PubMed] [Google Scholar]
- 10.Scarsi KK, Swindells S. The Promise of Improved Adherence With Long-Acting Antiretroviral Therapy: What Are the Data? J Int Assoc Provid AIDS Care. 2021;20:1–10. 10.1177/23259582211009011 [DOI] [PMC free article] [PubMed] [Google Scholar]
- 11.Jani I V, Peter TF. How Point-of-Care Testing Could Drive Innovation in Global Health. N Engl J Med. 2013;368:2319–2324. 10.1056/nejmsb1214197 [DOI] [PubMed] [Google Scholar]
- 12.John AS, P Price C. Existing and Emerging Technologies for Point-of-Care Testing. Clin Biochem Rev. 2014;35:155–167. [PMC free article] [PubMed] [Google Scholar]
- 13.Hoofnagle AN, Wener MH. The fundamental flaws of immunoassays and potential solutions using tandem mass spectrometry. J Immunol Methods. 2009;347:3–11. 10.1016/j.jim.2009.06.003 [DOI] [PMC free article] [PubMed] [Google Scholar]
- 14.Graham Cooks R, Ouyang Z, Takats Z, Wiseman JM. Ambient Mass Spectrometry. Mass Spectrom. 2006;311:1566–1570. 10.1007/978-3-642-10711-5_13 [DOI] [PubMed] [Google Scholar]
- 15.Ma X, Ouyang Z. Ambient ionization and miniature mass spectrometry system for chemical and biological analysis. TrAC - Trends Anal Chem. 2016;85:10–19. 10.1016/j.trac.2016.04.009 [DOI] [PMC free article] [PubMed] [Google Scholar]
- 16.Feider CL, Krieger A, Dehoog RJ, Eberlin LS. Ambient Ionization Mass Spectrometry: Recent Developments and Applications. Anal Chem. 2019;91:4266–4290. 10.1021/acs.analchem.9b00807 [DOI] [PMC free article] [PubMed] [Google Scholar]
- 17.Takáts Z, Wiseman JM, Gologan B, Cooks RG. Mass spectrometry sampling under ambient conditions with desorption electrospray ionization. Science. 2004;306:471–473. 10.1126/science.1104404 [DOI] [PubMed] [Google Scholar]
- 18.Cody RB, Laramée JA, Durst HD. Versatile new ion source for the analysis of materials in open air under ambient conditions. Anal Chem. 2005;77:2297–2302. 10.1021/ac050162j [DOI] [PubMed] [Google Scholar]
- 19.Su Y, Wang H, Liu J, Wei P, Cooks RG, Ouyang Z. Quantitative paper spray mass spectrometry analysis of drugs of abuse. Analyst. 2013;138:4443–4447. 10.1039/c3an00934c [DOI] [PMC free article] [PubMed] [Google Scholar]
- 20.Manicke NE, Abu-Rabie P, Spooner N, Ouyang Z, Cooks RG. Quantitative analysis of therapeutic drugs in dried blood spot samples by paper spray mass spectrometry: An avenue to therapeutic drug monitoring. J Am Soc Mass Spectrom. 2011;22:1501–1507. 10.1007/s13361-011-0177-x [DOI] [PubMed] [Google Scholar]
- 21.Gómez-Ríos GA, Pawliszyn J. Development of Coated Blade Spray Ionization Mass Spectrometry for the Quantitation of Target Analytes Present in Complex Matrices. Angew Chemie. 2014;126:14731–14735. 10.1002/ange.201407057 [DOI] [PubMed] [Google Scholar]
- 22.Ren Y, McLuckey MN, Liu J, Ouyang Z. Direct mass spectrometry analysis of biofluid samples using slug-flow microextraction nano-electrospray ionization. Angew Chemie - Int Ed. 2014;53:14124–14127. 10.1002/anie.201408338 [DOI] [PMC free article] [PubMed] [Google Scholar]
- 23.Manicke NE, Yang Q, Wang H, Oradu S, Ouyang Z, Cooks RG. Assessment of paper spray ionization for quantitation of pharmaceuticals in blood spots. Int J Mass Spectrom. 2011;300:123–129. 10.1016/j.ijms.2010.06.037 [DOI] [Google Scholar]
- 24.Espy RD, Teunissen SF, Manicke NE, Ren Y, Ouyang Z, Van Asten A, Cooks RG. Paper spray and extraction spray mass spectrometry for the direct and simultaneous quantification of eight drugs of abuse in whole blood. Anal Chem. 86:7712–7718. 10.1021/ac5016408 [DOI] [PubMed] [Google Scholar]
- 25.Yannell KE, Kesely KR, Chien HD, Kissinger CB, Cooks RG. Comparison of paper spray mass spectrometry analysis of dried blood spots from devices used for in-field collection of clinical samples. Anal Bioanal Chem. 2017;409:121–131. 10.1007/s00216-016-9954-5 [DOI] [PubMed] [Google Scholar]
- 26.Zhang Z, Xu W, Manicke NE, Cooks RG, Ouyang Z. Silica coated paper substrate for paper-spray analysis of therapeutic drugs in dried blood spots. Anal Chem. 2012;84:931–938. 10.1021/ac202058w [DOI] [PMC free article] [PubMed] [Google Scholar]
- 27.Song X, Chen H, Zare RN. Conductive Polymer Spray Ionization Mass Spectrometry for Biofluid Analysis. Anal Chem. 2018;90:12878–12885. 10.1021/acs.analchem.8b03460 [DOI] [PubMed] [Google Scholar]
- 28.Mendes TPP, Pereira I, Ferreira MR, Chaves AR, Vaz BG. Molecularly imprinted polymer-coated paper as a substrate for highly sensitive analysis using paper spray mass spectrometry: Quantification of metabolites in urine. Anal Methods. 2017;9:6117–6123. 10.1039/c7ay01648d [DOI] [Google Scholar]
- 29.Damon DE, Davis KM, Moreira CR, Capone P, Cruttenden R, Badu-Tawiah AK. Direct Biofluid Analysis Using Hydrophobic Paper Spray Mass Spectrometry. Anal Chem. 2016;88:1878–1884. 10.1021/acs.analchem.5b04278 [DOI] [PubMed] [Google Scholar]
- 30.Basuri P, Baidya A, Pradeep T. Sub-Parts-per-Trillion Level Detection of Analytes by Superhydrophobic Preconcentration Paper Spray Ionization Mass Spectrometry (SHPPSI MS). Anal Chem. 2019;91:7118–7124. 10.1021/acs.analchem.9b00144 [DOI] [PubMed] [Google Scholar]
- 31.Fatigante WL, Mukta S, Lawton ZE, Bruno AM, Traub A, Gasa AJ, Stelmack AR, Wilson-Frank CR, Mulligan CC. Filter Cone Spray Ionization Coupled to a Portable MS System: Application to On-Site Forensic Evidence and Environmental Sample Analysis. J Am Soc Mass Spectrom. 2020;31:336–346. 10.1021/jasms.9b00098 [DOI] [PubMed] [Google Scholar]
- 32.Brown HM, McDaniel TJ, Doppalapudi KR, Mulligan CC, Fedick PW. Rapid, In situ detection of chemical warfare agent simulants and hydrolysis products in bulk soils by low-cost 3D-printed cone spray ionization mass spectrometry. Analyst. 2021;146:3127–3136. 10.1039/d1an00255d [DOI] [PubMed] [Google Scholar]
- 33.Ouyang Z, Cooks RG. Miniature Mass Spectrometers. Annu Rev Anal Chem. 2009;2:187–214. 10.1146/annurev-anchem-060908-155229 [DOI] [PubMed] [Google Scholar]
- 34.Snyder DT, Pulliam CJ, Ouyang Z, Cooks RG. Miniature and Fieldable Mass Spectrometers: Recent Advances. Anal Chem. 2016;88:2–29. 10.1021/acs.analchem.5b03070 [DOI] [PMC free article] [PubMed] [Google Scholar]
- 35.Pu F, Zhang W, Bateman KP, Liu Y, Helmy R, Ouyang Z. Using miniature MS system with automatic blood sampler for preclinical pharmacokinetics study. Bioanalysis. 2017;9:1633–1641. 10.4155/bio-2017-0160 [DOI] [PMC free article] [PubMed] [Google Scholar]
- 36.Brown HM, Pu F, Dey M, Miller J, Shah MV, Shapiro SA, Ouyang Z, Cohen-gadol AA, Cooks RG. Intraoperative detection of isocitrate dehydrogenase mutations in human gliomas using a miniature mass spectrometer. Anal Bioanal Chem. 2019;411:7929–7933. 10.1007/s00216-019-02198-y [DOI] [PMC free article] [PubMed] [Google Scholar]
- 37.Szalwinski LJ, Hu Y, Morato NM, Cooks RG, Salentijn GIJ. Novel Ion Trap Scan Modes to Develop Criteria for On-Site Detection of Sulfonamide Antibiotics. Anal Chem. 2021;93:13904–13911. 10.1021/acs.analchem.1c02790 [DOI] [PMC free article] [PubMed] [Google Scholar]
- 38.Li L, Chen TC, Ren Y, Hendricks PI, Cooks RG, Ouyang Z. Mini-12, miniature mass spectrometer for clinical and other applications - Introduction and characterization. Anal Chem. 2014;86:2909–2916. 10.1021/ac403766c [DOI] [PMC free article] [PubMed] [Google Scholar]
- 39.Gao L, Cooks RG, Ouyang Z. Breaking the pumping speed barrier in mass spectrometry: Discontinuous atmospheric pressure interface. Anal Chem. 2008;80:4026–4032. 10.1021/ac800014v [DOI] [PubMed] [Google Scholar]
- 40.Shi RZ, El Gierari ETM, Manicke NE, Faix JD. Rapid measurement of tacrolimus in whole blood by paper spray-tandem mass spectrometry (PS-MS/MS). Clin Chim Acta. 2015;441:99–104. 10.1016/j.cca.2014.12.022 [DOI] [PubMed] [Google Scholar]
- 41.Espy RD, Manicke NE, Ouyang Z, Cooks RG. Rapid analysis of whole blood by paper spray mass spectrometry for point-of-care therapeutic drug monitoring. Analyst. 2012;137:2344–2349. 10.1039/c2an35082c [DOI] [PubMed] [Google Scholar]
- 42.Aouri M, Calmy A, Hirschel B, Telenti A, Buclin T, Cavassini M, Rauch A, Decosterd LA. A validated assay by liquid chromatography-tandem mass spectrometry for the simultaneous quantification of elvitegravir and rilpivirine in HIV positive patients. Journal of Mass Spectrometry. 2013; 48:616–625. 10.1002/jms.3200 [DOI] [PubMed] [Google Scholar]
- 43.Courlet P, Alves Saldanha S, Cavassini M, Marzolini C, Choong E, Csajka C, Günthard HF, André P, Buclin T, Desfontaine V, Decosterd LA. Development and validation of a multiplex UHPLC-MS/MS assay with stable isotopic internal standards for the monitoring of the plasma concentrations of the antiretroviral drugs bictegravir, cabotegravir, doravirine, and rilpivirine in people living with HIV. Journal of Mass Spectrometry. 2018; 55: e4506. 10.1002/jms.4506 [DOI] [PMC free article] [PubMed] [Google Scholar]
Associated Data
This section collects any data citations, data availability statements, or supplementary materials included in this article.