

Abstract
SARS-CoV-2, the etiologic agent of the COVID-19 pandemic, emerged as the cause of a global crisis in 2019. Currently, the main method for identification of SARS-CoV-2 is a reverse transcription (RT)-PCR assay designed to detect viral RNA in oropharyngeal (OP) or nasopharyngeal (NP) samples. While the PCR assay is considered highly specific and sensitive, this method cannot determine the infectivity of the sample, which may assist in evaluation of virus transmissibility from patients and breaking transmission chains. Thus, cell-culture-based approaches such as cytopathic effect (CPE) assays are routinely employed for the identification of infectious viruses in NP/OP samples. Despite their high sensitivity, CPE assays take several days and require additional diagnostic tests in order to verify the identity of the pathogen. We have therefore developed a rapid immunofluorescence assay (IFA) for the specific detection of SARS-CoV-2 in NP/OP samples following cell culture infection. Initially, IFA was carried out on Vero E6 cultures infected with SARS-CoV-2 at defined concentrations, and infection was monitored at different time points. This test was able to yield positive signals in cultures infected with 10 pfu/ml at 12 hours postinfection (PI). Increasing the incubation time to 24 hours reduced the detectable infective dose to 1 pfu/ml. These IFA signals occur before the development of CPE. When compared to the CPE test, IFA has the advantages of specificity, rapid detection, and sensitivity, as demonstrated in this work.
Supplementary Information
The online version contains supplementary material available at 10.1007/s00705-022-05392-z.
Introduction
The coronavirus disease 2019 (COVID-19) pandemic has been declared a “public health emergency of international concern” by the World Health Organization (WHO). COVID-19 exhibits high morbidity and substantial mortality. Countermeasures applied to mitigate the pandemic have also unfortunately resulted in some cases in dramatic deleterious consequences for human society and the global economy. COVID-19 is caused by severe acute respiratory syndrome coronavirus 2 (SARS-CoV-2), which was identified as the seventh coronavirus to infect humans. Other pathogenic coronaviruses include the severe acute respiratory syndrome coronavirus (SARS-CoV) and Middle East respiratory syndrome coronavirus (MERS-CoV). SARS-CoV-2 utilizes its homotrimeric spike glycoprotein (S) to bind its receptor, angiotensin-converting enzyme 2 (ACE2) on the host cell surface as a major route for cellular infection [1]. SARS-CoV-2 is transmitted by respiratory droplets originating from contagious individuals [2].
Currently, the main method of identification of SARS-CoV-2 is reverse transcription (RT)-real time PCR of upper respiratory oropharyngeal (OP) or nasopharyngeal (NP) samples, collected by swabs [3]. Though sensitive and specific, this direct nucleic acid detection test cannot differentiate between viable and non-viable viruses. Moreover, the correlation between SARS-CoV-2 real-time PCR results (Ct values) and infectivity is still not clear [4, 5]. Thus, the patient's disease state and infectivity remain unknown. Indeed, recent studies have shown that SARS-CoV-2 RNA remains detectable weeks after recovery [6, 7]. In addition, it has been shown that no viable virus could be recovered eight days after symptom onset despite the presence of viral RNA [8, 9]. Virus shedding occurs before and soon after onset of illness [10]. Thus, infectivity assays may assist in evaluating virus transmissibility from patients and help break transmission chains.
Identification of viable viruses derived from clinical samples is usually carried out using cell-culture-based methods. Particularly, Vero E6 cells are widely used for SARS-CoV-2 propagation and diagnosis by observing a cytopathic effect (CPE). In practice, CPE is a general phenomenon caused by numerous viruses and is detectable within several days by light microscopy. Subsequent real-time PCR assays may then confirm the presence of viral genomic RNA [11, 12]. As CPE assays are lengthy (requiring several days to a week), a faster assay for assessing infectivity would be of great advantage. Here, we present the development of an infectivity assay that relies on immunofluorescence. Whereas CPE formation requires massive virus replication in cells, immunolabeling of infected cells (immunofluorescence assay, IFA) may be used for rapid virus detection prior to CPE formation. This is feasible if cells express viral proteins at detectable levels at early stages of infection. In contrast to PCR assays, which detect nucleic acids, IFA detects viral proteins, whose presence constitutes direct evidence of cellular infection.
The aim of the current study was to develop a rapid, sensitive, and specific IFA for SARS-CoV-2. This article describes the development of the test and shows preliminary results obtained from 44 NP/OP specimens positive for SARS-CoV-2 by RT-PCR derived from routine clinical surveys for COVID-19 in elderly care facilities (population and care staff) in Israel.
Materials and methods
Antibodies
FITC-conjugated anti-rabbit IgG (catalog no. F6005, Sigma) was used in this study as the secondary antibody in IFA. Anti-SARS-CoV-2 antibodies, produced in-house, were used in this study for virus detection (Fig. 1A and [13]). Briefly, rabbits were inoculated five times intravenously with 106 PFU of live SARS-CoV-2 at days 0, 7, 10, 14, and 17. Serum was collected 14 days after the final dose. The binding ability of the immunized rabbit serum was confirmed by ELISA (Fig. 1B).
Fig. 1.

(A) Rabbit immunization. Rabbits were inoculated five times intravenously with 106 PFU of live SARS-CoV-2 on days 0, 7, 10, 14, and 17 PI. Serum was collected 14 days after the final dose. (B) Binding curves of IgG polyclonal antibodies from rabbit serum were obtained by ELISA against the S1 subunit of the spike glycoprotein. Points represent the average of duplicates ± SEM
Cell lines
African green monkey kidney (Vero) clone E6 cells (ATCC® CRL-1586™) were obtained from the American Type Culture Collection (ATCC). Cells were cultured in Dulbecco’s modified Eagle’s medium (DMEM) containing 10% (v/v) fetal bovine serum (FBS), 1% L-glutamine, 1% (v/v) non-essential amino acids (NEAA), and 0.5% (v/v) antibiotics and incubated at 37 °C under 5% CO2 in a humidified incubator. All reagents were purchased from Biological Industries, Beit-Haemek, Israel.
Viruses
SARS-CoV-2 (GISAID accession EPI_ISL_406862) was kindly provided by the Bundeswehr Institute of Microbiology, Munich, Germany. Viral stocks were propagated (4 passages) and titrated on Vero E6 cells. All handling of virus was done in a BSL3 facility in accordance with the biosafety guidelines of the Israel Institute for Biological Research (IIBR).
Virus was grown overnight on Vero E6 cells in DMEM containing 10% FBS, MEM non-essential amino acids, 2 mM L-glutamine, and antibiotics (Biological Industries, Israel). Titration of the virus was carried out as described recently [14].
Infection of Vero E6 cells with SARS-CoV-2 for PCR, IFA, and CPE assays
Vero E6 were infected with known concentrations of SARS-CoV-2 or RT-PCR-positive NP/OP samples from COVID-19 patients. A 300-µl suspension of Vero E6 cells was seeded at 2 × 10⁵ cells/well or 5 × 10⁵ cells/well in 8-well chambers (LabTek™, Nunc) or 12-well plates (Greiner Bio-One), respectively, and incubated at 37 °C for 24 hours. Then, 1-ml samples of the NP/OP swab specimens (Lingen, viral transport medium.) were centrifuged for 10 min at 10,000 × g at 22 °C. The cells were infected with 150 µl of NP/OP supernatant samples or known concentrations of SARS-CoV-2 (1-50 pfu/ml) and incubated for one hour at 37 °C under 5% CO2 in a humidified incubator. Next, 150 µl or 1 ml of 2% FCS-DMEM containing 0.15% bicarbonate was added, and the cells were incubated for 24 hours, 48 hours, or 5 days. Samples were taken for RT-PCR, IFA, and CPE at these time points as described below.
RNA extraction and RT real time PCR analysis
All procedures for RNA extraction and RT real-time PCR analysis were done as described previously [15]. Briefly, 200 µl of each sample was transferred to 150 µl of lysis buffer, followed by incubation for 20 minutes at room temperature for virus denaturation and inactivation. RNA was extracted using an RNAdvance Viral Kit and a Biomek i7 Automated Workstation (Beckman Coulter) and eluted with 25-50 µl of water.
Primers and probes for the SARS-CoV-2 E and N genes were designed according to the Berlin protocol [16], and RT-PCR assays were performed according to WHO instructions, using a SensiFAST Probe Lo-ROX One-Step Kit (Bioline). The sensitivity of the RT real-time PCR was determined by performing a virus dilution assay, and the lowest virus concentration detected was 0.1 pfu/ml (Supplementary Fig. S1).
Immunofluorescence assays for the detection of SARS-CoV-2-infected cells
Uninfected and SARS-CoV-2-infected cells were fixed with 4% paraformaldehyde (PFA) for 20 minutes, permeabilized with 0.5% Triton X-100 for 2 minutes, and blocked with 2% FBS for 20 minutes. SARS-CoV-2-positive cells were detected using 1:100-diluted anti-SARS-CoV-2 polyclonal antibodies for 30 minutes in a humid chamber. After washing with double-distilled water, cells were incubated with a 1:200 dilution of FITC-conjugated anti rabbit-IgG and counterstained with 1 µg of 4′,6-diamidino-2-phenylindole (DAPI) per ml. Cells were visualized using an Axioskop fluorescence microscope (Zeiss) equipped with a DS-iR1 camera (Nikon), and images were taken using NIS-elements software (Nikon).
Clinical samples
Nasopharyngeal (NO) and oropharyngeal (OP) swab specimens were collected as part of a routine clinical survey performed in elderly care facilities (population and care staff) in Israel. Ethical review and approval were waived by the Israel Health Department because the samples used for this study were leftover anonymized samples.
Results
Assessment of anti-SARS-CoV-2 antibodies from immunized rabbits by ELISA
The main goal of this study was to develop a specific immunofluorescence assay for the detection of SARS-CoV-2. Initially, the steps for production of specific anti-SARS-CoV-2 antibodies were implemented. Rabbits were immunized iv with 106 PFU of live SARS-CoV-2 on days 0, 7, 10, 14, and 17 PI, and serum was collected 14 days after the final dose. The presence of anti-SARS-CoV-2 antibodies in the serum was detected by ELISA using the S1 subunit of the SARS-CoV-2 spike glycoprotein as the antigen. Serum collected from rabbits immunized with SARS-CoV-2 was serially diluted and added to microplates coated with SARS-CoV-2 S1 subunit (Fig. 1B). The binding curves shown in Fig. 1B demonstrate the binding capability of anti-SARS-CoV-2 antibodies in rabbit serum. These antibodies were used for IFA studies, as presented below.
Development of an immunofluorescence assay for detection of SARS-CoV-2
Identification of viruses in clinical samples can be carried out using cell culture techniques. In particular, Vero E6 are widely used for SARS-CoV-2 propagation and diagnosis, as these cells are readily infected, produce high virus titers, and exhibit a characteristic cytopathic effect (CPE) within several days [11, 17]. Immunofluorescence assays are commonly used for diagnosis of pathogens in clinical settings [18]. In this study, we developed an in-house IFA for detection of SARS-CoV-2-infected Vero E6 cells and compared it to the standard CPE assay. Initially, we sought to determine the feasibility of using the IFA for specific detection of SARS-CoV-2 in infected cells. For this purpose, the cells were seeded in 8-well chambers, and after attachment, they were infected with the virus at a concentration of 50 pfu/ml or 25 pfu/ml for 48 hours. Virus was detected by IFA, and this was confirmed by RT-PCR using supernatants from infected cells. As can be seen in Fig. 2, panels A-C, infection of Vero E6 cells with SARS-CoV-2 at 25 pfu/ml or 50 pfu/ml for 48 hours resulted a significant positive staining of the cultures, while uninfected cells showed a negligible fluorescent background. In parallel, a CPE assay was conducted. At 48 hours PI, undefined clear areas suggesting the development of CPE were observed (Fig. 2E and F, white arrows), but this was not seen at the lower concentrations of 1 and 10 pfu/ml (Supplementary Fig. S2). Uninfected cells did not show CPE (Fig. 2D). The growth of SARS-CoV-2 in Vero E6 cells was confirmed by RT real-time PCR. The results showed a reduction in the Ct values of roughly 20 over two days for the 25 pfu/ml and 50 pfu/ml concentrations, demonstrating the SARS-CoV-2 growth in the cells. The combined results demonstrate the capability of the IFA to detect SARS-CoV-2 in Vero E6 cultures.
Fig. 2.

(A-C) Vero E6 cells were either mock infected or infected with SARS-CoV-2 at the indicated concentrations for 48 hours and then fixed and immunolabeled with immunized rabbit serum and a secondary goat anti Rb-FITC antibody. (A) Uninfected cells exhibit a low fluorescent background. (B and C) Significant infection of the cells (as indicated by green color) could be seen at concentrations of 25 and 50 pfu/ml at 48 hours PI. (D-F) Vero E6 cells were either mock infected or infected with the indicated concentrations of SARS-CoV-2 and then incubated for 48 hours and monitored for CPE development. Undefined clear areas suggesting the development of CPE (white arrows) were seen when concentrations of 25 and 50 pfu/ml were used for infection. Uninfected cells did not show an observable cytopathic effect. Bar = 100 µm
Next, we sought to determine the sensitivity of the assay and evaluate its ability to detect early infection of the cells by SARS CoV-2. For this purpose, we seeded VeroE6 cells in 8-well chambers and incubated them at 37 °C for 24 hours to allow attachment. Next, the cells were infected with SARS-CoV-2 at different doses (1-50 pfu/ml). Cells were monitored by IFA for viral growth at 12 and 24 hours PI. Representative images obtained from random fields are shown in Fig. 3. As can be seen, infection of cells with 10-50 pfu of SARS-CoV-2 per ml resulted in positive detection of the virus within 12 hours (Fig. 3, panels B-D), while extending the incubation time to 24 hours allowed the detection of fluorescence in cells infected with virus at 1 pfu/ml (Fig. 3, panels E-H). The IFA results were supported by RT real-time PCR analysis demonstrating a reduction in the Ct value of approximately 20 for the 10-50 pfu/ml virus concentrations at 24 hours PI, while a significant reduction in the Ct value at the lower concentration of 1 pfu/ml was observed only at 48 hours PI. CPE was not observed at 24 hours PI at any of the tested virus concentrations (Supplementary Fig. S3). These results emphasize the advantage of using the IFA for early detection of SARS-CoV-2 in infected Vero E6 cells compared to using a CPE assay.
Fig. 3.

Detection of SARS-CoV-2 in Vero E6 cells using an indirect immunofluorescence assay. (A-H) Vero E6 cells were seeded in 8-well LabTek chambers and incubated for 24 hours at 37 °C to allow cell adhesion. Cells were infected with SARS-CoV-2 at concentrations of 1-50 pfu/ml for 12 hours (A-D) or 24 hours (E-H) and then fixed and immunolabeled with 1:100-diluted SARS-CoV-2-immunized rabbit serum, followed by the addition of FITC-conjugated anti-rabbit IgG (green color). Bar = 100 µm
Validation of the developed IFA using positive NP/OP samples from patients
We next sought to verify the capability of this assay to detect SARS-CoV-2 in clinical samples. To this end, we tested 44 clinical samples previously determined to be positive for SARS-CoV-2 by RT real-time PCR (Fig. 4). The results were clustered into three representative groups: IFA+/CPE+, IFA-/CPE+, and IFA- /CPE-.
Fig. 4.
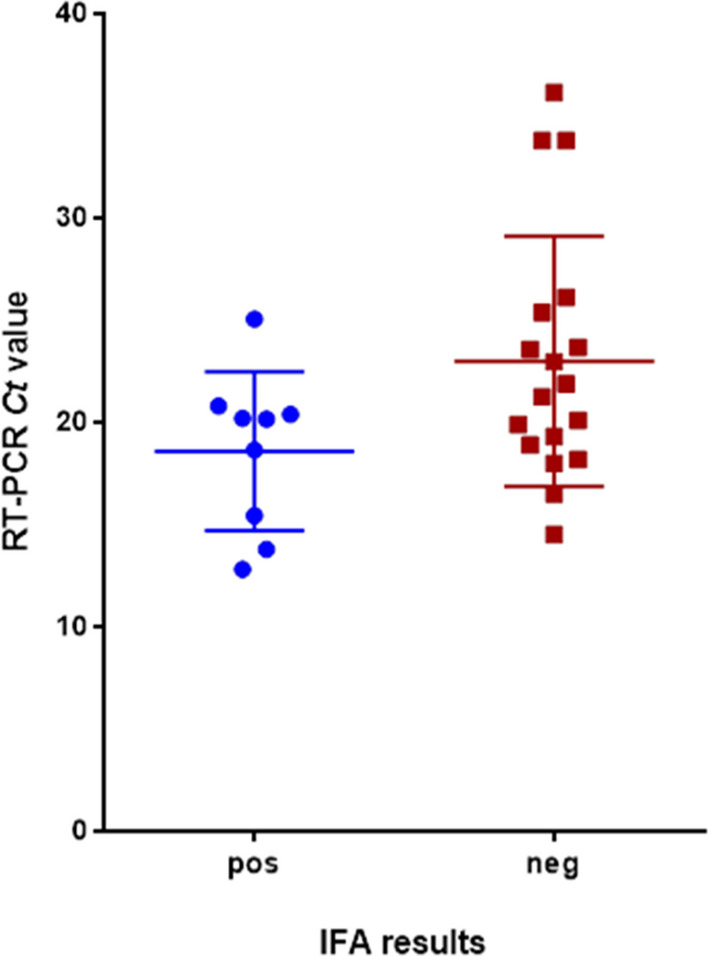
Correlation between RT real-time PCR of SARS-CoV-2 (Ct value) and IFA results. Forty-four NO/NP clinical specimens were tested by RT real-time PCR for SARS-CoV-2 RNA and for infectious virus using the newly developed IFA. As shown, samples with Ct > 26 were negative in the IFA. No strict correlation was observed with samples with Ct < 18
Representative images obtained with IFA+/CPE+ samples yielding positive IFA results at 48 hours PI and five days PI are shown in Fig. 5A1-D1. In agreement with the IFA results, CPE was detected at five days PI with both samples (Fig. 5, panels B2 and D2). No CPE was observed at 48 hours PI with sample #1 (Fig. 5, panel A2), and moderate morphology changes implying the onset of CPE were seen with sample #2 (Fig. 5, panel C2, white arrow). Thus, a positive IFA signal precedes CPE formation in this case.
Fig. 5.

Vero E6 cells were infected with two confirmed SARS-CoV-2-positive NP/OP samples (#1 and #2) for 48 hours or five days and then processed for IFA (panels A1-D1) and CPE assays (panels A2-D2). (A1-D1) Representative IFA images showing prominent infection of the cells (green color). (A2 and B2) Representative light microscopy images showing no visible CPE at 48 hours PI for sample #1. At five days PI, CPE was clearly observed. (C2 and D2) The CPE was less definitive in the case of sample #2. Some clear areas in the cell cultures were observed, possibly representing the onset of CPE (white arrows)
NP/OP samples are by nature heterogeneous because they are comprised of many undefined constituents, and are variable among individuals (and even over time for a specific individual). In addition, they may contain a variety of culturable respiratory viruses and bacteria, many of which (mainly viruses) may induce CPE [19]. Figure 6 shows an example of a sample from the IFA-/CPE+ group exhibiting nonspecific positive CPE that is not supported by IFA (Fig. 6A1, A2). In this NP/OP sample, there was no IFA signal, even at 5 days PI, although substantial CPE was observed. Thus, the use of CPE assays alone can lead to false-positive results, while IFA is more specific, reducing such false results.
Fig. 6.

Vero E6 cells were infected for five days with three confirmed SARS-CoV-2-positive NP/OP samples (#3, #4, #5) and then processed for IFA (panels A1-C1) and CPE assays (panels A2-C2). (A1-C1) Representative IFA images showing no infection with samples #3 and #4 or prominent infection of the cells in the case of sample #5 (green color). (A2) Representative light microscope images showing nonspecific CPE in the case of sample #3. (B2) In agreement with the IFA results, no CPE was seen in the case of sample #4. (C2) The onset of CPE was observed in the cell cultures after infection with sample #5. The CPE observed is in agreement with the IFA results obtained with this specific sample
Panels B1 and B2 show an example of images obtained using IFA- /CPE- samples, revealing negative IFA and CPE after infection with an NP/OP sample. Although the NP/OP sample used for infection of the cells was confirmed to be positive for SARS-CoV-2, there was no viral growth in culture, even after five days, as demonstrated by IFA, CPE, and RT real-time PCR analysis of supernatants from this sample (no changes in Ct value were detected over five days of infection). Panels C1 and C2 show positive IFA and CPE results in Vero E6 cultures five days after inoculation with another NP/OP sample (supported by RT-PCR).
Overall, our results support the notion that IFA is superior to CPE. This is demonstrated by the sensitivity, rapidity, and specificity of the method in comparison to the CPE assay.
Discussion
Diagnosis of COVID-19 relies mainly on RT-PCR assays that identify viral genetic material in NP/OP clinical samples directly [15]. However, the presence of SARS-CoV-2 RNA in a sample does not necessarily mean that viable virus is present. Infectivity is even less directly evident. Currently, determination of infectivity of clinical samples relies on CPE assays in cell cultures combined with specific RT-PCR analysis for confirmation that SARS-CoV-2 is the infectious agent in the sample. The time frame for CPE is usually several days [12, 20]. In general, CPE can be induced by viruses as well as intracellular bacteria [21]. This makes CPE a nonspecific, if relatively sensitive, phenomenon that needs to be supported by additional tests for validation of infection by a specific pathogen.
In the current study, we aimed to address this limitation by developing a sensitive assay for infectivity that is both faster and more specific than the CPE assay. This method combines an immuno-based assay for SARS-CoV-2 detection with cell culture techniques. Specifically, cells are inoculated with a sample suspected of containing SARS-CoV-2, and, upon successful infection, an immunofluorescence assay specifically detects the multiplying viral antigens in the infected tissue culture. Ideally, this should be achievable prior to CPE formation. Initially, an infectious SARS-CoV-2 preparation was used to infect cells for 24 and 48 hours at different concentrations. Effective infection depends on many parameters, including the type of cells and their susceptibility to infection by a specific virus, passage of the cultures, and the virus concentrations used for infection.
An IFA for detection of SARS-CoV-2 was published recently. A serological IFA was developed to detect SARS-CoV-2 IgG antibodies in the serum of COVID-19 patients using cells exogenously expressing the SARS-CoV-2 spike [22]. Serological IFA is commonly used for detection of previous infections with SARS-CoV-2 (or other pathogens as well) [23–25]. However, as IgG antibodies are not detectable until days/weeks after exposure, this type of assay is not suitable for rapid and direct detection of SARS-CoV-2 infections. In another study, an IFA was developed for the detection of the SARS-CoV-2 nucleocapsid antigen in cells isolated directly from throat wash samples of patients [26]. In that work, the authors were able to detect viral antigen in 11 out of 17 samples from COVID-19 patients. In contrast, assay described here is based on virus replication in cell culture. In this manner, enrichment of the virus is achieved, leading to rapid, direct detection by IFA. Hence, the current IFA assay requires infectious SARS-CoV-2 particles, directly demonstrating the infectivity of the sample in the process.
Virus isolation and diagnosis using clinical samples is fraught with many challenges. For instance, NP/OP samples potentially contain diverse respiratory pathogens in addition to SARS-CoV-2 [19], which might also infect the queried cell cultures [27]. This was demonstrated in our study. RT-PCR-positive NP/OP samples were used to infect Vero E6 cells, and after five days, CPE was monitored and the IFA protocol was performed. In some cases, CPE was observed (Fig. 6, panel A1) while IFA was negative and RT-PCR values hardly changed over time, indicating a lack of SARS-CoV-2 replication. These results suggest that the observed CPE was induced by another pathogen and emphasize the advantage of adding specificity by combining an immunoassay application to the observation of CPE and the original positive RT-PCR result. In addition, with sample #1 we were able to observe infection by IFA after 48 hours, before the onset of CPE (Fig. 5, panels A1 and 2). At five days PI, CPE was seen concomitant with positive IFA. This result demonstrates another merit of our methodology over CPE, which is a significant (days) shortening of the duration of the test.
Identification of CPE requires skill and expertise and is not always straightforward, while IFA signals are usually clearer and easier to identify. Overall, 44 NP/OP samples that were positive by RT-PCR were examined for viral infectivity by IFA. Of these, 14 were found to be positive by cell-culture-based IFA (31.8%). The low infectivity rate might have been a result of a loss of virus viability in a sample, positivity of the specimen due to presence of viral RNA without viable viral particles, or a very low viral concentration – insufficient to sustain infection (or inducing such low levels if infection that more time was required for identification). In addition, the NP/OP specimens used in this study were obtained from asymptomatic individuals, which might explain the low correlation between IFA and Ct values in real-time RT-PCR, as shown previously [28]. Further comprehensive studies are needed to validate the correlation of the IFA relative to RT real-time PCR. A previous study conducted on 90 NP/OP and endotracheal samples revealed that 28.9% of the samples contained viable SARS-CoV-2 particles as detected by tissue culture infection dose 50% assay (TCID50) in Vero cells [29]. These results are consistent with the findings obtained in our study in which infectivity was detected in 31.8% of the specimens by IFA. In our study, there was no detectable growth of virus in any of the samples with Ct values > 25. This result is similar to those of a previous study that showed significantly reduced viral growth in NP/OP and endotracheal samples with Ct values > 24 [29]. One main limitation of the current study is the use of polyclonal antibodies, which might show variations between batches. This issue could be addressed by performing routine standardized batch-to-batch comparisons in order to validate the performance of each new polyclonal antibody preparation.
In conclusion, we show that tissue culture infection and IFA for detection of infectious SARS-CoV-2 is superior to CPE in terms of specificity, rapidity, and sensitivity. The results of our study imply that positive NP/OP specimens are not always infectious. Community health measures for prevention of SARS-CoV-2 spread are crucial for the eradication of COVID-19. In addition to genetic and immuno-based diagnostic assays, rapid assays for detection of infectivity of a virus in a sample will contribute to breaking the chain of infection and preventing the spread of the virus in the population.
Supplementary Information
Below is the link to the electronic supplementary material.
Acknowledgements
This study was supported by the Israel Institute for Biological Research. We would like to thank Dr. Itai Glinert and Dr. Hagit Achdout, for critically reviewing the manuscript and helping with materials.
Funding
No funding was received to assist with the preparation of this manuscript.
Declarations
Conflict of interest
The authors have no conflicts of interest to declare that are relevant to the content of this article.
Footnotes
Publisher's Note
Springer Nature remains neutral with regard to jurisdictional claims in published maps and institutional affiliations.
Yafit Atiya-Nasagi and Elad Milrot contributed equally.
Contributor Information
Yafit Atiya-Nasagi, Email: yafita@iibr.gov.il.
Elad Milrot, Email: Eladm@iibr.gov.il.
Efi Makdasi, Email: Efim@iibr.gov.il.
Ofir Schuster, Email: ofirsc@iibr.gov.il.
Shlomo Shmaya, Email: shlomosh@iibr.gov.il.
Irit Simon, Email: irits@iibr.gov.il.
Amir Ben-Shmuel, Email: amirb@iibr.gov.il.
Adi Beth-Din, Email: adib@iibr.gov.il.
Shay Weiss, Email: shayw@iibr.gov.il.
Orly Laskar, Email: orlyl@iibr.gov.il.
References
- 1.Walls AC, et al. Structure, function, and antigenicity of the SARS-CoV-2 spike glycoprotein. Cell. 2020;181(2):281–292.e6. doi: 10.1016/j.cell.2020.02.058. [DOI] [PMC free article] [PubMed] [Google Scholar]
- 2.Wang Z, et al. Transmission and prevention of SARS-CoV-2. Biochem Soc Trans. 2020;48(5):2307–2316. doi: 10.1042/BST20200693. [DOI] [PubMed] [Google Scholar]
- 3.Chan JF et al (2020) Improved molecular diagnosis of COVID-19 by the novel, highly sensitive and specific COVID-19-RdRp/Hel real-time reverse transcription-PCR assay validated in vitro and with clinical specimens. J Clin Microbiol 58(5) [DOI] [PMC free article] [PubMed]
- 4.Berg MG, et al. Development of the RealTime SARS-CoV-2 quantitative Laboratory Developed Test and correlation with viral culture as a measure of infectivity. J Clin Virol. 2021;143:104945. doi: 10.1016/j.jcv.2021.104945. [DOI] [PMC free article] [PubMed] [Google Scholar]
- 5.Rhoads D, et al. College of American Pathologists (CAP) Microbiology Committee Perspective: caution must be used in interpreting the cycle threshold (Ct) value. Clin Infect Dis. 2021;72(10):e685–e686. doi: 10.1093/cid/ciaa1199. [DOI] [PubMed] [Google Scholar]
- 6.To KK, et al. Temporal profiles of viral load in posterior oropharyngeal saliva samples and serum antibody responses during infection by SARS-CoV-2: an observational cohort study. Lancet Infect Dis. 2020;20(5):565–574. doi: 10.1016/S1473-3099(20)30196-1. [DOI] [PMC free article] [PubMed] [Google Scholar]
- 7.Xiao AT, et al. Dynamic profile of RT-PCR findings from 301 COVID-19 patients in Wuhan, China: a descriptive study. J Clin Virol. 2020;127:104346. doi: 10.1016/j.jcv.2020.104346. [DOI] [PMC free article] [PubMed] [Google Scholar]
- 8.Perera R, et al. SARS-CoV-2 virus culture and subgenomic RNA for respiratory specimens from patients with mild coronavirus disease. Emerg Infect Dis. 2020;26(11):2701–2704. doi: 10.3201/eid2611.203219. [DOI] [PMC free article] [PubMed] [Google Scholar]
- 9.Wölfel R, et al. Virological assessment of hospitalized patients with COVID-2019. Nature. 2020;581(7809):465–469. doi: 10.1038/s41586-020-2196-x. [DOI] [PubMed] [Google Scholar]
- 10.He X, et al. Temporal dynamics in viral shedding and transmissibility of COVID-19. Nat Med. 2020;26(5):672–675. doi: 10.1038/s41591-020-0869-5. [DOI] [PubMed] [Google Scholar]
- 11.Chu H, et al. Comparative tropism, replication kinetics, and cell damage profiling of SARS-CoV-2 and SARS-CoV with implications for clinical manifestations, transmissibility, and laboratory studies of COVID-19: an observational study. Lancet Microbe. 2020;1(1):e14–e23. doi: 10.1016/S2666-5247(20)30004-5. [DOI] [PMC free article] [PubMed] [Google Scholar]
- 12.Kaye M. SARS-associated coronavirus replication in cell lines. Emerg Infect Dis. 2006;12(1):128–133. doi: 10.3201/eid1201.050496. [DOI] [PMC free article] [PubMed] [Google Scholar]
- 13.Falach R et al (2021) Mice with induced pulmonary morbidities display severe lung inflammation and mortality following exposure to SARS-CoV-2. JCI Insight 6(12) [DOI] [PMC free article] [PubMed]
- 14.Schuster O, et al. Specific and rapid SARS-CoV-2 identification based on LC-MS/MS analysis. ACS Omega. 2021;6(5):3525–3534. doi: 10.1021/acsomega.0c04691. [DOI] [PMC free article] [PubMed] [Google Scholar]
- 15.Israeli O et al (2020) Evaluating the efficacy of RT-qPCR SARS-CoV-2 direct approaches in comparison to RNA extraction. Int J Infect Dis [DOI] [PMC free article] [PubMed]
- 16.Corman VM et al (2020) Detection of 2019 novel coronavirus (2019-nCoV) by real-time RT-PCR. Euro Surveill 25(3) [DOI] [PMC free article] [PubMed]
- 17.Ogando NS, et al. SARS-coronavirus-2 replication in Vero E6 cells: replication kinetics, rapid adaptation and cytopathology. J Gen Virol. 2020;101(9):925–940. doi: 10.1099/jgv.0.001453. [DOI] [PMC free article] [PubMed] [Google Scholar]
- 18.Madeley CR, Peiris JS. Methods in virus diagnosis: immunofluorescence revisited. J Clin Virol. 2002;25(2):121–134. doi: 10.1016/S1386-6532(02)00039-2. [DOI] [PubMed] [Google Scholar]
- 19.Heikkinen T, et al. Nasal swab versus nasopharyngeal aspirate for isolation of respiratory viruses. J Clin Microbiol. 2002;40(11):4337–4339. doi: 10.1128/JCM.40.11.4337-4339.2002. [DOI] [PMC free article] [PubMed] [Google Scholar]
- 20.Basile K et al (2020) Cell-based culture of SARS-CoV-2 informs infectivity and safe de-isolation assessments during COVID-19. Clin Infect Dis [DOI] [PMC free article] [PubMed]
- 21.Chen SM, et al. Cultivation of Ehrlichiachaffeensis in mouse embryo, Vero, BGM, and L929 cells and study of Ehrlichia-induced cytopathic effect and plaque formation. Infect Immun. 1995;63(2):647–655. doi: 10.1128/iai.63.2.647-655.1995. [DOI] [PMC free article] [PubMed] [Google Scholar]
- 22.Nguyen D, Skelly D, Goonawardane N (2021) A novel immunofluorescence assay for the rapid serological detection of SARS-CoV-2 infection. Viruses 13(5) [DOI] [PMC free article] [PubMed]
- 23.Edouard S, et al. Evaluating the serological status of COVID-19 patients using an indirect immunofluorescent assay, France. Eur J Clin Microbiol Infect Dis. 2021;40(2):361–371. doi: 10.1007/s10096-020-04104-2. [DOI] [PMC free article] [PubMed] [Google Scholar]
- 24.Michel M, et al. Evaluating ELISA, immunofluorescence, and lateral flow assay for SARS-CoV-2 serologic assays. Front Microbiol. 2020;11:597529. doi: 10.3389/fmicb.2020.597529. [DOI] [PMC free article] [PubMed] [Google Scholar]
- 25.Hueston L et al (2020) The antibody response to SARS-CoV-2 infection. Open Forum Infect Dis 7(9) [DOI] [PMC free article] [PubMed]
- 26.Liu IJ, et al. Immunofluorescence assay for detection of the nucleocapsid antigen of the severe acute respiratory syndrome (SARS)-associated coronavirus in cells derived from throat wash samples of patients with SARS. J Clin Microbiol. 2005;43(5):2444–2448. doi: 10.1128/JCM.43.5.2444-2448.2005. [DOI] [PMC free article] [PubMed] [Google Scholar]
- 27.Smith CD, et al. Alternative cell line for virus isolation. J Clin Microbiol. 1986;24(2):265–268. doi: 10.1128/jcm.24.2.265-268.1986. [DOI] [PMC free article] [PubMed] [Google Scholar]
- 28.Gniazdowski V, et al. Repeated coronavirus disease 2019 molecular testing: correlation of severe acute respiratory syndrome coronavirus 2 culture with molecular assays and cycle thresholds. Clin Infect Dis. 2021;73(4):e860–e869. doi: 10.1093/cid/ciaa1616. [DOI] [PMC free article] [PubMed] [Google Scholar]
- 29.Bullard J, et al. Predicting infectious severe acute respiratory syndrome coronavirus 2 from diagnostic samples. Clin Infect Dis. 2020;71(10):2663–2666. doi: 10.1093/cid/ciaa638. [DOI] [PMC free article] [PubMed] [Google Scholar]
Associated Data
This section collects any data citations, data availability statements, or supplementary materials included in this article.