

Abstract
Purpose:
This study aimed to investigate the efficacy of human-derived umbilical cord mesenchymal stem cells (HDUMSC) and human-derived umbilical cord mesenchymal stem cells expressing erythropoietin (HDUMSC-EPO) to rescue total degenerated retina in a rat model.
Methods:
The study included four treatment groups, namely negative control using normal saline (HBSS) injection, positive control using sodium iodide 60 mg/kg (SI), SI treated with HDUMSC, and SI treated with HDUMSC-EPO given via subretinal and intravenous routes, to test the efficacy of retinal regeneration following SI-induced retinal degeneration. Retinal function in both phases was tested via electroretinography (ERG) and histological staining examining the outer nuclear layer (ONL).
Results:
There was a statistically significant result (P < 0.05) in the SI treated with HDUMSC-EPO only when comparing day 11 (mean = 23.6 μv), day 18 (mean = 25.2 μv), day 26 (mean = 26.3 μv), and day 32 (mean = 28.2 μv) to the b-wave ERG on day 4 rescue injection day (mean = 12.5 μv). The SI treated with HDUMSC-EPO showed significant improvement in b-wave ERG readings in the Sprague–Dawley (SD) rat but did not restore baseline readings prior to degeneration (day 0). Both treated groups’ ONL thicknesses did not show significant changes compared to the negative control group (HBSS) following rescue therapy.
Conclusion:
Total retinal degeneration following intravenous SI injection was observed at 60 mg/kg. SI treated with HDUMSC and HDUMSC-EPO showed no regenerative potential compared to baseline in SI-induced total retina degeneration on ERG or histology, whereas SI treated with HDUMSC-EPO group showed a substantial increase in b-wave ERG amplitude over time.
Keywords: Electroretinography, HDUMSC, HDUMSC-EPO, ONL, retinal degenerative disease, Sprague–Dawley rat
Retinal pigment epithelium (RPE) degeneration leads to chronic outer retinal diseases. These include common conditions such as retinitis pigmentosa, age-related macular degeneration, and less common diseases such as Stargardt’s disease.[1] RPE is vital for photoreceptor phagocytosis, retinal cycle, transport of nutrients, and production of growth factors.[1]
A study by Wang et al.[2] found that sodium iodate (SI) can induce RPE disintegration and loss in 2–12 hours in C57BL/6J mice2 at the recommended dose of 50–70 mg/kg.[3,4,5] Histological findings showed the disruption of the photoreceptors and outer nuclear layer (ONL) following injection of SI.[2] This potentially initiates a chemically induced model of retinal degeneration in mice. More recently, Koh et al.[6] found that the effects of SI on the retina can be reproduced in Sprague–Dawley (SD) rats. They also reported that the concentration of SI causing electrophysiological evidence of retinal degeneration was 60 mg/kg and above.
Mesenchymal stem cells (MSC) are multipotent adult stromal cells with a reduced chance of malignant transformation following transplantation.[7] MSCs have the capacity to self-regenerate and can be derived from bone marrow, umbilical cord tissue, dental pulp, and adipose tissue.[1,8] In vitro studies have shown that MSC can differentiate into photoreceptors and RPE within 8–63 days.[7]
The therapeutic effect of MSC is observed by the secretion of growth factors upon direct transplantation to the retina and differentiation into retinal tissue or by a paracrine effect.[1,8,9] Furthermore, it also provides anti-apoptotic effects and modulation of immune responses at the inflamed site.[10]
The subretinal injection of human-derived umbilical cord mesenchymal stem cells (HDUMSC) in Royal College of Surgeons (RCS) rats with programmed retinal dystrophy showed morphologically improved ONL cell thickness and ERG mixed b-wave responses.[9] HDUMSC causes morphological changes through paracrine effects attributed to brain-derived neurotrophic factor (BDNF).[9]
MSC have a lower risk of rejection due to low immunogenicity. In the presence of intact blood–retinal barrier with normal RPE function, the subretinal space is immune-privileged.[11] Subretinal injection of stem cells is superior to vitreous stem cell delivery as it allows more cell graft migration and differentiation.[11] Optimal delivery of stem cells can be achieved by performing a scleral incision with a needle or blade, followed by stem cell injection to reduce disruption to the blood–retinal barrier.[11] Despite numerous studies into the application of MSC, the findings are ambiguous, and there are still unanswered questions as to the best formulation of MSC to facilitate retinal regeneration.
Erythropoietin (EPO) is a 30.4-kDa glycoprotein that stimulates humoral factors for erythrocyte production. It is found in the liver, kidney, brain, and retina.[12] In diabetic macula edema and proliferative retinopathy, the erythropoietin level is higher in the vitreous than in plasma, whereas mRNA is higher in RPE than in neuroretina.[13] Erythropoietin can activate nuclear factor kappa-light-chain-enhancer of activated B cells (NF-kb) to produce anti-inflammatory effects, which counteract injury by tumor necrosis factor-alpha (TNF-a).[14,15] It also increases anti-inflammatory cytokine interleukin (IL-10) and decreases proinflammatory cytokines IL-6, IL-1b, and TNF-a in a diabetic rat model.[16] Meanwhile, the downregulation of proinflammatory cytokines is initiated by the JAK/STAT pathway.[17] Intravitreal injection of EPO resulted in raised levels of phosphorylated JAK2.[17]
Erythropoietin activates the Akt pathway and ERK1/2 to protect the brain from cerebral ischemia,[18] whereby it acts as an anti-hypoxia agent through over-expression of EPO in acute and chronic exposure to hypoxia.[19] Hypoxia-inducible transcriptor factors (HIF-2) are activated during hypoxia and cause EPO expression.[19] The ischemic retina has been shown to upregulate EPO, even in the presence of cell loss.[19] EPO retards apoptosis and degeneration by upregulating BCL-X1, and downregulates caspase-3 through PI3K/Akt.[17] It also regulates intracellular calcium and suppresses the release of cytochrome c.[20] EPO upregulates BDNF and ciliary neurotrophic factor (CNTF) via Akt and ERK1/2 pathway for photoreceptor and retinal ganglion cell (RGC) rescue.[21] EPO can also regenerate RGC following optic nerve transection[17] and maintain the blood–retinal barrier.[22,23,24]
EPO gene-modified MSC transplanted subretinally has been found to enhance distribution, differentiation, and survival significantly in a rat model of retinal degeneration by sodium iodide compared to MSC-only transplantation.[3]
Electroretinogram (ERG) is a noninvasive electrophysiological tool used to analyze the function of the retina. It shows the sum of retinal function in full-field ERG. Scotopic ERG measures a dark-adapted eye and produces an a-wave (negative wave) for rod function, b-wave (positive wave) for bipolar cell function, and a more sensitive negative scotopic threshold response (STR) for amacrine and ganglion cell function. In a low light level intensity, the b-wave and STR predominate, and with increasing intensity, an a-wave appears.[25]
A study by Wang et al.[2] in 2014 found the administration of intravenous SI in the concentrations of 20 and 30 mg/kg caused a decrement of b–wave amplitude on ERG at day 1 post-injection in an animal model. This is postulated to be due to the damaged transmission between photoreceptors and bipolar cells.[2] A study by Machalińska et al.[4] comparing injection of SI 20 and 40 mg/kg found that the damage occurred as early as day 3 post-injection with progressive damage to the whole retina by photopic and scotopic ERG wave reduction with the injection of 40 mg/kg SI. Meanwhile, Koh et al.[6] studied a retinal degeneration rat model that showed flat a- and b-wave ERGs were seen after 60 and 80-mg/kg SI administration.
These electrophysiological changes are supported by histopathological evidence. For instance, Machalińska et al. found that the Muller glial cell was responsible for a repair mechanism within the injured retina by retinal cell organization following injury and regeneration of the RPE.[4,26] RPE degeneration was found to begin as early as day 3, followed by the reduction of ONL thickness at day 7 and persistent loss with no recovery till day 28 with high doses of SI at 40 mg/kg.[4] Histopathological examination revealed RPE degeneration but not outer and inner nuclear layer thickness at 3 months at a low dose (15 mg/kg) of SI given retro-orbitally.[26] Koh et al.[6] found that SI administration of more than 40 mg/kg was associated with histological damage in RPE and other layers of the retina. Thus, electrophysiology and histological analyses are valuable tools to evaluate the function of the retina objectively following induced retinal degeneration in a rat model.
This study was designed to investigate the efficacy of HDUMSC and HDUMSC-EPO in rescuing SI-induced total retinal degeneration in a Sprague–Dawley (SD) rat model. Physiological efficacy was measured using electrophysiology, whereas anatomical efficacy was measured using histological methods.
Methods
Sprague–Dawley (SD) rats were maintained under the Department of Ophthalmology, Universiti Kebangsaan Malaysia Medical Center (UKMMC), Kuala Lumpur, Malaysia, under approved animal care conditions. All experiments involving animals were compliant with the regulations in the ARVO Statement for the Use of Animals in Ophthalmic and Vision Research. The local ethical committee for animal studies approved the study on October 17, 2014 (FP/OPHTHAL/2014/MAE-LYNN/24 SEPT J 605-OCT.-2014-MEI 2018). The rats were tagged with numbers, and their ages were recorded; 24 male rats aged more than six weeks and weighing above 150 g were used.
The SD rats were obtained from the animal house at the UKM Kuala Lumpur campus facility at 6 weeks after birth. Once the animal weight had reached 150 g, it was included in the study. The SD rats were kept in individually ventilated cages (IVC) in specific pathogen-free (SPF) animal bubbles at the Tissue Engineering Department, UKMMC.
Sodium iodate (SI) (NaIO3; Alfa Aesar, Massachusetts, USA) was diluted in Hanks balanced salt solution (HBSS) to prepare a 4% NaIO3 solution and stored at room temperature (RT, 24°C) prior to the experiment. An SI concentration of 60 mg/kg was chosen based on a previous study by our group that resulted in total retinal degeneration, proven on ERG and histology.[6]
HDUMSCs were provided by a local stem cell bank (Cryocord™, Selangor, Malaysia). The characterization was performed according to Mok et al.[27] in our previous publication, which followed the International Society for Cellular Therapy (ISCT) standards. In brief, the frozen ampoules of HDUMSCs were thawed for 2 min using a water bath at 37°C. Subsequently, 1 mL of cell suspension was aliquoted and diluted with 9 mL of fresh Dulbecco’s modified Eagle’s medium (DMEM; Merck KGaA, Darmstadt, Germany) supplemented with 100-μg/mL streptomycin + 100-U/mL penicillin (Thermo Fisher Scientific, Waltham, MA, USA), and 10% (v/v) fetal bovine serum (FBS; Thermo Fisher Scientific, Waltham, MA, USA). The suspension was then centrifuged at 150 g for 10 min. Subsequently, the supernatant was discarded and fresh medium was then added to resuspend the pellet. Cell counting was performed using a hemocytometer and trypan blue dye. Next, the cells were seeded at a density of 1.25 × 10⁵ cells in 25-cm2 tissue culture flasks containing the MSC culture medium. The cells were incubated in a humidified, 5% CO2 incubator at 37°C. The culture media was changed every 2–3 days. Upon reaching 70% confluency, the cells were trypsinized using 2 mL of 0.25% trypsin/ethylenediaminetetraacetic acid (EDTA; Thermo Fisher Scientific) for 5 min at 37°C. The cells were then centrifuged and resuspended in sterile HBSS before the transplantation procedure.
The EPO-expressing HDUMSC was prepared as described in our previous publication (Shirley et al.).[28] Human embryonic kidney 293FT cells (Invitrogen, USA) were transfected using p-EPO-GFP-Lv183 lentiviral plasmids (GeneCopoeia, MD, USA), lentiviral packaging mix (GeneCopoeia, MD, USA), and Endofectin lenti reagent (GeneCopoeia, MD, USA) at 37°C for 8 h. After that, fresh culture medium containing 1× TiterBoost reagent (GeneCopoeia, MD, USA) was added. At 24, 48, and 60 h post-transfection, the culture media were harvested, pooled, and then filtered through a 0.22-μm filter. The filtered supernatant containing assembled lentiviral particles was centrifuged at 500 g at 4°C for 8 min. Amicon Ultra centrifugal filters (Merck Millipore, Germany) were then used to filter the supernatant for 90 min at 4000 g in 4°C. The concentrated lentiviral particles in the supernatants were then used to transduce the HDUMSC. Approximately 1.25 × 10⁵ cells in MSC culture medium were grown in a 25-cm2 tissue culture flask at 37°C and 5% CO2. The medium was replaced with 3 mL of fresh MSC culture medium supplemented with 8 μg/ml of polybrene (Sigma-Aldrich, Missouri, USA) and 5% FBS (Thermo Fisher Scientific, Waltham, MA, USA) after reaching 80% confluency. During transduction, approximately 1 mL of supernatant containing lentiviral particles with human EPO-encoded p-EPO-GFP-Lv183 plasmids (GeneCopoeia, MD, USA) were added to the MSC culture and incubated for 8 h at 37°C. After that, 5 mL of fresh MSC culture medium was added to replace the incubation medium. The cells were trypsinized for re-seeding and culture expansion.
A total of 24 SD rats from four groups were used in this experiment. The groups were negative control that would receive HBSS only (HBSS group), positive control group (SI 60 mg/kg SI), SI-treated with HDUMSC, and SI-treated with HDUMSC-EPO. Each group comprised six male rats and all the groups received 60-mg/kg SI, except for the negative control group (HBSS). On day 4 post-SI injection, subretinal and intravenous injections of HDUMSC and HDUMSC-EPO were given to the SI treated with HDUMSC and HDUMSC-EPO groups, respectively. The negative control group (HBSS) received subretinal and intravenous HBSS on the same day as the stem cells were injected into the HDUMSC and HDUMSC-EPO groups. SI at the concentration of 60 mg/kg was injected intravenously at day 0 (pre-injection day) to cause retinal degeneration, followed by injection of subretinal and intravenous HDUMSC and HDUMSC-EPO at day 4 and the same intravenously at day 18 to induce retinal regeneration. Day 4 was selected as the day after retinal degeneration was believed to have commenced in another study.[7]
Subsequently, on day 18, a booster of intravenous injection of HDUMSC, HDUMSC-EPO, and HBSS was given respectively to the HDUMSC, HDUMSC-EPO, and HBSS groups as it is found that the effect of MSC declines by day 10 post injection.[29,30] The rats were then anesthetized with 150 mg/kg ketamine (Bioketan, Vetoquinol Biowet, Poland) and 10 mg/kg xylazine (Xylazil-20 Troy Lab Australia) before a transscleral cut was performed for subretinal injection with a 30G needle. A total of 3 μL (1 × 10⁵ cell count) of HDUMSC or HDUMSC-EPO cells were carefully injected subretinally with a Hamilton syringe (internal diameter: 75–150 μm) to avoid retinal detachment. The injection site was marked with a single 10-0 nylon suture. Subsequently, 100 μl (1 × 10⁶ cell count) was injected intravenously into the tail vein with a 24-G branula. The same protocol was then used to inject HBSS into the eye for the negative control (HBSS) group. Only the right eye was injected whereby the left eye was not injected.
The treatment groups that received HDUMSC and HDUMSC-EPO then received 1 mg/kg dexamethasone (CCM, Duopharma) intraperitoneally, starting on the day of surgery and three times per week for the first two weeks.[7] They also received cyclosporine-A (Bedford Labs, Bedford, MA) mixed into their drinking water at a concentration of 210 mg/L, which resulted in blood concentrations of 250–300 μg/L 1–2 days prior to cell injection until they were euthanized.[7] Suppression of the immune system is needed in this manner due to the foreign nature and human origin of the stem cells injected via intravenous route into these rats, in addition to the subretinal route of administration. This was hoped to prevent the implanted cells from being prematurely rejected before they could exert their effects.
All electrophysiological recordings were performed using RETI-port Roland-consult GmBH, Brandenburg, Germany animal ERG machine. The rats were dark-adapted for 1 h prior to ERG testing. First, they were anesthetized with 150 mg/kg ketamine (Bioketan, Vetoquinol Biowet, Poland) and 10 mg/kg xylazine (Xylazil-20 Troy Lab Australia), and their eyes were dilated with tropicamide 1% (Alcon, USA) and phenylephrine 2.5% (Alcon, USA). They were then placed on a table and electrodes were attached to the tail as ground, ear as a reference, and both corneas with a loop wire. The stimulation was produced using a full-field stimulation globe with a mixture of LED and xenon lights. Recording consisted of a single flash presentation with an average of 10–12 presentations to verify the consistency of the recording. Luminance intensity for rod responses was 0.0003–30 cd.s/m2. Electroretinography was done on days 0, 4, 11, 18, 26, and 32.
On day 32 post-injection of SI, enucleation of the rats was done. The rats were euthanized with 150 mg/kg ketamine (Bioketan, Vetoquinol Biowet, Poland) and 10 mg/kg xylazine (Xylazil-20 Troy Lab Australia), followed by 100 mg/kg intracardiac phenobarbitol (Sandgate, USA). The globes were separated from the optic nerves and placed in normal saline. Horizontal sections of 10 μm thickness were obtained from the enucleated eyes using a cryostat and mounted on glass slides on the same day. Haematoxylin and eosin (H and E) staining was done with three tissue sections per slide as previously described.[6,31] After that, the slides were left to dry and examined under a light microscope (Olympus BX40) with 40× magnification. The mapping of retina layers was done in three sections. One section was made at the retinal centre, an area 200-nm away from the optic nerve. Two sections involved the retinal periphery (upper and lower section 200 nm from the ora serrata [OR]). The thickness of the ONL was measured using Image J software by two investigators (MAR and SS) to minimize bias.
Statistical analysis
Statistical analysis was performed with SPSS version 23. The ANOVA test was performed for changes in the ERG amplitude between groups when measured on the same day and ONL thickness between different sections of the retina. A paired t-test was used to compare changes in ERG amplitude in the same group following intervention with baseline (day 0) and following intervention (day 4). An independent t-test was used to compare differences in ONL thickness between negative control and other groups in different retinal sections.
Results
ANOVA test (a-wave mean amplitude) between different groups on the same day showed significant differences at days 4, 11, 18, 26, and 32 (P < 0.05, P = 0.001). However, P = 0.082 was not significant when comparing day 0 baseline (pre-injection) between different groups.
Fig. 1 (bar chart) and Table 1 (mean comparison of a-wave ERG amplitude in the negative control (HBSS), positive control (60-mg/kg SI), SI treated with HDUMSC, and SI treated with HDUMSC-EPO (# compared to day 0; + compared to day 4; P < 0.05, paired t-test)).
Figure 1.
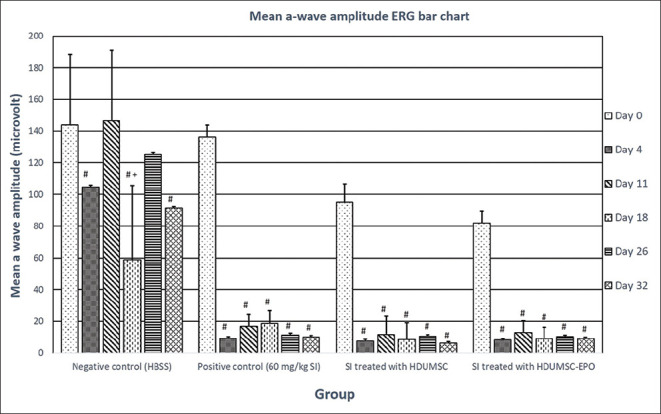
Bar chart mean comparison of a-wave ERG amplitude in the negative control (HBSS), positive control (60-mg/kg SI), SI treated with HDUMSC, and SI treated with HDUMSC-EPO (*; P < 0.05, P = 0.001, ANOVA test) (#; P < 0.05, paired t-test)
Table 1.
Mean a-wave amplitudes on ERG with paired t-test values comparing the four groups
| Day | Negative control group (HBSS) | Positive control group (SI 60 mg/kg) | SI treated with HDU-MSC | SI treated with HDUMSC-EPO | ||||||||
|---|---|---|---|---|---|---|---|---|---|---|---|---|
| Mean (µv) | Paired t-test (P) | Mean (µv) | Paired t-test (P) | Mean (µv) | Paired t-test (P) | Mean (µv) | Paired t-test (P) | |||||
|
|
|
|
|
|||||||||
| paired to day 0 | paired to day 4 | paired to day 0 | paired to day 4 | paired to day 0 | paired to day 4 | paired to day 0 | paired to day 4 | |||||
| 0 (pre-injection of HBSS/SI 60 mg/kg) | 143.93 | 136.17 | 95.07 | 81.95 | ||||||||
| 4 (injection of HBSS/HDUMSC/HDUMSC-EPO) | 104.83 | 0.02 (#) | 9.36 | 0.001 (#) | 7.58 | 0.0054 (#) | 8.26 | 0.013 (#) | ||||
| 11 | 146.43 | 0.92 | 0.11 | 16.87 | 0.001 (#) | 0.11 | 11.79 | 0.0085 (#) | 0.5164 | 13.01 | 0.007 (#) | 0.384 |
| 18 (injection of HBSS/HDUMSC/HDUMSC-EPO) | 58.75 | 0.01 (#) | 0.02 (+) | 18.8 | 0.0008 (#) | 0.05 | 8.64 | 0.0026 (#) | 0.8209 | 9.15 | 0.011 (#) | 0.869 |
| 26 | 125.15 | 0.46 | 0.12 | 11.54 | 0.001 (#) | 0.34 | 10.54 | 0.0052 (#) | 0.6001 | 10.36 | 0.012 (#) | 0.684 |
| 32 | 91.45 | 0.02 (#) | 0.15 | 10.15 | 0.002 (#) | 0.84 | 6.25 | 0.0052 (#) | 0.6734 | 8.96 | 0.014 (#) | 0.863 |
Paired t-test P significant <0.05 (#: Paired to day 0; +: Paired to day 4)
The paired t-test showed the a-wave ERG amplitude comparison in the negative control (HBSS) to day 0, showing a significant reduction from the baseline (#) at day 4 (P = 0.02), day 18 (P = 0.01), and day 32 (P = 0.01). However, there was no significant difference when compared to day 11 (P = 0.92) and day 26 (P = 0.46). There was a significant difference, P = 0.02(+), when comparing the mean a-wave amplitude between day 4 and day 18 in the negative control group (HBSS).
All three groups that received SI, namely the positive control (SI: 60 mg/kg); SI treated with HDUMSC, and SI treated with HDUMSC-EPO from days 4, 11, 18, 26, and 32 showed a significant reduction (#; P < 0.05) in ERG from baseline day 0.
Subretinal and intravenous injection of HDUMSC and HDUMSC-EPO on day 4 followed by erg on days 11, 18, 26, and 32 did not show any significant changes (P > 0.05) in the paired t-test analysis, as shown in Table 1.
Fig. 2 (bar chart) and Table 2 show the mean comparison of b-wave ERG amplitude in the negative control (HBSS), positive control (60-mg/kg SI), SI treated with HDUMSC, and SI treated with HDUMSC-EPO (# compared to day 0; + compared to day 4; P < 0.05, paired t-test)).
Figure 2.

Bar chart mean comparison of b-wave ERG amplitude in the negative control (HBSS), positive control (60-mg/kg SI), SI treated with HDUMSC, and SI treated with HDUMSC-EPO (*; P < 0.05, P = 0.001, ANOVA test), (#; P < 0.05, paired T-test)
Table 2.
Mean b-wave amplitudes on ERG with paired t-test values comparing the four groups
| Day | Negative control group (HBSS) | Positive control group (SI 60 mg/kg) | SI treated with HDU-MSC | SI treated with HDUMSC-EPO | ||||||||
|---|---|---|---|---|---|---|---|---|---|---|---|---|
|
|
|
|
|
|||||||||
| Mean (µv) | Paired t-test (P) | Mean (µv) | Paired t-test (P) | Mean (µv) | Paired t-test (P) | Mean (µv) | Paired t-test (P) | |||||
|
|
|
|
|
|||||||||
| paired to day 0 | paired to day 4 | paired to day 0 | paired to day 4 | paired to day 0 | paired to day 4 | paired to day 0 | paired to day 4 | |||||
| 0 (pre injection of HBSS/SI 60 mg/kg) | 324.17 | 318.33 | 255.17 | 226 | ||||||||
| 4 (injection of HBSS/HDUMSC/HDUMSC-EPO) | 231.33 | 0.0447 (#) | 22.81 | 0.0001 (#) | 18.57 | 0.0125 (#) | 12.51 | 0.00024 (#) | ||||
| 11 | 376.83 | 0.4248 | 0.048 (+) | 45.6 | 0.0004 (#) | 0.2475 | 27.52 | 0.0117 (#) | 0.4466 | 23.6 | 0.00018 (#) | 0.0086 (+) |
| 18 (injection of HBSS/HDUMSC/HDUMSC-EPO) | 200.17 | 0.0619 | 0.333 | 40.33 | 0.0004 (#) | 0.0863 | 34.95 | 0.0108 (#) | 0.0765 | 25.16 | 0.00055 (#) | 0.01369 (+) |
| 26 | 269.33 | 0.4255 | 0.411 | 39.68 | 0.0005 (#) | 0.2961 | 23.35 | 0.0105 (#) | 0.5064 | 26.32 | 0.00059 (#) | 0.01977 (+) |
| 32 | 250.5 | 0.1135 | 0.357 | 45.68 | 0.0009 (#) | 0.2555 | 19.11 | 0.0084 (#) | 0.9502 | 28.15 | 0.00072 (#) | 0.04088 (+) |
Paired t-test P significant <0.05 (#: Paired to day 0; +: Paired to day 4)
B-wave ERG amplitude measurements were made. However, there was so much damage to the outer retina that it was not possible to reach any conclusions about the inner retinal function. As expected, all the b-wave amplitudes at days 4, 11, 18, 26, and 32 were significantly reduced (*; P < 0.05), with P = 0.001 for between groups in the same day using the ANOVA test.
The negative control (HBSS) group shows that b-wave amplitude was significantly reduced (#; P < 0.05) only at day 4 (#; P = 0.0447) from baseline day 0. There was a significant reduction (#; P < 0.05) in other groups, that is, SI treated with HDUMSC and SI treated with HDUMSC-EPO when compared to baseline day 0.
However, there was a statistically significant result (+; P < 0.05) in the SI treated with HDUMSC-EPO group only when comparing days 11 (P = 0.0086), day 18 (P = 0.01369), 26 (P = 0.01977), and 32 (P = 0.04088) to the b-wave on day 4 (rescue injection day) by paired t-test. However, the amplitude of the b-wave did not recover to baseline (day 0) levels before SI induction. It was interpreted that despite a significant increase in b-wave following intervention at day 4, the b-wave did not recover to the baseline (day 0) before SI injection.
Mean comparison of ONL thickness section (nm) throughout test group
Fig. 3 shows a comparison of ONL thickness (nm) between the negative control (HBSS) group, positive control (60-mg/kg SI), SI treated with HDUMSC, and SI treated with HDUMSC-EPO. There was a significant reduction (P < 0.05) at all three retinal sections taken, namely center (P = 0.001), upper (P = 0.001), and lower (P = 0.001) using ANOVA analysis.
Figure 3.

Bar chart mean comparison ONL thickness section (nm) between negative control (HBSS), positive control (60-mg/kg SI), SI treated with HDUMSC, and SI treated with HDUMSC-EPO (*; P < 0.05, P = 0.001, ANOVA test)
Fig. 3 (bar chart) and Table 3 show the mean comparison ONL thickness section (nm) between negative control (HBSS), positive control (60-mg/kg SI), SI treated with HDUMSC, and SI treated with HDUMSC-EPO (*independent t-test; P < 0.05: *compared with negative control (HBSS), # compared with positive control (60 mg/kg SI))).
Table 3.
Mean outer nuclear layer thickness at center, upper, and lower retinal sections and P in the study groups
| Retina section | Group | Mean ONL thickness (nm) | P | Retina section | Group | Mean ONL thickness (nm) | P |
|---|---|---|---|---|---|---|---|
| Center | Negative control (HBSS) | 56.43 | 0.001* | Center | Positive control (60-mg/kg SI) | 23.92 | 0.009 (#) |
| Positive control (60-mg/kg SI) | 23.92 | SI treated with HDUMSC | 20.22 | ||||
| Upper | Negative control (HBSS) | 47.33 | 0.001* | Upper | Positive control (60-mg/kg SI) | 25.04 | 0.287 |
| Positive control (60-mg/kg SI) | 25.04 | SI treated with HDUMSC | 22.47 | ||||
| Lower | Negative control (HBSS) | 47.11 | 0.001* | Lower | Positive control (60-mg/kg SI) | 31.55 | 0.004 (#) |
| Positive control (60-mg/kg SI) | 31.55 | SI treated with HDUMSC | 22.74 | ||||
| Center | Negative control (HBSS) | 56.43 | 0.001* | Center | Positive control (60-mg/kg SI) | 23.92 | 0.947 |
| SI treated with HDUMSC | 20.22 | SI treated with HDUMSC-EPO | 23.79 | ||||
| Upper | Negative control (HBSS) | 47.33 | 0.001* | Upper | Positive control (60-mg/kg SI) | 25.04 | 0.556 |
| SI treated with HDUMSC | 22.47 | SI treated with HDUMSC-EPO | 26.23 | ||||
| Lower | Negative control (HBSS) | 47.11 | 0.001* | Lower | Positive control (60-mg/kg SI) | 31.55 | 0.008 (#) |
| SI treated with HDUMSC | 22.74 | SI treated with HDUMSC-EPO | 26.91 | ||||
| Center | Negative control (HBSS) | 56.43 | 0.001* | Center | SI treated with HDUMSC | 20.22 | 0.136 |
| SI treated with HDUMSC-EPO | 23.79 | SI treated with HDUMSC-EPO | 23.79 | ||||
| Upper | Negative control (HBSS) | 47.33 | 0.001* | Upper | SI treated with HDUMSC | 22.47 | 0.101 |
| SI treated with HDUMSC-EPO | 26.23 | SI treated with HDUMSC-EPO | 26.23 | ||||
| Lower | Negative control (HBSS) | 47.11 | 0.001* | Lower | SI treated with HDUMSC | 22.74 | 0.128 |
| SI treated with HDUMSC-EPO | 26.91 | SI treated with HDUMSC-EPO | 26.91 |
Independent t-test: P<0.05;* compare to negative control (HBSS), #compare to positive control (60-mg/kg SI)
An independent t-test between negative control (HBSS) and other groups showed a significant reduction (*; P < 0.05) in ONL in all sections, as shown in Fig. 3 and Table 3, when compared to the negative control group (HBSS). Comparison between positive control group (60-mg/kg SI) and SI treated HDUMSC showed significant difference in center (#; P = 0.009) and lower (#; P = 0.004) section. Meanwhile, comparison between the positive control group (60-mg/kg SI) and SI treated HDUMSC-EPO only was significant in the lower section (#; P = 0.008). However, significant differences mean ONL thickness was worse after treatment with HDUMSC or HDUMSC-EPO. Thus, the application of HDUMSC and HDUMSC-EPO did not result in improved ONL thickness from negative control or positive control.
Fig. 4 shows the histological section comparison of the ONL between, negative control HBSS (a), positive control 60-mg/kg SI (b), SI treated with HDUMSC (c), and SI treated with HDUMSC-EPO (d). This shows that with HBSS, the ONL layered was preserved, but there were irregularities and distortion of the layer once the 60-mg/kg SI was administered, and separation of ONL for retinal pigment epithelium layer (RPE).
Figure 4.

Histological section comparison of the ONL between negative control HBSS (a), positive control 60-mg/kg SI (b), SI treated with HDUMSC (c), and SI treated with HDUMSC-EPO (d). It showed that with HBSS, the ONL layered was preserved, but there were irregularities and distortion of the layer once the 60-mg/kg SI was administered, and separation of ONL for retina pigment layer (RPE)
Discussion
This study has shown that 60-mg/kg sodium iodide (SI) can cause total retinal dysfunction as evidenced by significant ERG a- and b-wave reduction from day 4 to 32 [Fig. 2]. The presence of degeneration of the retina has been supported by histology that showed the destruction of the ONL and RPE layers. The study also tested the ability of HDUMSC and HDUMSC-EPO to regenerate retina following total retinal degeneration, which in this case was not successful.
Intravenous 60-mg/kg SI given to the positive control group resulted in significant a- and b-wave amplitude reduction as early as day 1 and consistently until day 32, as stated by Machalińska et al.,[4] despite the concentration of 40-mg/kg SI administered via the retro-orbital route. Meanwhile, Koh et al.[6] found the ERG wave to be flat in both a- and b-waves with the administration of 60-mg/kg SI. The method of delivery via retro-orbital approach was nearer to the target location; thus, less dose was needed compared to the intravenous route, as used in our study.
Sodium iodide (SI) injection is not only specific for RPE damage, but it has been shown to affect the intraretinal layers by loss of synaptic communications between the photoreceptor and bipolar cells.[4,32] This was reflected in the reduction of b-wave preferentially. Further in vivo and in vitro testing of photoreceptor and RPE cells with SI treatment showed dysregulation of the phototransduction gene, which translated into the reduction in ERG amplitude.[3,4,5]
The subretinal administration of stem cells allowed more localized action and recovery by direct administration to the tissue known to be damaged. However, rescue with both HDUMSC and HDUMSC-EPO failed to show functional improvement from the baseline in both ERG a- and b-wave amplitudes, and ONL thickness when compared to pre-induction day 0, when SI was used at 60 mg/kg.
ONL thickness in all three sections of the retina was not significantly increased or sustained following rescue by HDUMSC and HDUMSC-EPO from the baseline of negative control (HBSS) despite the preservation of degenerated ONL thickness when compared with positive control.
Guan et al.[3] reported an increase in retinal thickness and improved ERG amplitude at 8 weeks compared to the control in both MSC and MSC-EPO groups following subretinal rescue at day 2 in 50-mg/kg SI degenerated SD rat retina. The difference is that in our study, HDUMSC was used, and the day of rescue was at day 4 as per the method proposed by Koh et al.,[31] whereas the study by Guan et al.[3] used MSC rats, and rescue was provided at day 2.
A previous study on HWJ-MSC by Leow showed significant morphological improvements after 70 days of injection in RCS rats with degenerated retina, although the ERG findings were not significant.[31] The methods used in this study were similar to those performed by Leow et al.[7] As for the study by Koh et al.,[31] rescue with HDUMSC AND HDUMSC-EPO using SI of 40 mg/kg degenerated retina rat at lower doses which produced more significant b-wave ERG and ONL thickness restoration. Therefore, the absence of changes in our study could be due to more massive and severe degeneration seen with SI of 60 mg/kg, which could not be reversed by MSC.
The introduction of EPO seems to have produced a better response, but the degeneration model used in this study is probably severe compared to the programmed degeneration of RCS rats. In contrast, the lack of restoration of the ERG response in both studies indicates that there is more scope for future studies to improve the distribution and administration of MSC used. The slightly higher amplitude on ERG seen with the introduction of EPO relative to MSC alone also warrants further research into the optimal method for the delivery and preparation of stem cells.
A study by Mandai et al.[33] in rd1 end-stage retinal degeneration mice showed that following transplant of miPSC (mouse-induced pluripotent stem cell), there was direct contact of host bipolar cell terminal and presynaptic terminal of graft photoreceptor. Meanwhile, Singh et al.[34] reported rd1 mice with fast retinal degeneration of all rods by 3 weeks of age and transplanted the rod precursor cell from donor mice, which could differentiate into outer segment photoreceptors.
The drawback of this analysis was the inability to prove that HDUMSC and HDUMSC-EPO administered intravenously and subretinally entered the retinal site of action due to the indirect route of the former, and technical challenges of entering this space in the rat model for the latter route. Labeling with gold nanoparticles was effective, as shown previously, but is costly.[7] Immunohistochemistry is another helpful method for the detection of stem cell activity. It was also unclear whether the administration of stem cells on day 4 after SI was administered resulted in an irreversible retinal degeneration compared to the slowed-down cycle of earlier administration in other studies.[6,31] Again, where financially possible, a longer follow-up at 8–12 weeks would help demonstrate the functional and morphological retinal regeneration seen in other studies.
Conclusion
In conclusion, total retinal degeneration following intravenous SI injection was observed at 60 mg/kg in this study. HDUMSC and HDUMSC-EPO had no regenerative potential compared to baseline in SI-induced total retina degeneration on ERG or histology. However, this study found that the SI-treated HDUMSC-EPO group showed a substantial increase in b-wave ERG amplitude over time.
Ethics approval
This study was conducted according to the regulations in the ARVO Statement for the Use of Animals in Ophthalmic and Vision Research and was approved by Ethical Committee for Animal studies on October 17, 2014 (FP/OPHTHAL/2014/MAE-LYNN/24 SEPT J 605-OCT.-2014-MEI 2018).
Financial support and sponsorship
Fundamental Grant number FF 2014 376 and GP-K009894 grant, provided by Universiti Kebangsaan Malaysia; Project number 375213500 from Deputyship for Research & Innovation, Ministry of Education, Saudi Arabia.
Conflicts of interest
There are no conflicts of interest.
Acknowledgements
The authors acknowledge the funding support provided by Universiti Kebangsaan Malaysia through its Fundamental Grant (FP/OPHTHAL/2014/MAE LYNN/24 SEPT J 605 OCT. 2014 MEI 2018), CryoCord Malaysia Sdn Bhd for the stem cells, and the following grant (Geran Ganjaran Penerbitan) GP K009894 for the English editing and submission assistance. The authors also extend their appreciation to the Deputyship for Research & Innovation, Ministry of Education in Saudi Arabia for funding this research work through the project number 375213500.
References
- 1. Ramsden CM, Powner MB, Carr A-JF, Smart MJK, da Cruz L, Coffey PJ. Stem cells in retinal regeneration: Past, present and future. Development. 2013;140:2576–85. doi: 10.1242/dev.092270. [DOI] [PMC free article] [PubMed] [Google Scholar]
- 2. Wang J, Iacovelli J, Spencer C, Saint-Geniez M. Direct effect of sodium iodate on neurosensory retina. Investig Ophthalmol Vis Sci. 2014;55:1941–52. doi: 10.1167/iovs.13-13075. [DOI] [PMC free article] [PubMed] [Google Scholar]
- 3. Guan Y, Cui L, Qu Z, Lu L, Wang F, Wu Y, et al. Subretinal transplantation of rat MSCs and erythropoietin gene modified rat MSCs for protecting and rescuing degenerative retina in rats. Curr Mol Med. 2013;13:1419–31. doi: 10.2174/15665240113139990071. [DOI] [PubMed] [Google Scholar]
- 4. MacHalińska A, Lubiński W, Kłos P, Kawa M, Baumert B, Penkala K, et al. Sodium iodate selectively injuries the posterior pole of the retina in a dose-dependent manner: Morphological and electrophysiological study. Neurochem Res. 2010;35:1819–27. doi: 10.1007/s11064-010-0248-6. [DOI] [PMC free article] [PubMed] [Google Scholar]
- 5. Kiuchi K, Yoshizawa K, Shikata N, Moriguchi K, Tsubura A. Morphologic characteristics of retinal degeneration induced by sodium iodate in mice. Curr Eye Res. 2002;25:373–9. doi: 10.1076/ceyr.25.6.373.14227. [DOI] [PubMed] [Google Scholar]
- 6. Koh AE-H, Alsaeedi HA, Rashid MBA, Lam C, Harun MHN, Saleh MFBM, et al. Retinal degeneration rat model: A study on the structural and functional changes in the retina following injection of sodium iodate. J Photochem Photobiol B. 2019;196:111514. doi: 10.1016/j.jphotobiol.2019.111514. [DOI] [PubMed] [Google Scholar]
- 7. Leow SN, Luu CD, Hairul Nizam MH, Mok PL, Ruhaslizan R, Wong HS, et al. Safety and efficacy of human Wharton's Jelly-derived mesenchymal stem cells therapy for retinal degeneration. PLoS One. 2015;10:e0128973. doi: 10.1371/journal.pone.0128973. [DOI] [PMC free article] [PubMed] [Google Scholar]
- 8. Ding SLS, Kumar S, Mok PL. Cellular reparative mechanisms of mesenchymal stem cells for retinal diseases. Int J Mol Sci. 2017;18:1406. doi: 10.3390/ijms18081406. [DOI] [PMC free article] [PubMed] [Google Scholar]
- 9. Lund RD, Wang S, Lu B, Girman S, Holmes T, Sauvé Y, et al. Cells isolated from umbilical cord tissue rescue photoreceptors and visual functions in a rodent model of retinal disease. Stem Cells. 2009;25:602–11. doi: 10.1634/stemcells.2006-0308. [DOI] [PubMed] [Google Scholar]
- 10. Xu G, Zhang Y, Zhang L, Ren G, Shi Y. The role of IL-6 in inhibition of lymphocyte apoptosis by mesenchymal stem cells. Biochem Biophys Res Commun. 2007;361:745–50. doi: 10.1016/j.bbrc.2007.07.052. [DOI] [PMC free article] [PubMed] [Google Scholar]
- 11. Xian B, Huang B. The immune response of stem cells in subretinal transplantation. Stem Cell Res Ther. 2015;6:161. doi: 10.1186/s13287-015-0167-1. [DOI] [PMC free article] [PubMed] [Google Scholar]
- 12. Luo W, Hu L, Wang F. The protective effect of erythropoietin on the retina. Ophthalmic Res. 2015;53:74–81. doi: 10.1159/000369885. [DOI] [PubMed] [Google Scholar]
- 13. Hernández C, Fonollosa A, García-Ramírez M, Higuera M, Catalán R, Miralles A, et al. Erythropoietin is expressed in the human retina and it is highly elevated in the vitreous fluid of patients with diabetic macular edema. Diabetes Care. 2006;29:2028–33. doi: 10.2337/dc06-0556. [DOI] [PubMed] [Google Scholar]
- 14. Wang Z-Y, Shen L-J, Tu L, Hu D-N, Liu G-Y, Zhou Z-L, et al. Erythropoietin protects retinal pigment epithelial cells from oxidative damage. Free Radic Biol Med. 2009;46:1032–41. doi: 10.1016/j.freeradbiomed.2008.11.027. [DOI] [PubMed] [Google Scholar]
- 15. Liu X, Xie W, Liu P, Duan M, Jia Z, Li W, et al. Mechanism of the cardioprotection of rhEPO pretreatment on suppressing the inflammatory response in ischemia-reperfusion. Life Sci. 2006;78:2255–64. doi: 10.1016/j.lfs.2005.09.053. [DOI] [PubMed] [Google Scholar]
- 16. McVicar CM, Hamilton R, Colhoun LM, Gardiner TA, Brines M, Cerami A, et al. Intervention with an erythropoietin-derived peptide protects against neuroglial and vascular degeneration during diabetic retinopathy. Diabetes. 2011;60:2995–3005. doi: 10.2337/db11-0026. [DOI] [PMC free article] [PubMed] [Google Scholar]
- 17. Kretz A, Happold CJ, Marticke JK, Isenmann S. Erythropoietin promotes regeneration of adult CNS neurons via Jak2/Stat3 and PI3K/AKT pathway activation. Mol Cell Neurosci. 2005;29:569–79. doi: 10.1016/j.mcn.2005.04.009. [DOI] [PubMed] [Google Scholar]
- 18. Kilic E, Kilic Ü, Soliz J, Bassetti CL, Gassmann M, Hermann DM. Brain-derived erythropoietin protects from focal cerebral ischemia by dual activation of ERK-1/-2 and Akt pathways. FASEB J. 2005;19:2026–28. doi: 10.1096/fj.05-3941fje. [DOI] [PubMed] [Google Scholar]
- 19. Junk AK, Mammis A, Savitz SI, Singh M, Roth S, Malhotra S, et al. Erythropoietin administration protects retinal neurons from acute ischemia-reperfusion injury. Proc Natl Acad Sci U S A. 2002;99:10659–64. doi: 10.1073/pnas.152321399. [DOI] [PMC free article] [PubMed] [Google Scholar]
- 20. Garcia-Ramírez M, Hernández C, Ruiz-Meana M, Villarroel M, Corraliza L, García-Dorado D, et al. Erythropoietin protects retinal pigment epithelial cells against the increase of permeability induced by diabetic conditions: Essential role of JAK2/PI3K signaling. Cell Signal. 2011;23:1596–602. doi: 10.1016/j.cellsig.2011.05.011. [DOI] [PubMed] [Google Scholar]
- 21. Hu LM, Luo Y, Zhang J, Lei X, Shen J, Wu Y, et al. EPO reduces reactive gliosis and stimulates neurotrophin expression in Muller cells. Front Biosci (Elite Ed) 2011;3:1541–55. doi: 10.2741/e355. [DOI] [PubMed] [Google Scholar]
- 22. Üzüm G, Sarper Diler A, Bahçekapili N, Ziylan YZ. Erythropoietin prevents the increase in blood-brain barrier permeability during pentylentetrazol induced seizures. Life Sci. 2006;78:2571–6. doi: 10.1016/j.lfs.2005.10.027. [DOI] [PubMed] [Google Scholar]
- 23. Wang H, Byfield G, Jiang Y, Smith GW, McCloskey M, Hartnett ME. VEGF-mediated STAT3 activation inhibits retinal vascularization by down-regulating local erythropoietin expression. Am J Pathol. 2012;180:1243–53. doi: 10.1016/j.ajpath.2011.11.031. [DOI] [PMC free article] [PubMed] [Google Scholar]
- 24. Chen J, Connor KM, Aderman CM, Smith LEH. Erythropoietin deficiency decreases vascular stability in mice. J Clin Invest. 2008;118:526–33. doi: 10.1172/JCI33813. [DOI] [PMC free article] [PubMed] [Google Scholar]
- 25. Saszik SM, Robson JG, Frishman LJ. The scotopic threshold response of the dark-adapted electroretinogram of the mouse. J Physiol. 2002;543:899–916. doi: 10.1113/jphysiol.2002.019703. [DOI] [PMC free article] [PubMed] [Google Scholar]
- 26. Machalińska A, Kawa M, Pius-Sadowska E, Stępniewski J, Nowak W, Rogińska D, et al. Long-term neuroprotective effects of NT-4-engineered mesenchymal stem cells injected intravitreally in a mouse model of acute retinal injury. Invest Ophthalmol Vis Sci. 2013;54:8292–305. doi: 10.1167/iovs.13-12221. [DOI] [PubMed] [Google Scholar]
- 27. Mok PL, Cheong SK, Leong CF, Othman A. In vitro expression of erythropoietin by transfected human mesenchymal stromal cells. Cytotherapy. 2008;10:116–24. doi: 10.1080/14653240701816996. [DOI] [PubMed] [Google Scholar]
- 28. Shirley Ding SL, Kumar S, Ali Khan MS, Mok PL. Human mesenchymal stem cells expressing erythropoietin enhance survivability of retinal neurons against oxidative stress: An in vitro study. Front Cell Neurosci. 2018;12:190. doi: 10.3389/fncel.2018.00190. [DOI] [PMC free article] [PubMed] [Google Scholar]
- 29. Leibacher J, Henschler R. Biodistribution, migration and homing of systemically applied mesenchymal stem/stromal cells. Stem Cell Res Ther. 2016;7:7. doi: 10.1186/s13287-015-0271-2. [DOI] [PMC free article] [PubMed] [Google Scholar]
- 30. Lam C, Alsaeedi HA, Koh AE, Harun MHN, Hwei ANM, Mok PL, et al. Human Dental pulp stem cells (DPSCs) therapy in rescuing photoreceptors and establishing a sodium iodate-induced retinal degeneration rat model. Tissue Eng Regen Med. 2021;18:143–54. doi: 10.1007/s13770-020-00312-1. [DOI] [PMC free article] [PubMed] [Google Scholar]
- 31. Koh AE-H, Alsaeedi HA, Rashid MBA, Lam C, Harun MHN, Ng MH, et al. Transplanted erythropoietin-expressing mesenchymal stem cells promote pro-survival gene expression and protect photoreceptors from sodium iodate-induced cytotoxicity in a retinal degeneration model. Front Cell Dev Biol. 2021;9:652017. doi: 10.3389/fcell.2021.652017. [DOI] [PMC free article] [PubMed] [Google Scholar]
- 32. Hariri S, Tam MC, Lee D, Hileeto D, Moayed AA, Bizheva K. Noninvasive imaging of the early effect of sodium iodate toxicity in a rat model of outer retina degeneration with spectral domain optical coherence tomography. J Biomed Opt. 2013;18:26017. doi: 10.1117/1.JBO.18.2.026017. [DOI] [PubMed] [Google Scholar]
- 33. Mandai M, Fujii M, Hashiguchi T, Sunagawa GA, Ito S-I, Sun J, et al. iPSC-derived retina transplants improve vision in rd1 end-stage retinal-degeneration mice. Stem Cell Reports. 2017;8:69–83. doi: 10.1016/j.stemcr.2016.12.008. [DOI] [PMC free article] [PubMed] [Google Scholar]
- 34. Singh MS, Issa PC, Butler R, Martin C, Lipinski DM, Sekaran S, et al. Reversal of end-stage retinal degeneration and restoration of visual function by photoreceptor transplantation. Proc Natl Acad Sci U S A. 2013;110:1101–6. doi: 10.1073/pnas.1119416110. [DOI] [PMC free article] [PubMed] [Google Scholar]