

Abstract
Purpose
To evaluate the role of corneal hysteresis (CH) as a risk factor of central visual field (VF) progression in a cohort of glaucoma suspect and glaucoma patients
Design
Prospective cohort study.
Methods
Two hundred forty-eight eyes of 143 subjects who were followed for an average of 4.8 years with a minimum of 5 visits with 10-2 and 24-2 VF tests were included. Univariable and multivariable linear mixed effects models were used to identify characteristics associated with the rate of change over time in 10-2 and 24-2 mean deviation (MD). Mixed effects logistic regression was used to evaluate characteristics associated with an increased likelihood of event-based 10-2 VF progression based on clustered pointwise linear regression (PLR) criterion.
Results
The CH was significantly associated with 10-2 and 24-2 VF progression in the univariable trend-based analysis. In multivariable trend-based analyses, lower CH was associated with a faster rate of decline in 10-2 MD (0.07 dB/year per 1 mmHg, P<0.001) but not with 24-2 MD (P=0.490). In multivariable event-based analysis, lower CH was associated with an increased likelihood of 10-2 VF progression (OR=1.35 per 1mmHg lower, P=0.025). Similar results were found in eyes with early glaucomatous damage at the baseline (baseline 24-2 MD ≥−6dB).
Conclusion
Lower CH was associated with a statistically significant, but relatively small, increased risk of central VF progression on the 10-2 test grid. Given the substantial influence of central VF impairment on the quality of life, clinicians should consider using CH to assess the risk of progression in primary open angle glaucoma patients including those with early disease.
Keywords: corneal hysteresis, glaucoma, visual field, progression, 10-2, 24-2
Introduction
Glaucoma is characterized by progressive retinal ganglion cell loss and commensurate visual field (VF) loss.1, 2 Assessing the possibility and rate of disease progression is of particular importance given the irreversible nature of glaucomatous damage and the potential for lifetime functional impairment. The probability and rate of disease progression varies among different individuals.3–5 Identification of baseline risk factors of disease progression allows clinicians to individualize therapy to reduce the likelihood of disease worsening. Higher intraocular pressure (IOP),6–12 older age,6–8, 10 decreased ocular perfusion pressure,6, 10, 13 presence of optic disc hemorrhage,6, 12, 14–16 thinner central corneas,6–8, 10, 11 lower corneal hysteresis (CH),17–19 focal lamina cribrosa defect,6, 20 and β-zone peripapillary atrophy6, 21, 22 all have been reported to be associated with glaucomatous VF progression.
Glaucomatous VF impairment affects quality of life and negatively impacts completion of everyday tasks including reading, driving, walking and taking medications in addition to putting them at increased risk of psychiatric comorbidities including depression.23–26 Glaucoma patients with similar severity of visual field damage based on the magnitudes of global VF indices may have different areas of VF damage, with some locations affecting vision related quality of life more than others.25 Central VF metrics have provided a stronger association with the quality of life measures compared to those of global VF.26 This is particularly important considering the accumulating body of evidence regarding the presence of central VF impairment in the early stages of glaucoma.27
Corneal biomechanical characteristics have been reported to affect the susceptibility of glaucoma suspects to develop a subsequent VF defect19, 28 and it also influences the risk of progression in those with established VF damage.17, 29 Corneal hysteresis is a biomechanical feature that defined by the viscous dampening of the anterior chamber when an air-puff of varying pressure is applied to the anterior surface of the cornea, and it is hypothesized to reflect corneal extracellular matrix constituents.18 Considering the corneoscleral envelope as a closely linked unit, CH may provide indirect information of the structural constituents of the posterior pole related to glaucomatous damage including lamina cribrosa and peripapillary sclera.18 Previous studies have shown that lower CH is a significant predictor of faster retinal nerve fiber layer29 and global VF progression.17 However, no study has yet evaluated CH as a predictor of central VF progression in glaucoma patients. The purpose of the current study was to investigate baseline CH as a risk factor of central VF progression in a prospective cohort of glaucoma suspect and glaucoma patients.
Methods
Participants
In this observational cohort study, participants were included from a prospective longitudinal study designed to evaluate optic nerve structure and visual function in glaucoma (Diagnostic Innovations in Glaucoma Study [DIGS] and African Descent and Glaucoma Evaluation Study [ADAGES]). Participants in these cohorts were longitudinally evaluated according to a pre-established protocol that included regular follow-up visits in which patients underwent a clinical examination and several imaging and functional tests. All participants from the DIGS and ADAGES study who met the inclusion criteria described below were enrolled in the current study. Written informed consent was obtained from all participants. The University of California, San Diego Human Subjects Committee approved all protocols, and the methods described adhered to the tenets of the Declaration of Helsinki. ADAGES and DIGS were designed with similar testing protocols and details of the procedures in DIGS and ADAGES have been previously published.30–32
Subjects underwent annual comprehensive ophthalmologic examinations, including a review of medical history, best-corrected visual acuity, slit-lamp biomicroscopy, IOP measurement, dilated funduscopic examination, stereoscopic optic disc photography, and standard automated perimetry using Swedish Interactive Threshold Standard Algorithm (Humphrey Field Analyzer; Carl Zeiss Meditec, Dublin, California, USA). Semiannual examinations included standard automated perimetry (10-2 VF and 24-2 VF) and IOP measurement. Only subjects with open angles on gonioscopy at baseline were included. Subjects were excluded if they had a baseline best-corrected visual acuity <20/40, axial length of more than 26.5 mm, baseline 24-2 mean deviation (MD) of worse than −20 dB, or any ocular or systemic disease that could affect the optic nerve or VF.
The study included eyes diagnosed as glaucoma or glaucoma suspect with baseline CH measurements and a minimum follow-up time of 2.5 years with a minimum of five 10-2 and 24-2 VF tests. Eyes were classified as glaucomatous if they had repeatable (≥2 consecutive) abnormal VF test results or evidence of glaucomatous optic neuropathy defined as excavation, the presence of focal thinning, notching of the neuroretinal rim, or localized or diffuse atrophy of the retinal nerve fiber layer based on masked grading of optic disc photographs by 2 graders or clinical examination by a glaucoma specialist. An abnormal VF test was defined as a pattern standard deviation (PSD) outside of the 95% normal confidence limits or a Glaucoma Hemifield Test (GHT) result outside normal limits. Glaucoma suspects were defined as those having elevated IOP (≥22 mm Hg) or suspicious-appearing optic discs without the presence of repeatable glaucomatous VF damage.
Standard Automated Perimetry
The 10-2 and 24-2 VF tests were considered unreliable and excluded if there was >33% fixation losses, >33% false-positive errors, or >33% false-negative errors. Experienced graders at the University of California, San Diego Visual Field Assessment Center (VisFACT) reviewed the results, excluding tests with eyelid or rim artifacts, fatigue or learning effects, inappropriate fixation, or evidence that the VF results were caused by a disease other than glaucoma (e.g., homonymous hemianopia) or inattention. Patients with glaucoma were stratified into 2 groups based on the severity of their VF damage. Patients with baseline 24-2 MD > −6.0 dB were classified as mild glaucoma, and patients with baseline 24-2 MD ≤ −6.0 were classified as moderate to severe glaucoma.33
10-2 regions proposed by Hood and associates27 were divided into 5 zones: the superior nasal (zone 1), superior temporal (zone 2), superior temporal band (zone 3), inferior temporal (zone 4), and inferior nasal (zone 5). For calculation of the mean sensitivity in each zone, threshold sensitivity values in decibels (dB) were used. The zonal mean sensitivity measurements were calculated as the average threshold sensitivity values of all points tested in that region.
Central visual field Progression
Different trend-based and event-based analyses were used to characterize progression in the 10-2 VF tests are described below.
Best linear unbiased prediction (trend-based):
Estimates of rates of change for individual eyes in different zones were obtained by best linear unbiased prediction (BLUP). Ordinary least square estimates can be imprecise in eyes with just a few measurements available over time or with large intraindividual variability.34 Individual ordinary least square estimates (i.e., individual regression lines) also do not take into account the information provided by the whole population, whereas BLUPs are shrinkage estimates that take into account the results obtained by evaluating the whole sample of eyes, giving less weight to estimates obtained from eyes with few measurement occasions or large intraindividual variability (i.e., more “noise”).35 In eyes with a large number of measurements over time, BLUP and ordinary least square estimates give similar results. BLUPs have been used to estimate individual rates of structural change measured by different instruments in glaucoma and to measure the rate of cognitive change in longitudinal models.36, 37
Clustered pointwise linear regression (event-based):
Regression of VF parameters over time has been used to identify VF deterioration and to estimate the magnitude of VF loss. Regression of individual locations or of clusters provided more information about the location of VF loss than regression of global indices.38, 39 A VF test point was flagged as worsening if it showed a significant negative slope faster than −1 dB/year, with a significance level of P < 0.01.40, 41 Per De Moraes and colleagues,42 a progression event in 10-2 VF was defined when ≥ 3 test points located in the same latent class analysis (LCA) derived 10-2 VF sector progressed faster than −1.0 dB/year at P < .01 over the follow-up period.
Corneal Hysteresis Measurements
Corneal hysteresis measurements were acquired at the baseline visit using the Ocular Response Analyzer (ORA; Reichert Ophthalmic Instruments Inc, Depew, New York, USA). A trained technician obtained 3 measurements from each eye and the average of 3 measurements was calculated for analysis. The ORA determines corneal biomechanical properties using an applied force-displacement relationship. Details of its operation have been previously described.43 In brief, within a 20-ms time frame, a metered air pulse is delivered to the eye, causing the cornea to move inward in a concave fashion (past a first applanation point), and then the cornea returns (past a second applanation point) to its initial position. An electro-optical collimation detector system monitors the corneal curvature in the central 3.0-mm diameter during the measurement period and defines 2 peaks produced by the applanation events. The CH is the difference between these 2 applanation pressures measured in millimeters of mercury. CH thus relates to the viscous dampening ability of the cornea. The device provides a waveform score to reflect the quality of measurements. Three measurements were obtained for each eye in each visit, and the average of the qualified measurements with a waveform score greater than 4 were considered for analysis. Baseline VF tests were chosen as those closest to the baseline CH measurement date.
Statistical Analysis
Continuous and categorical data were presented as mean (95% confidence interval [CI]) and count (%). Statistically significant differences in characteristics between glaucoma suspect and glaucoma patients were determined by 2-sample t tests for continuous variables and the Fisher exact test for categorical variables. Eye characteristics were compared using linear mixed effects models with random intercepts to account for within-subject variability. In the trend-based analysis, VF trajectories were estimated using linear mixed effects models with random eye-within-patient intercepts and independent random slopes-within-eye. The details on the use of these models for evaluation of rates of change in glaucoma and to model longitudinal processes have been published.5, 44, 45 In linear mixed models, the average evolution of the outcome variable (visual field measurements) is described using a linear function of time, and random intercepts and random slopes introduce subject- and eye-specific deviations from this average evolution. The model can account for the fact that different eyes can have different rates of visual field loss over time, while also accommodating correlations between both eyes of the same individual.45, 46 Interaction terms between time and putative predictors (e.g., CH) can be included in the model to test whether there is a significant effect of the putative predictor on changes of the outcome variable over time. Multivariable models were fit after including all variables with P value ≤ 0.10 in univariable analysis. In addition to age, demographic characteristics, and follow-up duration, all models were adjusted for both mean IOP during follow-up47, 48 and positive history of disc hemorrhage16, 49, 50 because of their reported associations with glaucomatous VF progression. In the event-based analysis, univariable and multivariable mixed effects logistic regression models were used to identify characteristics associated with an increased likelihood of 10-2 VF progression defined by the clustered pointwise linear regression (PLR) criterion. Linear mixed-effect models with random intercepts and random slopes were used to compare the rates of 10-2 MD loss and age adjusted zonal rates of mean sensitivity loss between two group of eyes divided based on baseline CH (CH ≥ 10 mmHg and CH < 10 mmHg).17 All statistical analyses were performed with commercially available software (STATA, version 17.0; Stata Corp LP, College Station, Texas, USA). The alpha level (type I error) was set at 0.05.
Results
A total of 248 eyes (71 glaucoma suspect, 177 glaucoma) of 143 patients were included in this prospective cohort study. The cohort included 72 females (50.3%) and 99 non-African descent (69.2%) participants. The mean (95% confidence interval [CI]) baseline age at the study entry was 68.4 (67.1, 69.7) years and the average follow up duration of eyes were 4.8 (4.7, 4.9) years and the average number of visits was 7.8 (7.5, 8.1). A total of 76.6% of study participants were already on ocular hypotensive eye drops at the study entry. Specifically, 63.3% of participants were using prostaglandin analogues at the beginning of the follow up. Glaucoma eyes had lower baseline IOP, lower mean IOP during follow-up, worse baseline 24-2 and 10-2 MDs, and higher baseline 24-2 and 10-2 PSDs (all P-values < 0.05) than glaucoma suspect eyes. Other characteristics including axial length, central corneal thickness, CH, positive history of disc hemorrhage, follow-up duration and number of test visits were similar between glaucoma suspect and glaucoma eyes (all P-values > 0.05) [Table 1]. Figure 1 shows the distribution of baseline CH measurements for all 248 eyes included in the study during follow-up.
Table 1.
Demographics and Baseline Characteristics of the Study Population
| Characteristics | Overall | By Diagnosis | ||
|---|---|---|---|---|
| Glaucoma Suspect | Glaucoma | P-value | ||
| At the patient level | 143 | 40 (28.0) | 103 (72.0) | |
| Gender | 0.853 | |||
| Male (%) | 71 (49.7) | 19 (47.5) | 52 (50.5) | |
| Female (%) | 72 (50.3) | 21 (52.5) | 51 (49.5) | |
| Race | 0.841 | |||
| Non-African American (%) | 99 (69.2) | 27 (67.5) | 72 (69.9) | |
| African American (%) | 44 (30.8) | 13 (32.5) | 31 (30.1) | |
| Self-reported DM (%) | 23 (16.1) | 6 (15.0) | 17 (16.5) | > 0.99 |
| Self-reported HTN (%) | 89 (62.2) | 24 (60.0) | 65 (63.1) | 0.848 |
| Systolic blood pressure (mmHg) | 130.2 (126.9, 133.4) | 131.9 (125.0, 138.8) | 129.5 (125.9, 133.1) | 0.511 |
| Diastolic blood pressure (mmHg) | 76.6 (74.7, 78.5) | 78.6 (74.8, 82.4) | 75.8 (73.6, 78.1) | 0.207 |
| At the eye level | 248 | 71 (28.6) | 177 (71.4) | |
| Baseline age (years) | 68.4 (67.1, 69.7) | 64.9 (62.4, 67.5) | 69.8 (68.3, 71.2) | 0.119 |
| Axial length (mm) | 24.09 (23.97, 24.21) | 24.23 (23.98, 24.48) | 24.03 (23.89, 24.17) | 0.362 |
| CCT (μm) | 543.3 (537.2, 549.4) | 561.0 (549.7, 572.2) | 537.0 (529.9, 544.1) | 0.213 |
| Baseline IOP (mmHg) | 14.6 (14.1, 15.1) | 16.0 (15.2, 16.9) | 13.9 (13.3, 14.5) | 0.012 |
| Mean IOP during follow-up (mmHg) | 14.7 (14.2, 15.2) | 16.4 (15.5, 17.3) | 14.0 (13.5, 14.5) | < 0.001 |
| CH (mmHg) | 9.62 (9.40, 9.84) | 10.12 (9.70, 10.54) | 9.42 (9.17, 9.67) | 0.291 |
| History of DH (%) | 32 (12.9) | 7 (9.9) | 25 (14.1) | 0.317 |
| Glaucoma severity | ||||
| Suspect | 71 (28.6) | |||
| Mild | 135 (54.4) | |||
| Moderate | 22 (8.9) | |||
| Advanced | 20 (8.1) | |||
| Baseline 24-2 MD (dB) | −3.31 (−3.85, −2.78) | −0.40 (−0.74, −0.05) | −4.48 (−5.15, −3.82) | < 0.001 |
| Baseline 24-2 PSD (dB) | 4.28 (3.83, 4.72) | 1.74 (1.61, 1.87) | 5.29 (4.74, 5.85) | < 0.001 |
| Baseline 10-2 MD (dB) | −2.87 (−3.44, −2.29) | −0.50 (−0.81, −0.18) | −3.82 (−4.57, −3.06) | < 0.001 |
| Baseline 10-2 PSD (dB) | 3.59 (3.08, 4.10) | 1.29 (1.22, 1.36) | 4.51 (3.84, 5.18) | < 0.001 |
| 10-2 Follow-up (years) | 4.8 (4.7, 4.9) | 5.0 (4.9, 5.2) | 4.7 (4.6, 4.9) | 0.079 |
| Visits of 10-2 Visual Field | 7.8 (7.5, 8.1) | 7.4 (7.0, 7.9) | 8.0 (7.6, 8.3) | 0.842 |
F = female; M = male; DM = diabetes mellitus; HTN = hypertension; CCT = central corneal thickness; IOP = intraocular pressure; CH = corneal hysteresis; DH = disc hemorrhage; MD = mean deviation; PSD = pattern standard deviation.
Values are shown in mean (95% confidence interval), unless otherwise indicated.
Figure 1.
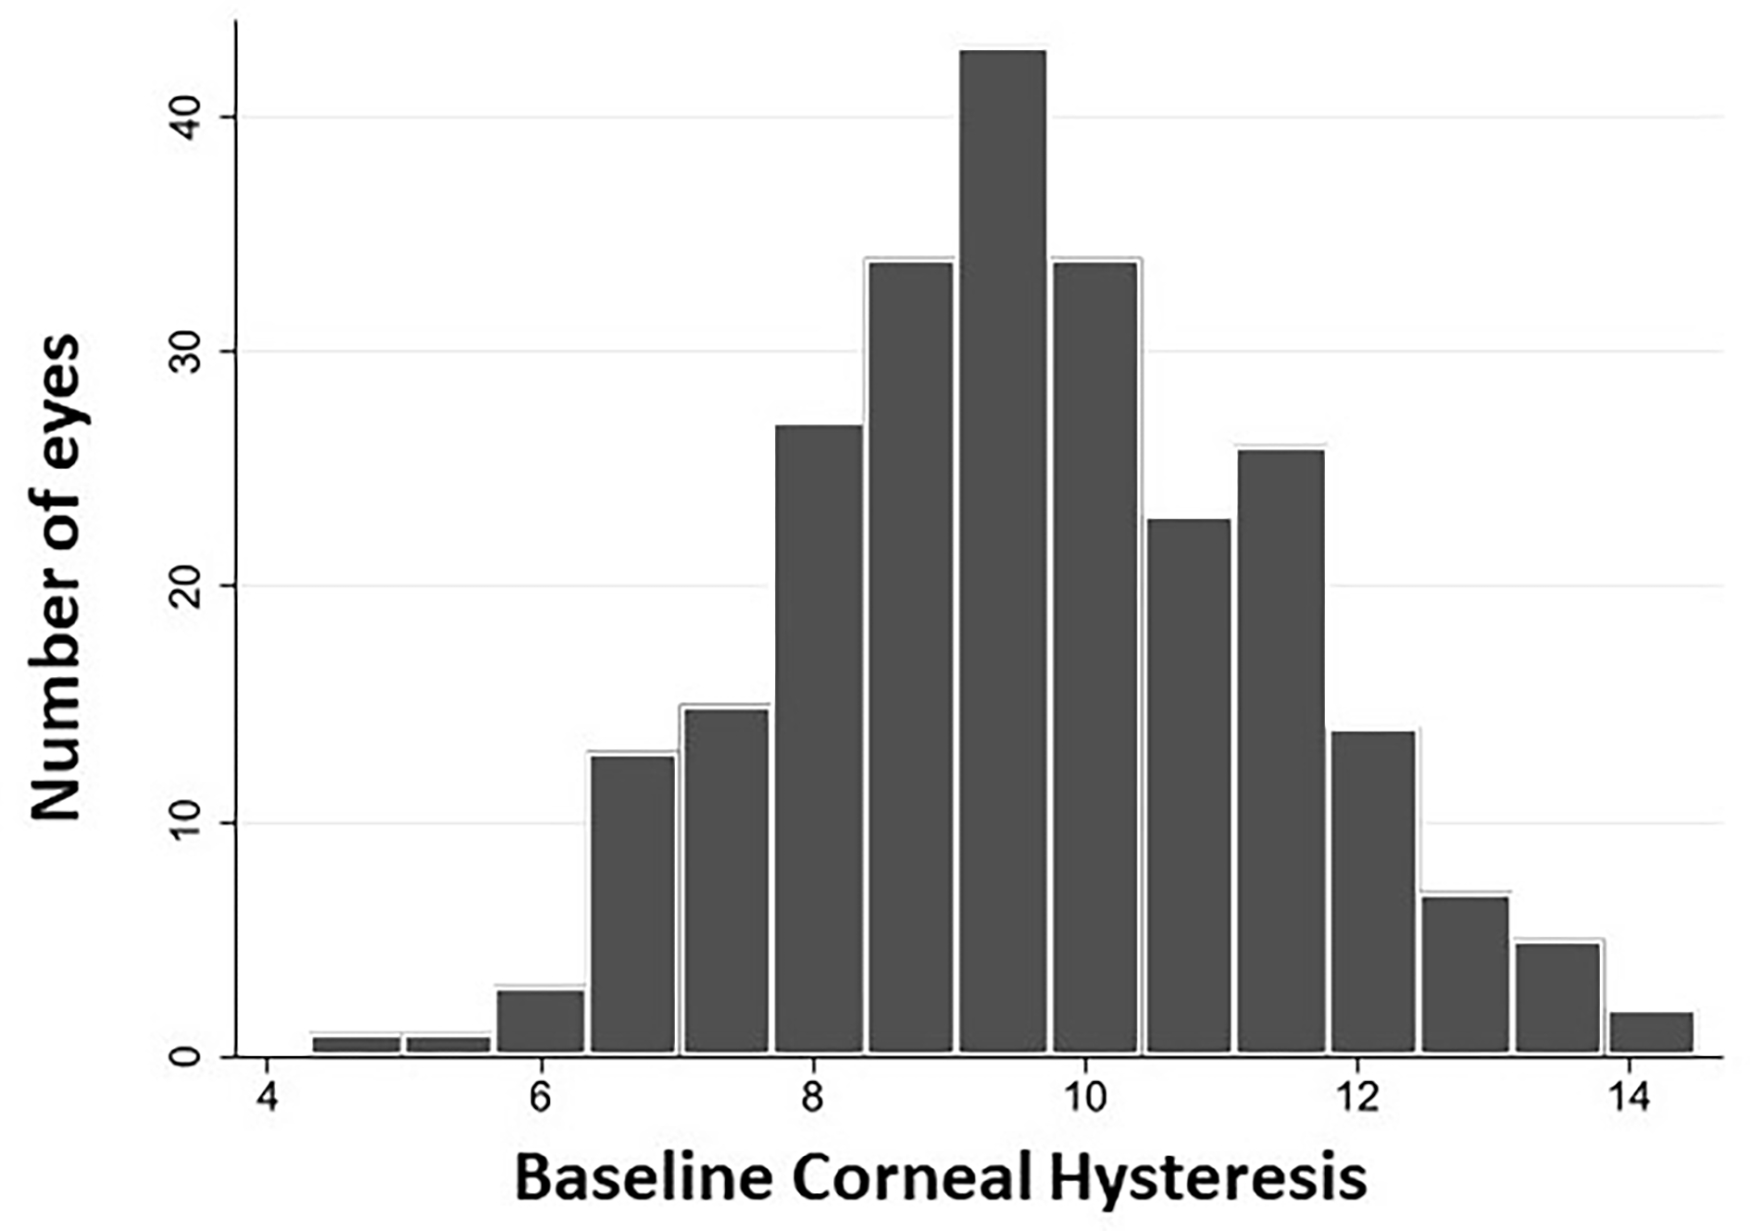
Distribution of baseline corneal hysteresis measurements for all 248 eyes included in the study of the relationship between corneal hysteresis and central visual field loss during follow-up.
Table 2 shows the results of univariable and multivariable trend-based analysis of the characteristics associated with rate of change in 10-2 VF MD over time. In the univariable analysis, male gender, higher baseline 10-2 PSD, worse baseline 24-2 MD, higher baseline 24-2 PSD, and lower baseline CH were associated with faster rate of 10-2 VF progression (all P-values < 0.05). Results of the multivariable analysis showed that lower mean IOP during follow-up (β = −0.02 dB/year per 1 mmHg higher, P = 0.043), worse baseline 24-2 MD (β = −0.02 dB/year per 1 dB worse, P = 0.004), and lower baseline CH (β = −0.07 dB/year per 1 mmHg lower, P < 0.001) were significantly associated with faster rate of 10-2 VF progression.
Table 2.
Characteristics Associated with the Rate of 10-2 MD Change Over Time by Univariable and Multivariable Linear Mixed Effects Model Analysis
| Variables | Univariable Model | Multivariable Model | ||
|---|---|---|---|---|
| β (95 % CI) | p value | β (95 % CI) | p value | |
|
| ||||
| Age, per 10 years older | −0.05 (−0.11, 0.01) | 0.102 | −0.02 (−0.09, 0.05) | 0.561 |
| Gender: F/M | 0.13 (0.00, 0.26) | 0.049 | 0.04 (−0.10, 0.18) | 0.586 |
| Race: | ||||
| African American/ Non-African American | −0.01 (−0.15, 0.13) | 0.889 | −0.02 (−0.17, 0.12) | 0.762 |
| Axial length, per 1mm longer | 0.01 (−0.06, 0.07) | 0.790 | − | − |
| CCT, per 10 μm thinner | 0.00 (−0.02, 0.01) | 0.844 | − | − |
| Self-reported diabetes | −0.07 (−0.25, 0.11) | 0.433 | − | − |
| Self-reported hypertension | 0.06 (−0.08, 0.19) | 0.412 | − | − |
| Baseline systolic blood pressure, per 10 mmHg higher | 0.00 (−0.04, 0.03) | 0.827 | − | − |
| Baseline diastolic blood pressure, per 10 mmHg higher | 0.00 (−0.05, 0.05) | 0.992 | − | − |
| Baseline IOP, per 1 mmHg higher | 0.00 (−0.02, 0.01) | 0.612 | − | − |
| Mean IOP during follow up, per 1 mmHg higher | −0.01 (−0.03, 0.01) | 0.277 | −0.02 (−0.04, 0.00) | 0.043 |
| History of disc hemorrhage | −0.11 (−0.25, 0.02) | 0.096 | −0.12 (−0.25, 0.02) | 0.093 |
| Baseline MD 10-2, per 1 dB worse | −0.01 (−0.02, 0.00) | 0.111 | − | − |
| Baseline PSD 10-2, per 1 dB higher | −0.01 (−0.02, 0.00) | 0.036 | − | − |
| Baseline MD 24-2, per 1 dB worse | −0.02 (−0.03, −0.01) | 0.002 | −0.02 (−0.03, −0.01) | 0.004 |
| Baseline PSD 24-2, per 1 dB higher | −0.02 (−0.03, 0.00) | 0.007 | − | − |
| CH, per 1 mmHg lower | −0.07 (−0.11, −0.04) | < 0.001 | −0.07 (−0.11, −0.03) | < 0.001 |
| Follow up duration, per 1 year longer | 0.04 (−0.04, 0.11) | 0.363 | 0.02 (−0.06, 0.10) | 0.628 |
MD = mean deviation; F = female; M = male; CCT = central corneal thickness; IOP = intraocular pressure; PSD = pattern standard deviation; CH = corneal hysteresis.
Values are shown in β coefficient (95% confidence interval), unless otherwise indicated. Age, Race, mean IOP and clinically independent variables with a p value of less than 0.10 in the univariable analysis were included in the multivariable model. Statistically significant p values are shown in bold. Negative values correspond to faster MD decline over time.
Table 3 shows the results of univariable and multivariable mixed effects logistic regression model analysis of the characteristics associated with an increased likelihood of event-based 10-2 VF progression at the end of study follow-up. Twenty-eight eyes (11.3%) showed 10-2 VF progression defined by clustered PLR criterion. Worse baseline 24-2 MD, higher baseline 24-2 PSD, and lower baseline CH were the only significantly associated characteristics with an increased likelihood of 10-2 VF progression (all P-values < 0.05). After adjusting for confounders, worse baseline 24-2 MD (OR = 1.09 per 1 dB worse, P = 0.045), and lower baseline CH (OR = 1.35 per 1 mmHg lower, P = 0.025) remained significantly associated with an increased likelihood of 10-2 VF progression.
Table 3.
Characteristics Associated with the Likelihood of Event-Based 10-2 VF Progression Defined by Clustered Pointwise Linear Regression (PLR) Criteria of Mean Sensitivity using Univariable and Multivariable Mixed Effects Logistic Regression Analysis
| Variables | Univariable Model | Multivariable Model | ||
|---|---|---|---|---|
| Odds ratio (95 % CI) | p value | Odds ratio (95 % CI) | p value | |
|
| ||||
| Age, per 10 years older | 0.98 (0.65, 1.48) | 0.937 | 0.87 (0.60, 1.27) | 0.472 |
| Gender: F/M | 0.57 (0.23, 1.43) | 0.232 | 0.67 (0.21, 2.08) | 0.486 |
| Race: | ||||
| African American/ Non-African American | 1.11 (0.41, 2.99) | 0.844 | 1.31 (0.45, 3.82) | 0.616 |
| Axial length, per 1mm longer | 0.93 (0.68, 1.27) | 0.633 | − | − |
| CCT, per 10 μm thinner | 0.99 (0.89, 1.11) | 0.882 | − | − |
| Self-reported diabetes | 1.49 (0.48, 4.65) | 0.490 | − | − |
| Self-reported hypertension | 0.51 (0.21, 1.27) | 0.150 | − | − |
| Baseline systolic blood pressure, per 10 mmHg higher | 0.97 (0.79, 1.19) | 0.772 | − | − |
| Baseline diastolic blood pressure, per 10 mmHg higher | 1.03 (0.71, 1.49) | 0.870 | − | − |
| Baseline IOP, per 1 mmHg higher | 0.97 (0.88, 1.08) | 0.636 | − | − |
| Mean IOP during follow up, per 1 mmHg higher | 1.02 (0.90, 1.15) | 0.805 | 1.05 (0.92, 1.21) | 0.444 |
| History of disc hemorrhage | 2.60 (0.99, 6.82) | 0.052 | 2.23 (0.66, 7.46) | 0.194 |
| Baseline MD 10-2, per 1 dB worse | 1.04 (0.97, 1.12) | 0.242 | − | − |
| Baseline PSD 10-2, per 1 dB higher | 1.08 (0.99, 1.18) | 0.101 | − | − |
| Baseline MD 24-2, per 1 dB worse | 1.08 (1.01, 1.16) | 0.024 | 1.09 (1.00, 1.18) | 0.045 |
| Baseline PSD 24-2, per 1 dB higher | 1.10 (1.00, 1.20) | 0.041 | − | − |
| CH, per 1 mmHg lower | 1.35 (1.09, 1.67) | 0.006 | 1.35 (1.04, 1.75) | 0.025 |
| Follow up duration, per 1 year longer | 1.14 (0.73, 1.78) | 0.564 | 1.18 (0.75, 1.85) | 0.475 |
MD = mean deviation; F = female; M = male; CCT = central corneal thickness; IOP = intraocular pressure; PSD = pattern standard deviation; CH = corneal hysteresis.
Values are shown in β coefficient (95% confidence interval), unless otherwise indicated. Age, Race, mean IOP and clinically independent variables with a p value of less than 0.10 in the univariable analysis were included in the multivariable model. Statistically significant p values are shown in bold.
Table 4 shows factors associated with the rate of 24-2 VF MD change over time. In the univariable analysis, higher baseline age, and lower baseline CH, and lower follow-up duration were associated with faster rate of 24-2 VF progression (all P-values < 0.05). In the multivariable model including baseline age, gender, race, mean IOP during follow-up and follow-up duration as possible confounders, the association of baseline CH with the rate of 24-2 VF progression was not significant (P = 0.490).
Table 4.
Characteristics Associated with the Rate of 24-2 MD Change Over Time by Univariable and Multivariable Linear Mixed Effects Model Analysis
| Variables | Univariable Model | Multivariable Model | ||
|---|---|---|---|---|
| β (95 % CI) | p value | β (95 % CI) | p value | |
|
| ||||
| Age, per 10 years older | −0.08 (−0.14, 0.00) | 0.021 | −0.07 (−0.14, 0.00) | 0.060 |
| Gender: F/M | 0.11 (−0.03, 0.25) | 0.120 | 0.11 (−0.04, 0.26) | 0.167 |
| Race: | ||||
| African American/ Non-African American | −0.05 (−0.21, 0.10) | 0.487 | −0.08 (−0.23, 0.08) | 0.332 |
| Axial length, per 1mm longer | 0.04 (−0.03, 0.11) | 0.248 | − | − |
| CCT, per 10 μm thinner | −0.01 (−0.03, 0.01) | 0.284 | − | − |
| Self-reported diabetes | −0.14 (−0.33, 0.05) | 0.151 | − | − |
| Self-reported hypertension | 0.05 (−0.09, 0.20) | 0.487 | − | − |
| Baseline systolic blood pressure, per 1 mmHg higher | −0.02 (−0.06, 0.02) | 0.280 | − | − |
| Baseline diastolic blood pressure, per 1 mmHg higher | 0.01 (−0.05, 0.06) | 0.819 | − | − |
| Baseline IOP, per 1 mmHg higher | −0.01 (−0.02, 0.01) | 0.505 | − | − |
| Mean IOP during follow up, per 1 mmHg higher | −0.01 (−0.03, 0.01) | 0.499 | −0.01 (−0.03, 0.01) | 0.271 |
| History of disc hemorrhage | −0.04 (−0.20, 0.12) | 0.603 | − | − |
| CH, per 1 mmHg lower | −0.04 (−0.07, 0.00) | 0.044 | −0.01 (−0.06, 0.03) | 0.490 |
| Follow up duration, per 1 year longer | 0.04 (−0.05, 0.14) | 0.383 | 0.04 (−0.06, 0.14) | 0.439 |
MD = mean deviation; F = female; M = male; CCT = central corneal thickness; IOP = intraocular pressure; PSD = pattern standard deviation; CH = corneal hysteresis.
Values are shown in β coefficient (95% confidence interval), unless otherwise indicated. Race and clinically independent variables with a p value of less than 0.10 in the univariable analysis were included in the multivariable model. Statistically significant p values are shown in bold. Negative values correspond to faster MD decline over time.
Supplemental Tables 1 (trend-based analysis) and 2 (event-based analysis) demonstrate the results of separate univariable and multivariable models including the subgroup of eyes with early glaucoma at the baseline (24-2 MD ≥ −6 dB). After adjusting for other covariates in the multivariable models, lower CH was associated with a faster rate of 10-2 VF progression (β = −0.05 dB/year per 1 mmHg lower, P = 0.004) in the trend-based analysis and an increased likelihood of 10-2 event-based VF progression (OR = 1.37 per 1 mmHg lower, P = 0.021).
Figure 2 compares the age-adjusted rates of change in different zones of 10-2 VF test grid between the subgroup of eyes with baseline CH < 10 mmHg (147, 59.3%) to those with baseline CH ≥ 10 mmHg (101, 40.7%). The cut-off of 10 mmHg was chosen for illustrative purposes based on a previous publication.17 As demonstrated, eyes with baseline CH < 10 mmHg had faster VF progression in the superior temporal (difference: −0.18 dB/year, P = 0.002), and the superior nasal zones (difference: −0.28 dB/year, P = 0.001) than eyes with CH ≥ 10 mm Hg. The difference in the rates of change between CH groups did not reach statistical significance in the superior temporal band (difference: −0.07 dB/year, P = 0.189), the inferior nasal (difference: −0.11 dB/year, P = 0.154), and the inferior temporal (difference: −0.11 dB/year, P = 0.053) zones. Overall, eyes with baseline CH < 10 mmHg had faster rate of change in 10-2 MD compared to those with baseline CH ≥ 10 mmHg (difference: −0.15 dB/year, P = 0.008).
Figure 2.
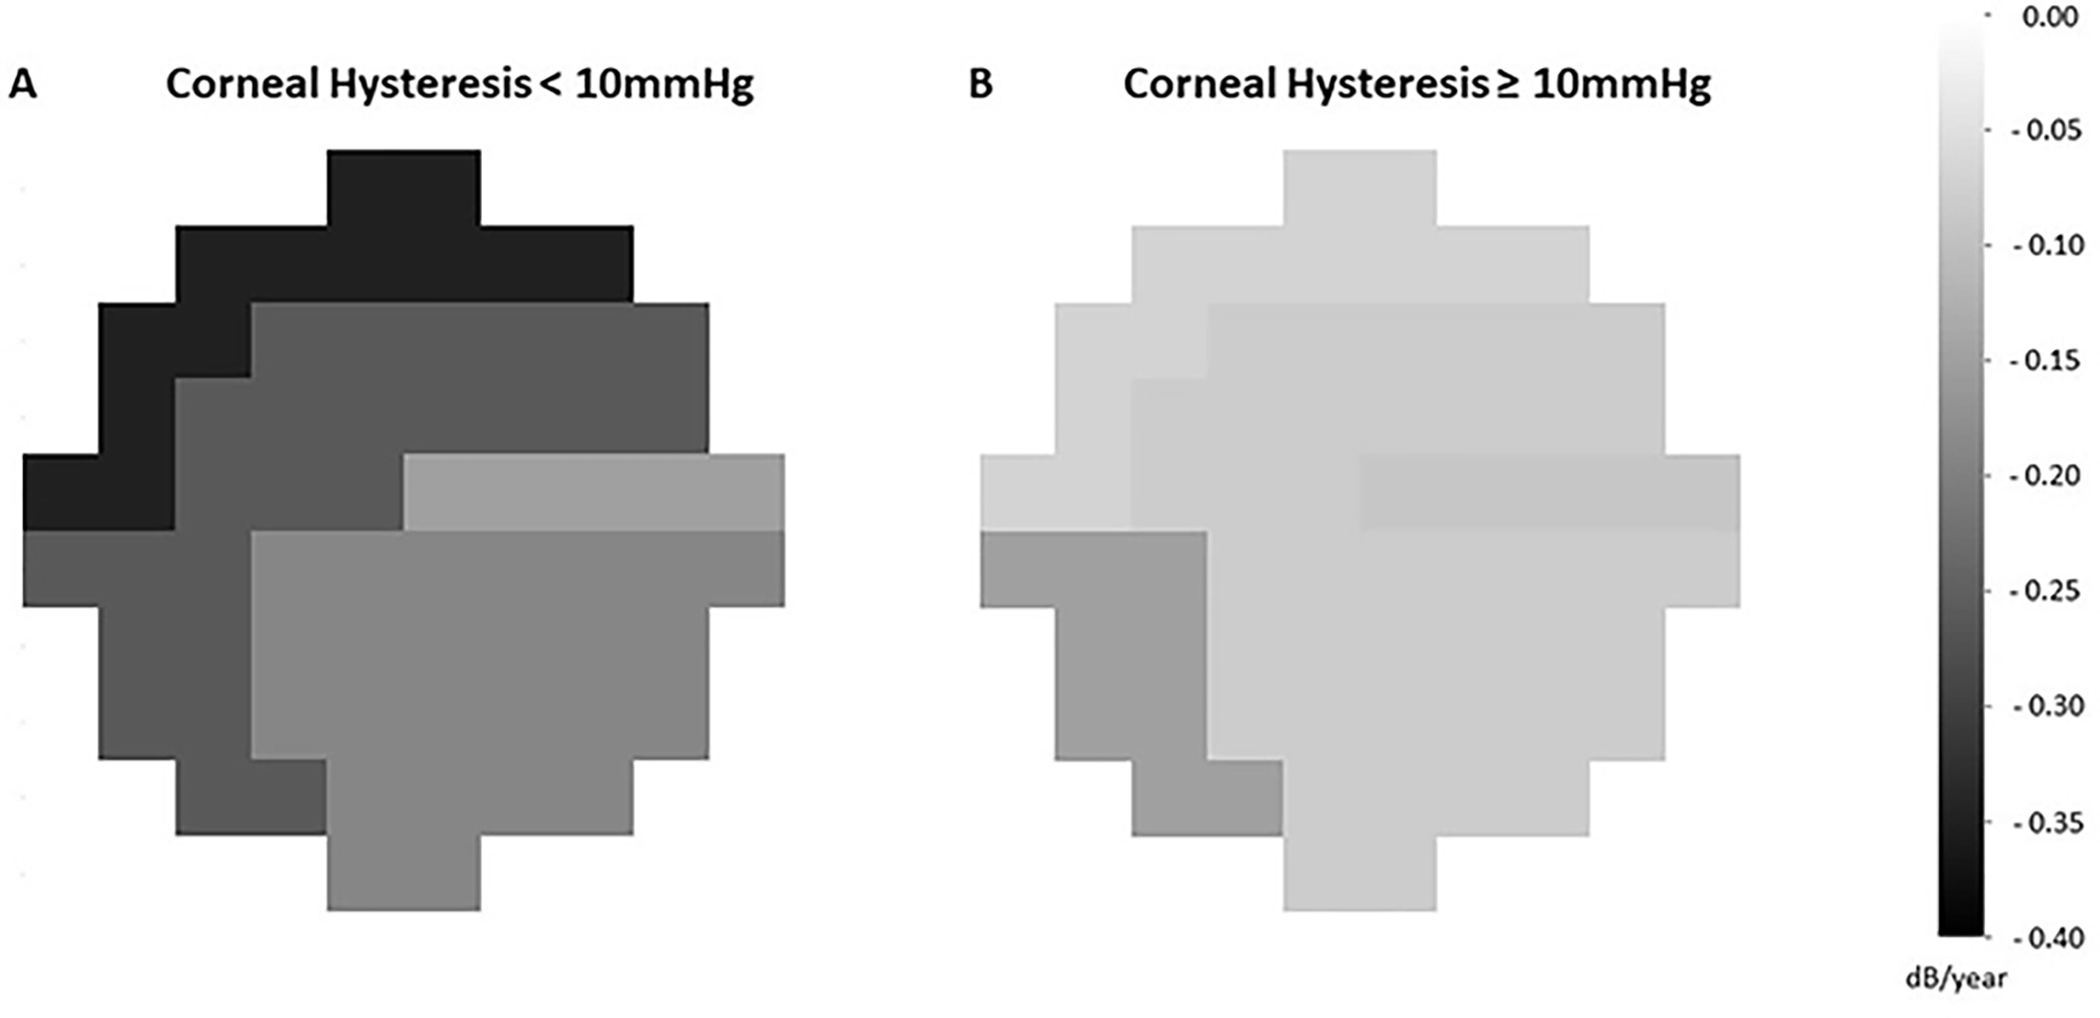
Zonal rates of change (dB/year) in 10-2 test grid are compared between eyes with baseline corneal hysteresis < 10 mmHg (A, 147 eyes) and those with baseline corneal hysteresis ≥ 10 mmHg (B, 101 eyes). Darker areas correspond to faster rate of visual field progression.
Discussion
This prospective study demonstrated that lower baseline CH is associated with faster global (24-2) and central (10-2) VF progression in a cohort of glaucoma suspect and glaucoma patients over an average follow-up duration of 4.8 years. Moreover, we found that lower CH increases the likelihood of central VF progression defined by clustered PLR criteria on the 10-2 test grid. The observed associations were derived from multivariable models after adjusting for demographic and other possible risk factors of glaucoma progression. These results show that CH is a significant predictor of glaucomatous central and peripheral VF progression. Given the substantial influence of central VF impairment on the performance and quality of life, our findings suggest that CH should be considered in the risk assessment of disease progression in clinical practice.
Prior studies have found lower CH to be associated with an increased rate of functional17 and structural29 deterioration in glaucoma patients. In this study, the event-based multivariable analysis showed that one mmHg lower CH corresponds to a 35% increase in the odds of central VF progression after adjusting for other covariates. Central vision is particularly important in daily functioning, and impairments in this area are strongly associated with lower self-reported quality of life in glaucoma patients.23–26 There is an accumulating body of evidence that glaucomatous damage can affect the central VF area even at the early stages of the disease.27 Therefore, we performed a subanalysis including early glaucoma patients (baseline 24-2 VF MD ≥ −6 dB). The results revealed similar associations between lower CH and increased likelihood of central VF progression.
Other investigators have evaluated the prognostic value of corneal biomechanical properties in forecasting glaucoma progression at earlier stages. Susanna et al.,19 in a prospective longitudinal study, followed glaucoma suspect patients without apparent VF defects at the baseline for an average of 3.9 years and found that lower baseline CH is a significant predictor (hazard ratio = 1.20) of the development of VF defect at the end of follow-up. In a recent longitudinal study, Qassim and collaborators28 followed eyes with suspicious appearing optic discs but without apparent VF defects at baseline; they found that eyes with higher corneal stiffness at baseline are at increased risk of future VF progression and demonstrate a faster rate of structural decline in the retinal nerve fiber layer and macular measurements.
In the trend-based analysis, lower CH was found to be a statistically significant predictor of faster central VF progression. Consistent associations were obtained after a sub-analysis, including the early glaucoma patients (baseline 24-2 VF MD ≥ −6 dB). Each one mmHg lower CH led to a 0.07 dB/year faster rate of decline in 10-2 VF MD. Such an association was found after adjusting for demographic and other potential factors associated with a faster rate of central VF progression, including mean IOP during study follow-up and positive history of disc hemorrhage. According to our findings, the effect of a lower CH on the rate of VF change (both globally and in the central vision) may appear small when considered a separate risk factor of glaucoma progression. In a previous study, Medeiros and colleagues17 found that each 1 mmHg lower CH corresponds to a 0.16% faster rate of decline in the 24-2 VF index, which is in line with our findings in terms of the magnitude of effect. Many prior studies have tried to investigate risk factors that are predictive of glaucoma progression and, as a result, several other demographic and clinical characteristics have been identified.7, 8, 51, 52 Not a single baseline factor has been shown to be accurately predictive, and most of the reported associations have been weak in terms of the magnitude of effect.7, 8, 51, 52 As is the case with most chronic diseases of aging, glaucoma progression is multifactorial with complex genetic and environmental interactions in most cases, one might not expect to find the cause in a single predictive parameter. Differences in inclusion criteria, characteristics of the study population, and definitions of the study outcomes may contribute to the relatively weak and probably inconsistent associations.52 It must be acknowledged that CH alone is one of the risk factors in the global risk assessment of glaucoma, and it may not necessarily be a major determinant. Nonetheless, when it comes to clinical decision-making, a holistic approach including many individualized risk factors should be undertaken. According to the ample available evidence on the prognostic significance of corneal biomechanical properties for subsequent glaucoma progression at different stages of the disease, clinicians should consider taking these characteristics into account as a part of this approach to risk stratify the patients.
Previous studies have shown that central VF damage in glaucoma usually tends to follow a pattern of earlier and more profound involvement of superior zones and a “central island” of relative preservation which includes the superior temporal band and a great proportion of the inferior zones on the 10-2 test grid.27, 42, 53–55 The higher propensity of superior 10-2 zones to glaucomatous VF damage is consistent with reports of Hood and colleagues27 and Hood53 suggesting that the inferior macular region is more susceptible to glaucomatous damage than the superior macular region. They coined the term “macular vulnerability zone” to describe the 50% of inferotemporal arcuate retinal nerve fiber layer fibers that are more susceptible to glaucomatous damage. In the present study, we found statistically significant faster rates of central VF progression in the superior 10-2 zones of eyes with lower CH. Whether lower CH is a risk factor that accelerates central VF progression globally or it differently influences the rates of central VF progression in other zones is a topic for future studies.
The exact underlying mechanisms of how corneal biomechanical properties might influence the susceptibility of the optic nerve head to glaucomatous damage are still unclear. Hysteresis has been introduced as a parameter that reflects the viscoelastic biophysical properties of tissue in dampening pressure fluctuations.17 Since cornea and sclera are arranged in a contiguous configuration collectively forming the corneoscleral envelope, and they are formed from the continuous extracellular matrix, deformability and stretching of these structures appear to be closely linked. Hence, CH may indicate a surrogate biomarker reflecting the physical properties of lamina cribrosa and peripapillary sclera.17 In favor of this hypothesis, prior studies have shown an association between CH and anterior displacement of lamina cribrosa after IOP reduction56 and posterior displacement of the lamina after IOP increase.57 Lower CH is reported to be linked to a reduction in the ability of posterior ocular structures to dampen fluctuations and peaks of IOP.56, 58–61 Accordingly, a prior study has found that CH and IOP have an interactive role in increasing the risk of glaucoma progression.17 Another possible implication of CH in glaucoma patients is the potential underestimation of transcorneal pressure gradient measured by Goldmann applanation tonometry. As a result, patients with lower CH might have, in fact, been exposed to higher levels of IOP than those perceived by their clinicians, leading to a higher probability of disease progression.62, 63 For further support, a recent study has found that approximately one-quarter of eyes with apparently well-controlled IOP show evidence of VF progression over time, with low CH being a major risk factor.18
It must be acknowledged that the majority of study participants were already under ocular hypotensive treatment at the study onset. Specifically, approximately two thirds of the patients were receiving prostaglandin analogues at the beginning of the follow up. Previous studies have demonstrated that different topical ocular hypotensive agents may affect corneal properties and induce alterations of CH.64–67 Prostaglandin analogues, in particular, seem to induce extracellular matrix alteration resulting from increased matrix metalloproteinase activity that may lead to an increase in CH.67–72 Considering that patients with worse disease severity were more likely to have been receiving antiglaucoma eye drops compared to those with better prognosis at the time of baseline CH measurement may have created a potential bias that needs to be addressed for interpretation of the results of the present study and those of previously mentioned investigations.17, 18, 28, 29 However, the association between baseline CH and subsequent rate of central VF progression in the present study remained similar after adjusting for receiving any kinds of ocular hypotensive agents or prostaglandin analogues (data not shown).
There are several limitations of the present study. First, baseline CH measurements were used as predictors of central VF progression. Even though such an assessment facilitates comparing the findings with those of similar studies evaluating the association of baseline characteristics with the risk of glaucoma progression, the potential influence of alterations in corneal biomechanical properties over time on the rate of disease progression cannot be ignored. Future studies are needed to assess whether including longitudinal variability of these measurements into more complex statistical models provides added prognostic significance. Nevertheless, the observations of the present study are sufficient to suggest the role of CH as a potential risk factor of central VF progression. In addition, study participants were treated at the discretion of their attending ophthalmologists. It is possible that more intense treatment of those with previously known risk factors of disease progression, like thinner central corneas, affected the association of some of the baseline characteristics with subsequent disease progression. However, the sparse use of CH in current clinical practice as a determinant of treatment modulation lowers the probability of such an influence. And last, glaucoma eyes had lower IOP because of existing treatment. Information on the washout IOP’s was not available.
In conclusion, the present study demonstrates that lower baseline CH is associated with a statistically significant, but relatively small, increased risk of central VF progression in patients with primary open angle glaucoma including those with early disease. Given the importance of central vision, clinicians should consider evaluating CH when estimating the risk of glaucoma progression in these patients.
Supplementary Material
Table of Contents Statement.
Lower baseline corneal hysteresis was associated with a statistically significant, but relatively small, increased risk of central 10° visual field progression in a prospective cohort of glaucoma suspect and glaucoma patients.
Financial Support:
National Institutes of Health/National Eye Institute Grants R01EY029058, R01EY011008, U10EY014267, R01EY026574, R01EY019869 and R01EY027510; Core Grant P30EY022589; an unrestricted grant from Research to Prevent Blindness (New York, NY) to UCSD and UAB; Eyesight Foundation of Alabama; UC Tobacco-Related Disease Research Program (T31IP1511); and grants for participants’ glaucoma medications from Alcon, Allergan, Pfizer, Merck, and Santen. The sponsor or funding organizations had no role in the design or conduct of this research.
Abbreviations and Acronyms:
- ADAGES
African Descent and Glaucoma Evaluation Study
- BLUP
best linear unbiased prediction
- CH
corneal hysteresis
- DIGS
Diagnostic Innovations in Glaucoma Study
- GHT
glaucoma hemifield test
- IOP
intraocular pressure
- MD
mean deviation
- LCA
latent class analysis
- ORA
ocular response analyzer
- PSD
pattern standard deviation
- PLR
pointwise linear regression
- VF
visual field
- VisFACT
Visual Field Assessment Center
Footnotes
Financial Disclosures:
Alireza Kamalipour: none; Sasan Moghimi: none; Medi Eslani: none; Takashi Nishida: none; Vahid Mohammadzadeh: none; Eleonora Micheletti: none; Christopher A. Girkin: Financial support (research instruments) – Heidelberg Engineering; Massimo A. Fazio: Financial support (research instruments) – Heidelberg Engineering; Jeffrey M. Liebmann: none; Linda M. Zangwill: Financial support (research instruments) – Heidelberg Engineering, Carl Zeiss Meditec, Optovue, Topcon, research support/contracts: Heidelberg Engineering; Consultant: Abbvie; Robert N. Weinreb: Financial support (research instruments) - Heidelberg Engineering, Carl Zeiss Meditec, Konan Medical, Optovue, Centervue, Bausch & Lomb; Consultant – Aerie Pharmaceuticals, Allergan, Equinox, Eyenovia; Patent – Toromedes, Carl Zeiss Meditec.
References
- 1.Weinreb RN, Aung T, Medeiros FA. The pathophysiology and treatment of glaucoma: a review. Jama 2014;311:1901–11. [DOI] [PMC free article] [PubMed] [Google Scholar]
- 2.Weinreb RN, Leung CK, Crowston JG, et al. Primary open-angle glaucoma. Nature reviews Disease primers 2016;2:16067. [DOI] [PubMed] [Google Scholar]
- 3.Anderson DR, Drance SM, Schulzer M. Natural history of normal-tension glaucoma. Ophthalmology 2001;108:247–53. [DOI] [PubMed] [Google Scholar]
- 4.Heijl A, Bengtsson B, Hyman L, Leske MC. Natural history of open-angle glaucoma. Ophthalmology 2009;116:2271–6. [DOI] [PubMed] [Google Scholar]
- 5.Medeiros FA, Zangwill LM, Alencar LM, Sample PA, Weinreb RN. Rates of progressive retinal nerve fiber layer loss in glaucoma measured by scanning laser polarimetry. Am J Ophthalmol 2010;149:908–15. [DOI] [PubMed] [Google Scholar]
- 6.Kwon JM, Weinreb RN, Zangwill LM, Suh MH. Parapapillary Deep-Layer Microvasculature Dropout and Visual Field Progression in Glaucoma. Am J Ophthalmol 2019;200:65–75. [DOI] [PubMed] [Google Scholar]
- 7.Gordon MO, Beiser JA, Brandt JD, et al. The Ocular Hypertension Treatment Study: baseline factors that predict the onset of primary open-angle glaucoma. Archives of ophthalmology (Chicago, Ill : 1960) 2002;120:714–20; discussion 829–30. [DOI] [PubMed] [Google Scholar]
- 8.Leske MC, Heijl A, Hyman L, Bengtsson B, Dong L, Yang Z. Predictors of long-term progression in the early manifest glaucoma trial. Ophthalmology 2007;114:1965–72. [DOI] [PubMed] [Google Scholar]
- 9.The Advanced Glaucoma Intervention Study (AGIS): 7. The relationship between control of intraocular pressure and visual field deterioration.The AGIS Investigators. Am J Ophthalmol 2000;130:429–40. [DOI] [PubMed] [Google Scholar]
- 10.Miglior S, Torri V, Zeyen T, Pfeiffer N, Vaz JC, Adamsons I. Intercurrent factors associated with the development of open-angle glaucoma in the European glaucoma prevention study. Am J Ophthalmol 2007;144:266–275. [DOI] [PubMed] [Google Scholar]
- 11.Medeiros FA, Sample PA, Zangwill LM, Bowd C, Aihara M, Weinreb RN. Corneal thickness as a risk factor for visual field loss in patients with preperimetric glaucomatous optic neuropathy. Am J Ophthalmol 2003;136:805–13. [DOI] [PubMed] [Google Scholar]
- 12.Drance S, Anderson DR, Schulzer M. Risk factors for progression of visual field abnormalities in normal-tension glaucoma. Am J Ophthalmol 2001;131:699–708. [DOI] [PubMed] [Google Scholar]
- 13.Leske MC, Wu SY, Hennis A, Honkanen R, Nemesure B. Risk factors for incident open-angle glaucoma: the Barbados Eye Studies. Ophthalmology 2008;115:85–93. [DOI] [PubMed] [Google Scholar]
- 14.Budenz DL, Anderson DR, Feuer WJ, et al. Detection and prognostic significance of optic disc hemorrhages during the Ocular Hypertension Treatment Study. Ophthalmology 2006;113:2137–43. [DOI] [PMC free article] [PubMed] [Google Scholar]
- 15.Bengtsson B, Leske MC, Yang Z, Heijl A. Disc hemorrhages and treatment in the early manifest glaucoma trial. Ophthalmology 2008;115:2044–8. [DOI] [PubMed] [Google Scholar]
- 16.David RCC, Moghimi S, Do JL, et al. Characteristics of Central Visual Field Progression in Eyes with Optic Disc Hemorrhage. Am J Ophthalmol 2021;231:109–119. [DOI] [PMC free article] [PubMed] [Google Scholar]
- 17.Medeiros FA, Meira-Freitas D, Lisboa R, Kuang TM, Zangwill LM, Weinreb RN. Corneal hysteresis as a risk factor for glaucoma progression: a prospective longitudinal study. Ophthalmology 2013;120:1533–40. [DOI] [PMC free article] [PubMed] [Google Scholar]
- 18.Susanna BN, Ogata NG, Jammal AA, Susanna CN, Berchuck SI, Medeiros FA. Corneal Biomechanics and Visual Field Progression in Eyes with Seemingly Well-Controlled Intraocular Pressure. Ophthalmology 2019;126:1640–1646. [DOI] [PMC free article] [PubMed] [Google Scholar]
- 19.Susanna CN, Diniz-Filho A, Daga FB, et al. A Prospective Longitudinal Study to Investigate Corneal Hysteresis as a Risk Factor for Predicting Development of Glaucoma. Am J Ophthalmol 2018;187:148–152. [DOI] [PMC free article] [PubMed] [Google Scholar]
- 20.Faridi OS, Park SC, Kabadi R, et al. Effect of focal lamina cribrosa defect on glaucomatous visual field progression. Ophthalmology 2014;121:1524–30. [DOI] [PubMed] [Google Scholar]
- 21.Jonas JB, Martus P, Horn FK, Jünemann A, Korth M, Budde WM. Predictive factors of the optic nerve head for development or progression of glaucomatous visual field loss. Invest Ophthalmol Vis Sci 2004;45:2613–8. [DOI] [PubMed] [Google Scholar]
- 22.Teng CC, De Moraes CG, Prata TS, et al. The region of largest β-zone parapapillary atrophy area predicts the location of most rapid visual field progression. Ophthalmology 2011;118:2409–13. [DOI] [PubMed] [Google Scholar]
- 23.Wu Z, Medeiros FA, Weinreb RN, Zangwill LM. Performance of the 10-2 and 24-2 Visual Field Tests for Detecting Central Visual Field Abnormalities in Glaucoma. Am J Ophthalmol 2018;196:10–17. [DOI] [PMC free article] [PubMed] [Google Scholar]
- 24.Abe RY, Diniz-Filho A, Costa VP, Gracitelli CP, Baig S, Medeiros FA. The Impact of Location of Progressive Visual Field Loss on Longitudinal Changes in Quality of Life of Patients with Glaucoma. Ophthalmology 2016;123:552–7. [DOI] [PMC free article] [PubMed] [Google Scholar]
- 25.Sun Y, Lin C, Waisbourd M, et al. The Impact of Visual Field Clusters on Performance-based Measures and Vision-Related Quality of Life in Patients With Glaucoma. Am J Ophthalmol 2016;163:45–52. [DOI] [PubMed] [Google Scholar]
- 26.Blumberg DM, De Moraes CG, Prager AJ, et al. Association Between Undetected 10-2 Visual Field Damage and Vision-Related Quality of Life in Patients With Glaucoma. JAMA ophthalmology 2017;135:742–747. [DOI] [PMC free article] [PubMed] [Google Scholar]
- 27.Hood DC, Raza AS, de Moraes CG, Liebmann JM, Ritch R. Glaucomatous damage of the macula. Prog Retin Eye Res 2013;32:1–21. [DOI] [PMC free article] [PubMed] [Google Scholar]
- 28.Qassim A, Mullany S, Abedi F, et al. Corneal Stiffness Parameters Are Predictive of Structural and Functional Progression in Glaucoma Suspect Eyes. Ophthalmology 2021;128:993–1004. [DOI] [PubMed] [Google Scholar]
- 29.Zhang C, Tatham AJ, Abe RY, et al. Corneal Hysteresis and Progressive Retinal Nerve Fiber Layer Loss in Glaucoma. Am J Ophthalmol 2016;166:29–36. [DOI] [PMC free article] [PubMed] [Google Scholar]
- 30.Sample PA, Girkin CA, Zangwill LM, et al. The African Descent and Glaucoma Evaluation Study (ADAGES): design and baseline data. Archives of ophthalmology (Chicago, Ill : 1960) 2009;127:1136–45. [DOI] [PMC free article] [PubMed] [Google Scholar]
- 31.Medeiros FA, Zangwill LM, Bowd C, Weinreb RN. Comparison of the GDx VCC scanning laser polarimeter, HRT II confocal scanning laser ophthalmoscope, and stratus OCT optical coherence tomograph for the detection of glaucoma. Archives of ophthalmology (Chicago, Ill : 1960) 2004;122:827–37. [DOI] [PubMed] [Google Scholar]
- 32.Sample PA, Medeiros FA, Racette L, et al. Identifying glaucomatous vision loss with visual-function-specific perimetry in the diagnostic innovations in glaucoma study. Invest Ophthalmol Vis Sci 2006;47:3381–9. [DOI] [PubMed] [Google Scholar]
- 33.Hodapp E, Parrish RK, Anderson DR. Clinical decisions in glaucoma: Mosby Incorporated, 1993. [Google Scholar]
- 34.Beckett LA, Tancredi DJ, Wilson RS. Multivariate longitudinal models for complex change processes. Statistics in medicine 2004;23:231–9. [DOI] [PubMed] [Google Scholar]
- 35.Robinson GK. That BLUP is a Good Thing: The Estimation of Random Effects. Statistical Science 1991;6:15–32. [Google Scholar]
- 36.Medeiros FA, Zangwill LM, Weinreb RN. Improved prediction of rates of visual field loss in glaucoma using empirical Bayes estimates of slopes of change. J Glaucoma 2012;21:147–54. [DOI] [PMC free article] [PubMed] [Google Scholar]
- 37.Gould R, Abramson I, Galasko D, Salmon D. Rate of cognitive change in Alzheimer’s disease: methodological approaches using random effects models. Journal of the International Neuropsychological Society : JINS 2001;7:813–24. [PubMed] [Google Scholar]
- 38.Katz J, Gilbert D, Quigley HA, Sommer A. Estimating progression of visual field loss in glaucoma. Ophthalmology 1997;104:1017–25. [DOI] [PubMed] [Google Scholar]
- 39.Gardiner SK, Mansberger SL, Demirel S. Detection of Functional Change Using Cluster Trend Analysis in Glaucoma. Invest Ophthalmol Vis Sci 2017;58:Bio180–bio190. [DOI] [PMC free article] [PubMed] [Google Scholar]
- 40.Nouri-Mahdavi K, Caprioli J, Coleman AL, Hoffman D, Gaasterland D. Pointwise linear regression for evaluation of visual field outcomes and comparison with the advanced glaucoma intervention study methods. Archives of ophthalmology (Chicago, Ill : 1960) 2005;123:193–9. [DOI] [PubMed] [Google Scholar]
- 41.McNaught AI, Crabb DP, Fitzke FW, Hitchings RA. Visual field progression: comparison of Humphrey Statpac2 and pointwise linear regression analysis. Graefe’s archive for clinical and experimental ophthalmology = Albrecht von Graefes Archiv fur klinische und experimentelle Ophthalmologie 1996;234:411–8. [DOI] [PubMed] [Google Scholar]
- 42.de Moraes CG, Song C, Liebmann JM, Simonson JL, Furlanetto RL, Ritch R. Defining 10-2 visual field progression criteria: exploratory and confirmatory factor analysis using pointwise linear regression. Ophthalmology 2014;121:741–9. [DOI] [PubMed] [Google Scholar]
- 43.Luce DA. Determining in vivo biomechanical properties of the cornea with an ocular response analyzer. Journal of cataract and refractive surgery 2005;31:156–62. [DOI] [PubMed] [Google Scholar]
- 44.Medeiros FA, Alencar LM, Zangwill LM, Sample PA, Weinreb RN. The Relationship between intraocular pressure and progressive retinal nerve fiber layer loss in glaucoma. Ophthalmology 2009;116:1125–33.e1–3. [DOI] [PMC free article] [PubMed] [Google Scholar]
- 45.Laird NM, Ware JH. Random-effects models for longitudinal data. Biometrics 1982;38:963–74. [PubMed] [Google Scholar]
- 46.Laird NM, Donnelly C, Ware JH. Longitudinal studies with continuous responses. Statistical methods in medical research 1992;1:225–47. [DOI] [PubMed] [Google Scholar]
- 47.Leske MC, Heijl A, Hussein M, Bengtsson B, Hyman L, Komaroff E. Factors for glaucoma progression and the effect of treatment: the early manifest glaucoma trial. Archives of ophthalmology (Chicago, Ill : 1960) 2003;121:48–56. [DOI] [PubMed] [Google Scholar]
- 48.Bengtsson B, Leske MC, Hyman L, Heijl A. Fluctuation of intraocular pressure and glaucoma progression in the early manifest glaucoma trial. Ophthalmology 2007;114:205–9. [DOI] [PubMed] [Google Scholar]
- 49.Budenz DL, Huecker JB, Gedde SJ, Gordon M, Kass M. Thirteen-Year Follow-up of Optic Disc Hemorrhages in the Ocular Hypertension Treatment Study. Am J Ophthalmol 2017;174:126–133. [DOI] [PMC free article] [PubMed] [Google Scholar]
- 50.Ernest PJ, Schouten JS, Beckers HJ, Hendrikse F, Prins MH, Webers CA. An evidence-based review of prognostic factors for glaucomatous visual field progression. Ophthalmology 2013;120:512–519. [DOI] [PubMed] [Google Scholar]
- 51.Heijl A, Leske MC, Bengtsson B, Hyman L, Bengtsson B, Hussein M. Reduction of intraocular pressure and glaucoma progression: results from the Early Manifest Glaucoma Trial. Archives of ophthalmology (Chicago, Ill : 1960) 2002;120:1268–79. [DOI] [PubMed] [Google Scholar]
- 52.Moghimi S, Zangwill LM, Penteado RC, et al. Macular and Optic Nerve Head Vessel Density and Progressive Retinal Nerve Fiber Layer Loss in Glaucoma. Ophthalmology 2018;125:1720–1728. [DOI] [PubMed] [Google Scholar]
- 53.Hood DC. Improving our understanding, and detection, of glaucomatous damage: An approach based upon optical coherence tomography (OCT). Prog Retin Eye Res 2017;57:46–75. [DOI] [PMC free article] [PubMed] [Google Scholar]
- 54.Wang M, Tichelaar J, Pasquale LR, et al. Characterization of Central Visual Field Loss in End-stage Glaucoma by Unsupervised Artificial Intelligence. JAMA ophthalmology 2020;138:190–198. [DOI] [PMC free article] [PubMed] [Google Scholar]
- 55.Wang M, Shen LQ, Pasquale LR, et al. Artificial Intelligence Classification of Central Visual Field Patterns in Glaucoma. Ophthalmology 2020;127:731–738. [DOI] [PMC free article] [PubMed] [Google Scholar]
- 56.Lanzagorta-Aresti A, Perez-Lopez M, Palacios-Pozo E, Davo-Cabrera J. Relationship between corneal hysteresis and lamina cribrosa displacement after medical reduction of intraocular pressure. Br J Ophthalmol 2017;101:290–294. [DOI] [PMC free article] [PubMed] [Google Scholar]
- 57.Fazio MA, Johnstone JK, Smith B, Wang L, Girkin CA. Displacement of the Lamina Cribrosa in Response to Acute Intraocular Pressure Elevation in Normal Individuals of African and European Descent. Invest Ophthalmol Vis Sci 2016;57:3331–9. [DOI] [PMC free article] [PubMed] [Google Scholar]
- 58.Zhang L, Albon J, Jones H, et al. Collagen microstructural factors influencing optic nerve head biomechanics. Invest Ophthalmol Vis Sci 2015;56:2031–42. [DOI] [PubMed] [Google Scholar]
- 59.Sigal IA, Flanagan JG, Ethier CR. Factors influencing optic nerve head biomechanics. Invest Ophthalmol Vis Sci 2005;46:4189–99. [DOI] [PubMed] [Google Scholar]
- 60.Johnson CS, Mian SI, Moroi S, Epstein D, Izatt J, Afshari NA. Role of corneal elasticity in damping of intraocular pressure. Invest Ophthalmol Vis Sci 2007;48:2540–4. [DOI] [PubMed] [Google Scholar]
- 61.Burgoyne CF, Downs JC, Bellezza AJ, Suh JK, Hart RT. The optic nerve head as a biomechanical structure: a new paradigm for understanding the role of IOP-related stress and strain in the pathophysiology of glaucomatous optic nerve head damage. Prog Retin Eye Res 2005;24:39–73. [DOI] [PubMed] [Google Scholar]
- 62.Medeiros FA, Weinreb RN. Evaluation of the influence of corneal biomechanical properties on intraocular pressure measurements using the ocular response analyzer. J Glaucoma 2006;15:364–70. [DOI] [PubMed] [Google Scholar]
- 63.Liu J, Roberts CJ. Influence of corneal biomechanical properties on intraocular pressure measurement: quantitative analysis. Journal of cataract and refractive surgery 2005;31:146–55. [DOI] [PubMed] [Google Scholar]
- 64.Adamsons I Irreversible corneal decompensation in patients treated with topical dorzolamide. Am J Ophthalmol 1999;128:774–6. [DOI] [PubMed] [Google Scholar]
- 65.Konowal A, Morrison JC, Brown SV, et al. Irreversible corneal decompensation in patients treated with topical dorzolamide. Am J Ophthalmol 1999;127:403–6. [DOI] [PubMed] [Google Scholar]
- 66.Teus MA, Bolívar G, Alió JL, Lipshitz I. Short-term effect of topical dorzolamide hydrochloride on intrastromal corneal pressure in rabbit corneas in vivo. Cornea 2009;28:206–10. [DOI] [PubMed] [Google Scholar]
- 67.Bolívar G, Sánchez-Barahona C, Teus M, et al. Effect of topical prostaglandin analogues on corneal hysteresis. Acta Ophthalmol 2015;93:e495–8. [DOI] [PubMed] [Google Scholar]
- 68.Lindsey JD, Crowston JG, Tran A, Morris C, Weinreb RN. Direct matrix metalloproteinase enhancement of transscleral permeability. Invest Ophthalmol Vis Sci 2007;48:752–5. [DOI] [PubMed] [Google Scholar]
- 69.Honda N, Miyai T, Nejima R, et al. Effect of latanoprost on the expression of matrix metalloproteinases and tissue inhibitor of metalloproteinase 1 on the ocular surface. Archives of ophthalmology (Chicago, Ill : 1960) 2010;128:466–71. [DOI] [PubMed] [Google Scholar]
- 70.Weinreb RN, Kashiwagi K, Kashiwagi F, Tsukahara S, Lindsey JD. Prostaglandins increase matrix metalloproteinase release from human ciliary smooth muscle cells. Invest Ophthalmol Vis Sci 1997;38:2772–80. [PubMed] [Google Scholar]
- 71.Gaton DD, Sagara T, Lindsey JD, Gabelt BT, Kaufman PL, Weinreb RN. Increased matrix metalloproteinases 1, 2, and 3 in the monkey uveoscleral outflow pathway after topical prostaglandin F(2 alpha)-isopropyl ester treatment. Archives of ophthalmology (Chicago, Ill : 1960) 2001;119:1165–70. [DOI] [PubMed] [Google Scholar]
- 72.Wierzbowska J, Stankiewicz A. [Topical prostaglandins influence over cornea--preliminary report]. Klinika oczna 2006;108:479–81. [PubMed] [Google Scholar]
Associated Data
This section collects any data citations, data availability statements, or supplementary materials included in this article.