

Abstract
Dietary polyphenols interact with glucose transporters in the small intestine and modulate glucose uptake after food or beverage consumption. This review assesses the transporter interaction in vitro and how this translates to an effect in healthy volunteers consuming glucose. As examples, the apple polyphenol phlorizin inhibits sodium‐glucose linked transporter‐1; in the intestinal lumen, it is converted to phloretin, a strong inhibitor of glucose transporter‐2 (GLUT2), by the brush border digestive enzyme lactase. Consequently, an apple extract rich in phlorizin attenuates blood glucose and insulin in healthy volunteers after a glucose challenge. On the other hand, the olive phenolic, oleuropein, inhibits GLUT2, but the strength of the inhibition is not enough to modulate blood glucose after a glucose challenge in healthy volunteers. Multiple metabolic effects and oxidative stresses after glucose consumption include insulin, incretin hormones, fatty acids, amino acids, and protein markers. However, apart from acute postprandial effects on glucose, insulin, and some incretin hormones, very little is known about the acute effects of polyphenols on these glucose‐induced secondary effects. In summary, attenuation of the effect of a glucose challenge in vivo is only observed when polyphenols are strong inhibitors of glucose transporters.
Keywords: dihydrochalcone, flavonoid, insulin, OGTT, post prandial, sugar
Certain dietary polyphenols inhibit glucose uptake in the gut, leading to blunted blood glucose spikes after a high sugar meal. Certain polyphenols inhibit glucose transporters in the gut. Strong inhibition of glucose transporters leads to blunted blood glucose spikes.

1. Response to Glucose Consumption
Glucose is the main energy source for life and undergoes numerous metabolic processes, especially glycolysis, to generate energy for the cell. Many foods contain large amounts of glucose in the form of starch or sucrose, which are digested to glucose before absorption in the small intestine. However, a diet which is habitually too high in carbohydrates and sugars can lead to increased risk of development of type 2 diabetes, partly due to postprandial glucose spikes which lead to metabolic stress and ultimately dysregulation of glucose metabolism. The body's metabolic flexibility and ability to deal with stress can be assessed by giving a large dose of glucose, and determining if the responses are within the normal range. The oral glucose tolerance test (OGTT) was developed, and is used, primarily as a way to diagnose diabetes.[ 1 ] The response to a single dose of glucose, normally 75 g, measured as glucose in the blood over 2–3 h, is employed to assess insulin sensitivity and resistance. Given that it is so widely used, the OGTT has also been exploited as a common research tool to assess the effect of additional factors on the response to glucose, providing a convenient way to compare between published data, since the test was standardized in 1968 and is consistent between labs.[ 2 , 3 ] Although insulin resistance can be assessed using fasting blood glucose and insulin, giving the diagnostic readouts such as Homeostatic Model Assessment for Insulin Resistance (HOMA‐IR), Homeostatic Model Assessment‐β (HOMA‐β), the sensitivity can be enhanced by combining the measurements with an OGTT. The resulting value is termed the Matsuda index and combines the assessment power of both fasting measurements and postprandial response estimation.[ 4 ] Other methods to assess insulin resistance are used, such as the gold standard hyperinsulinemic‐euglycemic clamp technique,[ 5 ] but this is technically much more difficult to carry out and so is not performed on a routine basis.
This review reports data which have exploited the OGTT as a way of measuring glucose responses in healthy or metabolically‐compromised individuals in a standardized way, rather than as a tool to assess the presence of diabetes, and in particular assesses the acute effects of polyphenols on the response to glucose through the OGTT. Responses to other sugars, such as fructose and sucrose, and to endogenous sugars present in foods, are beyond the scope of this review. Further, only effects on human cells or human transporters, and interventions on humans, are considered here.
2. Assessment of the Metabolic Changes and Responses to a Single Glucose Dose
In metabolically healthy people with no insulin resistance, when 75 g glucose in water is consumed, glucose peaks in the first hour. Insulin is also commonly measured, and reaches a maximum around 1 h, and then slowly declines. However, many other parameters also change within a few hours as outlined below, both as a direct consequence of an increased substrate (glucose) or as a response to the changes.
2.1. Metabolic Changes Induced by Glucose Consumption
The ingestion of 75 g glucose causes a surprisingly large and diverse transient change in many metabolites, lipids, and stress markers. The changes reported from multiple papers are summarized in Figures 1 and 2 . The data from the original papers have been normalized to a fold‐change from the baseline value.
Figure 1.
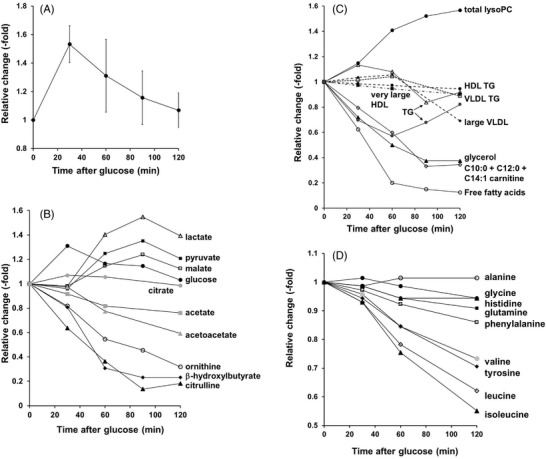
Changes in metabolic parameters after an OGTT (75 g glucose) in healthy volunteers. Panel A). Mean of glucose changes from refs. [7, 14, 49, 50, 51]. Panel B). Glucose (●); ornithine (○); β‐hydroxybutyrate (♦); citrulline (▲); pyruvate (■); malate (□); (◊); lactate (∆); citrate (●); acetate (■); acetoacetate (▲). Data replotted from refs. [51, 52]. Panel C): Total lysoPC (●); total free fatty acids (○); large VLDL (very low‐density lipoprotein) (♦); glycerol (▲); very large HDL (■); VLDL TG (very low‐density lipoprotein triglycerides) (□); C10:0 + C12:0 + C14:1 carnitine (◊); HDL TG (high‐density lipoprotein triglycerides) (●, dotted line); the two lines for triglycerides (TG) are derived from two separate publications ([7] (∆);[ 52 ] (●)). Data replotted from refs. [7, 14, 51, 52]. Panel D). Glycine (●); alanine (○); tyrosine (♦); isoleucine (▲); glutamine (■); phenylalanine (□); leucine (◊); valine (●); histidine, (∆). Data replotted from ref. [52].
Figure 2.
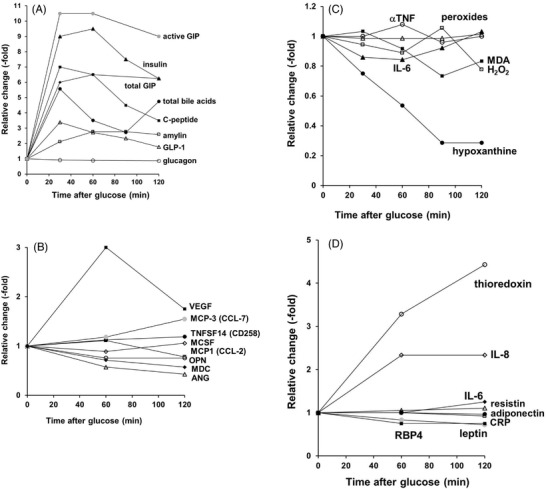
Changes in markers and hormones after an OGTT (75 g glucose) in healthy volunteers. Panel A). Total bile acids (●); glucagon, no significant changes (○); total GIP (♦); insulin (▲); C‐peptide (■); amylin (□); GLP‐1 (∆); active GIP (●). Data replotted from refs. [49, 50, 53, 54, 55]. Panel B). A significant change is seen in at least one time point for TNFSF14 (“LIGHT,” tumor necrosis factor superfamily member 14) (●); osteopontin (○); MDC (CCL‐22, chemokine (C‐C motif) ligand 22) (♦); VEGF (vascular endothelial growth factor) (■); ANG (angiotensin) (∆); MCP3 (CCL‐7, chemokine (C‐C motif) ligand 7) (●). No significant changes are seen in MCP1 (CCL‐2, chemokine (C‐C motif) ligand 2) (□) and MCSF (macrophage colony stimulating factor) (◊); data replotted from ref. [52]. Panel C). A significant change is seen in at least one time point for hypoxanthine (●); IL‐6 (▲); peroxides (∆). No significant changes are seen in H2O2 (□); MDA (■); α‐TNF (○); data replotted from refs. [7, 16]. Panel D). A significant change is seen in at least one time point for CRP (□); IL‐8 (◊); thioredoxin (○); RBP4 (retinol binding protein 4) (■); leptin (●). No significant changes are seen in IL‐6 (♦); resistin (∆); adiponectin (●). Data replotted from ref. [17].
The diversity of the changes observed is striking in complexity, and includes blood lipids, amino acids, energy markers, stress markers, incretin hormones, and multiple proteins. It would be expected that any factors which modify the glucose uptake would also have a knock‐on effect on these other markers, but this has only been examined for a limited number of markers. Similarly very few studies have measured the effect of different doses of glucose on multiple parameters, which is comparable to the effect of glucose transport inhibitors. When glucose was given to healthy, lean volunteers at four doses (25, 50, 100, and 200 g), the insulin produced increased with increasing dose, and time to return to baseline was also increased, but even with the highest dose, insulin returned to baseline after 6 h. The blood insulin area under the curve was approximately linearly proportional to glucose dose, but the blood glucose area under the curve was not.[ 6 ] The glucose AUCs were not different for 75 and 150 g glucose doses, nor were malondialdehyde (MDA), hydrogen peroxide or triglycerides.[ 7 ] These data suggest that post‐prandial insulin is a more sensitive marker of changes in the response to glucose compared to glucose itself. Insulin secretion from the β‐cells of the pancreas into circulation in response to a raise in blood glucose leads to rapid uptake of glucose from the blood into tissues, especially adipose and muscle, via insulin‐stimulated translocation of the glucose transporter (GLUT)4 to the cell surface.[ 8 ]
Post‐prandial effects after glucose consumption can arise from the activity of the glucose itself on tissues and from the numerous effects of insulin, as well as the activities of other hormones released after a glucose dose. In addition to insulin, C‐peptide, total glucose‐dependent insulinotropic polypeptide (GIP), active GIP, glucagon‐like peptide (GLP)‐1 and amylin transiently increase, typically peaking within 1 h in healthy individuals (Figure 2). As a result of transiently increased glycolysis in tissues through increased blood glucose and insulin, lactate, malate and pyruvate increase, peaking between 1 and 2 h. Insulin also inhibits lipolysis, ketogenesis, and proteolysis, with consequent decreases of free amino acids, free fatty acids, and β‐hydroxybutyrate, with dramatic decreases in some fatty acids and amino acids (Figure 1, and references therein).
2.2. Indirect Responses Induced by Glucose Consumption
A high concentration of blood glucose produces biochemical responses in cells, in addition to an expected increase in substrate flow through glycolysis. Increased oxidative stress is generated acutely at high glucose concentrations at least partly through NADPH oxidase,[ 9 , 10 ] since an NADPH oxidase inhibitor attenuated ROS production by glucose in endothelial cells.[ 11 ] High glucose also causes hyperpolarization of the mitochondrial membrane and induces superoxide production by the mitochondrial electron transport chain[ 12 ] together with increased flux of glucose through the tricarboxylic acid cycle.[ 13 ] It therefore might be expected that a high postprandial glucose concentration would also lead to oxidative stress in cells and tissues, especially the vascular system which is in closest contact with the increased glucose, and so will be affected most readily. In support of this mechanism, an OGTT leads to temporary endothelial dysfunction and diminished NO production, as seen by a transient reduction in flow mediated dilation (FMD).[ 14 ] Direct infusion of glucose also induces endothelial dysfunction, as assessed by FMD,[ 15 ] demonstrating direct glucose dependence.
After an OGTT, peroxides were not significantly changed,[ 16 ] hydrogen peroxide and MDA (a marker of lipid peroxidation) were unchanged,[ 7 ] although in some reports, MDA was transiently increased.[ 14 ] Thioredoxin in plasma was markedly increased in response to an OGTT,[ 17 ] and this redox active protein is increased during stress.[ 18 ] High blood glucose with suppressed insulin production led to modification of multiple pathways through gene expression in adipose and muscle tissues in healthy volunteers. The induction of metallothionein family genes, important in detoxification and scavenging of free radicals, was consistent with generation of oxidative stress.[ 19 ]
In general, inflammatory markers were unaffected by an OGTT, and although some publications report a small increase in a few markers, others even report a decrease. There were no increases in interleukin (IL)‐1β, IL‐6, IL‐8, IL‐10, IL‐12p70, and tumor necrosis factor (α‐TNF)[ 20 , 21 ] in response to an OGTT. There was a small decrease in C‐reactive protein (CRP)[ 17 ] or IL‐6,[ 16 ] or, in other studies, no change in IL‐6[ 17 ] but a small increase in IL‐8.[ 17 ] Several other inflammatory markers were also unaffected. There was no change in CCL‐2 (also called monocyte chemoattractant protein 1 [MCP1]), which recruits leukocytes to sites of inflammation, although there was a small increase in the related CCL‐7 at 2 h.[ 17 ] There was no change in osteopontin, which promotes cell‐mediated immune responses, nor in macrophage colony‐stimulating factor (MCSF) which stimulates stem cells to differentiate into macrophages as a defence mechanism.[ 17 ] There was a decrease in CCL‐22 and angiotensin, and a small increase in CD258.[ 17 ] In summary, it seems that there is no real inflammatory response to an OGTT, although individual molecules involved in some inflammatory processes may show small increases or decreases, depending on the study.
The effect of polyphenols on sucrose and starch containing foods, rather than pure glucose, has been reviewed and is beyond the scope of this review.[ 22 ]
2.3. How can the Response to Glucose Consumption be Affected Acutely?
It is evident based on the mechanism of action that one of the most effective ways to modify the response to glucose during an OGTT would be to delay, blunt, or inhibit the intestinal uptake of glucose. The main routes of glucose uptake are though intestinal brush border transporters, mainly sodium‐glucose linked transporter (SGLT)1 (SLC5A1)[ 23 ] and GLUT2 (SLC2A2),[ 24 ] discussed in more detail below. The steps involved in glucose absorption and linked responses are shown in Figure 3 . Uptake of glucose can be modified by acute inhibition of glucose transporters by components consumed at the same time as the glucose. In this respect, it is interesting to note that the drug acarbose, a potent inhibitor of human starch digestive enzymes such as α‐amylase and α‐glucosidases, does not affect glucose transport[ 25 ] and therefore does not affect the response to an OGTT,[ 26 ] despite being highly effective at lowering postprandial glucose spikes in response to starch ingestion.[ 27 ] In addition to acute inhibition by direct inhibitor binding, SGLT1 can be regulated in the short term (i.e., within the window of an OGTT) by numerous factors, although most experiments on this mechanism have been done on animal models. For example, SGLT1 glucose uptake was rapidly upregulated by glucagon or GLP‐2, but downregulated by cholecystokinin. Insulin and the hunger‐inhibiting hormone, leptin, also regulated SGLT1.[ 28 ] Further, GLUT2 is thought to be recruited to the brush border membrane, and therefore activated, by high glucose concentrations.[ 29 ]
Figure 3.
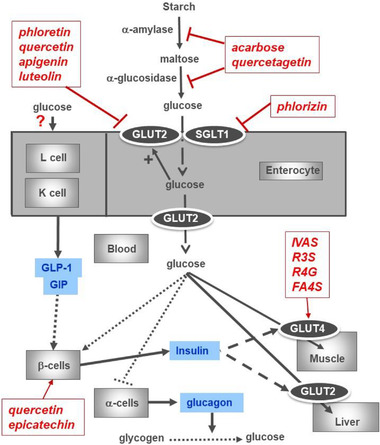
Diagrammatic representation of the pathways involved in glucose absorption and distribution, and some examples of inhibitors. Example inhibitors of α‐amylase and of α‐glucosidase are from refs. [56, 57]. Example inhibitors of GLUT2 and of SGLT1 are from Table 1. Proposed steps where polyphenols may affect glucose distribution are shown with red arrows, and response hormones are shown in blue. Effect of some metabolites of polyphenols on glucose transport into human muscle cells[ 58 ] is shown (IVAS, isovanillic acid sulfate, a microbial metabolite of anthocyanins; R3S, resveratrol‐3‐sulfate and R4G, resveratrol‐4‐glucuronides, conjugates of resveratrol found in the blood after resveratrol consumption; FA4S, ferulic acid‐4‐sulfate, conjugate of ferulic acid found in blood after, e.g., coffee consumption). Quercetin and EC are shown as two examples of polyphenols that affect pancreatic β‐cells.[ 59 , 60 ]. The polyphenols and metabolites shown are examples, and the lists are not exhaustive.
The focus of this review is on effects of polyphenols on glucose transporters rather than the other steps (Figure 3), since the other steps have been reviewed.[ 30 ] For example, polyphenols and metabolites can affect modification of cellular responses to insulin, such as muscle, adipose and liver, stimulate insulin secretion and reduce hepatic glucose output, enhance insulin‐dependent glucose uptake, activate adenosine monophosphate‐activated protein kinase (AMPK), modify the microbiome and have anti‐inflammatory effects.[ 31 ] It is unlikely that changes in gene expression of glucose transporters would affect the acute modulation of the response to an OGTT since the effect is over within hours. However, phosphorylation events could play a role since they occur rapidly within minutes. Typically these events are critical for insulin action, such as Akt phosphorylation,[ 32 ] which is impaired in insulin resistance.
3. What are Polyphenols?
Polyphenols are a chemically diverse group of compounds that are found in all plants. In dietary terms, all plant‐derived foods contain polyphenols, but the type and amount depend on plant source, growing conditions, variety and processing, and storage. The distribution in plants and foods,[ 33 , 34 , 35 , 36 ] bioavailability,[ 37 ] nomenclature,[ 38 , 39 ] and biological effects[ 40 , 41 ] have been reviewed extensively. The main classes of dietary polyphenols are flavanols, isoflavones, flavones, flavanones, phenolics, anthocyanins, dihydrochalcones, ellagitannins and flavonols, and some examples are shown in Table 1 . A description of all of the classes, absorption and biological activities is beyond the scope of this review, but it should be noted that individual polyphenols have different biological activities, mostly independent of their chemical antioxidant activities.[ 42 ]
Table 1.
Selected studies showing inhibition of glucose transporters by polyphenols
| SGLT1 expressed in oocytes | GLUT2 expressed in oocytes or glucose transport across Caco‐2 in sodium‐free medium | Glucose transport across Caco‐2 (GLUT2 and SGLT1) in sodium‐containing medium | |||
|---|---|---|---|---|---|
| IC50 (µM) or % inhibition | IC50 (µM) or % inhibition | IC50 (µM) or % inhibition | |||
| Drugs | Sotagliflozin | 0.036 | [44] | ||
| Cytochalasin A | No inhibition | 1 | [28, 61] | ||
| Flavanols | Catechin | No inhibition | [62] | ||
| Epigallocatechin gallate | 72 | [63] | |||
| Epicatechin | No inhibition | No inhibition | [62, 64] | ||
| Isoflavones | Daidzein | No inhibition | [62] | ||
| Genistein | >300 | [62] | |||
| Flavones | Apigenin | 27; 65.7 a) | 29 | [62, 63, 65] | |
| Apigenin‐7‐O‐glucoside | 100 | [65] | |||
| Luteolin | 30.4 | [62] | |||
| Flavanones |
Hesperidin Hesperetin |
500 48.6 |
[62, 66] | ||
| Naringenin | >300; no inhibition | No inhibition | [62, 67] | ||
| Naringin | No inhibition | [62] | |||
| Neohesperidin | No inhibition | ≈50% at 100 µM | [67] | ||
| Phenolics | Oleuropein | ≈50% at 37 µM | ≈50% at 740 µM | [68] | |
| Chlorogenic acid b) | No inhibition | [47] | |||
| Ellagic acid | No inhibition | [69] | |||
| p‐coumaric acid | No inhibition | [64] | |||
| 5‐caffeoyl quinic acid | 2571 | [64] | |||
| Arbutin | No inhibition | No inhibition | [67] | ||
| Anthocyanins | Pelargonidin‐3‐O‐glucoside | 802 | [64] | ||
| Cyanidin | No inhibition | [62] | |||
| Delphinidin | No inhibition | [62] | |||
| Dihydrochalcones | Phloretin | 340; no inhibition | 90–100% at 100 µM | 146; ≈50% at 100 µM (uptake only) | [47, 62, 63] |
| Phlorizin | 0.46; 80% at 100 µM | No inhibition | [47, 62, 64, 67] | ||
| Ellagitannins | Punicalagin | No inhibition | [69] | ||
| Punicalin | No inhibition | [69] | |||
| Flavonols | Quercetin | No inhibition | 7; 12.7 a) | [47, 62, 63] | |
| Quercetin‐3‐O‐rhamnoside | 31 | [64] | |||
| Quercetin‐3‐O‐rutinoside | No inhibition | No inhibition | [62, 67] | ||
| Quercetin‐4'‐O‐glucoside | No inhibition | 103 | [62] | ||
| Quercetin‐3‐O‐glucoside | No inhibition | 64.1 | [62] | ||
| Kaempferol | No inhibition | [47] | |||
| Myricetin | 17.2 | [62] | |||
| Fisetin | 47.2 | [62] | |||
| Gossypetin | No inhibition | [62] | |||
| Gossypin | No inhibition | [62] |
Where two values are shown separated by a semicolon, these are derived from two publications;
Exact isomers not stated;
If no IC50 value is given in the publication, then percent inhibition at a given concentration is presented instead.
4. Acute Effect of Polyphenols on the Effects of Glucose Consumption
Consumption of a glucose bolus has several different metabolic consequences and induced stresses, to which a healthy organism is well equipped to respond. However, repeated consumption of high‐glucose containing foods is a risk factor for insulin resistance and type 2 diabetes, owing to repeated blood glucose spikes and oxidative stress after a meal. Some dietary components have been shown to blunt these glucose spikes acutely, leading to long term beneficial effects. The acute effects of polyphenols and polyphenol‐rich foods, supplements and beverages on the OGTT are considered, when the test material is consumed at the same time or within a short period of time. One of the primary mechanisms is inhibition of the glucose transporters in the small intestine, slowing down the rate of glucose absorption, blunting the glucose spikes, leading to altered insulin secretion and potentially affecting many of the other effects discussed above.
The assessment of interaction of polyphenols with glucose transporters is normally measured in vitro, using transporters expressed in oocytes, or using intact cells such as differentiated intestinal Caco‐2 cells. The presence or absence of sodium can be used as a tool to assess the contributions of different transporters since SGLT1 is sodium‐dependent but GLUT2 is not. Once the strength of the interaction between the polyphenols and the transporter has been assessed, this can be tested in vivo in volunteers.
4.1. Interactions of Polyphenols with Glucose Transporters SGLT1/SGLT2
SGLT1 is located on the brush border of the small intestine and transports D‐glucose, together with two sodium ions, from the intestinal lumen to the interior of the enterocyte, using a sodium gradient generated by (Na+/K+)‐ATPase (Figure 3). SGLT1 is a relatively high affinity and specific transporter, with a K m for glucose of 0.5 mM, whereas fructose is not transported. It is the main glucose absorber in the intestine, especially at low glucose concentrations. The transport by SGLT1 has been typically studied using intestinal tissue or differentiated intestinal cells in the presence and absence of sodium, or SGLT1 expressed in oocytes.
The related transporter SGLT2 (SLC5A2) is not found in the intestine, but is prevalent in the kidney, where it reabsorbs glucose back into the circulation. Diabetes‐managing drugs prevent the kidneys from absorbing glucose back into the blood; examples are dapagliflozin, canagliflozin, and empagliflozin, leading to excretion of glucose in the urine. The drug sotagliflozin strongly inhibits SGLT2 with IC50 of 1.8 nM and a long half‐life (29 h); a dose of 400 mg leads to excretion of 71 g glucose.[ 43 ] Sotagliflozin also inhibits SGLT1 (Table 1) with IC50 value of 36 nM.[ 44 ] Many of these inhibitors have been developed based on molecular shape similarity to phlorizin, a polyphenol found in apples (Figure 4 ). Drugs which are SGLT1 and 2 inhibitors exhibit some beneficial longer term properties such as lowering HbA1c and body weight, reduced cardiovascular events, and blood pressure, but also show some undesirable effects which include increasing the risk of bone fractures, diabetic ketoacidosis, and infections of the urinary tract. In a large cohort, sotaglifozin consistently lowered HbA1c in blood in a dose‐dependent manner, lowered fasting plasma glucose, and lowered 2‐h postprandial glucose.[ 45 ] Polyphenols which interact with SGLT1 are shown in Table 1. Dihydrochalcones such as phlorizin show strong inhibition of SGLT1 and GLUT2, sufficient to demonstrate an effect in vivo. Chlorogenic acid and flavonols show no inhibition of SGLT1.
Figure 4.
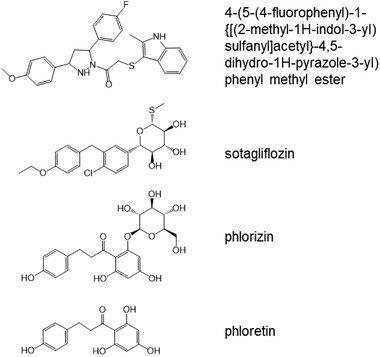
Chemical structure of SGLT1 and GLUT2 inhibitors. Sotagliflozin and phlorizin are molecules with similar shapes and key substitutions, allowing binding to key amino acids at the active site of SGLT1. Phloretin is the aglycone form of phlorizin, and is a relatively strong inhibitor of GLUT2. One of the strongest inhibitors of GLUT2 ((4‐(5‐(4‐fluorophenyl)‐1‐{[(2‐methyl‐1H‐indol‐3‐yl)sulfanyl]acetyl}‐4,5‐dihydro‐1H‐pyrazole‐3‐yl) phenylmethylester) is not related structurally to phloretin or other polyphenols.
4.2. Interactions of Polyphenols with Glucose Transporters GLUT2
GLUT2 (SLC2A2) transports glucose with K m = 17 mM, and high glucose concentrations cause relocation of GLUT2 to the brush border membrane, an activation step.[ 28 ] GLUT2 is thought to be most relevant at high glucose concentrations in the gut lumen,[ 24 , 29 ] as high glucose concentrations in the gut lumen stimulate translocation of the transporter to the brush border membranes, activating the absorption process to deal with the high concentration. Both SGLT1 and GLUT2 are involved in glucose dependent secretion of GLP‐1 and GIP. In humans, when SGLT1 was inhibited, secretion of GLP‐1 and GIP was decreased during an OGTT.[ 46 ]
Some flavonols and flavones show fairly strong inhibition of GLUT2. Flavanone aglycones show inhibition of GLUT2, but there is no effect of flavanone glycosides. Phenolics, anthocyanins, and ellagitannins show only weak inhibition of sugar transporters. Phlorizin is a strong inhibitor of SGLT1 (IC50 of 460 nM), but is hydrolyzed in the small intestine by lactase phlorizin hydrolase, leading to phloretin, a much weaker (800‐fold) inhibitor of SGLT1 (IC50 of 340,000 nM), but a strong inhibitor of GLUT2.[ 47 ] The most potent drug inhibitor of GLUT2 so far reported (4‐(5‐(4‐fluorophenyl)‐1‐{[(2‐methyl‐1H‐indol‐3‐yl)sulfanyl]acetyl}‐4,5‐dihydro‐1H‐pyrazole‐3‐yl) phenylmethylester) bears no structural or shape relationship to a polyphenol[ 48 ] (Figure 4). Oleuropein inhibits GLUT2 but the strength of the interaction is not enough to affect OGTT in human intervention studies (see Section 5).
5. Translation of an Acute In Vitro Effect on Transporters to Effects in Volunteers
Human intervention studies exploring the acute effect of polyphenol‐rich extracts and foods on a glucose challenge are shown in Table 2 . Apple extract and unripe apple extract gave a decrease in postprandial glucose and insulin, presumably owing to the phlorizin content. Pandan, cinnamon tea, and green tea all gave a decrease in blood glucose at some time points. No change was seen for grape/pomegranate, and no or weak effect of isoflavones and flavanols. This is consistent with the results for pomegranate on bread, where the action of the pomegranate polyphenols was on α‐amylase and starch rather than glucose transport. Enzogenol, a new Zealand pine bark extract, gave a decrease in glucose AUC but only in a subset of volunteers who displayed a monophasic response to postprandial glucose. Although consumption of coffee is protective against the development of type 2 diabetes, most acute studies on coffee with a glucose challenge show an increase in either glucose, insulin, or both; in studies where it was measured, GIP either does not increase or is attenuated. On the other hand, chlorogenic acid showed a modest decrease in postprandial glucose and insulin.
Table 2.
Human studies showing the acute effects of polyphenols on metabolic changes following glucose consumption
| Treatment | Amount (g unless otherwise stated) | Number of volunteers | Glucose [g] | Parameters measured | Effects (p < 0.05) | Ref. |
|---|---|---|---|---|---|---|
| Polyphenol‐rich chocolate 15 min before OGTT | 635 mg cocoa polyphenols | 48 healthy | 50 | Blood glucose, insulin, free fatty acid, glucagon, and GLP‐1 | ↓ plasma glucose at 120 min; ↑ postprandial serum insulin and plasma GLP‐1 concentration and iAUC 15–180 min | [70] |
| Grape/pomegranate pomace dietary supplement | 10 | 20 with abdominal obesity | 75 | Blood glucose and insulin | No change | [71] |
| Enzogenol a) | 0.05 | 25 healthy | 75 | Glucose | ↓ iAUC in monophasic group but not in multiphasic group | [72] |
| Enzogenol a) | 0.4 | 25 healthy | 75 | Glucose | ↓ iAUC in monophasic group but not in multiphasic group | [72] |
| Apple extract | 2.8 g 30 min before glucose | 10 healthy lean men | 75 | Glucose and insulin | ↓ plasma glucose and insulin | [47] |
| Unripe apple preparation | 25 g apple preparation (315 mg phlorizin) | 6 healthy | 50 | Glucose | ↓ glucose at 15 and 30 min, ↑ glucose at 120 min, ↑ urinary glucose b) | [73] |
| Pandanus amaryllifolius Roxb. leaf extract | 30 g leaf powder in 300 mL water (15 min after OGTT) | 30 healthy | 75 | Glucose | ↓ peak blood glucose | [74] |
| Cinnamon tea | 6 g cinnamon sticks soaked in 100 mL water | 30 healthy adults | 75 | Glucose | ↓ peak blood glucose but not AUC | [75] |
| Green tea | 1.5 g/150 mL water | 22 healthy | 75 | Glucose | ↓ blood glucose, 30 and 120 min | [76] |
| Oleuropein | 50 mg oleuropein in 200 mL | 10 healthy volunteers | 50 | Glucose | No change | [68] |
| Chlorogenic acid | 1 | 15 over‐weight men | 75 | Glucose and insulin | ↓ glucose and insulin at 15 min | [77] |
| Coffee | 300 mg caffeine, 30 min before OGTT | 29 healthy | 75 | Blood glucose and insulin | ↑ blood glucose and insulin | [78] |
| Espresso coffee | double shot 1 h before OGTT | 18 with T2D | 75 | Glucose and insulin | ↑ in glucose AUC | [79] |
| Dark roast coffee | Coffee consumed 30 min before OGTT | 11 healthy | 75 | Glucose and insulin | ↑ in insulin AUC | [80] |
| Light roast coffee | Coffee consumed 30 min before OGTT | 11 healthy | 75 | Glucose and insulin | No change | [80] |
| Decaffeinated coffee | 500–600 mL drip filtered coffee 1 h before OGTT | 11 young men | 75 | Glucose, GIP and insulin | ↑ glucose at 10 and 30 min, and insulin at 10, 30, and 60 min, no change GIP | [81] |
| Coffee | 500–600 mL drip filtered coffee (6 mg caffeine/kg body wt) 1 h before OGTT | 11 young men | 75 | glucose, GIP and insulin | ↑ glucose at 10 and 30 min, and insulin at 10, 30, and 60 min, no change GIP | [81] |
| Decaffeinated coffee | 12 | 15 over‐weight men | 75 | Glucose and insulin | No effect (trend for ↓ insulin at 15 min) | [77] |
| Coffee | 2.5 mM CQA (400 mL) | 9 healthy volunteers | 25 | Glucose, insulin, GIP, GLP‐1 | Decrease in GIP, small increase in glucose and insulin | [82] |
| Decaffeinated coffee | 2.5 mM CQA (400 mL) | 9 healthy volunteers | 25 | Glucose, insulin, GIP, GLP‐1 | Decrease in GIP | [82] |
New Zealand pine bark extract;
Individuals with higher phloretin in urine correlated with higher glucose in urine.
6. Conclusions
Several polyphenols have been shown to inhibit glucose transporters in the small intestine, with varying efficacy. When consumed acutely with glucose, this can lead to a blunting of the postprandial blood glucose spikes; phlorizin from apples is potent in this respect. Some drugs are more effective glucose transport inhibitors, but strong inhibition can lead to side effects, making polyphenols ideal candidates to exhibit a mild but significant activity, with benefits chronically but without any side effects. However, affecting a high dose of glucose with a few milligrams of naturally‐occurring polyphenol is a challenge. In habitual diets, the amount of glucose in a meal is much lower than 75 g, and in this situation it is possible that polyphenols could have a more pronounced effect. There is a need for studies where different amounts of glucose are given with a constant polyphenol dose, to determine if the effect is greater when the sugar dose is small. This would represent more closely the situation in the regular diet where glucose is present in lower quantities than used in an OGTT. This review has focused on the use of glucose in vivo to assess the effect of polyphenols on glucose transporters. The habitual diet contains mostly sucrose and starch, which need to be pre‐digested to form glucose, which is then absorbed. This means that the effects of polyphenols on α‐amylase and α‐glucosidases also need to be considered when examining the glycemic responses of whole food.
Conflict of Interest
The author declares no conflict of interest.
Acknowledgements
Open access publishing facilitated by Monash University, as part of the Wiley – Monash University agreement via the Council of Australian University Librarians.
[Correction added on 9 May 2022, after first online publication: CAUL funding statement has been added.]
Biography
Gary Williamson is Professor and Head of Department of Nutrition, Dietetics and Food, Monash University, Australia, and was previously Professor and Chair of Functional Food, School of Food Science and Nutrition, University of Leeds, UK. A highly cited author (Scopus h‐index of 100, Google scholar h‐index 117) with extensive experience in international research in academic, institute and industrial environments. Research focuses on the link between dietary components (especially polyphenols) and carbohydrate/energy metabolism.

Mena P., Crozier A., Williamson G., Effects of Polyphenols on Glucose‐Induced Metabolic Changes in Healthy Human Subjects and on Glucose Transporters. Mol. Nutr. Food Res. 2022, 66, 2101113. 10.1002/mnfr.202101113
References
- 1. Melchionda N., Forlani G., Marchesini G., Baraldi L., Natale S., Int. J. Obes. Relat. Metab. Disord. 2002, 26, 90. [DOI] [PubMed] [Google Scholar]
- 2. Standardization of the oral glucose tolerance test, Diabetes 1969, 18, 299. [DOI] [PubMed] [Google Scholar]
- 3. Bartoli E., Fra G. P., Carnevale Schianca P. G., Eur. J. Intern. Med. 2011, 22, 8. [DOI] [PubMed] [Google Scholar]
- 4. Matsuda M., DeFronzo R. A., Diabetes Care 1999, 22, 1462. [DOI] [PubMed] [Google Scholar]
- 5. Donga E., Dekkers O. M., Corssmit E. P., Romijn J. A., Eur. J. Endocrinol. 2015, 173, 101. [DOI] [PubMed] [Google Scholar]
- 6. Brouns F., Bjorck I., Frayn K. N., Gibbs A. L., Lang V., Slama G., Wolever T. M. S., Nutr. Res. Rev. 2005, 18, 145. [DOI] [PubMed] [Google Scholar]
- 7. Bloomer R. J., Kabir M. M., Marshall K. E., Canale R. E., Farney T. M., Lipids Health Dis. 2010, 9, 79. [DOI] [PMC free article] [PubMed] [Google Scholar]
- 8. Dugani C. B., Klip A., EMBO Rep. 2005, 6, 1137. [DOI] [PMC free article] [PubMed] [Google Scholar]
- 9. Gao L., Mann G. E., Cardiovasc. Res. 2009, 82, 9. [DOI] [PubMed] [Google Scholar]
- 10. Sukumar P., Viswambharan H., Imrie H., Cubbon R. M., Yuldasheva N., Gage M., Galloway S., Skromna A., Kandavelu P., Santos C. X., Gatenby V. K., Smith J., Beech D. J., Wheatcroft S. B., Channon K. M., Shah A. M., Kearney M. T., Diabetes 2013, 62, 2130. [DOI] [PMC free article] [PubMed] [Google Scholar]
- 11. Yano M., Hasegawa G., Ishii M., Yamasaki M., Fukui M., Nakamura N., Yoshikawa T., Redox Rep. 2004, 9, 111. [DOI] [PubMed] [Google Scholar]
- 12. Gero D., Hyperglycemia‐Induced Endothelial Dysfunction, InTechOpen Ltd, London: 2018, pp. 179–210. [Google Scholar]
- 13. Quijano C., Castro L., Peluffo G., Valez V., Radi R., Am. J. Physiol. Heart Circ. Physiol. 2007, 293, H3404. [DOI] [PubMed] [Google Scholar]
- 14. Mah E., Noh S. K., Ballard K. D., Matos M. E., Volek J. S., Bruno R. S., J. Nutr. 2011, 141, 1961. [DOI] [PubMed] [Google Scholar]
- 15. Nieuwdorp M., Van Haeften T. W., Gouverneur M. C. L. G., Mooij H. L., Van Lieshout M. H. P., Levi M., Meijers J. C. M., Holleman F., Hoekstra J. B. L., Vink H., Kastelein J. J. P., Stroes E. S. G., Diabetes 2006, 55, 480. [DOI] [PubMed] [Google Scholar]
- 16. Manning P. J., Sutherland W. H., Walker R. J., de Jong S. A., Berry E. A., Metabolism 2008, 57, 1345. [DOI] [PubMed] [Google Scholar]
- 17. Choi H. J., Jeon S. Y., Hong W. K., Jung S. E., Kang H. J., Kim J.‐W., Jeon J.‐P., Han B.‐G., Diabetes Res. Clin. Pract. 2013, 99, e27. [DOI] [PubMed] [Google Scholar]
- 18. Abdiu A., Nakamura H., Sahaf B., Yodoi J., Holmgren A., Rosén A., Antioxid. Redox Signal. 2000, 2, 707. [DOI] [PubMed] [Google Scholar]
- 19. Meugnier E., Faraj M., Rome S., Beauregard G., Michaut A., Pelloux V., Chiasson J.‐L., Laville M., Clement K., Vidal H., Rabasa‐Lhoret R., Diabetes 2007, 56, 992. [DOI] [PubMed] [Google Scholar]
- 20. Stroeve J. H. M., van Wietmarschen H., Kremer B. H. A., van Ommen B., Wopereis S., Genes Nutr. 2015, 10, 13. [DOI] [PMC free article] [PubMed] [Google Scholar]
- 21. Wopereis S., Rubingh C. M., Van Erk M. J., Verheij E. R., Van Vliet T., Cnubben N. H. P., Smilde A. K., Van Der Greef J., Van Ommen B., Hendriks H. F. J., PLoS One 2009, 4, e4525. [DOI] [PMC free article] [PubMed] [Google Scholar]
- 22. Loureiro G. M. F., Food Rev. Int. 2019, 35, 390. [Google Scholar]
- 23. Wright E. M., Hirayama B. A., Loo D. F., J. Intern. Med 2007, 261, 32. [DOI] [PubMed] [Google Scholar]
- 24. Kellett G. L., Brot‐Laroche E., Diabetes 2005, 54, 3056. [DOI] [PubMed] [Google Scholar]
- 25. Villa‐Rodriguez J. A., Aydin E., Gauer J. S., Pyner A., Mol. Nutr. Food Res. 2017, 61, 1700566. [DOI] [PubMed] [Google Scholar]
- 26. Chen Z., Fu X., Kuang J., Chen J., Chen H., Pei J., Yang H., BMC Endocr. Disord. 2016, 16, 55. [DOI] [PMC free article] [PubMed] [Google Scholar]
- 27. Taylor R. H., Jenkins D. J. A., Barker H. M., Fielden H., Goff D. V., Misiewicz J. J., Lee D. A., Allen H. B., Macdonald G., Wallrabe H., Diabetes Care 1982, 5, 92. [DOI] [PubMed] [Google Scholar]
- 28. Koepsell H., Pflugers Arch. 2020, 472, 1207. [DOI] [PMC free article] [PubMed] [Google Scholar]
- 29. Kellett G. L., Brot‐Laroche E., Mace O. J., Leturque A., Annu. Rev. Nutr. 2008, 28, 35. [DOI] [PubMed] [Google Scholar]
- 30. Williamson G., Sheedy K., Nutrients 2020, 12, 3135. [DOI] [PMC free article] [PubMed] [Google Scholar]
- 31. Kim Y., Keogh J. B., Clifton P. M., Nutrients 2016, 8, 17.26742071 [Google Scholar]
- 32. Kim B., Figueroa‐Romero C., Pacut C., Backus C., Feldman E. L., J. Biol. Chem. 2015, 290, 19146. [DOI] [PMC free article] [PubMed] [Google Scholar]
- 33. Harborne J. B., Williams C. A., Phytochemistry 2000, 55, 481. [DOI] [PubMed] [Google Scholar]
- 34. Clifford M. N., J. Sci. Food Agric. 1999, 79, 362. [Google Scholar]
- 35. Manach C., Scalbert A., Morand C., Remesy C., Jimenez L., Am. J. Clin. Nutr. 2004, 79, 727. [DOI] [PubMed] [Google Scholar]
- 36. Crozier A., Del Rio D., Clifford M. N., Mol. Aspects Med. 2010, 31, 446. [DOI] [PubMed] [Google Scholar]
- 37. Borges G., Ottaviani J. I., van der Hooft J. J. J., Schroeter H., Crozier A., Mol. Aspects Med. 2018, 61, 18. [DOI] [PubMed] [Google Scholar]
- 38. Kay C. D., Clifford M. N., Mena P., McDougall G. J., Am. J. Clin. Nutr. 2020, 112, 1051. [DOI] [PMC free article] [PubMed] [Google Scholar]
- 39. Frank J., Fukagawa N. K., Bilia A. R., Johnson E. J., Kwon O., Prakash V., Miyazawa T., Clifford M. N., Kay C. D., Crozier A., Erdman J. W., Shao A., Williamson G., Nutr. Rev. 2020, 78, 451. [DOI] [PMC free article] [PubMed] [Google Scholar]
- 40. Manach C., Milenkovic D., Van De Wiele T., Rodriguez‐Mateos A., De Roos B., Garcia‐Conesa M. T., Landberg R., Gibney E. R., Heinonen M., Tomás‐Barberán F., Morand C., Mol. Nutr. Food Res. 2017, 61, 1600557. [DOI] [PMC free article] [PubMed] [Google Scholar]
- 41. Williamson G., Kay C. D., Crozier A., Comprehens. Rev. Food Sci. Food Saf. 2018, 17, 1054. [DOI] [PubMed] [Google Scholar]
- 42. Sies H., J. Nutr. 2007, 137, 1493. [DOI] [PubMed] [Google Scholar]
- 43. Adeghate E., Mohsin S., Adi F., Ahmed F., Yahya A., Kalász H., Tekes K., Adeghate E. A., Expert Opin. Investig. Drugs 2019, 28, 811. [DOI] [PubMed] [Google Scholar]
- 44. Bebernitz G., Compr. Med. Chem. III 2017, 7, 491. [Google Scholar]
- 45. Musso G., Gambino R., Cassader M., Paschetta E., BMJ 2019, 365, l1328. [DOI] [PMC free article] [PubMed] [Google Scholar]
- 46. Io F., Gunji E., Koretsune H., Kato K., Sugisaki‐Kitano M., Okumura‐Kitajima L., Kimura K., Uchida S., Yamamoto K., Eur. J. Pharmacol. 2019, 853, 136. [DOI] [PubMed] [Google Scholar]
- 47. Schulze C., Bangert A., Kottra G., Geillinger K. E., Schwanck B., Vollert H., Blaschek W., Daniel H., Mol. Nutr. Food Res. 2014, 58, 1795. [DOI] [PubMed] [Google Scholar]
- 48. Schmidl S., Ursu O., Iancu C. V., Oreb M., Oprea T. I., Choe J.‐Y., Sci. Rep. 2021, 11, 13751. [DOI] [PMC free article] [PubMed] [Google Scholar]
- 49. Matone A., O'grada C. M., Dillon E. T., Morris C., Ryan M. F., Walsh M., Gibney E. R., Brennan L., Gibney M. J., Morine M. J., Roche H. M., Mol. Nutr. Food Res. 2015, 59, 2279. [DOI] [PubMed] [Google Scholar]
- 50. Zhao X., Peter A., Fritsche J., Elcnerova M., Fritsche A., Häring H.‐U., Schleicher E. D., Xu G., Lehmann R., Am. J. Physiol. Endocrinol. Metab. 2009, 296, E384. [DOI] [PubMed] [Google Scholar]
- 51. Shaham O., Wei R., Wang T. J., Ricciardi C., Lewis G. D., Vasan R. S., Carr S. A., Thadhani R., Gerszten R. E., Mootha V. K., Mol. Syst. Biol. 2008, 4, 214. [DOI] [PMC free article] [PubMed] [Google Scholar]
- 52. Wang Q., Jokelainen J., Auvinen J., Puukka K., Keinänen‐Kiukaanniemi S., Järvelin M.‐R., Kettunen J., Mäkinen V.‐P., Ala‐Korpela M., BMC Med. 2019, 17, 217. [DOI] [PMC free article] [PubMed] [Google Scholar]
- 53. Thomaseth K., Pacini G., Clodi M., Kautzky‐Willer A., Nolan J. J., Prager R., Olefsky J. M., Ludvik B., Diabet Med. 1997, 14, S29. [DOI] [PubMed] [Google Scholar]
- 54. Matsuo T., Kusunoki Y., Katsuno T., Ikawa T., Akagami T., Murai K., Miuchi M., Miyagawa J.‐I., Namba M., Diabetes Res. Clin. Pract. 2014, 106, e25. [DOI] [PubMed] [Google Scholar]
- 55. Wang X.‐L., Ye F., Li J., Zhu L.‐Y., Feng G., Chang X.‐Y., Sun K., Saudi Med. J. 2016, 37, 48. [DOI] [PMC free article] [PubMed] [Google Scholar]
- 56. Visvanathan R., Houghton M. J., Williamson G., Food Chem. 2021, 343, 128423. [DOI] [PubMed] [Google Scholar]
- 57. Barber E., Houghton M. J., Williamson G., Foods 2021, 10, 1939. [DOI] [PMC free article] [PubMed] [Google Scholar]
- 58. Houghton M. J., Kerimi A., Mouly V., Tumova S., Williamson G., FASEB J. 2019, 33, 1887. [DOI] [PubMed] [Google Scholar]
- 59. Martin M. A., Fernandez‐Millan E., Ramos S., Bravo L., Goya L., Mol. Nutr. Food Res. 2014, 58, 447. [DOI] [PubMed] [Google Scholar]
- 60. Coskun O., Kanter M., Korkmaz A., Oter S., Pharmacol. Res. 2005, 51, 117. [DOI] [PubMed] [Google Scholar]
- 61. Corpe C. P., Eck P., Wang J., Al‐Hasani H., Levine M., J. Biol. Chem. 2013, 288, 9092. [DOI] [PMC free article] [PubMed] [Google Scholar]
- 62. Kwon O., Eck P., Chen S., Corpe C. P., Lee J. ‐ H., Kruhlak M., Levine M., FASEB J. 2007, 21, 366. [DOI] [PubMed] [Google Scholar]
- 63. Gauer J. S., Tumova S., Lippiat J. D., Kerimi A., Williamson G., Biochem. Pharmacol. 2018, 152, 11. [DOI] [PubMed] [Google Scholar]
- 64. Manzano S., Williamson G., Mol. Nutr. Food Res. 2010, 54, 1773. [DOI] [PubMed] [Google Scholar]
- 65. Villa‐Rodriguez J. A., Kerimi A., Abranko L., Tumova S., Ford L., Blackburn R. S., Rayner C., Williamson G., Sci. Rep. 2018, 8, 5471. [DOI] [PMC free article] [PubMed] [Google Scholar]
- 66. Kerimi A., Gauer J. S., Crabbe S., Cheah J. W., Lau J., Walsh R., Cancalon P. F., Williamson G., Br. J. Nutr. 2019, 121, 782. [DOI] [PubMed] [Google Scholar]
- 67. Johnston K., Sharp P., Clifford M., Morgan L., FEBS Lett. 2005, 579, 1653. [DOI] [PubMed] [Google Scholar]
- 68. Kerimi A., Nyambe‐Silavwe H., Pyner A., Oladele E., Gauer J. S., Stevens Y., Williamson G., Eur. J. Nutr. 2019, 58, 1315. [DOI] [PMC free article] [PubMed] [Google Scholar]
- 69. Kerimi A., Nyambe‐Silavwe H., Gauer J. S., Tomas‐Barberan F. A., Williamson G., Am. J. Clin. Nutr. 2017, 106, 1384. [DOI] [PubMed] [Google Scholar]
- 70. Kawakami Y., Watanabe Y., Mazuka M., Yagi N., Sawazaki A., Koganei M., Natsume M., Kuriki K., Morimoto T., Asai T., Arai H., Nutrition 2021, 85, 111128. [DOI] [PubMed] [Google Scholar]
- 71. Pérez‐Ramírez I. F., De Diego E. H., Riomoros‐Arranz M., Reynoso‐Camacho R., Saura‐Calixto F., Pérez‐Jiménez J., Int. J. Food Sci. Nutr. 2020, 71, 94. [DOI] [PubMed] [Google Scholar]
- 72. Lim W. X. J., Chepulis L., von Hurst P., Gammon C. S., Page R. A., Nutrients 2020, 12, 497. [DOI] [PMC free article] [PubMed] [Google Scholar]
- 73. Makarova E., Górnaś P., Konrade I., Tirzite D., Cirule H., Gulbe A., Pugajeva I., Seglina D., Dambrova M., J. Sci. Food Agric. 2015, 95, 560. [DOI] [PubMed] [Google Scholar]
- 74. Chiabchalard A., Nooron N., Pharmacogn. Mag. 2015, 11, 117. [DOI] [PMC free article] [PubMed] [Google Scholar]
- 75. Bernardo M. A., Silva M. L., Santos E., Moncada M. M., Brito J., Proença L., Singh J., De Mesquita M. F., J. Diabetes Res. 2015, 2015, 913651. [DOI] [PMC free article] [PubMed] [Google Scholar]
- 76. Tsuneki H., Ishizuka M., Terasawa M., Wu J.‐B., Sasaoka T., Kimura I., BMC. Pharmacol. 2004, 4, 18. [DOI] [PMC free article] [PubMed] [Google Scholar]
- 77. Van Dijk A. E., Olthof M. R., Meeuse J. C., Seebus E., Heine R. J., Van Dam R. M., Diabetes Care 2009, 32, 1023. [DOI] [PMC free article] [PubMed] [Google Scholar]
- 78. Smith H. A., Hengist A., Thomas J., Walhin J.‐P., Heath P., Perkin O., Chen Y.‐C., Gonzalez J. T., Betts J. A., Br. J. Nutr. 2020, 124, 1114. [DOI] [PubMed] [Google Scholar]
- 79. Krebs J. D., Parry‐Strong A., Weatherall M., Carroll R. W., Downie M., Metabolism 2012, 61, 1231. [DOI] [PubMed] [Google Scholar]
- 80. Rakvaag E., Dragsted L. O., Eur. J. Nutr. 2016, 55, 2221. [DOI] [PubMed] [Google Scholar]
- 81. Greenberg J. A., Owen D. R., Geliebter A., Diabetes Care 2010, 33, 278. [DOI] [PMC free article] [PubMed] [Google Scholar]
- 82. Johnston K. L., Clifford M. N., Morgan L. M., Am. J. Clin. Nutr. 2003, 78, 728. [DOI] [PubMed] [Google Scholar]