

Abstract
Background/Purpose
Localized scleroderma (LS) is a rare disease leading to progressive hardening and induration of the skin and subcutaneous tissues. LS is responsive to UVA‐1 phototherapy, though its exact mechanism of action dermal fibrosis is yet to be fully elucidated. We aimed to investigate the molecular changes induced by UVA‐1 rays in human primary fibroblasts cultures.
Methods
A total of 16 LS patients were treated with medium‐dose UVA‐1 phototherapy. At baseline, during and after therapy, Localized Scleroderma Assessment Tool, Dermatology Life Quality Index and lesions' staging and mapping were performed along with high‐frequency ultrasound (HFUS) examination for dermal thickness assessment. Gene expression analysis for 23 mRNA transcripts, in vitro UVA‐1 irradiation and viability tests were realized on lesional fibroblasts' primary cultures, before and 3 months after therapy.
Results
The dermal thickness, the LoSCAT and the DLQI progressively decreased starting from the last phototherapy session up to the 6 and 9 month follow‐ups (−57% and −60%, respectively). Molecular gene analysis (rt‐PCR) revealed that UVA‐1 phototherapy exerts multiple effects: the activation of specific anti‐fibrotic pathways (e.g., overexpression of CTHRC1 and metalloproteases 1, 2, 7, 8, 9, 12, suppression of TIMP‐1), the downregulation of peculiar pro‐fibrotic pathways (e.g., downregulation of TGF‐ß, TGF‐ßrII, Grb2, SMAD 2/3, TNRSF12A, CTGF) through a significant overexpression of IL‐1ß; the stabilization of collagen synthesis acting on genes COL1A1, COL3A1, COL8A1, COL10A1, COL12A1.
Conclusion
UVA‐1 phototherapy adds significant benefits in local tissue remodeling, rebalancing the alteration between pro‐fibrotic and anti‐fibrotic pathways; these changes can be well monitored by HFUS.
Keywords: high‐frequency ultrasound, in vitro UVA‐1 irradiation, localized scleroderma, primary fibroblast cultures, UVA‐1 phototherapy
1. INTRODUCTION
Localized Scleroderma (LS) in its patchy or plaque form, also known as morphea, is a rare autoimmune disease characterized by an inflammatory process causing a progressive sclerosis of the dermis, with consequent involvement of the epidermis and the subcutis (i.e., deep morphea). 1 , 2 , 3 , 4 , 5 The exact pathogenetic mechanism is extremely complex and not yet fully elucidated. The most accepted hypothesis is that a local trauma can hyper‐activate dermal fibroblasts (i.e., “fibrotic loop”) causing exuberant collagen and extracellular matrix (ECM) deposition. To date, the main body of evidence derives from in vivo and in vitro studies carried out either on mouse models (i.e., bleomycin‐induced fibrosis) or on systemic scleroderma (SSc) human fibroblasts: however, SSc is actually a distinct disease from LS, being characterized by the involvement of vascular endothelium. 6 , 7 , 8 , 9 , 10 , 11 , 12 , 13 , 14 , 15 Moreover, a specific molecular characterization at tissue level still lacks. 6 , 7 , 8 LS therapy in the acute phase essentially relies on topical and/or systemic administration of corticosteroids, being UVA‐1 phototherapy recommended as an adjuvant treatment in the early subacute phase and then as a maintenance treatment in the following months. 1 , 2 , 3 , 4 , 5 Nevertheless, the exact modification in cytokine pathways at tissue level were never investigated in human lesional specimens after UVA‐1 irradiation.
We aimed to realize, for the first time, a clinical, functional and ultrasonographic characterization of patients with LS, combined with the molecular examination of lesional tissue changes (i.e., human LS fibroblasts) after in vivo and in vitro UVA‐1 irradiation.
2. MATERIALS AND METHODS
The study was carried out in the Dermatology Unit, Skin Bank and Skin Cultures Laboratory of Siena University Hospital (Italy) and was realized in accordance with the Declaration of Helsinki and approved by the local ethical committee. All data were de‐identified before use.
2.1. Case study
A total of 16 patients with clinical and laboratory suspicion of LS were recruited from October 2016 to January 2020. Inclusion criteria were: age > 16 years, eligibility for whole‐body UVA‐1 phototherapy (i.e., phototype between I, II or III; no history of skin cancer). The timeline for examinations included 7 consecutive moments (t): baseline (t0), last irradiation session (t1), 2‐weeks after t1 (t2), 1 month after t1 (t3), 2 months after t1 (t4), 3 months after t1 (t5), 6 months after t1 (t6), 9 months after t1 (t7). At baseline, a 4‐mm punch biopsy was performed for histopathologic analysis.
2.2. Clinical monitoring
At baseline a specific body map was created for each patient and updated through t0‐t7 visits, recording the localization, the dimension and the stage of each patch. Lesion staging was based on 7 phases according to literature consensus: 1 , 2 , 3 , 4 erythematous, inflammatory, early sclerotic, sclerotic, sclero‐atrophic, atrophic and of dyspigmented morphology (Figure 1). During t0‐t7 examinations, the index Localized Scleroderma Assessment Tool (LoSCAT), 16 , 17 , 18 the normal modified Rodnan Skin Score (mRSS) and Dermatology Life Quality Index (DLQI) scores were assessed. For LoSACT and mRSS, skin pinching with thumb and index ‐aimed to extend up the skin to its maximum‐ was performed by the same physician over the selected lesion. 19 A lesion was defined cleared based on the combination of clinical appearance (i.e., reduction in lesion size, improvement in pigmentation, fading signs of inflammation) and palpation (i.e., skin softening and ultrasound assessment (reduction of skin thickness). When assessing the LoSCAT index, the degree of skin tanning induced by whole‐body UVA‐1 phototherapy was recorded and differentiated from post‐inflammatory dyspigmentation. 1 , 2 , 3 , 19
FIGURE 1.
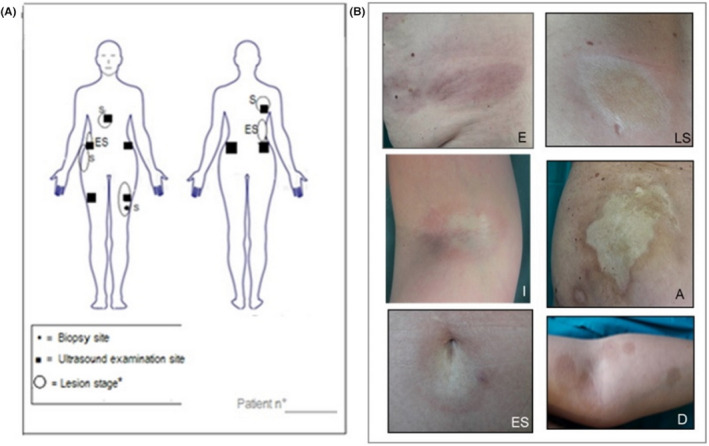
Example of the body mapping scheme that was filled for each patient during every evaluation time of the study (t0‐t7) (A). The position and the stage for each morphea lesion was indicated among 7 stages (i.e., erythematous (E), inflammatory (I), early sclerotic (ES), sclerotic (S), sclero‐atrophic (SC), atrophic (A) and dyspigmented (D); exemplificative images at different body sites took from 7 different patient enrolled in the study (B)
2.3. Ultrasound examination
High‐frequency ultrasound (HFUS) was performed with MyLab™ Twice Esaote biomedica®, 22 MHz linear probe, at t0, t3, t5 and t7: the thickness of dermis and hypodermis was assessed at five points (lesion‐center, intermediate, periphery, perilesional healthy, contralateral healthy) and repeated for a total of four selected lesions in each patient (Figure 2). Additionally, the 13–17 MHz probe was used in order to exclude the possibility of fascial and/or hypodermal involvement. At baseline, measurements of healthy dermis thickness were also realized at five anatomic reference points to ensure further normalization of data per patient, 5 (i.e.: axillary hollow; posterior arm, 10 cm over the elbow; anterior thigh, 10 cm over the knee; external forearm, 10 cm below the elbow; back of the hand, 3 cm below the wrist).
FIGURE 2.
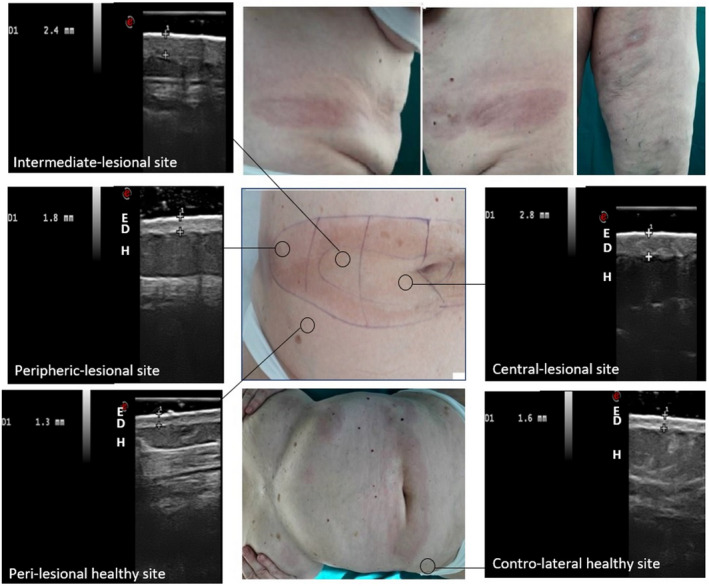
Ultrasound imaging 22 Mhz in a 65‐year‐old patient with plaque LS: examination at 5 points of an inflammatory patch of the abdomen (E = epidermis, D = dermis, H = hypodermis)
2.4. UVA‐1 phototherapy
A whole‐body irradiation was performed with GP24H medical bed, Cosmedico®, Medizintechnik. A medium‐dose protocol was employed in all patients, i.e.: 36 consecutive sessions of 60 J/cm2, 3 to 4 times per week. 3 , 4 , 5 Skin was prepared in patients with phototype II with three preliminary sessions of low dose UVA‐1 (i.e., 30 J/cm2) every 48 h. During phototherapy, patients were recommended to wear a pair of protective tanning eyewears.
2.5. Human fibroblasts cultures
At t0 and t5, a 6‐mm punch biopsy was obtained in each patient from the active sclerotic part of a LS patch (of early sclerotic or sclerotic stages or, in three cases, sclero‐atrophic): tissue samples were minced into small pieces and incubated in DMEM supplemented with 10% FBS, 5 mM Penicillin/Streptomycin, 2 mM L‐Glutamine (Euroclone) in a 5% CO2 incubator at 37°C, then were differently processed according to subsequent tests (i.e., molecular analysis or in vitro irradiation). The lower passage number (P0‐P4) was used for experiments to avoid changes in phenotype and gene expression. For each cluster, control fibroblasts obtained from healthy tissue (6 mm punch biopsy) of patients undergoing dermo‐surgery (i.e., large rhomboid skin excision for an atypical nevus with 1.5/2‐cm wide margins) matched for age, sex and body site. Finally, cells undergoing banking were cryopreserved at −80°C in liquid nitrogen in Siena Skin Bank. 21 , 22
2.6. In vitro UVA‐1 irradiation, cell culture imaging and viability assay
Cells clusters (either lesional and healthy) destinated to in vitro UVA‐1 irradiation were seeded with 1.5 μl phosphate buffer saline (PBS) in order to avoid any possible interference of the UVA‐1 rays with the phenolic pigment of culture medium. 5 , 20 Cell cultures were monitored with Nikon ECLIPSE Ts2 invertoscope, every 7 days during P0‐P4 expansion; before and after UVA‐1 in vitro irradiation, at t0 and t5, When cells were semi‐confluent (~650,000 cells/petri dish 3.5 cm), in vitro UVA‐1 irradiation was administered over fibroblasts by using a Solar Simulator paired with a 150 W Xenon Lamp (Thermo‐oriel ® ), customized with an air mass filter + bandpass lens (335–610 nm) to emit 340–400 nm. 5 A standard distance of 1.5 cm between the lens and the cell monolayer was maintained during all experiments. Fibroblasts were split into four groups that were administered different UVA‐1 doses Viability was estimated as optical density of formazan pigment at 570 nm (ThermoScientific‐Evolution 60®) as previously described, 20 , 21 before UVA‐1 irradiation and after 24, 48 and 72 h. (Table 1) The same experiments were repeated over healthy fibroblasts.
TABLE 1.
Results (average values and standard deviation) obtained from all lesional fibroblasts populations (16 morphea patients) with the viability test, i.e., MTT metabolic assay (tetrazolium salts [3‐(4,5‐dimethylthiazol‐2‐yl)‐2,5‐diphenyltetrazolium bromide]), before and after in vitro UVA‐1 irradiation, realized with 4 different doses with increasing irradiation times
| Irradiation dose | MTT test timing | Irradiation time | |||
|---|---|---|---|---|---|
| 0 h | 24 h | 48 h | 72 h | ||
| 0.1 J/cm2 | 0.115 ± 0.08 | 0.11 ± 0.05 | 0.091 ± 0.04 | 0.083 ± 0.03 | 10 s |
| 0.5 J/cm2 | 0.114 ± 0.06 | 0.10 ± 0.05 | 0.099 ± 0.03 | 0.081 ± 0.02 | 1 min |
| 1 J/cm2 | 0.113 ± 0.07 | 0.097 ± 0.04 | 0.085 ± 0.03 | 0.079 ± 0.02 | 2 min |
| 5 J/cm2 | 0.112 ± 0.05 | 0.092 ± 0.03 | 0.084 ± 0.02 | 0.075 ± 0.02 | 10 min |
| 10 J/cm2 | 0.116 ± 0.06 | 0.087 ± 0.03 | 0.079 ± 0.01 | 0.072 ± 0.01 | 20 min |
2.7. Molecular analysis
Cells clusters destinated to molecular analysis were collected with 1 ml of Trifast (Ambion) for the subsequent RNA extraction, according to the manufacturer's instructions. Extracted RNA concentration was assessed by Nanodrop Spectrometer (Thermo Fisher Scientific, Delaware) and its integrity evaluated by electrophoretic ran on agarose gel (FlashGel System – Lonza Group): 300NG of RNA was retro‐transcribed into cDNA with the iScript™ cDNA Synthesis kit (Bio‐Rad Laboratories). Expression levels of analyzed genes (Table 2) were determined by qRT‐PCR on iQ™5 Multicolor Real‐Time PCR Detection system using the SsoAdvanced™ Universal SYBR® Green Supermix (Bio‐Rad Laboratories). All specific primers were specifically designed for the present study with Primer_BLAST software (Available at: https://blast.ncbi.nlm.nih.gov). The selected reference gene encoding for ß‐actin was used to normalize Ct values. The test was repeated for three specimens for each of the 16 patients harvested before and after UVA‐1 plus 16 healthy controls, for a total of 80 specimens and the average results was considered.
TABLE 2.
List of 21 selected genes encoding for signaling protein, determined by qRT‐PCR, involved in pro or anti‐fibrotic pathways
| Gene | Protein | Function |
|---|---|---|
| TGF‐β1 | Transforming growth factor β isoform 1 | Prevalent isoform in the inflammatory phase |
| TGF‐β2 | Transforming growth factor β isoform 2 | Prevalent isoform in lymphocytic inflammatory infiltrate |
| TGF‐β3 | Transforming growth factor β isoform 3 | Prevalent isoform in lymphocytic inflammatory infiltrate |
| TGF‐βRII | TGF‐beta receptor type 2 | Membrane‐bound receptor subunit for the TGF |
| Grb2 | Growth factor receptor‐bound protein 2 | Member of TGF‐β signaling pathway |
| SMAD2 | Small mothers against decapentaplegic 2 | Member of TGF‐β signaling pathway |
| TNFRSF12A | Tumor necrosis factor receptor superfamily member 12A | Responsible for cytokines increasing and fibroblasts proliferation |
| CTGF | Connective tissue growth factor | Transcription factor responsible of collagen synthesis |
| COL1A1 | Collagen Type I Alpha 1 Chain | Thick fibers organization. Tensile strength |
| COL3A1 | Collagen Type III Alpha 1 Chain | Thin fibers organization. Support function |
| COL8A1 | Collagen Type VIII Alpha 1 Chain | Responsible for structures integrity facilitating cell migration |
| COL10A1 | Collagen Type X Alpha 1 Chain | Interactions with collagen I |
| COL12A1 | Collagen Type XII Alpha 1 Chain | Interactions with collagen I |
| IL1‐β | Interleukin 1 beta | Pro‐inflammatory. High tissue expression after post‐radiotherapy |
| CTHRC1 | Collagen triple helix repeat containing 1 | Negative regulator of collagen deposition (inhibition of Smad2‐TGF‐β activation) and collagen molecule cutting |
| TIMP1 | Tissue inhibitors of metalloproteases | Endogenous inhibitors of matrix metalloproteases |
| MMP1 | Matrix metalloproteases 1 | Collagenase able to digest collagen I, II, III, VII, X |
| MMP8 | Matrix metalloproteases 8 | Collagenase able to digest collagen I, II, III |
| MMP7 | Matrix metalloproteases 7 | Stromelysin able to digest fibronectin, laminin, collagen IV |
| MMP9 | Matrix metalloproteases 9 | Gelatinase able to digest gelatin, collagen III, IV e V fragment |
| MMP12 | Matrix metalloproteases 12 | Elastase able to digest elastin and aggrecan |
2.8. Statistical analysis
Descriptive statistics, including frequency count, mean, standard deviation (quantitative variables) and percentage (qualitative variables) were computed. The t test and one‐way analysis were used to compare groups when distributions were normal, Bonferroni’s post hoc test was employed for pairwise comparisons. Relative quantification of mRNA was measured by using the 2−∆∆CT method. A p < .05 value was considered significant.
3. RESULTS
3.1. Case study
Patients diagnosed with LS were aged between 16 and 70 years (55 years on average), 6 males and 10 females. We assessed a phototype II in 8 patients, III in 7 patients and I in one patient. Body mass index was 24.9 on average (range 23–27). LS Lesions started to develop about 2–2.5 months on average before patients' enrolment (range 0.3–4 months). In five cases, an acute intense compression trauma preceded lesion development. A positive history for repetitive skin microtraumatism was assessed in all patients and was due to either body overweight ‐ i.e., friction at skin folds (7 cases) or compressive clothes (2 cases). Concomitant autoimmune conditions included: mild hypertension (6), type II diabetes (5), atopic dermatitis (4), metabolic syndrome (3), osteoporosis (3), lower leg venous insufficiency (4), genital lichen ruber planus (2), genital lichen sclerosus (1).
3.2. Clinical monitoring
According to the clinical stage, 21% of patches were defined as erythematous at baseline, 19% as inflammatory, 15% as early sclerotic, 16% as sclerotic patches, 17% as sclero‐atrophic, 9% as atrophic patches, 3% as dyspigmented. At baseline, average LoSCAT was 33.4 (range 10–77) and did not show substantial modification at t2 (2‐weeks after t1/last irradiation) and t3 (1 month after t1). Of note, LoSCAT started to significantly decrease form t4 (i.e., 25.3 range 9–51), reaching 19.5 (range 7–38) at t5 (3 months after t1), 11.9 (range 5–25) at t6 (6 months after t1) and 9.3 (range 2–20) at t7 (9 months after t1). The mRSSS was 8 on average (range 4–10) at t0 and 2.4 on average (range 1–4) at t6, without a specific decrease. The DLQI was 4.6 on average (range 0–11) at t0, 0.8 at t6 (range 0–2). Based on the skin pinching test, a progressive increase in skin elasticity was appreciated at palpation starting from t4. The plicability reached its maximum (i.e., “possibility to pinch the lesional skin with two fingers reaching at least a 2 cm extension”) 19 at t6 in the 60% of cases and at t5 (Figure 3F) in 30% of cases and maintained at t9 in almost all cases. At t7, 95% of lesions were defined cleared based on combined clinical and ultrasonographic examinations: of them, 73% showed post‐UVA‐1 pigmentation.
FIGURE 3.
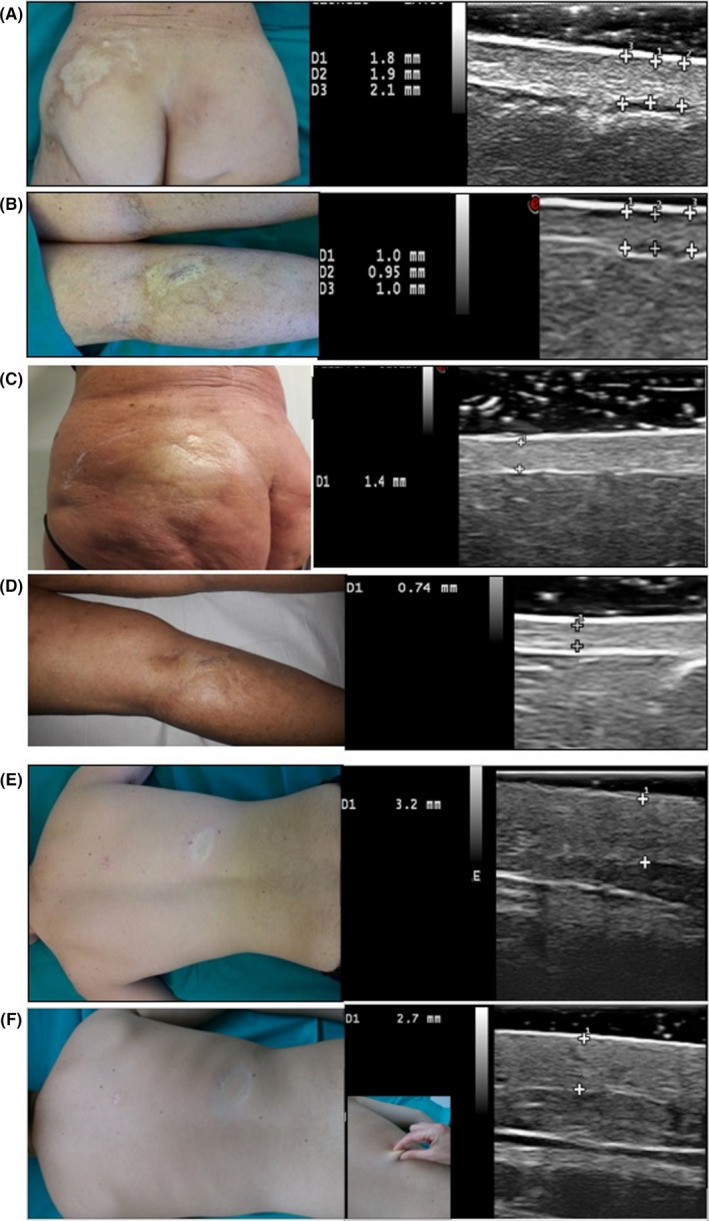
Clinical appearance of a sclerotic localized scleroderma (LS) patches of the lumbar‐gluteal area and of the posterior leg in a 57‐year‐old female, and corresponding high‐frequency ultrasound (HFUS) 22 MhZ estimation of dermal thickness in the center of the lesion (A,B); the same lesions examined at t5 (C,D). Clinical appearance of an inflammatory LS patch of the back in a 16‐year‐old male, and corresponding HFUS performed at t0 (E) and t5 (F), when the skin has retrieved its plicability as demonstrated by the skin pinching test, reaching an extension up to 2 cm (F)
3.3. Ultrasound examination
Considering average values of dermal thickness took in the active part of the patches (average among lesion‐center, intermediate, periphery points), we had a progressive dermal thickness decrease from baseline (t0) of −20% at t1, −40% at t5, −57% at t6 and −60% at t7 in all patients. The values took after phototherapy were very close or slightly superior to that assessed at contralateral healthy sites. (Figure 3). Considering the clinical stage, the reduction of the dermal thickness from t0 to t9 was significant for early sclerotic (−70%) and sclerotic (−72%) patches, followed by inflammatory patches (−67%) and erythematous patches (−60%). As expected, the variation in average thickness from baseline to t7 was lower for sclero‐atrophic (−48%) and for atrophic patches (−37%), while was not significant or undetectable for dyspigmented patches. Taking into account the body location of all patches, the average dermal thickness in the center of a LS patch at t0 were: 0.9 (range 0.6‐1.5) on the abdomen, 1.2 (range 0.8‐1.6) on the trunk; 1.15 (range 0.8‐1.7) on the thigh; 1.1 (range 1–1.2) on the arm. At t7, these values were reduced to 0.6 on the abdomen, 0.9 on the trunk, 0.9 on the tight and 0.7 on the arm, on average.
3.4. In vitro UVA‐1 irradiation
The reduction of cell viability values after UVA‐1 in vitro irradiation on lesional fibroblasts was consistent with the physiological decay in viability observed in petri dishes fibroblasts population after 24, 48, 72 h without medium replacement (Table 1). Morphologically, lesional fibroblasts did not show significant alteration in morphology, grown and average length (with longitudinal and transverse diameter of 500 and 50 nm on average, respectively).
3.5. Molecular analysis
Figure 4 reports the variations in mRNA expression levels after phototherapy and compared with healthy fibroblasts, of 12 genes out of the 21 analyzed (Table 2), namely: increase of IL‐1β and reduction of TGF‐β1, GRB2, SMAD2 and TNFRSF12A, as a downregulation of the same pro‐fibrotic pathways; four genes involved in the anti‐fibrotic pathway (i.e., CTHRC1, TIMP1, MMP‐1, ‐7, ‐8, ‐12. Regarding the other nine genes of the pro‐fibrotic pathways, we observed that: CTGF and TGF‐βRII decreased after therapy, but not significantly; the other collagen genes COL3A1, COL8A1, COL10A1 and COL12A1 did not show significant variations after phototherapy and compared with healthy controls; of converse, the TGF‐β2 and TGF‐β3 isoforms and the MMP‐9 were slightly increased after therapy, probably as a result of a compensatory feedback.
FIGURE 4.
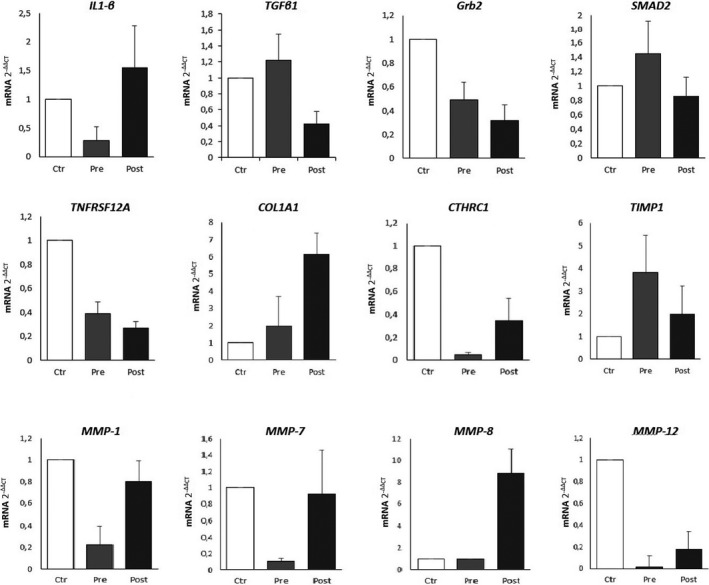
The relative expression of mRNA levels of 12 out of the 21 genes analyzed in the study, involved in pro‐ and anti‐fibrotic pathway fibrotic pathways, according to qRT‐PCR analysis; average values derived from patients belonging to the three subgroups are compared: lesional fibroblasts from selected a localized scleroderma (LS) lesion in harvested before phototherapy in 16 patients (Pre); lesional fibroblasts from the same cleared lesions harvested after phototherapy (Post); control group of healthy fibroblasts of 16 healthy patients (Ctrl). The relative gene expressions normalized to Act‐β reference gene are shown. Bars represent mean ± Sd. Relative quantification of mRNA was measured by using the 2−∆∆CT method. For each patient/control, tests were repeated at least for three clusters of fibroblasts cultures (having a total of 80 specimens and assuming the average results among the three values)
4. DISCUSSION
Localized scleroderma is still poorly studied at both epidemiological and laboratory levels, especially when compared with SSc. Actually, many patients receive late diagnosis or wrong management, exhibit long‐term corticosteroid side effects or develop functional‐aesthetical disabilities impacting life quality. 1 , 2 , 3 , 4 , 5 , 23 , 24 , 25 , 26 Nevertheless, it can be clinically difficult both to determine whether LS lesions are active, to define their peculiar stage and to assess the presence of subcutaneous damage. 1 , 2 , 3 , 4 , 19 Thus, a combined evaluation of LS patients based on validated clinical checklists 16 , 17 , 18 and on instrumental measurements 27 , 28 , 29 , 30 , 31 , 32 is of paramount importance to provide the proper therapy at earliest.
In this study, we decided to use the recently developed LoSCAT clinical tool, which was only applied twice in the clinical setting: in children 33 to follow the response to corticosteroid and in adults to estimate disease activity at baseline. 34 We found a correlation between the LoSCAT value and clinical response and between LoSCAT and dermal thickness. Moreover, the DLQI decreased proportionally to the LoSCAT at follow‐up times t2‐t7. On the other hand, the “old” mRSSS developed for SSc was not as sensitive in distinguishing clinical changes ‐especially at t2, t3 and t4‐ giving a poorly detailed estimation of the disease activity. 35 However, it should be stressed that, from t2 on, physicians should be able to differentiate UVA‐1 induced pigmentation from post‐inflammatory pigmentation when assessing the LoSCAT. 36
Skin ultrasound has received increasing attention for LS monitoring, in the last decades, 27 , 28 , 29 , 30 , 31 , 32 first with low‐frequency US (6–8 mHz), 27 then with medium frequency‐MFUS (9–15 mHz) 29 and recently with high‐frequency‐HFUS (>20 mHz). 5 , 27 , 28 , 29 , 37 The available data on patients with LS 30 , 31 , 32 , 36 , 37 and with SSc‐LS association forms 24 point toward a greater sensitivity of HFUS in obtaining highly defined images. However, these ultrasonographic examinations were performed only at lesional sites (without contralateral examination) and with a unique thickness assessment (instead of multiple assessment) more commonly in patients already treated with systemic immunosuppressive therapy, 27 , 31 than in naïve patients. 29 Here in this study, using the 22 MHz probe allowed us to obtain a detailed visualization and measurement of the dermal band with high resolution, while the 13–15 Mhz probe excluded a deeper fibrotic involvement. Globally, we observed that: (a) according to HFUS, the reduction of dermal thickness starts, 1 month after last session, while clinically it is conventionally assessed 3 months after last phototherapy session; (b) the level of hyper‐echogenicity of the dermal band was greater in the sclerotic phase, followed by early sclerotic and the inflammatory; (c) the definition of the border of the sclerotic band appeared to correlate with the stage of the lesion, that is: poorly definable in erythematous, inflammatory and then dyspigmented patches, clear cut in sclerotic and then early sclerotic patches; (d) the combination of this new HFUS protocol with the clinical mapping scheme here proposed allowed us to carefully classify the disease stage of each patch and to follow precisely their evolution under phototherapy. These findings are otherwise in line with the recent UFUS studies on LS. 29 , 31 , 36
Our experiments showed that in vitro UVA‐1 irradiation performed with crescent doses and progressively longer irradiation times (range 10 s–20 min) does not affect the viability of lesional fibroblasts cultures (Table 1): these findings are in line with the behavior of lesional primary fibroblasts irradiated with UVA‐1 rays 5 , 11 , 12 , 13 , 24 , 25 , 26 and support the current consensus on the overall safety of the UVA‐1 phototherapic approach. 3 , 4 , 5
In view of the complexity of the immunopathological mechanism underlying the scleroderma lesion, we chose to perform a direct gene expression assessed by RT‐PCR, rather than a functional analysis, to investigate the main markers of fibrosis and anti‐fibrotic pathways. Indeed, gene expression analysis makes it possible to estimate the metabolic activity of lesional fibroblasts in a given moment, as demonstrated by recent gene profiling and “transcriptomics” studies. 38 , 39 , 40 Globally, the findings here obtained from molecular assay suggest that UVA‐1 rays exert pleiotropic effects on lesional tissue and that lesional fibroblasts exhibit a fibrotic phenotype at baseline, then normalized by UVA‐1 irradiation. In particular, we observed that UVA‐1 rays were able to induce both upregulation and downregulation of anti‐ and pro‐fibrotic pathways, respectively. To the best of our knowledge, this is the first report that specifically characterizes how TGF‐β isoforms are modified by UVA‐1 rays. 13 , 14 Indeed, TGF‐β1 expression appeared reduced in UVA‐1 irradiated fibroblasts, while TGF‐β2 and TGF‐β3 expression was essentially unmodified. Moreover, the exact mechanism underlying a reduced TGF‐β expression was never elucidated. Our results led to hypothesize that TGF‐β1 downregulation could exert a positive feedback on the synthesis of the IL‐1β isoform, a high pro‐inflammatory cytokine known to be UV‐induced according to radiodermatitis models. This is also in line with previous observation on both healthy 14 , 42 and lesional fibroblasts. 43 Furthermore, we can hypothesize that, in LS tissues exposed to the cumulative dose of 2160 J/cm2, a competition for transduction between TGF‐β and IL‐1β occurs, causing a reduction in TGF‐β synthesis, and consequently in TGF‐βr2, Grb2, Smad2 and CTGF expression. Indeed, we observed that TGF‐β1 is reduced by 58%, TGF‐βrec2 by 66%, Grb2 by 30% and Smad2/3 by 40% after UVA‐1 treatment. In addition, the finding of a decreased expression of Smad2 gene in UVA‐1 treated lesional fibroblasts along with its normal expression in healthy irradiated fibroblasts, is new and in line with previous experience on human models suggesting a reduction in Smad3 and 7. 11 Regarding the TNFRSF12A gene, coding for the rapid expression of growth factor‐inducible immediate‐early response protein 14, was found to decrease weakly after UVA‐1 therapy. This receptor, recently regarded as key molecule in fibrotic pathways in various organs (i.e., hepatic cirrhosis), 44 has been also found overexpressed in SSc models: it appears to be directly involved in collagen synthesis through the activation of IKK, transcription of the nuclear factor Nf‐KB and direct induction of CTGF. Then, a reduced synthesis and cytoplasmic expression of TNFRSF12A would result in decreased signaling from this pathway. Concerning the effect of UVA‐1 on the different collagen subtypes, we found that the levels of COL1A1 were significantly overexpressed after UVA‐1, while COL3A1, COL8A1, COL10A1 and COL12A1 expression showed no to slight increase. These findings are in line with other studies, which variously report: in advanced sclerotic lesions, unchanged collagen I and III levels; 40 , 41 in lesions consecutively irradiated for 2 or 3 times, an increase in collagen levels until reaching a plateau. 25 These data globally suggest that the neo‐collagen deposition and tissue remodeling driven by UVA‐1 phototherapy is essentially limited to type I collagen, at least in a first phase, being the COL1A1 gene responsible for thick fibers organization and tensile strength. On the other hand, we found a relevant increase in CTHRC1 expression after therapy: beside being responsible for collagen cutting and remodeling protein, this gene was recently demonstrated to have an inhibitory activity on neo‐collagen deposition (further inhibiting the activation of Smad2). 9 , 45 These data would suggest that UVA‐1 medium‐dose therapy would stimulate ECM remodeling and neo‐collagen synthesis, especially type 1. 9
As for MMPs, all the analyzed molecules resulted overexpressed after UVA‐1 therapy, in a dose‐dependent increased expression. 13 , 15 , 46 This, in our opinion, is likely to be mediated by both the downregulation of the TIMP‐1 (the natural tissue inhibitor of MMPs) and the presence of high levels of IL‐1β able to activate the MMPs. 13 , 25 , 46
Taken together, these preliminary in vivo and in vitro findings suggest that: (a) LoSCAT index is more precise compared to mRSS to estimate disease activity in LS patients; (b) UFUS can be regarded as a reliable tool to monitor dermal thickness variation in different phases of the disease and to estimate the response to treatment; (c) combining a newly proposed scheme for clinical mapping with LoSCAT tool and a dedicated HFUS mapping scheme would allow physicians to correctly stage the LS patches at baseline, to monitor the evolution under therapy, and to follow‐up patients in time; (d) UVA‐1 phototherapy with medium does exerts multiple effects on LS lesions, including inhibition of tissue fibrotic pathways and enhancement of collagen digestion and remodeling, without affecting fibroblasts viability.
To date, to the best of our knowledge, no study has attempted to combine together clinically, ultrasound and molecular laboratory data from a homogeneous population of patients with LS and different skin phototypes, not undergoing corticosteroid/immunosuppressive therapy, and investigate their response to UVA‐1 phototherapy with human cell cultures.
Further studies are needed to confirm the present findings, and give new insight at both molecular and clinical level, i.e.: to further characterize the pleiotropic actions of IL‐1β cytokine stimulated by UVA‐1 rays, including the effect on dendritic plasmacytoid cells and on Treg normalization, 26 , 47 and to develop a specific standardized assessment tool for phototherapy‐treated patient (e.g., modified LoSCAT) able to differentiate pathological pigmentation from UVA‐1 induced tanning. 37
CONFLICT OF INTEREST
None.
ACKNOWLEDGEMENT
Open Access Funding provided by Universita degli Studi di Siena within the CRUI‐CARE Agreement. [Correction added on 14 May 2022, after first online publication: CRUI‐CARE funding statement has been added.]
AUTHOR CONTRIBUTIONS
LT involved in writing, design, experiments, and therapy. CM involved in writing and experiments. AC and LT involved in therapy. GG and GM did experiments. EC and PR involved in editing.
Tognetti L, Marrocco C, Carraro A, et al. Clinical and laboratory characterization of patients with localized scleroderma and response to UVA‐1 phototherapy: In vivo and in vitro skin models. Photodermatol Photoimmunol Photomed. 2022;38:531–540. doi: 10.1111/phpp.12786
DATA AVAILABILITY STATEMENT
The data that support the findings of this study are available on request from the corresponding author. The data are not publicly available due to privacy or ethical restrictions.
REFERENCES
- 1. Asano Y, Fujimoto M, Ishikawa O, et al. Diagnostic criteria, severity classification and guidelines of localized scleroderma. J Dermatol. 2018;45(7):755‐780. [DOI] [PubMed] [Google Scholar]
- 2. Florez‐Pollack S, Kunzler E, Jacobe HT. Morphea: current concepts. Clin Dermatol. 2018;36(4):475‐486. [DOI] [PubMed] [Google Scholar]
- 3. Knobler R, Moinzadeh P, Hunzelmann N, et al. European dermatology forum S1‐guideline on the diagnosis and treatment of sclerosing diseases of the skin, part 1: localized scleroderma, systemic sclerosis and overlap syndromes. J Eur Acad Dermatol Venereol. 2017;31(9):1401‐1424. [DOI] [PubMed] [Google Scholar]
- 4. Mertens JS, Seyger MMB, Thurlings RM, Radstake TRDJ, de Jong EMGJ. Morphea and eosinophilic fasciitis: an update. Am J Clin Dermatol. 2017;18(4):491‐512. [DOI] [PMC free article] [PubMed] [Google Scholar]
- 5. Tognetti L, Marrocco C, Carraro A, et al. UVA‐1 phototherapy as adjuvant treatment for eosinophilic fasciitis: in vitro and in vivo functional characterization. Int J Dermatol. 2021. doi: 10.1111/ijd.16003. Epub ahead of print. [DOI] [PMC free article] [PubMed] [Google Scholar]
- 6. Saracino AM, Denton CP, Orteu CH. The molecular pathogenesis of morphoea: from genetics to future treatment targets. Br J Dermatol. 2017;177(1):34‐46. [DOI] [PubMed] [Google Scholar]
- 7. Wolska‐Gawron K, Bartosińska J, Krasowska D. MicroRNA in localized scleroderma: a review of literature. Arch Dermatol Res. 2020;312(5):317‐324. [DOI] [PMC free article] [PubMed] [Google Scholar]
- 8. Mertens JS, de Jong EMGJ, Pandit A, et al. Regarding "transcriptional and cytokine profiles identify CXCL9 as a biomarker of disease activity in morphea". J Invest Dermatol. 2018;138(5):1212‐1215. [DOI] [PubMed] [Google Scholar]
- 9. Sargent JL, Li Z, Aliprantis AO, et al. Identification of optimal mouse models of systemic sclerosis by interspecies comparative genomics. Arthritis Rheumatol. 2016;68(8):2003‐2015. [DOI] [PMC free article] [PubMed] [Google Scholar]
- 10. Kreuter A, Hyun J, Skrygan M, et al. Ultraviolet A1‐induced downregulation of human beta‐defensins and interleukin‐6 and interleukin‐8 correlates with clinical improvement in localized scleroderma. Br J Dermatol. 2006;155(3):600‐607. [DOI] [PubMed] [Google Scholar]
- 11. Kreuter A, Hyun J, Skrygan M, et al. Ultraviolet A1 phototherapy decreases inhibitory SMAD7 gene expression in localized scleroderma. Arch Dermatol Res. 2006;298(6):265‐272. [DOI] [PubMed] [Google Scholar]
- 12. Gambichler T, Skrygan M, Tomi NS, Breuksch S, Altmeyer P, Kreuter A. Significant downregulation of transforming growth factor‐beta signal transducers in human skin following ultraviolet‐A1 irradiation. Br J Dermatol. 2007;156(5):951‐956. [DOI] [PubMed] [Google Scholar]
- 13. El‐Mofty M, Mostafa W, Esmat S, et al. Suggested mechanisms of action of UVA phototherapy in morphea: a molecular study. Photodermatol Photoimmunol Photomed. 2004;20(2):93‐100. [DOI] [PubMed] [Google Scholar]
- 14. El‐Mofty M, Mostafa W, El‐Darouty M, et al. Different low doses of broad‐band UVA in the treatment of morphea and systemic sclerosis: a clinico‐pathologic study. Photodermatol Photoimmunol Photomed. 2004;20(3):148‐156. [DOI] [PubMed] [Google Scholar]
- 15. Gruss C, Reed JA, Altmeyer P, McNutt NS, Kerscher M. Induction of interstitial collagenase (MMP‐1) by UVA‐1 phototherapy in morphea fibroblasts. Lancet. 1997;350(9087):1295‐1296. [DOI] [PubMed] [Google Scholar]
- 16. Arkachaisri T, Vilaiyuk S, Torok KS, Medsger TA Jr. Development and initial validation of the localized scleroderma skin damage index and physician global assessment of disease damage: a proof‐of‐concept study. Rheumatology. 2010;49(2):373‐381. [DOI] [PMC free article] [PubMed] [Google Scholar]
- 17. Lis‐Święty A, Skrzypek‐Salamon A, Ranosz‐Janicka I, Brzezińska‐Wcisło L. Associations between disease activity/severity and damage and health‐related quality of life in adult patients with localized scleroderma‐a comparison of LoSCAT and visual analogue scales. J Clin Med. 2020;9(3):756. [DOI] [PMC free article] [PubMed] [Google Scholar]
- 18. Teske NM, Jacobe HT. Using the localized scleroderma cutaneous assessment tool (LoSCAT) to classify morphoea by severity and identify clinically significant change. Br J Dermatol. 2020;182(2):398‐404. [DOI] [PubMed] [Google Scholar]
- 19. Albuquerque JV, Andriolo BN, Vasconcellos MR, Civile VT, Lyddiatt A, Trevisani VF. Interventions for morphea. Cochrane Database Syst Rev. 2019;7(7):CD005027. doi: 10.1002/14651858.CD005027.pub5 [DOI] [PMC free article] [PubMed] [Google Scholar]
- 20. Oh JH, Karadeniz F, Lee JI, Kim HR, Seo Y, Kong CS. Anti photoaging effect of (2′ S)‐columbianetin from corydalis heterocarpa in UVA‐irradiated human dermal fibroblasts. Appl Sci. 2020;10(7):2568. [Google Scholar]
- 21. Pianigiani E, Tognetti L, Ierardi F, et al. Assessment of cryopreserved donor skin viability: the experience of the regional tissue bank of Siena. Cell Tissue Bank. 2016;17(2):241‐253. [DOI] [PubMed] [Google Scholar]
- 22. Tognetti L, Pianigiani E, Ierardi F, et al. Current insights into skin banking: storage, preservation and clinical importance of skin allografts. J Biorepos Sci Appl Med. 2017;5:41‐56. [Google Scholar]
- 23. Hassani J, Feldman SR. Phototherapy in scleroderma. Dermatol Ther. 2016;6:519‐553. [DOI] [PMC free article] [PubMed] [Google Scholar]
- 24. Kreuter A, Breuckmann F, Uhle A, et al. Low‐dose UVA1 phototherapy in systemic sclerosis: effects on acrosclerosis. J Am Acad Dermatol. 2004;50(5):740‐747. [DOI] [PubMed] [Google Scholar]
- 25. Wang F, Garza LA, Cho S, et al. Effect of increased pigmentation on the antifibrotic response of human skin to UV‐A1 phototherapy. Arch Dermatol. 2008;144(7):851‐858. [DOI] [PMC free article] [PubMed] [Google Scholar]
- 26. Camacho NR, Sánchez JE, Martin RF, González JR, Sánchez JL. Medium‐dose UVA1 phototherapy in localized scleroderma and its effect in CD34‐positive dendritic cells. J Am Acad Dermatol. 2001;45(5):697‐699. [DOI] [PubMed] [Google Scholar]
- 27. Porta F, Kaloudi O, Garzitto A, et al. High frequency ultrasound can detect improvement of lesions in juvenile localized scleroderma. Mod Rheumatol. 2014;24(5):869‐873. [DOI] [PubMed] [Google Scholar]
- 28. Buense R, Duarte IA, Bouer M. Localized scleroderma: assessment of the therapeutic response to phototherapy. An Bras Dermatol. 2012;87(1):63‐69. [DOI] [PubMed] [Google Scholar]
- 29. Li SC, Liebling MS, Haines KA, Weiss JE, Prann A. Initial evaluation of an ultrasound measure for assessing the activity of skin lesions in juvenile localized scleroderma. Arthritis Care Res. 2011;63(5):735‐742. [DOI] [PubMed] [Google Scholar]
- 30. Nezafati KA, Cayce RL, Susa JS, et al. 14‐MHz ultrasonography as an outcome measure in morphea (localized scleroderma). Arch Dermatol. 2011;147(9):1112‐1115. [DOI] [PubMed] [Google Scholar]
- 31. Wortsman X, Wortsman J, Sazunic I, Carreño L. Activity assessment in morphea using color doppler ultrasound. J Am Acad Dermatol. 2011;65(5):942‐948. [DOI] [PubMed] [Google Scholar]
- 32. Cosnes A, Anglade M‐C, Revuz J, Radier C. Thirteen‐megahertz ultrasound probe: its role in diagnosing localized scleroderma. Br J Dermatol. 2003;148:724‐729. [DOI] [PubMed] [Google Scholar]
- 33. Kelsey CE, Torok KS. The localized scleroderma cutaneous assessment tool: responsiveness to change in a pediatric clinical population. J Am Acad Dermatol. 2013;69(2):214‐220. [DOI] [PMC free article] [PubMed] [Google Scholar]
- 34. Condie D, Grabell D, Jacobe H. Morphea in adults and children cohort VI: a cross‐sectional comparison of outcomes between adults with pediatric‐onset and adult‐onset morphea. Arthritis Rheumatol. 2014;66(12):3496‐3504. [DOI] [PMC free article] [PubMed] [Google Scholar]
- 35. Kreuter A, Hyun J, Stücker M, Sommer A, Altmeyer P, Gambichler T. A randomized controlled study of low‐dose UVA1, medium‐dose UVA1, and narrowband UVB phototherapy in the treatment of localized scleroderma. J Am Acad Dermatol. 2006;54(3):440‐447. [DOI] [PubMed] [Google Scholar]
- 36. Lis‐Święty A, Janicka I, Skrzypek‐Salamon A, Brzezińska‐Wcisło L. A systematic review of tools for determining activity of localized scleroderma in paediatric and adult patients. J Eur Acad Dermatol Venereol. 2017;31(1):30‐37. [DOI] [PubMed] [Google Scholar]
- 37. Sator PG, Radakovic S, Schulmeister K, Hönigsmann H, Tanew A. Medium‐dose is more effective than low‐dose ultraviolet A1 phototherapy for localized scleroderma as shown by 20‐MHz ultrasound assessment. J Am Acad Dermatol. 2009;60(5):786‐791. [DOI] [PubMed] [Google Scholar]
- 38. Ju M, Chen K, Chang B, Gu H. UVA1 irradiation inhibits fibroblast proliferation and alleviates pathological changes of scleroderma in a mouse model. J Biomed Res. 2012;26(2):135‐142. [DOI] [PMC free article] [PubMed] [Google Scholar]
- 39. Johnson ME, Pioli PA, Whitfield ML. Gene expression profiling offers insights into the role of innate immune signaling in SSc. Semin Immunopathol. 2015;37:501‐509. [DOI] [PMC free article] [PubMed] [Google Scholar]
- 40. Jacobe HT, Cayce R, Nguyen J. UVA1 phototherapy is effective in darker skin: a review of 101 patients of Fitzpatrick skin types I‐V. Br J Dermatol. 2008;159(3):691‐696. [DOI] [PubMed] [Google Scholar]
- 41. Menter JM, Patta AM, Sayre RM, Dowdy J, Willis I. Effect of UV irradiation on type I collagen fibril formation in neutral collagen solutions. Photodermatol Photoimmunol Photomed. 2001;17(3):114‐120. [DOI] [PubMed] [Google Scholar]
- 42. Heino J, Heinonen T. Interleukin‐1 beta prevents the stimulatory effect of transforming growth factor‐beta on collagen gene expression in human skin fibroblasts. Biochem J. 1990;271(3):827‐830. [DOI] [PMC free article] [PubMed] [Google Scholar]
- 43. Mia MM, Boersema M, Bank RA. Interleukin‐1β attenuates myofibroblast formation and extracellular matrix production in dermal and lung fibroblasts exposed to transforming growth factor‐β1. PLoS One. 2014;9(3):e91559. [DOI] [PMC free article] [PubMed] [Google Scholar]
- 44. Wilhelm A, Shepherd EL, Amatucci A, et al. Interaction of TWEAK with Fn14 leads to the progression of fibrotic liver disease by directly modulating hepatic stellate cell proliferation. J Pathol. 2016;239(1):109‐121. [DOI] [PMC free article] [PubMed] [Google Scholar]
- 45. Binks AP, Beyer M, Miller R, LeClair RJ. Cthrc1 lowers pulmonary collagen associated with bleomycin‐induced fibrosis and protects lung function. Physiol Rep. 2017;5(5):e13115. [DOI] [PMC free article] [PubMed] [Google Scholar]
- 46. Scharffetter K, Wlaschek M, Hogg A, et al. UVA irradiation induces collagenase in human dermal fibroblasts in vitro and in vivo. Arch Dermatol Res. 1991;283(8):506‐511. [DOI] [PubMed] [Google Scholar]
- 47. Antiga E, Quaglino P, Bellandi S, et al. Regulatory T cells in the skin lesions and blood of patients with systemic sclerosis and morphoea. Br J Dermatol. 2010;162(5):1056‐1063. [DOI] [PubMed] [Google Scholar]
Associated Data
This section collects any data citations, data availability statements, or supplementary materials included in this article.
Data Availability Statement
The data that support the findings of this study are available on request from the corresponding author. The data are not publicly available due to privacy or ethical restrictions.