

Abstract
Bicuspid aortic valve (BAV) is the most common congenital cardiac malformation, which had been treated off-label by transcatheter aortic valve replacement (TAVR) procedure for several years, until its recent approval by the FDA and CE to treat BAVs. Post-TAVR complications tend to get exacerbated in BAV patients due to their inherent aortic root pathologies. Globally, due to the paucity of randomized clinical trials, clinicians still favor surgical AVR as the primary treatment option for BAV patients. While this warrants longer term studies of TAVR outcomes in BAV patient cohorts, in-vitro experiments and in-silico computational modeling can be used to guide the surgical community in assessing the feasibility of TAVR in BAV patients. Our goal is to combine these techniques in order to create a modeling framework for optimizing pre-procedural planning and minimize post-procedural complications.
Patient-specific in-silico models and 3D printed replicas of 3 BAV patients with different degrees of post-TAVR paravalvular leakage (PVL) were created. Patient-specific TAVR device deployment was modeled in-silico and in-vitro – following the clinical procedures performed in these patients. CFD simulations and in-vitro flow studies were performed in order to obtain the degrees of PVL in these models.
PVL degree and locations were consistent with the clinical data. Cross-validation comparing the stent deformation and the flow parameters between the in-silico and the in-vitro models demonstrated good agreement.
The current framework illustrates the potential of using simulations and 3D printed models for pre-TAVR planning and assessing post-TAVR complications in BAV patients.
Keywords: Aortic valve, Bicuspid aortic valve (BAV), Paravalvular leakage (PVL), Patient-specific computational modeling, Transcatheter aortic valve replacement (TAVR), 3D printing
Introduction
BAV is the most common congenital heart defect with an incidence of 1 – 2% in general population [1–3]. Unlike normal tri-leaflet aortic valves, BAV consists of two leaflets and two functional commissures which are resulted from an abnormal cusp fusion. A third and nonfunctional commissure is located at the site of leaflet fusion and observed in 95% of the BAV population [4]. Variation in the number, orientation, height of the commissures, and the size of the leaflets results in high morphological heterogeneity in this patient population [5]. In addition to the aortic valve malformation, BAV also manifests additional aortic root abnormalities, including - increased aortic root dimensions, dilation of the ascending aorta, possible aortic aneurysm, and aortic valve regurgitation. While genetics initiate the early development of structural anomalies in the aortic root of the BAV patients, the resulting abnormal hemodynamics accelerate disease progression and associated complications. The restrictive nature of the fused cusps gives rise to asymmetric and turbulent flow pattern in BAV patients [6]. Abnormal hemodynamics along with the unsteady leaflet shear stress expedite the development of leaflet calcification and aortic stenosis. Approximately 50% of the BAV population develops calcific aortic valve disease at an earlier age, and most of these patients develop severe aortic stenosis at an age of 50 – 60 years, requiring them to have aortic valve replacement [4,7].
Transcatheter aortic valve replacement (TAVR) is a minimally invasive alternative to surgical aortic valve replacement (SAVR) procedure which was the only viable treatment option for high surgical risk patients. TAVR has shown clinical performances superior or equivalent to SAVR, involves shorted recovery time and hospital stay, which naturally increased its demand among various patient populations. Despite its proven advantages, TAVR is still associated with several post-procedural complications which include paravalvular leakage (PVL), conduction abnormality, subclinical valve thrombosis, stroke, structural valve deterioration and vascular complications [8–10]. The severity of these complications varies from patient to patient and is compounded depending on preexisting clinical conditions and complex anatomical features. BAV is associated with morphological variations and anatomical complexities, which make it difficult for the clinicians to establish standard practices for TAVR procedure in BAV patients. While Sievers classification scheme had been widely used for very generalized identification of different BAV subtypes [11], researchers are still trying to analyze other morphological details of the aortic root (e.g landing zone configuration, location, pattern, and volume of leaflet calcification) in order to find their impact on the pre-procedural decisions and post-procedural outcomes [12,13]. BAV patients often present anatomical features that are considered challenging for TAVR procedure. In addition to the aortic root complications mentioned previously, BAV is associated with higher aortic angulation, heavy and asymmetric leaflet calcification which apply differential stress on the TAVR device, prevent the optimal interaction between the device and the native leaflets, and may result in malpositioning, incomplete and asymmetric expansion of the circular device. They often exacerbate post-TAVR complications in BAV patients by worsening the hemodynamics, increasing transvalvular pressure gradient and PVL, and impacting the device durability. In addition, the inherent aortopathies in BAV patients may also increase the risk of aortic dissection and rupture during TAVR procedure [12,14–18]. TAVR has been showing promising performance in younger, low-risk patient cohorts including many types of BAV patients, and was recently approved by FDA and European Conformity for low-risk patients regardless of the aortic valve morphology [19–21]. While this expanded the use of TAVR in BAV officially, surgical community still considers SAVR to be the ideal treatment option for BAV patients [22]. In order to establish TAVR as a more acceptable treatment option for BAV patients globally, randomized clinical studies comparing TAVR with SAVR with long terms outcome in BAV patients, as well as in-depth analysis of post-TAVR complications in each BAV patient are necessary. This is particularly important for BAV patients because of their heterogeneous nature. According to a recent international multicenter study, TAVR in BAV is recommended to be avoided for high-risk phenotypes (calcified raphe with heavy leaflet calcification) [13]. A personalized pre-procedural planning could benefit those patients immensely by analyzing the feasibility of the procedure in their anatomies. It will also enable predicting potential post-TAVR complications and possibility of device failure in those patients.
Currently, PVL remains one of the common post-TAVR complications. A recent multicenter retrospective clinical study comparing TAVR performance between BAV and TAV patients has revealed that BAV patients tend to have higher rate of intra-procedural second device implantation, lower rate of device success rate and higher post-TAVR moderate-severe PVL [23]. In addition, self-expandable devices are found to be associated with higher incidence of PVL in BAV patients [16,23]. Post-TAVR PVL may eventually lead to life-threatening complications including heart failure, hemolytic anemia, increased left ventricular load, exacerbating mitral regurgitation and heart failure [24,25]. Structural and hemodynamic parameters which are often used by the clinicians for assessing the risk of PVL [25,26] are established based on the observations made on tricuspid patients. Complex anatomic features and inherently different leaflet structures in BAV patients may limit the applicability of these parameters to assess the risk of post-procedural PVL accurately in BAV patients, making it crucial to analyze the risk of PVL in them, especially when it comes to the decision of implanting a self-expandable device.
Constant clinical and engineering efforts (e.g., better assessment of the anatomy, improved device design etc.) are made in order to alleviate post-TAVR complications. Computational modeling is evidently a great supplement to these pre-procedural efforts and is reliable at predicting and mitigating post-TAVR complications using finite element (FE), computational fluid dynamics (CFD) and fluid-solid interaction (FSI) simulation techniques. Previous studies have shown that patient-specific TAVR modeling can be used to assess the deployment and anchorage of different TAVR devices, analyzing the effect of deployment height on PVL, the stress concentration on the native tissue and the risk of aortic root rupture, assessing the effect of calcium deposits on the TAVR outcome, and analyzing the post-TAVR hemodynamics [27–33]. However, studies focusing on patient-specific TAVR modeling in BAV are scant [34–37], which is a major motivation behind this work.
Another emerging technology is 3D printing which has a growing application in pre-procedural planning in the field of structural heart intervention research. However, the current patient-specific 3D printed modeling research lacks focus on BAV population and the amount of research conducted on patient-specific modeling of TAVR in BAV is not significant [38,39]. As most of the studies are focusing on either in-silico or in-vitro models, the relationship between the utility of these models remains underexplored. With growing popularity and having huge potentials to be an essential part of pre-TAVR planning tool, the level of agreement between the in-silico and in-vitro modeling warrants in-depth investigation, which is another major focus of the present study.
In the current study, we aimed to compare the results obtained from both the in-silico and in-vitro models both quantitatively and qualitatively, confirm the physics of our computational modeling using the in-vitro models and analyze the robustness and accuracy of each model. Our goal is to bridge the gap between the patient-specific in-silico and in-vitro models in order to maximize the benefit and minimize the complications of TAVR procedure in BAV patients by utilizing an engineering-driven personalized medicine approach.
Methods
We have developed patient-specific in-silico and in-vitro modeling of TAVR procedure in BAV patients using FE and 3D printed models. We have analyzed post-TAVR PVL complications in these models using CFD and flow study, investigated the device deformation in these models, and compared the in-silico and in-vitro results in order to verify their level of agreement. Clinical validation was performed in order to confirm the fidelity of each model. A visual summary of the current workflow has been provided in the supplementary material section (Supplementary figures 1 and 2).
In-silico: Patient Selection and Patient-specific Model Creation
Pre-TAVR Cardiac CT scans of three octogenarians (type 1) BAV patients were obtained from Rabin Medical Center (Israel) with the approval of the Stony Brook IRB protocol (522113). These patients had different degrees of post-TAVR PVL and all of them received 29 mm self-expandable TAVR devices (Medtronic plc, Minneapolis, MN, USA) (Patient 1 and 2 – CoreValve and patient 3 Evolut R).
DICOM (Digital Imaging and Communications in Medicine) images were segmented, and patient-specific surface meshes of the aortic lumen and calcium deposits were reconstructed using ScanIP (Synopsys, Mountain View, CA). Gaussian smoothing was applied to all the surface meshes in order to remove any unusual features resulting from the image artifacts. In order to create the BAV leaflets, patient-specific landmarks of the aortic root and the location of the calcium were used as guides to draw non-uniform rational basis splines (NURBS) which were used to define the leaflet topology. In order to avoid the overestimation of the calcium volume due to blooming artifact, calcium deposits were downscaled and then embedded within the native tissue [27] which resulted in fully shared nodes at the tissue-calcium interface. This allows to avoid computationally expensive tie-constraints between the tissue calcium interface during structural simulation and recreates a more realistic representation of the leaflet calcification. The leaflet generation, volume meshing and surface mesh preparation were performed using Meshmixer (Autodesk, Inc., San Rafael, CA), Rhinoceros (Robert McNeel & Associates, Seattle, WA), Ansys Spaceclaim, and Ansys Fluent meshing (Ansys, Inc. Canonsburg, PA). During the entire process, feature preservation options were carefully selected in order to maintain the patient-specificity of the models. The aortic lumen was modeled with shell elements, and the calcified leaflets were modeled with 3D tetrahedral elements. Aortic lumen has a mesh size of ~1mm, and calcium deposits and leaflets had a mesh size of ~0.3mm, which is similar to our previous study [27], and equivalent or finer than comparable models. The anatomical measurements of the finished models (e.g. aortic annular area-derived diameters) showed good agreement with the clinical measurements with the average difference of 1.17 % (ranged from 0.11 – 2.6%) between the clinical and in-silico (aortic annular diameter) measurements.
Native Tissue Material Properties
Due to limited availability of mechanical testing data of the BAV tissue, biaxial data from tricuspid population was used to define native tissue material property [40,41]. Stress and strain response in both radial and circumferential directions of the TAV specimens were averaged. In order to represent the fused cusps, the biaxial data of the corresponding cusps were further averaged. Average biaxial data was fitted to the isotropic hyperelastic third-degree Ogden strain energy function model [42]. According to a previous study, the mechanical response of this isotropic hyperelastic leaflet model is in agreement with the clinical data as well as with the mechanical response obtained from an anisotropic hyperelastic leaflet model [42]. Calcium deposits were modeled using linear elastic homogeneous isotropic material models (E =12.6 MPa, v = 0.3) [27].
TAVR Device Modeling
The geometric models of the self-expandable TAVR devices - 29mm CoreValve and Evolut R, were constructed for the FE simulations using an in-house MATLAB code and Ansys Spaceclaim. The CoreValve and the Evolut R stents meshes consisted of hexahedral elements, and the leaflets and the skirts consisted of shell elements. The stent was modeled using a super-elastic nitinol alloy material property utilizing a built-in VUMAT in Abaqus 2019 (Dassaut Systèmes Simulia Corp., Johnston, RI) [43]. The leaflets and skirts were assumed to be linear elastic, representing porcine pericardium tissue [28]. Both CoreValve and Evolut R were modeled on MATLAB based on Bézier curves. The stent, cuff and the leaflets were discretized with hexahedral, shell and membrane elements, respectively, in the similar way that was described in a previous study [36].
FE Simulation
A cylindrical catheter with cone-shaped tip was modeled in order to crimp and deliver the stent (Figure 1). A 4 steps FE simulation of TAVR procedure was performed, consisting of- stent crimping, insertion and positioning of the TAVR device in the aortic root, and finally the deployment of the TAVR device and its relaxation [44] (Figure 1). The desired implantation depth was obtained from clinical data. In the simulation, the implantation depth was defined by the distance between the intraventricular end of the stent and the annular plane [44]. The desired distance between the distal end of the stent and the annulus plane was maintained during the axial translation of the stent. The catheter was then slowly removed, allowing the stent to deploy into the aortic root. The final step provided the stent with enough time to conform around the native tissue and calcifications as to reach a stable post-deployment state. In a previous computational study, it was demonstrated that TAVR leaflet and skirt have a negligible effect on the stent deformation profile [45]. Hence, the leaflet and the skirt were not included in the structural analysis in order to reduce prohibitive computational costs and increase computational efficiency.
Figure 1:

Structural simulation of TAVR procedure in one of the in-silico patient-specific models (Patient 3). (a) Uncrimped 29mm Evolut R stent inside the catheter. (b) Fully crimped stent being delivered at the aortic root of the patient. (c) 50% of the deployment step. (d) Fully deployed stent inside the aortic root. (e) Leaflet calcium distribution in all the patients. The LVOT calcification in patient 2 and the massive leaflet calcification in patient 3 are circled in red
Mapping and Fluid Domain Extraction
The displacement field of the stent nodes was imposed on the leaflet and skirt, in order to obtain their final deformed state with the deployed stent. For the CFD simulation the internal volume of the deformed aortic root, valve, and deployed device was extracted as the fluid domain. The mapping, fluid domain extraction, meshing, and CFD model preparation were performed following similar protocols described in our previous study [28]. Fluid domain meshing was performed with ANSYS Fluent Meshing. Each model was meshed with polyhedral cells with the following region-specific size functions – prosthetic cuff - 0.1 mm, stent - 0.2 mm, prosthetic valve - 0.3mm, aortic lumen – 1.5mm. A higher mesh density was assigned to the aortic root region in order to increase the numerical accuracy of the resultant PVL flows. The feature extraction and the size functions were used accordingly in order to preserve the deformed shape of the TAVR leaflet and the skirt. This also minimizes alteration of the dominant PVL channel shapes and locations during CFD preparation. The inlet and outlet of the fluid domain, which consists of the ascending aortic and left ventricular outflow tract (LVOT) of the patient anatomy, were extended (by approximately 3 times the length of the aortic root diameter of the individual) with smooth transitions in order to avoid boundary effects on the flow field. The boundary of the fluid domain was assumed to be rigid. Since the focus of the CFD study was on the PVL generated during the diastolic flow phase, the TAVR leaflets were kept in their closed configuration [28].
CFD Simulation
In order to assess the PVL flows and their locations, a transient simulation with laminar flow was performed for three cardiac cycles using Ansys Fluent. A time step of 3ms was selected based on our previous time step sensitivity study [28]. Each fluid domain was discretized with ~ 3 million polyhedral cells. A time step of 0.003 s was selected which was finer than the step time from our previous analysis of similar models [28]. For each patient, the pressure boundary conditions were obtained from the in-vitro flow studies in the patient-specific models which are described later. For the diastolic flow analysis, the time-dependent pressure difference at the aortic side of the leaflets was used as boundary condition (Supplementary figure 2 and 3), and was applied at the aortic end while the pressure at the ventricular end was zero. The streamline visualization identified the major PVL channels and the regurgitation volume was calculated from the outlet flow rate data.
In-vitro validation of the Structural Simulation: 3D Printed Patient-specific Model Creation
In order to validate the deformation dynamics of the deployed TAVR device in the FE models, a 29 mm CoreValve device was deployed in patient-specific flexible 3D printed models. These models were created using a blend of flexible and rigid materials using overmolding process (Figure 2). The native tissue was made of a non-linear, elastomeric, rubberlike photopolymer, Agilus30 (Stratasys Ltd., Eden Prairie, MN). It has a shore hardness of 30 – 35 A and tensile strength of 2.4 – 3.1 MPa [46]. While it is strong enough to withstand repeated flexing and bending and has a high tear resistance, it is also flexible and well suited for precise modeling for complex anatomical parts like the human heart and vasculature, with intricate details. The calcium deposits were modeled using rigid material, VeroWhite, which was the substrate within the overmold [47]. It has an elastic modulus of 2,500 MPa with a shore hardness of 85 D [47]. The combination of these two materials renders a good representation of the physiological calcified aortic roots. The models were manufactured via Stratasys. A thin polyurethane coating (<100μm, 30A, Smooth-On Inc, Macungie, PA) was applied in order to enhance the durability of the native leaflets during the deployment. The thickness of the coat is assumed to be insignificant to change the material property of Agilus30.
Figure 2:

(a) Patient-specific flexible 3D printed model of one of the patient cases (Patient 1). The in-vitro model (b) was good representatives of the in-silico model (c). A self-expandable device (29mm CoreValve) (d) was manually deployed in the 3D printed models (e, f)
In-vitro Stent Deployment
A 29mm CoreaValve was manually deployed in the 3D printed models (Figure 2). X-ray and CT imaging (Artis Zeego, Siemens Medical Inc, Malvern, PA; voxel spacing 0.233 × 0.233 × 0.233 mm) was used to measure and visualize the deployment of the valve within the model. The model was briefly immersed in a solution of 20% contrast (Omnipaque 240, GE Healthcare, Chicago, IL) in order to distinguish the model and TAVR device surfaces, as well as to reduce the stent scatter.
Surface meshes of the deployed stent and lumen were created by segmenting the CT scans. In order to analyze post-TAVR device deformation in each patient anatomy, and compare the outcomes between the in-silico and in-vitro models, the device eccentricity index (EI = 1 − (Dmin/Dmax); Dmin = minimum diameter; Dmax = maximum diameter) was calculated at the annulus plane (Figure 3, plane A). In addition, the minimum and maximum diameter of the device was calculated on multiple planes (which were created by offsetting them from the annulus plane) at different levels of the aortic root (Figure 3, Planes P1 – P5 and A). In order to assess the correlation and the agreement between the in-silico and in-vitro device deformation, statistical analysis was performed on these dimensions. Pearson correlation and Bland-Altman analysis weries performed using SPSS Statistics 27 (SPSS Inc. Chicago. IL) to describe the correlation and agreement between each pair of corresponding diameter measurements (Table 1).
Figure 3:
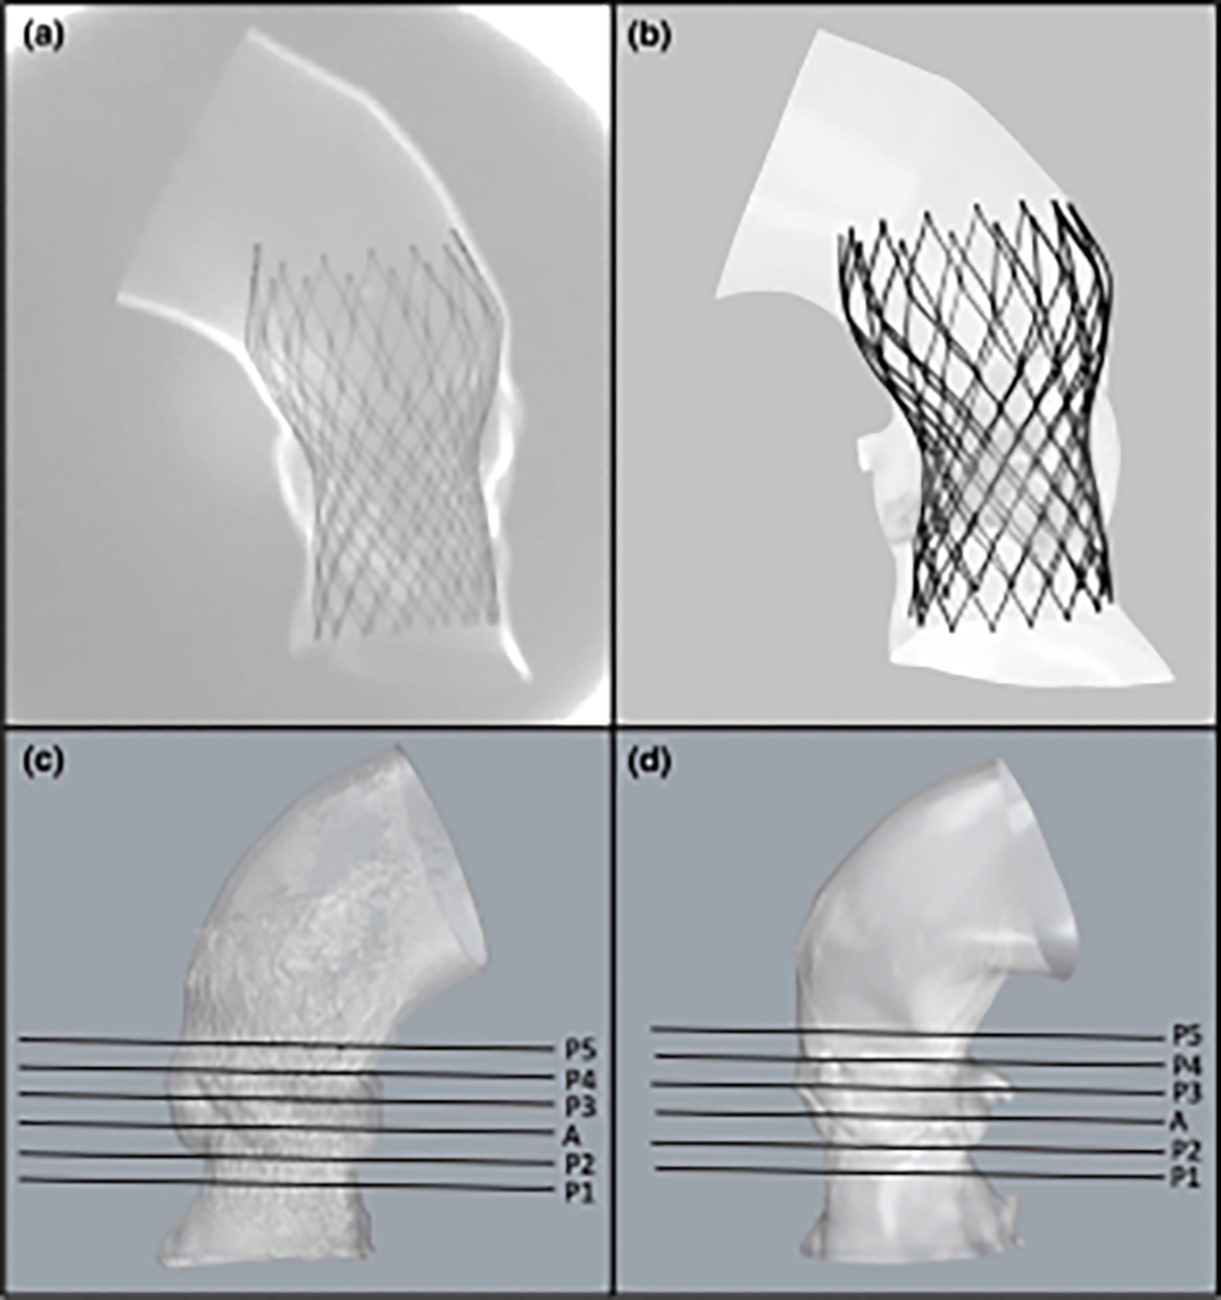
Comparing the device deployment and performing a two-way validation between the in-silico and in-vitro models. (a) X-Ray image of the flexible 3D printed model of one of the patient (Patient 2) aortic roots with the deployed TAVR device in it. (b) FE model of the same patient. (c) Patient-specific surface mesh reconstructed from the CT scans obtained from the 3D printed model. (d) Corresponding FE model. The device eccentricity and the minimum and maximum diameters of the device was calculated at the annulus plane A, and at multiple other planes, P1- P5, drawn at the same levels in both in-vitro and in-silico models (c, d)
TABLE 1.
Statistical analysis of the measurement difference between the in silico and the in vitro model diameters.
| Patients | Mean difference ± SD (mm) | Pearson correlation |
Overall mean difference, overall mean % difference | Overall Pearson correlation |
||
|---|---|---|---|---|---|---|
| Coefficient | p value | Coefficient | p value | |||
|
| ||||||
| Patient 1 | 0.97 ± 0.83 | 0.90 | 0.000078 | 0.40 ± 1.36, | 0.83 | < 0.001 |
| Patient 2 | − 0.18 ± 1.33 | 0.82 | 0.000980 | 5.17 ± 3.05 | ||
| Patient 3 | 0.41 ± 1.65 | 0.86 | 0.000334 | |||
In-vitro validation of the CFD Simulation: 3D Printed Patient-specific Model Creation
As a part of the in-vitro validation of the CFD simulations, in-vitro flow study was performed using patient-specific 3D printed models with the deployed self-expandable TAVR device in them. These models were printed in rigid material in order to mimic rigid flow boundaries in CFD. The deformed aortic root surface meshes were incorporated in a surface mesh of a 3D part (Figure 4) that was designed to fit the left heart simulator (Vivitro Labs Inc, Victoria, BC). The custom rigid 3D part (Clear V4 resin, Formlabs, Somerville, MA) was then printed and placed within the left heart simulator. The 29mm CoreValve was then placed in each aortic root model while maintaining the same device orientation that was observed in the corresponding FE model (Figure 4).
Figure 4:

(a) Custom patient-specific 3D printed rigid model of one of the patients (Patient 1), designed to fit the left-heart simulator, the patient-specific aortic root region is highlighted in the zoomed in part. (b) A 29mm CoreValve device manually deployed in the model. (c) The orientation of the device was adjusted according on the FE model. (d) The left heart simulator used in our flow study
In-vitro Hydrodynamic Study
The hydrodynamics study was performed using the left heart simulator (Figure 4) capable of recreating various physiological flow conditions while controlling the peripheral resistance and compliance. A blood analog fluid (50.3% Glycerol, 0.9% NaCl and 48.8% double distilled water, dynamic viscosity, μdynamic = 3.5 cP, density, ρ = 1100 kg/m3 ) at 37°C was used for the flow study [48]. For each patient case, flow data were collected under the following physiological condition - heart rate of 60 bpm, cardiac output of 5 L/min, and mean aortic pressure of 100 mmHg. The flowrate and the pressure waveform were obtained for 10 cycles, which were then averaged in order to obtain the flow data of 1 cardiac cycle. Leak and closing volumes were distinguished according to the ISO 5840–3 standard [49]. As the TAVR leaflets were in closed configuration, in order to avoid the backflow of the through the PVL channels during systolic phase of the CFD simulations, averaged in-vitro pressure waveforms (Supplementary figure 3) were modified by setting the systolic part of the pressure waveform curves to zero. These modified waveforms were then used as the pressure boundary conditions in the CFD simulations (Supplementary figure 2) , which is critical since the larger leak flows will impact the resulting diastolic aortic and ventricular pressures.
Confirmation of PVL Degree and Location Using Clinical Data:
PVL data obtained from the in-silico patient-specific models were compared to the post-TAVR echo-Doppler data obtained from the same patients immediately after the procedure, in order to assess the validity of these computational models. The location of the leak channels and the degree of PVL determined from the leak volume were compared to the clinical data and PVL degree which was based on the 5 class grading system [50], and demonstrated an overall good agreement. The routine echo-Doppler imaging modality lacks the ability to provide adequate information on the actual leak volume. In addition accuracy of the leak locations obtained from this imaging modality is limited. Not only the in-silico models could provide the leak volume, they could also highlight the origin and the flow path of every leak channel in detail.
Results
Since this study involves four unique simulations of the various aspects of the TAVR procedure, each with its own distinct parameters, assumptions and outputs, the following section compares the results of each model and the complementary nature of the data each provides. The goal is to determine the strengths of each model as well as the validity of each at capturing the complex physics and behaviors of the TAVR procedure in the BAV anatomy.
In-silico Device Anchorage Analysis
In order to analyze the device anchorage and the interaction between the device and the native leaflets, contact force and area were calculated based on a method that was previously established [27] (Figure 5). A similar trend was noticed in the anchorage area and force graph of all the patient cases (Figure 5). During the crimping phase (0 – 0.1s) there is no contact between the stent and the aortic root. During the insertion phase (0.1 – 0.2 s), with the catheter and the stent coming in contact with the aortic root, there is a rapid increase in anchorage force and area which stabilizes by the end of this phase. As the catheter is pulled out during the deployment phase (0.2 – 0.4 s) the interaction of the deployed device with the aortic root increases the contact area between the stent and the aortic root and native leaflets- resulting in increasing the contact force. After deployment, the device and the tissue conform around each other, which stabilizes their interaction- leading to the contact force and area graphs reaching a plateau during the relaxation phase (0.4 – 0.6 s). Patient 1 had the maximum contact area and the minimum contact force. Patient 2 and patient 3 had the maximum contact force and the minimum contact area, respectively [51] (Figure 5).
Figure 5:

(a, b) Assessment of the anchorage of a 29mm CoreValve in all the in-silico patient models by analyzing the anchorage area (a) and anchorage force (b). (c) The in-silico and in-vitro device eccentricity index at the annulus level was compared
Comparing device deformation between the in-vitro and in-silico models
Both in-silico and in-vitro models displayed the same trend of EI at the annulus with equivalent EI values. Patient 3 had the least circular device profile (highest EI value) at the annulus level, whereas patient 1 had the most circular device profile (lowest EI value) (Figure 5). The mean differences between the diameters ranged from −0.18±1.33 mm (patient 2) to 0.97±0.83 mm (patient 1) (Table 1), with an overall mean difference of 0.40±1.36 mm between the in-silico and in-vitro measurements. More information on the differences between in-silico and in-vitro model diameters is provided in the supplementary material section (Supplementary table 1).
Pearson correlation coefficients indicated a significant positive correlation between the measurements not only in each patient case (0.82 – 0.90) but also between the overall in-silico and in-vitro measurements (0.83) (Table 1). Bland-Altman plot indicated that majority of the measurements remained within the upper and lower limit of agreement (Upper LOA and Lower LOA) which were defined by the mean difference + 1.96 standard deviation and mean difference - 1.96 standard deviation, respectively [51] (Figure 6).
Figure 6:

Bland-Altman plot analyzing the level of agreement between the in-silico and in-vitro measurements. The upper and lower limit of agreement (Upper LOA and lower LOA) were defined by the mean difference ± 1.96 standard deviation
Visual analysis of the deformed models indicated good agreement between the in-silico and in-vitro aortic root deformation (Figure 7). The overlays of the devices indicated that as they reached the stable state after deployment, the final configurations of the corresponding in-silico and in-vitro models were in agreement. Manual alignment was needed to adjust the in-vitro segmented models into overlay positions of the in-silico models.
Figure 7:

Comparing the 29mm CoreValve deployment profile in all the in-vitro and in-silico patient models; (1st and 2nd column) Lateral views and (3rd and 4th column) top views of the patient-specific FE and 3D printed models at the end of the deployment. (5th column) Overlay of the deformed devices obtained from the in-silico (black) and in-vitro (yellow) models
Analyzing PVL Location and Severity in Each Patient Case and its Clinical Validation
Velocity streamlines, which depict the hemodynamics at peak diastolic transvalvular pressure gradient (at approx. 35% of the cardiac cycle) in all cases, were used to analyze the location of the PVL (Figure 8). This peak diastolic point represents the established PVL flow and the PVL flow tended to only decrease in velocity over the rest of the cardiac period.
Figure 8:

CFD results of the TAVR simulation based on the devices that these patients originally received in order to perform clinical validation. (1st and 2nd column). Velocity streamlines through the patient-specific aortic root depicting the course and origin of the PVL flow jets from two different angles. (3rd column) Freeze frames from the post-TAVR echo-Doppler color flow videos, indicating the location of the PVL jets in the patients
In patient 1, two prominent PVL channels were found near the fused cusp (non-coronary and left coronary cusps). While the larger leak was located near the belly region of the fusion site, the smaller leak was located at the level of the attachment region of the left cusp, closer to the right cusp. The location of these leak channels was consistent with the echo-Doppler findings in which, leaks were also observed near the fused cusp (Figure 8). Velocity streamlines indicated higher PVL severity in patient 2, as multiple leak channels were identified near the left and non-coronary leaflet in this patient, with two leaks located along the attachment region between the non-coronary and the left coronary leaflets. Another two (a large and a minor) leak channels originated near the non-coronary leaflet attachment region, closer to the calcium deposit, and directly flowed down into the LVOT. (Figure 8). The locations of these regurgitant jets were consistent with the echo-Doppler data which, PVL jets were also spotted near the left side of the fused leaflet and the non-coronary leaflet (Figure 8). Multiple minor leak channels were found near the left and the non-coronary leaflets in patient 3. One of them was located near the attachment region of the non-coronary leaflet, and the rest of them were located at different levels between the left and the non-coronary leaflets (Figure 8). Again, the echo-Doppler data of this patient is also consistent with the in-silico findings as they showed the location of minor PVL leaks near the non-coronary and the left coronary leaflets (Figure 8).
Comparison of total regurgitant volumes indicated that patient 2 had the highest leak severity, with a regurgitant volume of 26.4 mL/beat (Figure 8). According to the 5 class grading system [50], it falls within the mild-moderate range, which is consistent with the clinical grading. Patient 3 exhibited a leak volume of 1.1 ml/beat which corresponds to the very mild leak severity and is also consistent with the clinical data. Patient 2 leak volume indicated a slight over-estimation as it is located towards the lower end of the mild-moderate severity, whereas the clinical data indicate a mild leak severity (Figure 8).
In-vitro PVL Flow Analysis and Comparison to In-silico Results
In-vitro and in-silico flow data exhibited similar trends in PVL flowrate and the regurgitant volume (Figure 9). Patient 2 had the highest regurgitant volume and flowrate and patient 3 had the lowest volume and flow rate both in-vitro and in-silico models. A consistent increase of approximately 22 ml/beat was noticed in the in-vitro flowrate and leak volumes compared to the in-silico results.
Figure 9:
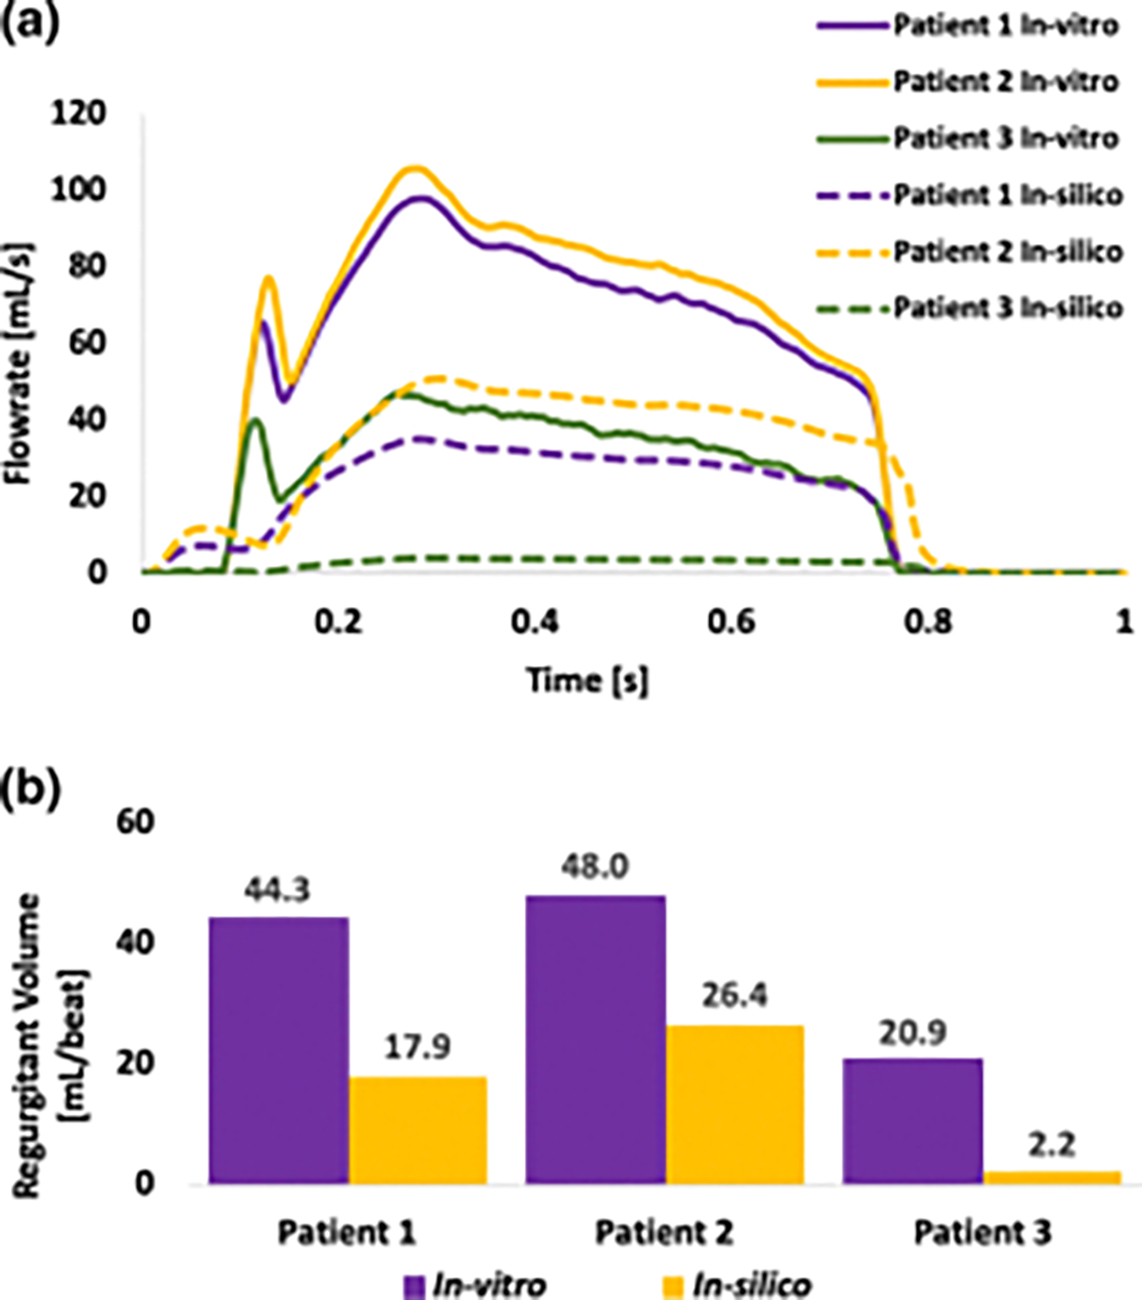
(a) In-silico and in-vitro flowrates in all patients during one cardiac cycle. (Since the focus of our study was to analyze PVL flow during diastole, the original in-vitro flowrates obtained from the hydrodynamic studies were modified by setting the flowrates at the systolic parts to zero) (b) In-silico and in-vitro regurgitant volumes which were calculated by integrating the area under the flowrate curve during diastolic phase
Discussion
We have developed a workflow that allows patient-specific in-silico and in-vitro modeling of TAVR procedure and assessment of the interaction between the TAVR device and the aortic root. In summary, we analyzed the device anchorage in the in-silico models, performed quantitative and qualitative comparisons of the device deformation in the in-silico and in-vitro models. We also performed in-vitro flow studies on the rigid 3D printed models, performed CFD simulations, and compared the in-silico and in-vitro flowrates. We additionally analyzed the post-TAVR PVL degree and its location in each patient and compared them to the clinical data for validation. Overall, this study creates a complementary relationship between the in-silico and the in-vitro models where each model is enriching the workflow with a new set of information.
Post-TAVR device deformation can be affected by factors including aortopathies and structural features of the aortic root, the volume and the location of the calcifications, and the deployment parameters. BAV patients tend to have eccentric device deployment due to their inherently thicker leaflets, abnormal cusp fusion, and severe and asymmetric leaflet calcification patterns. In the current patient-specific cases, the location of the calcium deposits had an impact on the device deformation. For instance, in patient 3, a massive calcium deposit was located on the non-coronary leaflet (Figure 1) which prevented the device from pushing against the leaflets and create a more circular opening. This resulted in a highly eccentric device deployment and highest EI value at the annulus of patient 3 (Figure 5). In patient 2 there was no heavy focal calcification, however, some calcium deposits were located on the aortic lumen, extending towards the LVOT region (Figure 1). Annular calcification impacts the proper tissue-device interaction, and in this patient case, this resulted in an eccentric device deployment. In patient 1, calcium deposits were distributed throughout the leaflets more symmetrically. However, there was no LVOT calcification or heavy accumulation of leaflet calcification, which resulted in the lowest device eccentricity at the annulus of patient 1 (Figure 5). The degree and location of the aortic root calcifications is also an important factor that impacts post-TAVR complications including PVL and conduction abnormality [52]. While some degree of calcification is believed to be necessary for the device anchorage, asymmetric accumulation and a presence of a single larger calcium deposit on a single leaflet may lead to more or exacerbated complications. This is further supported by the clinical data of patient 3, who had a substantial non-coronary cusp calcification and developed post-TAVR conduction abnormality. The highly elliptical device may have created higher strain near the interleaflet triangular region in the LVOT, which is adjacent to the left bundle branch and may lead to left bundle branch block, whereas the other two patients did not develop any conduction abnormalities. In terms of PVL location and severity, patient 1 and 2 had the worst PVL outcomes compared to patient 3. Comparing the two older generation self-expandable device cases (patient 1 and 2), we can see that in patient 1, majority of the calcium deposits were located near the free leaflet edge (Figure 1). In contrast, in patient 2, the calcium deposit on the noncoronary leaflet originated near the free leaflet edge and extended ventricular (Figure 1). Calcifications near the free edge of a leaflet as well as in the LVOT may interfere with the TAVR device expansion and its interaction with the native tissue, which may create inadequate sealing between the device and the tissue and worsen PVL. This explains the highest degree of PVL in patient 2. Contrarily, in patient 3, who had the least PVL severity, there was no calcification in the LVOT region (Figure 1, 9). In addition, patient 3 received a newer generation self-expandable device which also explains its better PVL performance in this patient. Previous studies have demonstrated relationships between landing zone calcification and PVL severity, especially for the self-expandable devices [26,28,33]. However, considering the heterogenic nature of the BAV anatomy, calcification degree and pattern, this relationship should be analyzed in each BAV patient, individually.
The difference in annulus size across the patients may also have impacted the device deformation, annulus level EI index as well as anchorage data. Patient 1 had a larger annulus (27mm) and more symmetric distribution of leaflet calcification as compared to the other two patients (Patient 2 – 24.8mm, Patient 3 – 24.4mm). Hence, a 29mm TAVR device had more space for deployment and was highly likely to achieve a deployment profile that is more circular compared to that of patient 2 and 3. In addition, a larger annulus provided more area for device anchorage, which resulted in the highest anchorage area, but the weakest anchorage force compared to the other two patients (Figure 5). On the contrary, in patient 2 and 3 who had the smaller annuli, the same 29mm TAVR device had less space and more resistance to its deployment, which resulted in lower anchorage areas but stronger device anchorage (Figure 5). The annular calcification appeared to enhance the device anchorage in patient 2, resulting in the highest anchorage force in this patient.
The minimum and maximum diameter measurements obtained from the in-silico and in-vitro models reflected a high degree of correlation (Table 1). In addition, they were in close agreement as the mean measurement difference was only 0.40 mm with a 95% limit of agreement of 2.67 mm (Figure 6). The accuracy of our models is depicted by the overall mean difference between the in-silico and in-vitro measurements, which is 0.40±1.36 mm. According to a systematic review on the use of 3D printed models in congenital heart disease, very few studies have performed quantitative analysis of the accuracy of the models [53]. The mean difference of the measurements from 3D printed congenital heart disease models which were reported previously on the literatures ranged from 0 mm to 0.4 ± 0.9mm [51], which was reported based on the models that are made of different material properties and measurements that were obtained in different ways. Currently, the overall mean difference of the measurements of our models remains within a range that is close to previously reported ranges of data and is considered to be highly accurate.
Currently, many new technologies including the in-vitro and in-silico models are being used in the field of structural heart intervention, without any of them being proven superior compared to the others. Our goal is to show the capability and strength of each of these tools and how they complement each other. These tools are complementary in the sense that each of them can address questions or inquiries that the other cannot. The computational models can provide detailed numerical information about the degree and location of the PVL, the degree of device deformation, the performance of different devices, and more. However, this comes at the cost of heavy computational resources and time-consuming experiments. On the other hand, the in-vitro models can give further physical validation to its “digital twin” in-silico models. They may further facilitate clinicians by helping them perform hands-on training, improve their deployment strategies, and study challenging patient cases in a clinical setting, combined with advanced imaging modalities [48]. While in-vitro models cannot provide fine-grained information as the in-silico models, their production cost is cheaper than the cost involves in performing the in-silico analysis. Also, the process of obtaining in-depth image of the patient anatomy from these in-vitro models is faster than in-silico analysis. In terms of deciding which one (or if both tools) would be used during pre-procedural planning, it would depend on the judgment of the physicians as well as the individual patient case.
The Bland-Altman analysis indicated an excellent agreement between the in-silico and in-vitro data set. Previous researches simply reported the statistics, lacked focus much on what would be an acceptable limit of agreement between the in-silico and in-vitro models [51]. However, in comparison with the previously reported data, the agreements between the current in-silico and in-vitro models are acceptable, confirming the accuracy of these models.
Challenges and Limitations
Despite showing promising results and close agreement between in-silico and in-vitro device deformation, current study was associated with a number of potential limitations and challenges. The major limitation of this study was the overestimating nature of the in-vitro rigid models. Clinically, the small PVL jets originating between the stent cells may regress over the first 5–10 minutes post-implantation [54]. This may occur as TAVR device gradually conforms around the native aortic root and seals smaller PVL gaps. While these minuscule gaps may often get resolved due to the tolerance (0.01 mm) used during in-silico model preparation, they continue to exist in the in-vitro models, exacerbating the PVL volume in each model. The effect of these small gaps appeared to be almost constant in all patients as all the corresponding in-vitro and in-silico regurgitant volumes differed by ~ 22 ml/beat.
Despite being flexible and hyperelastic, there were inherent differences between the in-vitro and in-silico material properties. The rubberlike Agilus30 is stiffer and less flexible compared to hyperelastic 3rd degree Ogden model which is defined according to the native tissue mechanical testing data. In addition, the in-vitro calcium deposits were much stiffer than that of in-silico calcium deposits (E = 2500 MPa vs. 12.6 MPa) which explains the measurement discrepancy observed between the models. Furthermore, the in-vitro and in-silico material properties are not fully capable of capturing the complex hyperelastic anisotropic behavior of the native tissue material, which adds another limitation to this study.
In terms of comparing the clinical and in-silico PVL data, a slight overestimation was noticed in patient 1 data. Based on clinical observations, this patient had a mild PVL (<15 ml/beat according to the 5-class grading system [50]). The in-silico volume was slightly higher (17.9 ml/beat), which is on the lower end of the mild-moderate severity. This difference is likely attributed to the 2D nature of the imaging modality which limits tracing the origin and flow paths of the PVL jets, thus leading to inaccurate estimation of PVL severity. The lack of clinical information on the post-deployment device orientation and positioning of the TAVR device may also be responsible for this discrepancy. Difference in device orientation may vary PVL values observed clinically, and can be quantified by using additional computational modeling. Hence, performing a computational study with precise control over device position could significantly help in pre-procedural planning, identifying the optimal device position for the TAVR devices, and mitigating PVL severity.
As described earlier, BAV is associated with morphological variations in leaflet structure, fusion and calcification. While these variations are suspected to impact the outcomes on the TAVR procedure, there is a lack of sufficient research on this topic. In order to avoid introducing additional variables, we only focused on one BAV subtype (Sievers type 1 [11]) as well as on one TAVR device type in our current workflow. However, in order to increase the applicability of our current workflow to more BAV patients, future studies will include additional patients with more BAV subtypes and other TAVR devices.
Conclusion
The goal of our study was to present a complementary in-silico and in-vitro approach that can improve interventional planning of TAVR procedures in BAV patients in order to maximize the benefit and minimize the complications unique to these patients by utilizing an engineering-driven personalized medicine approach. We compared qualitatively and analyzed quantitatively the results obtained from in-silico and in-vitro patient-specific models and confirmed the physics of the computational modeling using the in-vitro models, in order to establish the robustness and accuracy of these complementary modeling approaches.
In conclusion, the current study may pave the way for a patient-specific TAVR modeling workflow that combines in-vitro and in-silico modeling techniques and uses these as complement to each other. We demonstrate how patient-specific 3D printed aortic root models can be used to visualize TAVR device deformation, assess the degree of eccentricity and PVL, and provide complementary information to the in-silico modeling that offers additional insight to the pre-procedural planning. The comparison between these complementary modeling approaches increases their reliability by addressing limitations and challenges associated with current validation approaches that mostly rely on comparison between numerical simulations and clinical visualization modalities that lack the resolution needed for substantial validation. This extra layer of validation is likely to increase the level of clinicians’ confidence in using integrated enhanced modeling for pre-procedural planning. It may offer an affordable diagnostic aid for enhancing the pre-procedure planning toolkit available to clinicians for mitigating peri-procedural and post-procedural complications in BAV patients undergoing a TAVR procedure.
Supplementary Material
Supplementary table 1: The mean percent difference values of minimum and maximum diameters for each in-vitro – in-silico model comparison
Supplementary figure 1: Flowchart demonstrating the in-vitro validation of the structural simulation. After performing the FE simulation of TAVR procedure (a), flexible patient-specific aortic root models (b) were created and an actual TAVR device (c) was deployed in each model (d). CT scan and X-Ray were performed on the in-vitro models to capture the in-vitro device deformation and perform qualitative comparison with the in-silico data (e). Device eccentricity information was quantified at different level in both in-vitro (f) and in-silico (g) models and the results were compared. Device anchorage was analyzed in-silico.
Supplementary figure 2: Flowchart depicting the relationship between the in-vitro hydrodynamic study and the in-silico CFD study. The deformed aortic roots obtained from the FE simulation (a) were used to create patient-specific rigid parts (b) for the left heart simulator, and an actual TAVR device was deployed in these models manually (c). The in-vitro device orientations were matched with the in-silico ones (d). Hydrodynamic study was performed using left heart simulator (e), and in-vitro flowrates (f) were obtained in order to calculate the in-vitro regurgitant volume. Transaortic pressure gradients were obtained from the in-vitro flow study (g). In order to avoid the backflow of the through the PVL channels during systolic phase, transvalvular pressure at the systolic part of the pressure waveform curve was set to 0, and the modified waveform (h) was then used as boundary conditions in the CFD simulations (i). The PVL flowrates were calculated in-silico (j) and compared with the in-vitro data. Clinical validation of the in-silico PVL data was performed by comparing the degree and location of the PVL to the clinical data (Echo doppler color flow and PVL grading).
Supplementary figure 3: Transaortic pressure gradient obtained from the in-vitro hydrodynamic study
Acknowledgements
We would like to thank the SeaWulf supercomputer at the Institute for Advanced Computational Science at Stony Brook University for providing computational resources. ANSYS and the Dassault Systèmes Simulia Living Heart Project are in academic partnerships with Prof. Danny Bluestein.
Sources of Funding
This project was supported by NIH-NIBIB U01EB026414 (DB).
Glossary of Abbreviations and Acronyms
- BAV
Bicuspid aortic valve
- CFD
Computational fluid dynamics
- FDA
Food and drug administration
- FE
Finite element
- LCL
Left coronary leaflet
- LOA
Limit of agreement
- LVOT
Left ventricular outflow tract
- NCL
Non-coronary leaflet
- PVL
Paravalvular leak
- RCL
Right coronary leaflet
- SAVR
Surgical aortic valve replacement
- TAVR
Transcatheter aortic valve replacement
Footnotes
Conflict of Interest
Author DB has an equity interest in PolyNova Cardiovascular Inc. Author BK is a consultant of Polynova Cardiovascular Inc. All the other authors have no conflict of interest.
Declarations
Ethical Approval and Informed Consent
All procedures involving human participants were in accordance with the ethical standards of the responsible committee on human experimentation (institutional and national research) and with the Helsinki Declaration of 1975, as revised in 2000. A waiver of consent was approved by the Stony Brook Committee on Research in Human Subjects (CORIHS-2013-2357-F) and Rabin Medical Center Helsinki Committee (0636-16-RMC) for retrospective collection of de-identified patient images. No animal studies were carried out by the authors for this article.
IRB approval: 2013-2357-R5, 2/10/2021
References
- 1.Braverman AC et al. The bicuspid aortic valve. Current problems in cardiology 30, 470–522, doi: 10.1016/j.cpcardiol.2005.06.002 (2005). [DOI] [PubMed] [Google Scholar]
- 2.Losenno KL, Goodman RL & Chu MWA Bicuspid Aortic Valve Disease and Ascending Aortic Aneurysms: Gaps in Knowledge. Cardiology Research and Practice 2012, 145202, doi: 10.1155/2012/145202 (2012). [DOI] [PMC free article] [PubMed] [Google Scholar]
- 3.Ward C Clinical significance of the bicuspid aortic valve. Heart 83, 81, doi: 10.1136/heart.83.1.81 (2000). [DOI] [PMC free article] [PubMed] [Google Scholar]
- 4.Ram D et al. Concepts of Bicuspid Aortic Valve Repair: A Review. The Annals of Thoracic Surgery 109, 999–1006, doi: 10.1016/j.athoracsur.2019.09.019 (2020). [DOI] [PubMed] [Google Scholar]
- 5.Kong William KF, Delgado V & Bax Jeroen J Bicuspid Aortic Valve. Circulation: Cardiovascular Imaging 10, e005987, doi: 10.1161/CIRCIMAGING.117.005987 (2017). [DOI] [PubMed] [Google Scholar]
- 6.Yıldırım AI & Karaağaç AT in Structural Insufficiency Anomalies in Cardiac Valves (ed Kirali Kaan) (InTech, 2018). [Google Scholar]
- 7.Dutta P & Lincoln J Calcific Aortic Valve Disease: a Developmental Biology Perspective. Current Cardiology Reports 20, 21, doi: 10.1007/s11886-018-0968-9 (2018). [DOI] [PMC free article] [PubMed] [Google Scholar]
- 8.Chakravarty T et al. Subclinical leaflet thrombosis in surgical and transcatheter bioprosthetic aortic valves: an observational study. The Lancet 389, 2383–2392, doi: 10.1016/S0140-6736(17)30757-2 (2017). [DOI] [PubMed] [Google Scholar]
- 9.Davlouros PA, Mplani VC, Koniari I, Tsigkas G & Hahalis G Transcatheter aortic valve replacement and stroke: a comprehensive review. J Geriatr Cardiol 15, 95–104, doi: 10.11909/j.issn.1671-5411.2018.01.008 (2018). [DOI] [PMC free article] [PubMed] [Google Scholar]
- 10.Rotman OM, Bianchi M, Ghosh RP, Kovarovic B & Bluestein D Principles of TAVR valve design, modelling, and testing. Expert review of medical devices 15, 771–791, doi: 10.1080/17434440.2018.1536427 (2018). [DOI] [PMC free article] [PubMed] [Google Scholar]
- 11.Sievers H-H & Schmidtke C A classification system for the bicuspid aortic valve from 304 surgical specimens. The Journal of Thoracic and Cardiovascular Surgery 133, 1226–1233, doi: 10.1016/j.jtcvs.2007.01.039 (2007). [DOI] [PubMed] [Google Scholar]
- 12.Tchetche D et al. Bicuspid Aortic Valve Anatomy and Relationship With Devices: The BAVARD Multicenter Registry. Circulation. Cardiovascular interventions 12, e007107, doi: 10.1161/circinterventions.118.007107 (2019). [DOI] [PubMed] [Google Scholar]
- 13.Yoon SH et al. Bicuspid Aortic Valve Morphology and Outcomes After Transcatheter Aortic Valve Replacement. J Am Coll Cardiol 76, 1018–1030, doi: 10.1016/j.jacc.2020.07.005 (2020). [DOI] [PubMed] [Google Scholar]
- 14.Ben-Dor I & Stewart A A Cautionary Tale of 2 Leaflets. Journal of the American College of Cardiology 69, 2590–2591, doi: 10.1016/j.jacc.2017.03.573 (2017). [DOI] [PubMed] [Google Scholar]
- 15.Makkar R, Chakravarty T & Jilaihawi H Transcatheter Aortic Valve Replacement for Bicuspid Aortic Stenosis: Are We Ready for the Challenge?*. Journal of the American College of Cardiology 68, 1206–1208, doi: 10.1016/j.jacc.2016.06.042 (2016). [DOI] [PubMed] [Google Scholar]
- 16.Mangieri A et al. Balloon Versus Self-Expandable Valve for the Treatment of Bicuspid Aortic Valve Stenosis. Circulation: Cardiovascular Interventions 13, e008714, doi:doi: 10.1161/CIRCINTERVENTIONS.119.008714 (2020). [DOI] [PubMed] [Google Scholar]
- 17.Saad M, Seoudy H & Frank D Challenging Anatomies for TAVR—Bicuspid and Beyond. Frontiers in Cardiovascular Medicine 8, doi: 10.3389/fcvm.2021.654554 (2021). [DOI] [PMC free article] [PubMed] [Google Scholar]
- 18.Yoon S-H & Makkar RR TAVR for Severe Bicuspid Aortic Valve Stenosis. American College of Cardiology (2018). [Google Scholar]
- 19.Hussein RW, M.; Bapat V; Nazif TM TAVR for Bicuspid Aortic Valve Disease, <https://citoday.com/articles/2020-mar-apr/tavr-for-bicuspid-aortic-valve-disease> (2020). [Google Scholar]
- 20.Malaisrie SCMP, TAVR M for Bicuspid Aortic Valves: Is Surgery Still the Gold Standard? American College of Cardiology (2019). [Google Scholar]
- 21.Vincent F et al. Transcatheter Aortic Valve Replacement in Bicuspid Aortic Valve Stenosis. Circulation 143, 1043–1061, doi: 10.1161/circulationaha.120.048048 (2021). [DOI] [PubMed] [Google Scholar]
- 22.O’Riordon M Positive Early Data for TAVR in Low-Risk Patients With Bicuspid Valves, <https://www.tctmd.com/news/positive-early-data-tavr-low-risk-patients-bicuspid-valves> (2020).
- 23.Halim SA et al. Outcomes of Transcatheter Aortic Valve Replacement in Patients With Bicuspid Aortic Valve Disease. Circulation 141, 1071–1079, doi:doi: 10.1161/CIRCULATIONAHA.119.040333 (2020). [DOI] [PubMed] [Google Scholar]
- 24.Keshavarz-Motamed Z et al. Mixed Valvular Disease Following Transcatheter Aortic Valve Replacement: Quantification and Systematic Differentiation Using Clinical Measurements and Image-Based Patient-Specific In Silico Modeling. Journal of the American Heart Association 9, e015063, doi: 10.1161/JAHA.119.015063 (2020). [DOI] [PMC free article] [PubMed] [Google Scholar]
- 25.Conte SM et al. Plugging Paravalvular Leak in Transcatheter Aortic Valves. JACC: Case Reports 1, 696–702, doi: 10.1016/j.jaccas.2019.10.013 (2019). [DOI] [PMC free article] [PubMed] [Google Scholar]
- 26.Mauri V et al. Impact of device landing zone calcification patterns on paravalvular regurgitation after transcatheter aortic valve replacement with different next-generation devices. Open Heart 7, e001164, doi: 10.1136/openhrt-2019-001164 (2020). [DOI] [PMC free article] [PubMed] [Google Scholar]
- 27.Bianchi M et al. Effect of Balloon-Expandable Transcatheter Aortic Valve Replacement Positioning: A Patient-Specific Numerical Model. Artif Organs 40, E292–e304, doi: 10.1111/aor.12806 (2016). [DOI] [PMC free article] [PubMed] [Google Scholar]
- 28.Bianchi M et al. Patient-specific simulation of transcatheter aortic valve replacement: impact of deployment options on paravalvular leakage. Biomechanics and Modeling in Mechanobiology 18, 435–451, doi: 10.1007/s10237-018-1094-8 (2019). [DOI] [PMC free article] [PubMed] [Google Scholar]
- 29.Bosi GM et al. A validated computational framework to predict outcomes in TAVI. Scientific Reports 10, 9906, doi: 10.1038/s41598-020-66899-6 (2020). [DOI] [PMC free article] [PubMed] [Google Scholar]
- 30.de Jaegere P et al. Patient-Specific Computer Modeling to Predict Aortic Regurgitation After Transcatheter Aortic Valve Replacement. JACC: Cardiovascular Interventions 9, 508–512, doi: 10.1016/j.jcin.2016.01.003 (2016). [DOI] [PubMed] [Google Scholar]
- 31.Qin T et al. The role of stress concentration in calcified bicuspid aortic valve. Journal of The Royal Society Interface 17, 20190893, doi: 10.1098/rsif.2019.0893 (2020). [DOI] [PMC free article] [PubMed] [Google Scholar]
- 32.Wang Q, Kodali S, Primiano C & Sun W Simulations of transcatheter aortic valve implantation: implications for aortic root rupture. Biomechanics and modeling in mechanobiology 14, 29–38, doi: 10.1007/s10237-014-0583-7 (2015). [DOI] [PMC free article] [PubMed] [Google Scholar]
- 33.Mao W, Wang Q, Kodali S & Sun W Numerical Parametric Study of Paravalvular Leak Following a Transcatheter Aortic Valve Deployment Into a Patient-Specific Aortic Root. J Biomech Eng 140, 1010071–10100711, doi: 10.1115/1.4040457 (2018). [DOI] [PMC free article] [PubMed] [Google Scholar]
- 34.Anam SB et al. Assessment of Paravalvular Leak Severity and Thrombogenic Potential in Transcatheter Bicuspid Aortic Valve Replacements Using Patient-Specific Computational Modeling. Journal of Cardiovascular Translational Research, doi: 10.1007/s12265-021-10191-z (2021). [DOI] [PMC free article] [PubMed] [Google Scholar]
- 35.Dowling C, Firoozi S & Brecker SJ First-in-Human Experience With Patient-Specific Computer Simulation of TAVR in Bicuspid Aortic Valve Morphology. JACC: Cardiovascular Interventions 13, 184–192, doi: 10.1016/j.jcin.2019.07.032 (2020). [DOI] [PubMed] [Google Scholar]
- 36.Lavon K et al. Biomechanical modeling of transcatheter aortic valve replacement in a stenotic bicuspid aortic valve: deployments and paravalvular leakage. Medical & biological engineering & computing 57, 2129–2143, doi: 10.1007/s11517-019-02012-y (2019). [DOI] [PMC free article] [PubMed] [Google Scholar]
- 37.Pasta S et al. Simulation study of transcatheter heart valve implantation in patients with stenotic bicuspid aortic valve. Med Biol Eng Comput 58, 815–829, doi: 10.1007/s11517-020-02138-4 (2020). [DOI] [PubMed] [Google Scholar]
- 38.Lee Alex P-W, Leong Chun Wing M, Kwok K-W & Fan Y USING 3D PRINTED MODELS FOR PLANNING TRANSCATHETER AORTIC VALVE IMPLANTATION IN PATIENTS WITH BICUSPID AORTIC VALVE. Journal of the American College of Cardiology 71, A1130–A1130, doi: 10.1016/S0735-1097(18)31671-1 (2018). [DOI] [Google Scholar]
- 39.Martin LCW (Facultyf of Medicine, The Chinese University of Hong Kong, 2017). [Google Scholar]
- 40.Martin C, Pham T & Sun W Significant differences in the material properties between aged human and porcine aortic tissues✩. European Journal of Cardio-Thoracic Surgery 40, 28–34, doi: 10.1016/j.ejcts.2010.08.056 (2011). [DOI] [PMC free article] [PubMed] [Google Scholar]
- 41.Martin C & Sun W Biomechanical characterization of aortic valve tissue in humans and common animal models. Journal of Biomedical Materials Research Part A 100A, 1591–1599, doi: 10.1002/jbm.a.34099 (2012). [DOI] [PMC free article] [PubMed] [Google Scholar]
- 42.Emendi M et al. Patient-Specific Bicuspid Aortic Valve Biomechanics: A Magnetic Resonance Imaging Integrated Fluid–Structure Interaction Approach. Annals of Biomedical Engineering 49, 627–641, doi: 10.1007/s10439-020-02571-4 (2021). [DOI] [PMC free article] [PubMed] [Google Scholar]
- 43.Morganti S et al. Prediction of patient-specific post-operative outcomes of TAVI procedure: The impact of the positioning strategy on valve performance. Journal of biomechanics 49, 2513–2519, doi: 10.1016/j.jbiomech.2015.10.048 (2016). [DOI] [PubMed] [Google Scholar]
- 44.Ghosh RP et al. Numerical evaluation of transcatheter aortic valve performance during heart beating and its post-deployment fluid-structure interaction analysis. Biomechanics and modeling in mechanobiology 19, 1725–1740, doi: 10.1007/s10237-020-01304-9 (2020). [DOI] [PMC free article] [PubMed] [Google Scholar]
- 45.Bailey J, Curzen N & Bressloff NW Assessing the impact of including leaflets in the simulation of TAVI deployment into a patient-specific aortic root. Computer Methods in Biomechanics and Biomedical Engineering 19, 733–744, doi: 10.1080/10255842.2015.1058928 (2016). [DOI] [PubMed] [Google Scholar]
- 46.Agilus 30 (ed Stratasys Direct Manufacturing; ). https://www.stratasys.com/materials/search/agilus30 [Google Scholar]
- 47.Flex Polyjet and PolyJet Over-Mold (ed Stratasys Direct Manufacturing; ). https://www.stratasysdirect.com/zh-cn/technologies/polyjet [Google Scholar]
- 48.Kovarovic BJ, Rotman OM, Parikh P, Slepian MJ & Bluestein D Patient-specific in vitro testing for evaluating TAVR clinical performance-A complementary approach to current ISO standard testing. Artif Organs 45, E41–e52, doi: 10.1111/aor.13841 (2021). [DOI] [PMC free article] [PubMed] [Google Scholar]
- 49.in Cardiovascular Implants – Cardiac ValveProstheses – Part 3: Heart Valve Substitutes Implanted byTranscatheter Technique. ISO5840–3:2013 (ISO,Geneva,Switzerland, 2013). [Google Scholar]
- 50.Pibarot P, Hahn Rebecca T, Weissman Neil J & Monaghan Mark J Assessment of Paravalvular Regurgitation Following TAVR. JACC: Cardiovascular Imaging 8, 340–360, doi: 10.1016/j.jcmg.2015.01.008 (2015). [DOI] [PubMed] [Google Scholar]
- 51.Lee S, Squelch A & Sun Z Quantitative Assessment of 3D Printed Model Accuracy in Delineating Congenital Heart Disease. Biomolecules 11, doi: 10.3390/biom11020270 (2021). [DOI] [PMC free article] [PubMed] [Google Scholar]
- 52.Milhorini Pio S, Bax J & Delgado V How valvular calcification can affect the outcomes of transcatheter aortic valve implantation. Expert Review of Medical Devices 17, 773–784, doi: 10.1080/17434440.2020.1789456 (2020). [DOI] [PubMed] [Google Scholar]
- 53.Lau I & Sun Z Three-dimensional printing in congenital heart disease: A systematic review. J Med Radiat Sci 65, 226–236, doi: 10.1002/jmrs.268 (2018). [DOI] [PMC free article] [PubMed] [Google Scholar]
- 54.Bana A TAVR—present, future, and challenges in developing countries. Indian Journal of Thoracic and Cardiovascular Surgery 35, 473–484, doi: 10.1007/s12055-018-00786-8 (2019). [DOI] [PMC free article] [PubMed] [Google Scholar]
Associated Data
This section collects any data citations, data availability statements, or supplementary materials included in this article.
Supplementary Materials
Supplementary table 1: The mean percent difference values of minimum and maximum diameters for each in-vitro – in-silico model comparison
Supplementary figure 1: Flowchart demonstrating the in-vitro validation of the structural simulation. After performing the FE simulation of TAVR procedure (a), flexible patient-specific aortic root models (b) were created and an actual TAVR device (c) was deployed in each model (d). CT scan and X-Ray were performed on the in-vitro models to capture the in-vitro device deformation and perform qualitative comparison with the in-silico data (e). Device eccentricity information was quantified at different level in both in-vitro (f) and in-silico (g) models and the results were compared. Device anchorage was analyzed in-silico.
Supplementary figure 2: Flowchart depicting the relationship between the in-vitro hydrodynamic study and the in-silico CFD study. The deformed aortic roots obtained from the FE simulation (a) were used to create patient-specific rigid parts (b) for the left heart simulator, and an actual TAVR device was deployed in these models manually (c). The in-vitro device orientations were matched with the in-silico ones (d). Hydrodynamic study was performed using left heart simulator (e), and in-vitro flowrates (f) were obtained in order to calculate the in-vitro regurgitant volume. Transaortic pressure gradients were obtained from the in-vitro flow study (g). In order to avoid the backflow of the through the PVL channels during systolic phase, transvalvular pressure at the systolic part of the pressure waveform curve was set to 0, and the modified waveform (h) was then used as boundary conditions in the CFD simulations (i). The PVL flowrates were calculated in-silico (j) and compared with the in-vitro data. Clinical validation of the in-silico PVL data was performed by comparing the degree and location of the PVL to the clinical data (Echo doppler color flow and PVL grading).
Supplementary figure 3: Transaortic pressure gradient obtained from the in-vitro hydrodynamic study