

Abstract
Background:
Regulator of G-Protein Signaling (RGS)-2 terminates bronchoconstrictive Gαq-signaling; murine RGS2 knockout demonstrate airway hyperresponsiveness. While RGS2 promoter variants rs2746071 and rs2746072 associate with a clinical mild asthma phenotype, their impact on human airway smooth muscle (HASM) contractility and asthma severity outcomes is unknown.
Objective:
To determine whether reductions in RGS2 expression seen with these two RGS2 promoter variants augment HASM contractility and associate with an asthma severity phenotype.
Methods:
We transfected HASM with a range of RGS2-specific siRNA concentrations, and determined RGS2 protein expression by Western blots and intracellular calcium flux induced by histamine (a Gαq-coupled H1 receptor bronchoconstrictive agonist). We conducted regression-based genotype association analyses of RGS2 variants from 611 patients from the NHLBI Severe Asthma Research Program-3.
Results:
RGS2-specific siRNA caused dose-dependent increases in histamine-stimulated bronchoconstrictive intracellular calcium signaling (two-way ANOVA, p<0.0001) with a concomitant decrease in RGS2 protein expression. RGS2-specific siRNA did not affect Gαq-independent ionomycin-induced intracellular calcium signaling (p=0.42). The minor allele frequency of rs2746071 and rs2746072 was 0.46 and 0.28 among African-American/non-Hispanic Blacks, and 0.28 and 0.27 among non-Hispanic Whites (NHW), among whom these SNPs were in stronger linkage disequilibrium (r2=0.97). Among NHWs, risk allele homozygotes for rs2746072 and rs2746071 each had nearly two-fold greater asthma exacerbation rates relative to alternative genotypes with WT alleles (padditive=2.86×10⁻⁵/precessive=5.22×10−6 and padditive=3.46×10⁻⁶/Precessive=6.74×10−7, respectively) at baseline, which was confirmed with prospective longitudinal exacerbation data.
Conclusion:
RGS2 promoter variation associates with a molecular and clinical phenotype characterized by enhanced bronchoconstrictive stimulation in vitro and higher asthma exacerbations rates in NHW patients
Keywords: Regulator of G Protein Signaling, G Protein Coupled Receptors, airway hyperresponsiveness, bronchoconstriction, asthma exacerbations, genomics, genotype, airway smooth muscle, phenotype, endotype
Capsule Summary
RGS2 promoter variation associates with a human airway smooth muscle hypercontractility and a clinical phenotype characterized by higher rates of asthma exacerbations in Non-Hispanic White patients with moderate to severe persistent asthma.
Introduction
Severe asthma continues to impose substantial morbidity despite the availability of targeted biologic therapies(1). A genomics-based mechanistic understanding of disease pathobiology may lead to better outcomes through precision medicine approaches. Airway hyperresponsiveness (AHR) characterizes asthma, and arises from excessive human airway smooth muscle (HASM) constriction, a consequence of activation of G Protein-coupled receptor (GPCR)-mediated bronchoconstrictive signaling, specifically through Gαq-subunit signaling(2). The Regulator of G-Protein Signaling (RGS) protein family modulates GPCRs through signal termination(3), and RGS2 specifically terminates Gαq signaling(4). We previously found that RGS2 heterozygous and homozygous knockout mice exhibit enhanced AHR relative to wildtype(5). Further, we found that mild asthmatic patients express less RGS2 mRNA and protein relative to non-asthmatic patients in blood monocytes, and that lower RGS expression correlates with greater AHR(5). We also identified two RGS2 promoter single nucleotide polymorphisms (SNPs: rs2746071, rs2746072) as potential risk factors for mild-moderate asthma(6). Co-expression of these risk alleles reduced reporter expression by 44% in human HASM transfectants(6). Whether these risk alleles are associated with an asthma severity phenotype is unknown, as is the functional significance of reductions in RGS2 of this magnitude in HASM.
Results and Discussion
We investigated whether reductions in RGS2 expression known to occur with these two SNPs(6) augmented contractile signaling (Supplemental figure 1). We reasoned that if RGS2 was in vast excess in HASM relative to Gαq, then a modest decrease would have little effect on bronchoconstrictive signaling. To ascertain the functional effect of the promoter SNPs (~44% decrease in gene product), we transfected HASM cells with a range of RGS2-specific siRNA concentrations, and performed Western blot analysis for RGS2 protein expression and determined [Ca2+]i signaling from histamine, which acts to constrict by activating the Gαq-coupled histamine H1 receptor. As shown in Figure 1A, there was a siRNA dose-dependent increase in histamine-stimulated [Ca2+]i signaling (two way ANOVA, P<0.0001). In contrast, the ionomycin response, which is non-receptor dependent, was not affected by RGS2 siRNA (Figure 1B). The maximal dose of RGS2 siRNA resulted in a 46.3% ± 4.1% decrease in RGS2 protein in HASM cells (Figure 1C,D). These experiments verified that changes in the endogenous levels of RGS2, in the cell type of interest, over a range of observed changes found in monocyte RGS2 from clinical samples, have an impact on native and physiologically relevant receptor signaling via Gαq. Based on data shown in Figure 1, the 46% decrease in RGS2 protein (similar to the 44% decrease in expression found due to the promoter variants) results in an 260% ± 36.7% increase in the histamine-stimulated signal over scrambled control siRNA signaling. These findings support a causal relationship between the decreased RGS2 expression regulated by the SNPs and increased bronchoconstrictive signaling.
Figure 1. Effects of decreased RGS2 on histamine-mediated [Ca2+]i release in human airway smooth muscle cells.

A,B) Decreasing RGS2 by RGS2-specific siRNA increases [Ca2+]i release by histamine (25 μM) in a siRNA dose-dependent manner, while the ionomycin (2 μM) response is unaffected. Results are mean +/− SE of quadruplicate determinations from a single representative experiment, which was performed three times. C,D) RGS2 expression is decrease by ~50% in human airway smooth muscle cells receiving 150 nM RGS2-siRNA. A representative western blot is shown in (C), and the results from 3 experiments is shown in (D). *, P<0.01 vs scrambled control siRNA (siCtrl).
Based on these molecular phenotyping results, we tested the hypothesis that rs2746071 and rs2746072 RGS2 promoter variation associates with asthma severity outcomes by promoting a hypercontractile phenotype through enhanced GPCR-[Ca2+]i signaling. To address this, we analyzed genomic and clinical outcome data from the National Heart, Lung, and Blood Institute’s (NHLBI) Severe Asthma Research Program-3 (SARP3), an observational longitudinal study of extensively characterized multi-ethnic asthma subjects enriched for severe asthma(7) (Supplemental figure 1). We conducted regression-based genotype association analyses of two RGS2 SNPs from 611 SARP3 participants genotyped with the Illumina Multi-Ethnic Global BeadChip (MEGA) Chip with generalized linear models for a Poisson distribution using the SAS-based JMP program. The minor allele frequency of rs2746071 and rs2746072 was 0.46 and 0.28 in self-reported African American/non-Hispanic Blacks (AA-B). In contrast, the allele frequencies of the two SNPs were 0.28 and 0.27 in non-Hispanic Whites (NHW), respectively, and occurred almost exclusively together (Hardy-Weinberg equilibrium r2= 0.48 for AA-B, vs 0.97 for NHW, respectively; Figure 2). We found that the risk allele homozygotes for rs2746072 (CC) and rs2746071 (GG) each had nearly two-fold greater rates of asthma exacerbations (Figure 3) relative to the alternative genotypes with WT alleles in NHW (n=366; CC genotype=3.37 versus CG=1.83 and GG=1.73 exacerbations per year, padditive=2.86×10⁻⁵, precessive=5.22×10⁻⁶ for rs2746072; and GG=3.41 versus AG=1.80 and AA=1.72 exacerbations per year, and Padditive=3.46×10⁻⁶, precessive=6.74×10⁻⁷, for rs2746071, after correction for the two SNP comparisons and adjustment for the first two principal components of NWH ancestry, the first four principal components of AA-B ancestry, age, sex and body mass index) when analyzing retrospective data. We confirmed these genotype associations with exacerbation rates in NHW in a prospective longitudinal follow up for both promoter variants after a year of follow up, where NHW homozygous for the minor allele of rs2746072 experienced a significantly higher mean frequency of asthma exacerbations (CC genotype [n=34]=1.65 versus CG [n=124]=1.06 and GG [n=188]=1.01 exacerbations per year, unadjusted padditive=0.048/precessive=0.014); NHW homozygous for rs2746071 also experienced a significantly higher mean frequency of exacerbations (GG genotype [n=36]=1.69 versus AG [n=124]=1.03 and AA [n=186]=1.01 exacerbations per year, unadjusted padditive=0.022, precessive=0.0058). In contrast, AA-B experienced non-significant and minimal changes in exacerbation rates (Figure 3) relative to genotypes with WT alleles (CC [n=13]=1.77 versus CG [n=78]=1.25 and GG [n=98]=1.66 exacerbations per year, padditive=0.065/precessive=0.78 for rs2746072; and GG [n=40]=1.35 versus AG [n=92]=1.37 and AA [n=57]=1.82 exacerbations per year, padditive=0.051/precessive=0.45 for rs2746071) when analyzing retrospective data. These results remained non-significant in longitudinal follow-up where AA-B individuals experienced non-significant differences across genotypes for rs2746072 (CC [n=12]=0.58, CG [n=72]=0.90 and GG [n=88]=0.87 exacerbations per year, unadjusted padditive=0.60/precessive=0.33) and for rs2746071 (GG [n=37]= 0.81 versus AG [n=84]=0.96 and AA [n=51]=0.75 exacerbations per year, unadjusted padditive=0.31/precessive=0.60) relative to participants with WT allele-containing genotypes. Table 1 shows a comparison of clinical, phenotypic and spirometric characteristics between participants with common, non-risk allele-containing genotypes and those with minor risk allele, homozygotes for both SNPs for the entire cohort, and for the NHW and AA-B subgroups. Characteristics were compared using Chi square and student’s t tests, where appropriate. NHW with common, non-risk allele-containing genotypes and those with minor risk alleles were similar in terms of phenotypic SARP cluster assignment (defined by Moore et al(8)), baseline lung function (FEV1), FeNO, serum IgE, number of aeroallergens sensitized to, bronchial responsiveness to methacholine, and bronchodilator (i.e. spirometry conducted after up to 8 puffs of albuterol 90 mcg) and systemic corticosteroid responses (i.e. spirometry conducted 2–4 weeks after administration of intramuscular triamcinolone acetonide 40 mg). NHW GG homozygotes for rs2746071 had fewer blood eosinophils compared to the alternative genotypes (236/uL vs. 305/uL, p=0.04) despite having similar rates of current oral corticosteroid use at enrollment.
Figure 2.
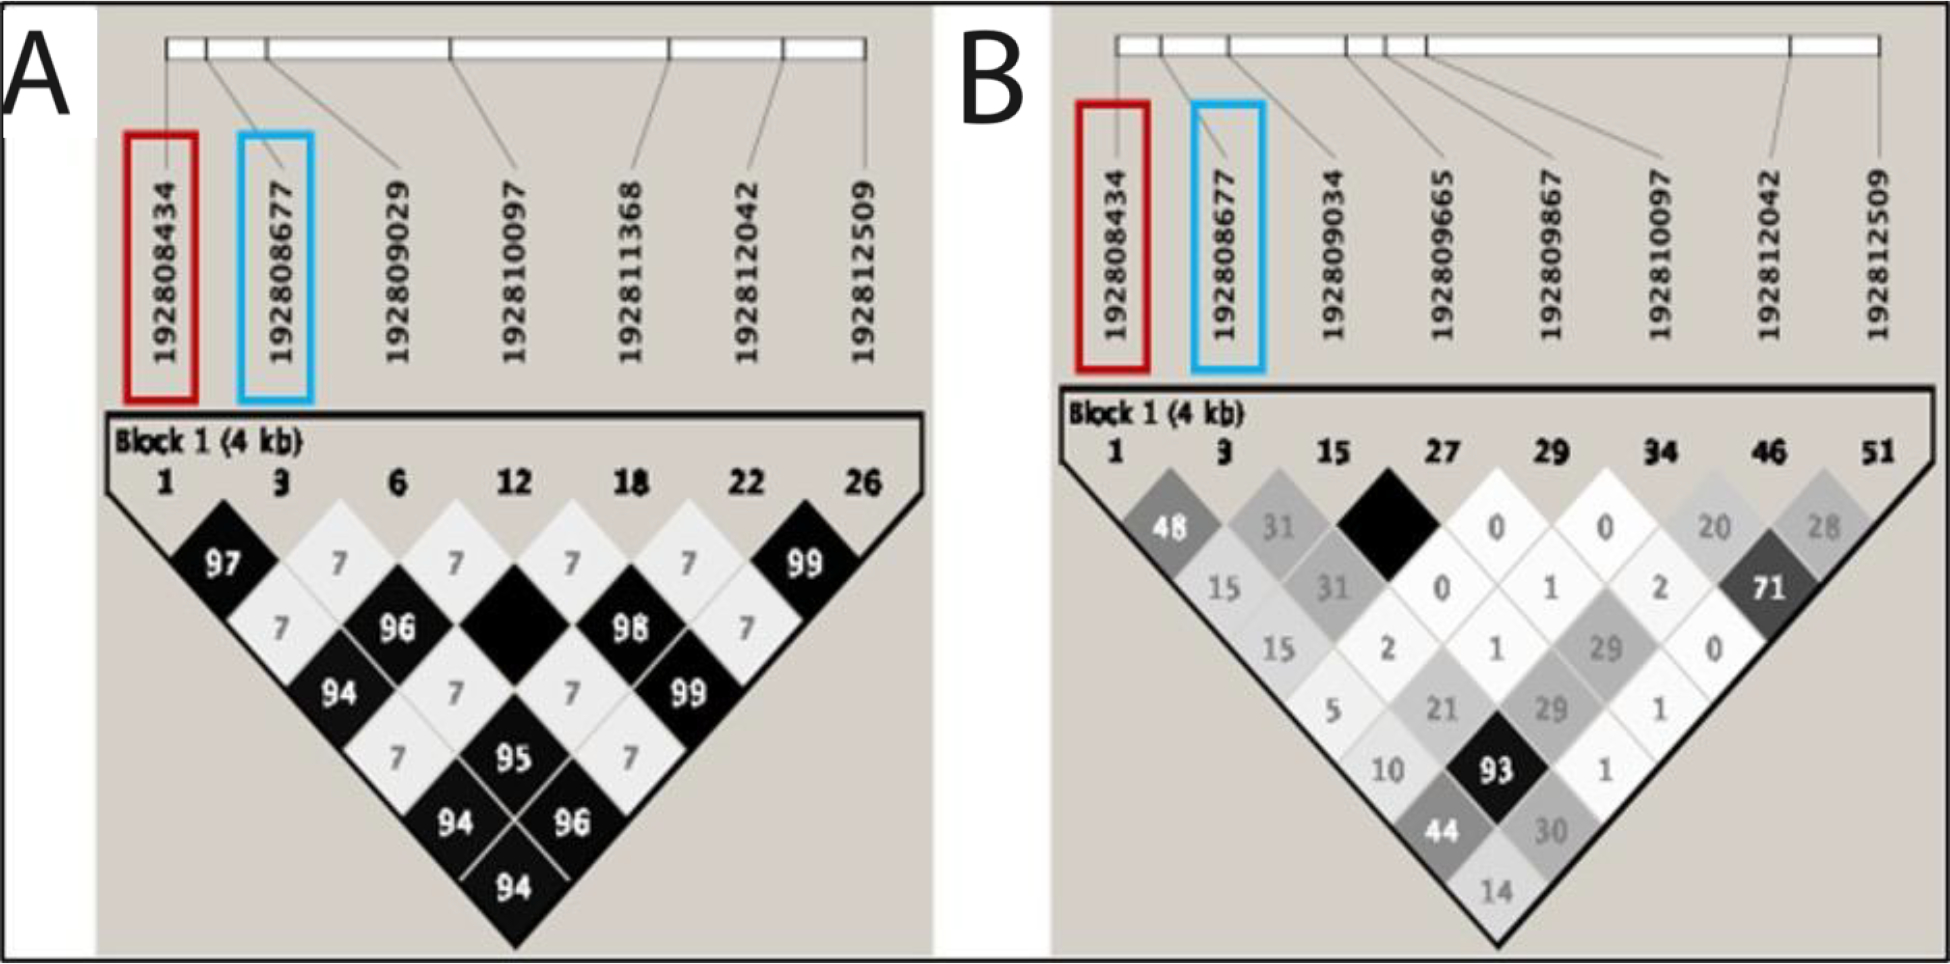
Linkage disequilibrium plots (r2) for RGS2 variation with minor allele frequency (MAF) >0.05 in (A.) Non-Hispanic Whites (NHW) and (B.) African-American/Black (AA/B) with asthma from SARP3. 20 of 29 in NHW and 44 of 54 variants in AA/B have MAF<0.05. rs2746071 in red, rs2746072 in blue.
Figure 3.

Relationship between variant homozygotes for RGS2 promoter SNPs rs2746071 (GG) and rs2746072 (CC) and annualized exacerbation rates relative to genotypes containing wildtype alleles among Non-Hispanic Whites (NHW) and African-American-Blacks (AA-B) in a cohort enriched for severe asthma (SARP3). We show adjusted p-values for both additive and recessive models that included age, sex and body mass index. Models for NHW are also included the first two principal components of NHW ancestry, while those for AA-B included the first four principal components of AA-B ancestry.
Table 1.
Participant characteristics, stratified by RGS2 promoter genotype
| Characteristic | Promoter variant, stratified by genotype and race/ethnicity*** | |||||||||||||
|---|---|---|---|---|---|---|---|---|---|---|---|---|---|---|
| rs2746071 | rs2746072 | |||||||||||||
| All races/ethnicities | ||||||||||||||
| GG (N=94) | AA/AG (N=579) | p-value | CC (N=58) | GG/CG (N=615) | p-value | |||||||||
| Clinical | ||||||||||||||
| Age (years) | 37 (19) | 39 (20) | 0.24 | 43 (18) | 38 (20) | 0.94 | ||||||||
| Sex (% female) | 54 (58%) | 343 (60%) | 0.77 | 40 (69%) | 357 (59%) | 0.12 | ||||||||
| Race | ||||||||||||||
| Non-Hispanic White | 37 (40%) | 333 (58%) | 0.02 | 35 (60%) | 335 (55%) | 0.29 | ||||||||
| Black | 41 (44%) | 154 (27%) | 13 (23%) | 182 (30%) | ||||||||||
| Other | 15 (16%) | 88 (15%) | 10 (17%) | 93 (15%) | ||||||||||
| Body mass index | 32 (10) | 30 (9) | 0.99 | 32 (10) | 30 (9) | 0.98 | ||||||||
| Current use of oral corticosteroids | 12 (13%) | 70 (12%) | 0.84 | 11 (19%) | 71 (12%) | 0.10 | ||||||||
| Phenotypic | ||||||||||||||
| SARP cluster* | ||||||||||||||
| 1 | 9 (12%) | 57 (12%) | 0.82 | 5 (10%) | 61 (12%) | 0.93 | ||||||||
| 2 | 29 (38%) | 185 (38%) | 18 (35%) | 196 (38%) | ||||||||||
| 3 | 10 (13%) | 80 (16%) | 8 (15%) | 82 (16%) | ||||||||||
| 4 | 15 (20%) | 73 (15%) | 10 (20%) | 78 (15%) | ||||||||||
| 5 | 13 (17%) | 93 (19%) | 10 (20%) | 96 (19%) | ||||||||||
| FeNO (ppb) | 34 (37) | 31 (29) | 0.77 | 33 (32) | 32 (30) | 0.64 | ||||||||
| Serum IgE (kU/L) | 394 (510) | 469 (858) | 0.64 | 304 (414) | 474 (846) | 0.18 | ||||||||
| # aeroallergens sensitized to | 5 (4) | 5 (4) | 0.69 | 4 (4) | 5 (4) | 0.17 | ||||||||
| Blood eosinophils (per uL) | 307 (299) | 318 (283) | 0.28 | 261 (281) | 322 (285) | 0.02 | ||||||||
| Spirometric | ||||||||||||||
| Pre-FEV1 (% pred.) | 78.3 (21.1) | 76.3 (20.9) | 0.81 | 76.5 (21.7) | 76.6 (20.9) | 0.49 | ||||||||
| Bronchodilator response** (% pred.) | 13.5 (9.6) | 11.9 (8.4) | 0.95 | 12.0 (8.9) | 12.1 (8.6) | 0.47 | ||||||||
| Systemic corticosteroid response# | 3.2 (10.3) | 2.4 (9.7) | 0.77 | 3.4 (10.6) | 2.4 (9.7) | 0.76 | ||||||||
| PC20 (mg/mL) (n=184) | 2.10 (2.54) | 3.49 (4.24) | 0.02 | 2.45 (2.79) | 3.38 (4.18) | 0.24 | ||||||||
| Non-Hispanic White | ||||||||||||||
| GG (N=37) | AA/AG (N=333) | p-value | CC (N=35) | GG/CG (N=335) | p-value | |||||||||
| Clinical | ||||||||||||||
| Age (years) | 43 (18) | 44 (18) | 0.46 | 44 (18) | 43 (18) | 0.53 | ||||||||
| Sex (% female) | 26 (70%) | 201 (60%) | 0.24 | 26 (74%) | 201 (60%) | 0.10 | ||||||||
| Body mass index | 31 (11) | 30 (8) | 0.80 | 31 (11) | 30 (8) | 0.85 | ||||||||
| Current use of oral corticosteroids | 9 (24%) | 46 (14%) | 0.09 | 9 (26%) | 46 (14%) | 0.06 | ||||||||
| Phenotypic | ||||||||||||||
| SARP cluster* | ||||||||||||||
| 1 | 2 (5%) | 36 (11%) | 0.81 | 2 (6%) | 36 (12%) | 0.79 | ||||||||
| 2 | 11 (31%) | 107 (32%) | 11 (34%) | 107 (34%) | ||||||||||
| 3 | 7 (19%) | 62 (19%) | 6 (19%) | 63 (21%) | ||||||||||
| 4 | 4 (11%) | 39 (12%) | 4 (13%) | 39 (13%) | ||||||||||
| 5 | 9 (24%) | 62 (19%) | 9 (28%) | 62 (20%) | ||||||||||
| FeNO (ppb) | 34 (37) | 29 (26) | 0.74 | 34 (37) | 29 (26) | 0.70 | ||||||||
| Serum IgE (kU/L) | 194 (209) | 325 (559) | 0.27 | 191 (208) | 325 (558) | 0.29 | ||||||||
| # aeroallergens sensitized to | 4 (3) | 4 (4) | 0.29 | 4 (3) | 4 (4) | 0.34 | ||||||||
| Blood eosinophils (per uL) | 236 (189) | 305 (272) | 0.04 | 239 (192) | 304 (271) | 0.06 | ||||||||
| Spirometric | ||||||||||||||
| Pre-FEV1 (% pred.) | 74.4 (22.5) | 75.8 (20.8) | 0.35 | 73.2 (22.4) | 75.9 (20.8) | 0.24 | ||||||||
| Bronchodilator response** (% pred.) | 10.7 (9.0) | 10.8 (7.6) | 0.48 | 10.3 (9.0) | 10.8 (7.6) | 0.34 | ||||||||
| Systemic corticosteroid response# | 2.9 (10.3) | 2.0 (8.4) | 0.75 | 2.5 (10.4) | 2.0 (8.4) | 0.62 | ||||||||
| PC20 (mg/mL) | 2.92 (2.16) | 4.01 (4.65) | 0.52 | 2.92 (2.16) | 4.01 (4.65) | 0.52 | ||||||||
| Black | ||||||||||||||
| GG (N=41) | AA/AG (N=154) | p-value | CC (N=13) | GG/CG (N=182) | p-value* | |||||||||
| Clinical | ||||||||||||||
| Age (years) | 33 (18) | 32 (19) | 0.59 | 40 (18) | 31 (19) | 0.95 | ||||||||
| Sex (% female) | 23 (56%) | 93 (60%) | 0.62 | 10 (77%) | 106 (58%) | 0.19 | ||||||||
| Body mass index | 33 (9) | 31 (10) | 0.91 | 36 (7) | 31 (10) | 0.96 | ||||||||
| Current use of oral corticosteroids | 3 (7%) | 10 (6%) | 0.85 | 2 (15%) | 11 (6%) | 0.19 | ||||||||
| Phenotypic | ||||||||||||||
| SARP cluster* | ||||||||||||||
| 1 | 6 (19%) | 11 (9%) | 0.48 | 2 (18%) | 15 (11%) | 0.89 | ||||||||
| 2 | 11 (35%) | 56 (48%) | 4 (37%) | 63 (46%) | ||||||||||
| 3 | 2 (7%) | 9 (8%) | 1 (9%) | 10 (7%) | ||||||||||
| 4 | 8 (26%) | 23 (20%) | 3 (27%) | 28 (21%) | ||||||||||
| 5 | 4 (13%) | 17 (15%) | 1 (9%) | 20 (15%) | ||||||||||
| FeNO (ppb) | 35 (42) | 35 (34) | 0.27 | 35 (26) | 35 (37) | 0.55 | ||||||||
| Serum IgE (kU/L) | 524 (614) | 714 (1202) | 0.28 | 398 (485) | 694 (1136) | 0.22 | ||||||||
| # aeroallergens sensitized to | 6 (5) | 7 (5) | 0.39 | 6 (5) | 7 (5) | 0.42 | ||||||||
| Blood eosinophils (per uL) | 341 (382) | 333 (288) | 0.45 | 279 (485) | 339 (294) | 0.04 | ||||||||
| Spirometric | ||||||||||||||
| Pre-FEV1 (% pred.) | 80.5 (21.6) | 76.3 (20.6) | 0.88 | 81.0 (22.6) | 76.9 (20.7) | 0.75 | ||||||||
| Bronchodilator response** (% pred.) | 15.2 (10.6) | 14.2 (9.6) | 0.72 | 13.8 (9.3) | 14.4 (9.9) | 0.41 | ||||||||
| Systemic corticosteroid response# | 3.9 (11.2) | 3.1 (10.7) | 0.66 | 5.8 (14.1) | 3.1 (10.5) | 0.81 | ||||||||
| PC20 (mg/mL) | 2.03 (3.33) | 3.13 (3.92) | 0.03 | 2.46 (4.50) | 2.95 (3.77) | 0.18 | ||||||||
GG is the risk allele homozygote for rs2746071, while AA/AG are the genotypes with the wildtype allele. CC is the risk allele homozygote for rs2746072, while GG/CG are the genotypes with the wildtype allele. Continuous data are presented as means (standard deviation), with their p-values derived from student’s t test. Discrete data are presented as counts (proportions), with their p-values derived from Chi square test. FeNO: fractional exhaled nitric oxide; FEV1: forced volume in the first second of expiration. PC20: provocative methacholine concentration to cause a 20% decrease in FEV1. Pre-FEV1: max FEV1 performed before bronchodilator administration.
The SARP clusters are briefly defined as: 1: milder, early onset atopic asthma; 2: more severe, early onset atopic asthma; 3: late onset non-atopic asthma, overrepresented by obesity and female sex; 4: severe atopic asthma and preserved lung function; 5: severe atopic asthma with impaired lung function.
Difference in the percent predicted (Quanjer method) change in FEV1 post- minus pre- administration of 8 puffs of albuterol 90 mcg.
The total cohort includes Non-Hispanic Whites, Blacks, and small proportions of Hispanics, Asians, and members of other race ethnicities. Only Non-Hispanic Whites and Blacks, the largest two racial/ethnic groups, appear within the stratified results.
Difference in the percent predicted (Quanjer method) change in pre-bronchodilator FEV1 obtained post- 2–4 weeks minus pre- administration of intramuscular triamcinolone acetonide 40 mg. Statistically significant values are bolded.
Our results show a molecular and clinical phenotype associated with RGS2 promoter variation that is characterized by higher rates of asthma exacerbations among NHW patients confirmed in longitudinal follow up, despite decreased exacerbation rates longitudinally in the overall study population. Collectively, these results expand on our prior findings of these two SNPs being risk factors for mild asthma, now indicating their association with greater asthma severity and a molecular basis for the effect.
This report is limited in that these candidate gene studies were conducted in one cohort and, despite being confirmed longitudinally, still require further replication. Our report on asthma exacerbations was based on baseline, self-reported retrospective data, which is subject to recall and other biases. However, we verified the reproducibility of our findings by continuing to detect the association in longitudinal follow up, which implies phenotypic stability.
Genotypic results were discordant in AA-B (i.e., minor allele homozygotes for rs2746071 showed non-significant lower exacerbation rates while minor allele homozygotes for rs2746072 showed higher rates which contrasts the concordant results in NHW (i.e., minor allele homozygotes for rs2746072 and rs2746071 both showed statistically significant and substantially greater rates of asthma exacerbations relative to WT allele-containing genotypes). These discordant results in AA-B may be due to differences in genetic architecture and linkage disequilibrium of RGS2 promoter variation between AA-B and NHW as shown in Figure 2. As shown in Figure 3, a recessive effect underlies these associations, and homozygosity of the two RGS2 promoter variant alleles may be needed to impart risk for asthma exacerbations. A cumulative recessive effect for these two SNPs among double minor allele homozygotes for rs2746071 (GG) and rs2746071 (CC), 35 NHW and 13 AA-B, is confirmed by the findings that these double homozygotes experienced the highest frequency of exacerbations in NHW (3.37 per year) and AA (1.77 per year) compared to the others with alternative haplotype combinations (1.75 and 1.54 per year, p=5.22×10⁻⁶ in NHW and p=0.78 in AA-B). Our previous in vitro work(6) with HASM transfectants using luciferase reporter constructs bearing the human RGS2 promoter fragment with point mutations for SNPs 1 and 2 shows that co-expression of these two SNPs reduces luciferase activity by 44% while those using luciferase reporter constructs with SNP 1 alone shows a 27% reduction in luciferase activity. These results suggest that the cutoff in humans to express an exacerbation-prone phenotype requires the reduction in RGS2 expression that occurs only with double-homozygous variants.
The lack of statistical significance for AA-B is likely related to reduced power based on a limited sample size and reduced frequency of these individuals with double-homozygote risk variant haplotypes which is 28% lower in African Americans (13 of 189 in AA-B vs. 35 of 366 in NHW). These results need to be corroborated in subsequent studies using other AA-B asthma cohorts such as the NHLBI-AsthmaNet sponsored BARD trial, which exclusively randomized participants with self-reported African ancestry. However, the sample size and extensive clinical characterization of our cohort, in addition to the molecular phenotyping results, strongly support the findings. This further clarifies that RGS2 pathway alterations represent a mechanistic underpinning in humans for a severe asthma phenotype, which could have important prognostic and therapeutic implications.
Supplementary Material
Key Messages.
Reductions in Regulator of G-Protein Signaling (RGS)-2 expression augment human airway smooth muscle (HASM) contractility
RGS2 promoter variation associates with an asthma severity phenotype characterized by higher rates of asthma exacerbations among Non-Hispanic White (NHW) patients with moderate-severe persistent asthma
Funding:
SARP3 was funded with the following NHLBI center grants: U10 HL109172, U10 HL109168, U10 HL109152, U10 HL109257, U10 HL109146, U10 HL109250, U10 HL109164, U10 HL109086; the following CTSA center grants: UL1 TR001102, UL1 TR000427, UL1 TR001420, UL1 TR002378. This work was also funded by: K23AI125785, the ALA/AAAAI Allergic Respiratory Diseases Research Award AI-835475 and the USF Creative Scholarship Award to JCC, HL045967 to SBL, and R01HL142992 to VEO.
Abbreviations:
- AA-B
African American-Black
- AHR
airway hyperresponsiveness
- GPCR
G protein coupled receptor
- HASM
human airway smooth muscle
- NHLBI
National Heart, Lung, and Blood Institute
- NHW
Non-Hispanic White
- RGS
Regulator of G-Protein Signaling
- SARP
Severe Asthma Research Program
Footnotes
Conflicts of interest:
ERB has undertaken clinical trials through his employer, University of Arizona, for AstraZeneca, Novartis, Regeneron, and Sanofi Genzyme. ERB has also served as a paid consultant for ALK-Abello, AztraZeneca, Glaxo Smith Kline, Knopp, Novartis, Regeneron,and Sanofi Genzyme.
JCC reports receiving honoraria from AstraZeneca, GSK, and Genentech for work in advisory boards.
VEO reports receiving consulting fees from Sanofi and fees for serving on Independent Data Monitoring Committees for Sanofi and Regeneron Pharmaceuticals.
SARP3 sites received pharmaceutical industry funding: Brigham and Women’s from AstraZeneca and TEVA; Boston Children’s Hospital from AstraZeneca; University of Wisconsin from AstraZeneca; University of Pittsburgh from Boehringer-Ingelheim and TEVA; Washington University from Sanofi-Genzyme-Regeneron and TEVA; UCSF from Boehringer-Ingelheim and TEVA; University of Virginia from AstraZeneca and TEVA; Case Western – Rainbow from AstraZeneca and TEVA; Wake Forest from Genentech; and Emory University from Sanofi-Genzyme-Regeneron The rest of the authors declare that they have no relevant conflicts of interest.
Publisher's Disclaimer: This is a PDF file of an unedited manuscript that has been accepted for publication. As a service to our customers we are providing this early version of the manuscript. The manuscript will undergo copyediting, typesetting, and review of the resulting proof before it is published in its final form. Please note that during the production process errors may be discovered which could affect the content, and all legal disclaimers that apply to the journal pertain.
References
- 1.Caminati M, Morais-Almeida M, Bleecker E, Ansotegui I, Canonica GW, Bovo C, et al. Biologics and global burden of asthma: A worldwide portrait and a call for action. World Allergy Organ J. 2021;14(2):100502. [DOI] [PMC free article] [PubMed] [Google Scholar]
- 2.Penn RB, Bond RA, Walker JK. GPCRs and arrestins in airways: implications for asthma. Handb Exp Pharmacol. 2014;219:387–403. [DOI] [PMC free article] [PubMed] [Google Scholar]
- 3.O’Brien JB, Wilkinson JC, Roman DL. Regulator of G-protein signaling (RGS) proteins as drug targets: Progress and future potentials. J Biol Chem. 2019;294(49):18571–85. [DOI] [PMC free article] [PubMed] [Google Scholar]
- 4.Heximer SP, Watson N, Linder ME, Blumer KJ, Hepler JR. RGS2/G0S8 is a selective inhibitor of Gqalpha function. Proc Natl Acad Sci U S A. 1997;94(26):14389–93. [DOI] [PMC free article] [PubMed] [Google Scholar]
- 5.Xie Y, Jiang H, Nguyen H, Jia S, Berro A, Panettieri RA Jr., et al. Regulator of G protein signaling 2 is a key modulator of airway hyperresponsiveness. J Allergy Clin Immunol. 2012;130(4):968–76 e3. [DOI] [PubMed] [Google Scholar]
- 6.Jiang H, Xie Y, Abel PW, Wolff DW, Toews ML, Panettieri RA Jr., et al.Regulator of G-protein signaling 2 repression exacerbates airway hyper-responsiveness and remodeling in asthma. Am J Respir Cell Mol Biol. 2015;53(1):42–9. [DOI] [PMC free article] [PubMed] [Google Scholar]
- 7.Teague WG, Phillips BR, Fahy JV, Wenzel SE, Fitzpatrick AM, Moore WC, et al. Baseline Features of the Severe Asthma Research Program (SARP III) Cohort: Differences with Age. J Allergy Clin Immunol Pract. 2018;6(2):545–54 e4. [DOI] [PMC free article] [PubMed] [Google Scholar]
- 8.Moore WC, Meyers DA, Wenzel SE, Teague WG, Li H, Li X, et al. Identification of asthma phenotypes using cluster analysis in the Severe Asthma Research Program. Am J Respir Crit Care Med. 2010;181(4):315–23. [DOI] [PMC free article] [PubMed] [Google Scholar]
- 9.Kim D, Woo JA, Geffken E, An SS, Liggett SB. Coupling of Airway Smooth Muscle Bitter Taste Receptors to Intracellular Signaling and Relaxation Is via Galphai1,2,3. Am J Respir Cell Mol Biol. 2017;56(6):762–71. [DOI] [PMC free article] [PubMed] [Google Scholar]
- 10.Deshpande DA, Wang WC, McIlmoyle EL, Robinett KS, Schillinger RM, An SS, Sham JS, Liggett SB. Bitter taste receptors on airway smooth muscle bronchodilate by localized calcium signaling and reverse obstruction. Nat Med. 2010; 16(11):1299–304. [DOI] [PMC free article] [PubMed] [Google Scholar]
Associated Data
This section collects any data citations, data availability statements, or supplementary materials included in this article.