

Abstract
The spectrum of light that an animal sees—from ultraviolet to far red light—is governed by the number and wavelength sensitivity of a family of retinal proteins called opsins. It has been hypothesized that the spectrum of light available in an environment influences the range of colours that a species has evolved to see. However, invertebrates and vertebrates use phylogenetically distinct opsins in their retinae, and it remains unclear whether these distinct opsins influence what animals see, or how they adapt to their light environments. Systematically using published visual sensitivity data from across animal phyla, we found that terrestrial animals are more sensitive to shorter and longer wavelengths of light than aquatic animals and that invertebrates are more sensitive to shorter wavelengths of light than vertebrates. Using phylogenetically controlled analyses, we found that closed and open canopy habitat species have different spectral sensitivities when comparing across the Metazoa and excluding habitat generalists, while deepwater animals are no more sensitive to shorter wavelengths of light than shallow-water animals. Our results suggest that animals do adapt to their light environment; however, the invertebrate–vertebrate evolutionary divergence may limit the degree to which animals can perform visual tuning.
Keywords: visual tuning, light environment, ciliary opsin, rhabdomeric opsin, meta-analysis, λ max
1. Introduction
Animals use vision for many tasks, including finding prey, avoiding toxic animals and plants, identifying predators, assessing mate quality and navigating their environment [1–5]. In many cases, the objects of interest to the animal need to be distinguished from the background [6,7]. For example, foragers more easily detect food that contrasts with the background than food that does not [8–12]. Signals that contrast with background colours and patterns are also used for mating displays [13–18]. Furthermore, many species’ body colour patterns have evolved to be simultaneously cryptic to predators but conspicuous to conspecifics [19–21]. Finally, contrasting colours can improve animals’ ability to learn the meaning of signals, as when chicks learn to avoid bitter, aposematically coloured food [2,3,22].
An animal's ability to detect visual information depends upon the wavelengths and intensity of light in its habitat (the 'light environment') [6,23,24]. This varies by habitat: forests and estuarine environments possess a yellow-green cast [24–26]. Likewise, blue light dominates the water column at depth [23,24]. Animals' signalling behaviours, choice of microhabitat and visual physiology are thus expected to co-evolve to suit their light environment [6].
Sighted species' photoreceptors (the light-absorbing neurons which enable vision) are theorized to have undergone adaptation to best absorb the light in their environments [23]. This process, called visual tuning, is made possible by both filtering pigments [27–35] and differences in the amino acid sequences of photosensitive proteins called opsins [23]. Visual tuning shifts wavelengths of maximum sensitivity in species as diverse as birds, fish and mammals [23,36–46]. Although visual tuning has been extensively studied in fish [47,48], a systematic study of visual tuning in terrestrial animals has not yet occurred; neither have terrestrial animals been systematically compared to aquatic species. Aquatic and terrestrial animals are found in a variety of light environments, and multiple phyla have transitioned from water to terrestrial habitats. Additionally, studies of animals that transition from aquatic larvae to terrestrial adults have found that these species change their visual pigment expression patterns to match their changing light environment [49–53]. Understanding whether phylogeny constrains the extent of visual tuning, particularly during these water-to-land transitions, is critical for understanding the evolutionary ecology of animal vision.
If opsin tuning faces phylogenetic constraints, the evolutionary history of vision may have shaped the degree to which phyla have adapted to their light environments. The types of opsins differ between chordates and other phyla [54]. Chordates use c-opsins in cilia-bearing photoreceptors to transduce photons into vision, while non-chordate animals use r-opsins in rhabdomere-bearing photoreceptors [55]. C- and r-opsins diverged before 400 Ma, were probably both present in the urbilaterian [55], and may have induced different degrees of visual tuning between chordates and non-chordates.
The diverse habitats in which animals live, combined with the long evolutionary history of visual pigments, lead to several questions. First, have transitions from aquatic to terrestrial habitats influenced species' visual sensitivities? And, are differences in animals' visual sensitivities associated with the c-opsin/r-opsin divergence? Second, do animals that live in visual environments that filter short and long wavelengths of light, such as closed-canopy forests and estuarine habitats, see wavelengths more similarly to each other than to open terrestrial or open-water aquatic environments, in which short and long wavelengths are less (if at all) strongly filtered? And, if there is an effect of habitat greenness, is this effect outweighed by phylogeny?
To answer these questions, we performed a phylogenetically weighted systematic analysis of the maximum and minimum wavelength of visual sensitivity, as well as the range of visual sensitivity, across animals.
2. Material and methods
(a) . Paper selection
We conducted Google Scholar searches in October 2017 and January 2018. Our first search used the search pattern ‘visual pigment’ OR opsin OR ‘absorbance spectrum’ ‘λ max’ -human -man -men -woman -women -'Homo sapiens’ -disease -regeneration. Our second search used the pattern visual pigment, opsin sensitivity, absorbance spectrum. For both searches, we excluded citations and patents.
We reviewed candidate articles using a three-step process. First, we identified research articles and review papers that examined visual physiology. We screened these articles to determine that they used microspectrophotometry, electrophysiology, pigment extraction, or in vitro mRNA expression followed by spectrophotometry to measure visual sensitivity or visual pigment absorption from at least two animals. Finally, we only considered studies using wild caught or full-spectrum reared animals, as artificial lighting can affect visual sensitivity [56,57].
For review articles, we determined whether the authors had included measurements of the mean wavelength of peak sensitivity (λmax) of some population in the article's figures or tables. We downloaded the corresponding primary sources and filtered them using the process described above.
(b) . Visual pigment sensitivity data
We recorded the (1) mean wavelength of peak sensitivity (λmax) for each visual pigment measured; (2) number of animals measured (n); (3) standard deviation of the mean λmax (s.d.) (when available) and (4) where animals were caught (when available). We calculated sampling error for λmax when possible.
(c) . Habitat data
We classified each species using the following standardized data sources: field guides [58–60], public databases (BugGuide, bugguide.net, Butterflies and Moths of North America, butterfliesandmoths.org, FishBase fishbase.org, SealifeBase sealifebase.org, IUCN Redlist iucnredlist.org) and online encyclopaedias including Animal Diversity Web (animaldiversity.org) and Encyclopedia of Life (eol.org). We classified species as terrestrial or aquatic and then defined terrestrial sub-habitats based on canopy density. Rainforest and temperate forest were designated as ‘closed’ habitats; woodland as ‘intermediate’ canopy density; and shrubland, grassland and desert as ‘open’ habitats [25].
Aquatic habitats included river, stream, pond, lake, coastal, estuarine, open-water marine, bottom-dwelling marine, abyssopelagic, abyssodemersal, bathypelagic and bathydemersal habitats. We recategorized these habitats into three habitat types based on salinity. River, stream, pond and lake habitats were considered ‘freshwater’ habitats; coastal, near shore and estuarine animals were considered ‘coastal’, and other open-water and bottom-living, non-coastal marine animals were considered ‘other marine’. We also recategorized these habitats into two habitat types based on whether light was abundant or not. Deep-water, abyssopelagic, abyssodemersal, bathypelagic and bathydemersal habitats receive little or no sunlight due to their depth in the water column and were considered ‘lightless’ habitats. All other habitats were considered ‘lit’ habitats.
Finally, we used FishBase, SealifeBase or field guides to identify the minimum and maximum depths for each species. We then used these data to calculate average depth per species (Daverage = (Dmax + Dmin) × 2−1).
(d) . Phylogenetic control
To control for the effect of phylogeny on visual sensitivity we built a phylogenetic tree of all animals in our analysis (figure 1). We acquired data from the Open Tree of Life (tree.opentreeoflife.org) database using used the function tnrs_match_names in the R package rotl [61]. We generated a phylogenetic tree using default arguments (context_name = ‘All life’, do_approximate_matching = TRUE, ids = NULL, include_suppressed = FALSE), and excluded species flagged as incertae cedis (25 species) and species which had no sequencing data in the Open Tree of Life database (six species). We created an induced subtree with the resulting data using the function tol_induced_subtree in the package rotl.
Figure 1.

Our phylogeny of species used in the meta-regressions. Both chordates and non-chordates experienced transitions from aquatic to terrestrial environments, and terrestrial chordates experienced a return to aquatic environments from terrestrial environments. Silhouettes representing sampled Metazoan phyla, clockwise from top: jellyfish: cnidarians; elephant: chordates; squid: mollusks; butterfly: arthropods. (Online version in colour.)
We used the root function in ape [62] to root the tree using S. cerevisiae (ottid: 5262624) from tree.opentreeoflife.org) as the outgroup. We computed branch lengths using the compute.brlen function in ape using default parameters (method = ‘Grafen’, power = 1). Finally, we randomly resolved polytomies using the multi2di function in ape with default parameters (random = TRUE, equiprob = TRUE). Subtrees of the primary tree were constructed as needed using the drop.tips function in ape.
(e) . Statistical analyses
We first determined whether broad habitat or lineage influences the longest λmax, shortest λmax, and range of λmax. As there was only one transition between invertebrates and vertebrates, and only a few (three) transitions between aquatic and terrestrial habitat, phylogenetic controls would have been underpowered, so we used the non-phylogenetically controlled glm function in R to construct generalized linear models with the formula λmax ∼ broad habitat × lineage.
We then subset our overall dataset for terrestrial animals and conducted a set of statistical analyses specific to terrestrial animals. To determine whether phylogeny influenced the effect of terrestrial habitat canopy type (closed; intermediate, open; or generalists, i.e. animals living in both closed or intermediate and open canopy habitats) on longest λmax, shortest λmax, and range of λmax, we used the phylolm function in the phylolm [63] package for R with the formulae λmax ∼ closed terrestrial + open terrestrial and λmax ∼ intermediate terrestrial + open terrestrial fitted using the lambda model and with a bootstrap of 100. However, since there were only two species that were intermediate habitat specialists, and they had similar visual spectra to those in closed canopies, we combined closed and intermediate habitat treatments into a single treatment and re-ran the phylolm using the new treatment levels (closed_intermediate versus open versus generalist).
We then subset our overall dataset for aquatic animals and conducted a set of statistical analyses specific to aquatic animals. We examined the effects of depth on visual sensitivities of aquatic animals. To determine whether phylogeny could explain extant differences in minimum, maximum, or average depth of habitat among longest λmax, shortest λmax, and range of λmax among aquatic species, we used the phylolm function in the phylolm package for R with the formula λmax ∼ depth fitted using the lambda model and with a bootstrap of 100. For these models, we used a subtree of our overall phylogenetic tree (see above), which omitted all terrestrial species.
Finally, we subset our overall dataset for open terrestrial, closed terrestrial animals and lit habitat aquatic (both freshwater and coastal) animals and conducted the following analyses. To determine whether phylogeny could explain extant differences in longest λmax, shortest λmax, and range of λmax between animals living in these four habitat types we used the phylolm function in the phylolm package for R using the formulae λmax ∼ coastal-aquatic + freshwater-aquatic + terrestrial-closed and λmax ∼ coastal-aquatic + freshwater-aquatic + terrestrial-open, fitted using the lambda model and with a bootstrap of 100.
3. Results
Our dataset included 1114 opsins from 446 species, from a total of 156 articles (See the electronic supplementary material: electronic supplementary material, table S1). Of these, 868 opsins were recorded from 355 aquatic species, and 246 opsins were recorded from 91 terrestrial species.
There are few (three) transitions from either aquatic to terrestrial species or from terrestrial to aquatic species, with two of these transitions in the vertebrate dataset and one in the invertebrate dataset (figure 1) and one transition from invertebrate species to vertebrate species. Controlling phylogeny in these cases would result in an unacceptably small sample size, so we used the glm function in R to construct generalized linear models with the formula λmax ∼ broad habitat × lineage.
(a) . Terrestrial species were maximally sensitive to longer wavelengths of light than aquatic species
Terrestrial species were maximally sensitive to longer wavelengths of light than aquatic species, independent of lineage (invertebrate or vertebrate) (GLM, n = 433: habitat p = 3.83 × 10⁻⁸, t = 5.600, lineage p = 0.309, t = −1.019; interaction: p = 0.595, t = −0.532; λmax longest long-wavelength terrestrial species: 535 ± 41.6 nm, aquatic species: 506 ± 30.6 nm, invertebrates: 513 ± 38.9 nm, vertebrates: 512 ± 33.0 nm) (figure 2a; electronic supplementary material, table S2).
Figure 2.
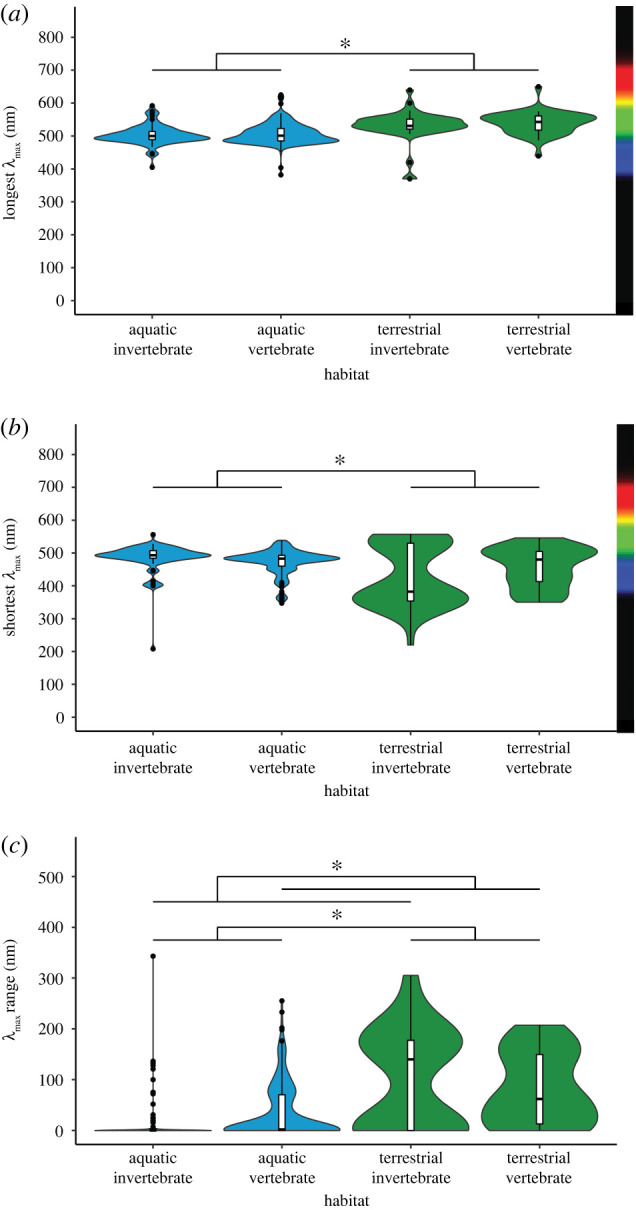
Effect of coarse habitat and lineage on mean visual pigment sensitivity. (a) Longest opsin: aquatic invertebrates: n = 78, µ = 503.3 nm; aquatic vertebrates: n = 273, µ = 507.6 nm; terrestrial invertebrates: n = 43, µ = 530.3 nm; terrestrial vertebrates: n = 39, µ = 539.1 nm. (b) Shortest opsin: aquatic invertebrates: n = 78, µ = 485.3 nm; aquatic vertebrates: n = 273 µ = 473.0 nm; terrestrial invertebrates: n = 43, µ = 430.1 nm; terrestrial vertebrates: n = 39, µ = 456.1 nm. (c) Opsin range: aquatic invertebrates: n = 78, µ = 18.0 nm; aquatic vertebrates: n = 273, µ = 34.6 nm; terrestrial invertebrates: n = 43, µ = 100.2 nm; terrestrial vertebrates: n = 39, µ = 83.0 nm. *p < 0.05. Analyses not controlled by phylogeny. (Online version in colour.)
(b) . Terrestrial species saw shorter wavelengths of light than aquatic species
Terrestrial species were maximally sensitive to shorter wavelengths of light than aquatic species; however, there was a significant interaction between habitat and lineage: aquatic vertebrates were more sensitive to short wavelengths than aquatic invertebrates and terrestrial invertebrates were more sensitive to short wavelengths than terrestrial vertebrates (GLM, n = 433: habitat p = 0.045, t = −2.012, lineage p = 0.051, t = 1.960, interaction: p = 2.34 × 10⁻³; t = −3.061; λmax shortest short-wavelength terrestrial species: 442 ± 79.2 nm, aquatic species: 476 ± 39.3 nm; invertebrates: 466 ± 70.2 nm, vertebrates: 471 ± 41.3 nm; figure 2b; electronic supplementary material, table S2).
(c) . Terrestrial species and invertebrates saw a larger range of wavelengths of light than aquatic species and vertebrates
Terrestrial species saw a larger range of wavelengths of light than aquatic species. In addition, there was a significant interaction between habitat and lineage: aquatic invertebrates saw a narrower range of wavelengths of light than aquatic vertebrates, but terrestrial invertebrates saw a broader range of wavelengths of light than terrestrial vertebrates. (GLM, n = 443: habitat p = 2.51 × 10⁻⁶, t = 4.772, lineage p = 0.03, t = −2.184, interaction: p = 0.00261; t = 2.232; λmax range terrestrial species: 92 ± 85.6 nm, aquatic species: 30.9 ± 51.6 nm; invertebrates: 47.2 ± 80.4 nm, vertebrates: 40.7 ± 56.7 nm; figure 2c; electronic supplementary material, tables S3 and S4).
(d) . Forest-woodland and open habitat species have similar spectral sensitivities
When considering all terrestrial species, including generalists, when examining the effect of more fine-grained habitat on visual sensitivity, we found that there was an influence of phylogenetic structure on the longest wavelengths of light (λPagel = 0.878) and on the range in wavelengths of light (λPagel = 0.823) that animals can best see. However, we found that there was no effect of phylogenetic structure on the shortest wavelengths of light (λPagel ≪ 0.01) that animals can best see. We found that there was no effect of tree canopy openness on longest λmax, shortest λmax, and range of λmax (electronic supplementary material, table S3).
(e) . Habitat depth did not influence sensitivity to long, short or range of wavelengths of light
When examining the effect of minimum depth on visual sensitivity, we found that there was no influence of phylogenetic structure on the effect of minimum depth had on the longest wavelengths of light aquatic animals could see (λPagel ≪ 0.01). There was an influence of phylogenetic structure on the effect that maximum and average depth had on the longest wavelengths of light aquatic animals could see (electronic supplementary material, table S5). Likewise, there was an influence of phylogenetic structure on the effect of minimum, maximum and average depth had upon the shortest wavelengths and range of wavelengths of light that aquatic animals could see (electronic supplementary material, table S5). We found that neither minimum, maximum, nor average depth influenced the longest, shortest or range in λmax that a species could see (see the electronic supplementary material, figures S2–S4, electronic supplementary material, table S5).
(f) . Animals in coastal and freshwater habitats saw shorter wavelengths of light while animals in forest + intermediate or open-canopy habitats saw longer wavelengths of light
When examining the effect of fine-grained habitat on visual sensitivity, we found that there was no influence of phylogenetic structure on the longest or shortest wavelengths of light animals could see (λPagel ≪ 0.01). We found that coastal and freshwater animals had similar longest λmax and shortest λmax. The longest and shortest λmax of animals living in coastal and freshwater habitats were shorter than that of animals living in closed or open terrestrial habitats. We found that, when we excluded habitat generalists from our analysis (relative to our analysis of all terrestrial animals, above), the longest and shortest λmax of animals living in open terrestrial habitats were shorter than that of animals living in closed habitats (figure 3 and table 1).
Figure 3.
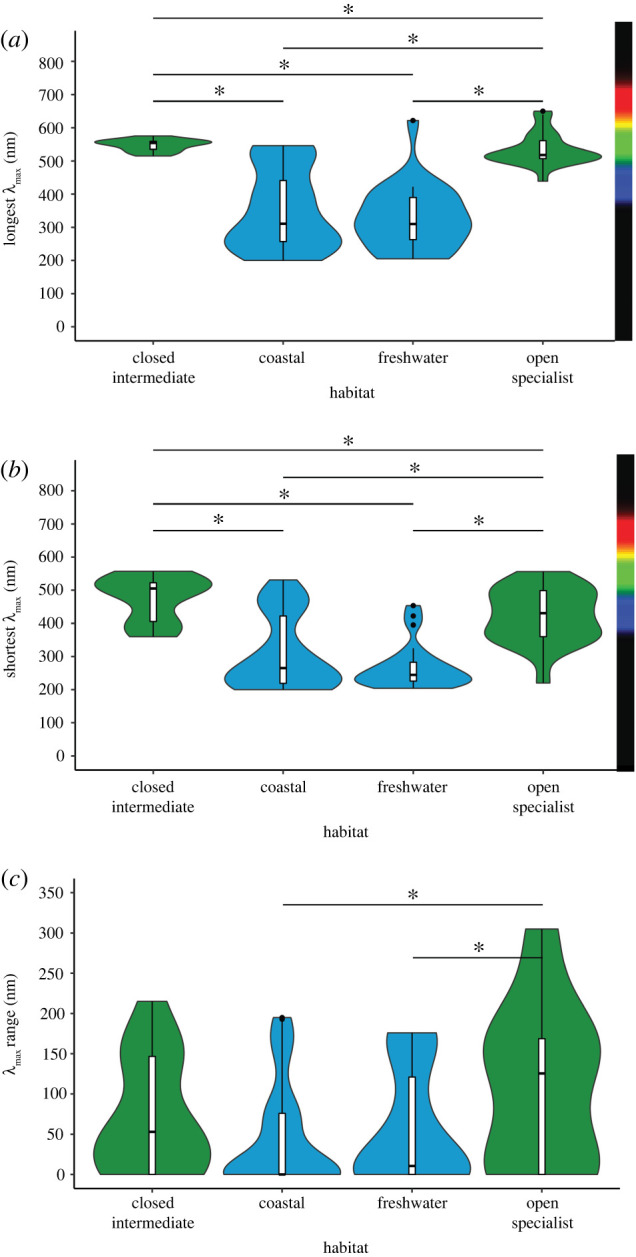
Effect of habitat greenness on visual sensitivities. (a) Longest opsin: forest + intermediate: n = 14, µ = 547.1 nm, s.d. = 17.71 nm; coastal: n = 40, µ = 297.3 nm, s.d. = 72.42 nm; freshwater: n = 23, µ = 314.3 nm, s.d. = 73.77 nm; open terrestrial: n = 22, µ = 534.1 nm, s.d. = 49.09 nm. (b) Shortest opsin: forest + intermediate: n = 14, µ = 470.4 nm, s.d. = 60.00 nm; coastal: n = 40, µ = 254.4 nm, s.d. = 55.16 nm; freshwater: n = 23, µ = 261.1 nm, s.d. = 56.52 nm; open terrestrial: n = 22, µ = 423.4 nm, s.d. = 82.06 nm. (c) Opsin range: forest + intermediate: n = 14, µ = 76.63 nm, s.d. = 72.61 nm; coastal: n = 40, µ = 742.88 nm, s.d. = 70.15 nm; freshwater: n = 23, µ = 53.26 nm, s.d. = 69.30 nm; open: n = 22, µ = 110.6 nm, s.d. = 98.82 nm. *p < 0.05. Analyses controlled for phylogeny. (Online version in colour.)
Table 1.
Effect of habitat greenness on longest λmax, shortest λmax and λmax range, with phylogenetic control. Numbers in bold are statistically significant.
| habitats compared | λmax | s.e. | t-value | lower bound of confidence interval | upper bound of confidence interval | p-value |
|---|---|---|---|---|---|---|
| open versus coastal | longest | 16.76 | −14.13 | −273.4 | 561.3 | <2 × 10⁻¹⁶ |
| open versus freshwater | longest | 16.83 | −11.67 | −255.1 | −211.3 | <2 × 10⁻¹⁶ |
| open versus closed + intermediate | longest | 21.59 | 0.602 | −29.47 | −187.3 | <2 × 10⁻¹⁶ |
| coastal versus freshwater | longest | 16.53 | 1.032 | −16.38 | 46.185 | 0.304 |
| coastal versus closed + intermediate | longest | 19.61 | 12.74 | 216.7 | 284.16 | <2 × 10⁻¹⁶ |
| closed versus freshwater | longest | 21.41 | −0.602 | −61.47 | 23.807 | <2 × 10⁻¹⁶ |
| open versus coastal | shortest | 17.02 | −9.934 | −198.0 | −136.8 | 2.3 × 10⁻¹⁶ |
| open versus freshwater | shortest | 19.12 | −8.492 | −191.7 | −128.0 | 2.7 × 10⁻¹³ |
| open versus closed + intermediate | shortest | 21.92 | 2.144 | 2.180 | 89.627 | 0.03456 |
| coastal versus freshwater | shortest | 16.78 | 0.399 | −30.83 | 35.106 | 0.691 |
| coastal versus closed + intermediate | shortest | 19.91 | 10.85 | 176.1 | 249.89 | <2 × 10⁻¹⁶ |
| closed versus freshwater | shortest | 21.73 | −9.635 | −244.1 | −172.5 | 1.0 × 10⁻¹⁵ |
| open versus coastal | range | 28.33 | −3.07 | −143.1 | −21.56 | 0.0028 |
| open versus freshwater | range | 32.72 | −2.23 | −133.4 | −14.17 | 0.0279 |
| open versus closed + intermediate | range | 25.61 | −1.32 | −75.37 | 13.5 | 0.1905 |
| coastal versus freshwater | range | 21.68 | 0.641 | −14.41 | 54.18 | 0.5228 |
| coastal versus closed + intermediate | range | 31.14 | 1.71 | −1.917 | 104.5 | 0.0907 |
| closed versus freshwater | range | 35.17 | −1.12 | −94.61 | 39.09 | 0.2262 |
(g) . Open terrestrial animals had a broader visual range than coastal or freshwater animals
When examining the effect of fine-grained habitat on visual sensitivity, we found that there was an influence of phylogenetic structure on the range of wavelengths of light animals could see (λPagel = 0.226). We found that open terrestrial animals had a wider visual range than aquatic freshwater or coastal animals, while there was no significant effect between any other pairs of habitats on visual range (figure 3 and table 1).
4. Discussion
(a) . The transition from aquatic to terrestrial habitats has influenced animal vision
We found that terrestrial species see longer long-wavelength light and a larger range of wavelengths of light overall compared to aquatic species. Few other studies have broadly investigated the effect of the evolutionary transition between aquatic and terrestrial habitats on colour vision. However, transitions from aquatic to terrestrial life stages that lead to the development of different visual abilities can indicate the necessity of different strategies for perceiving the world [49]. Such studies have been conducted within single species: for example, in several species of dragonfly adults have short wavelength-shifted vision, among other differences [49,50], and similar transitions have been observed in southern leopard frogs [64]. Just as animal development favours the expression of environmentally matched opsins over an intra-generational time scale, our results suggest that evolutionary adaptation favours the use of environmentally matched opsins over an inter-generational time scale.
The results of our terrestrial versus aquatic models are congruent with the visual tuning hypothesis, which states that animal visual systems evolve to detect the light in their environments [23]. Terrestrial animals are exposed to a dynamic range of wavelengths of light that changes throughout the day, including both short- and long-wavelength light, as well as ultraviolet light in large forest gaps and open environments [25,26]. By contrast, aquatic animals, which we found to be less sensitive to long-wavelength and ultraviolet light, live in environments that are exposed to relatively less long-wavelength and ultraviolet light [24]. While our dataset did not contain large numbers of aquatic-to-terrestrial transitions, it did contain aquatic-to-terrestrial habitat transitions in two animal phyla and encompasses transitions in both vertebrate and invertebrate taxa. Without phylogenetic controls, our coarse-grained analyses suggest that animals are likely to be maximally sensitive to wavelengths of light most often present in their environment and insensitive to wavelengths of light likely to be absent.
(b) . Canopy coverage may influence visual tuning
The results from our fine-grained habitat analyses that excluded generalists suggest that animals living in closed habitats see longer wavelengths of light than animals living in open habitats. This suggests the forest canopy, which admits mostly middle-wavelength light [25,26], influences terrestrial animals' visual tuning, a result consistent with studies performed in birds and nocturnal mammals [65,66]. The loss of this effect once generalists are considered may reflect the wide visual range required of animals that transition between open and forest habitats, or the relatively low sampling of forest and open habitat terrestrial animals.
Additionally, animals may choose to use light microhabitats which are suitable to their current visual physiology. Endler & Théry [18] observed that forest birds use areas in which they are most conspicuous to advertise to potential mates. Some species also modify their habitats to improve the visibility of their visual displays. For example, male golden-collared manakins clean the arenas they use to court females to improve their plumage's contrast against the arena background [67]. Arena cleaning also improves white-bearded manakins' ability to detect predators [68]. In such cases, evolution may be driving site preferences which match vision rather than driving vision to match site preferences, a complete reversal of the mechanism investigated in our study.
(c) . The ciliary/rhabdomeric opsin divergence may impact the wavelengths of light that animals can see
We found that invertebrates see a broader range of wavelengths of light than vertebrates. Invertebrates, which use rhabdomeric photoreceptors for vision, have opsins that are maximally sensitive to ultraviolet light [31,69–74]. By contrast, comparatively few vertebrates, which use ciliary photoreceptors for vision, have opsins that are maximally sensitive to UV light, although several species of birds and fish are sensitive to ultraviolet light [40,75–77]. Additionally, many mammals have corneas that selectively filter UV, inhibiting their ability to see those wavelengths [78,79]. Both ciliary and rhabdomeric opsins are thought to have been present in the urbilaterian, the common ancestor of all modern animals save sponges, cnidarians, placozoans and ctenophores [55]. The emergence in chordates of ciliary opsins for vision rather than photoentrainment represents a singular event, one that may have also heralded differences in visual perception associated with reduced sensitivity to short wavelengths of light.
(d) . Phylogeny may mitigate the effect of habitat
In many of the analyses where we found phylogenetic signatures in our data, we did not recover effects of habitat on visual sensitivity. This may suggest that evolutionary history limits animals' ability to perform visual tuning, especially within coarse-grained habitats. Our findings differ from those of many studies looking at individual animal clades. For example, a 2018 survey found that fish living at depth were found to have reduced chromacy even after controlling for phylogeny [47]. Likewise, a historic study of cottoid fish in Lake Baikal found a correlation between lambda-max and habitat depth when not controlling for phylogeny [80]. Additionally, studies of marine mammals found that species that forage near the surface have visual pigments resembling those of terrestrial mammals [81]. By contrast, those that foraged at depth had visual pigments with amino acid substitutions that shifted the λmax towards shorter wavelengths [81]. The photoreceptors of nocturnally foraging terrestrial animals that live in forested habitats likewise have peak absorbances which match the peak flux of light in the night-time forest [66]. Bird species which live in forests have higher normalized expression of long-wave opsin genes compared to bird species which live in open habitats, and bird species native to open habitats have higher normalized expression of ultraviolet-sensitive opsin genes compared to forest birds [65]. This opens a potential, additional route allowing visual tuning to exist without the need for changes to the wavelength of maximum sensitivity. However, our findings of limited spectral tuning in fine-grained habitats in terrestrial settings do correspond to those of a recent (2021) review of terrestrial and insect colour vision which suggests that there are not functional differences in the kinds of opsins expressed by insects [82]. That differences in range of λmax were maintained between open terrestrial and freshwater animals and between open terrestrial and coastal animals after phylogenetic control (table 1) suggests that there is at least some effect of habitat on visual sensitivity.
The effect of the c-opsin/ r-opsin divergence on vision is difficult to discern in a phylogenetic context since this transition happened once and maps on to the metazoan phylogenetic tree. However, both invertebrate and vertebrate visual pigments are structurally well-conserved, and changes in the polarity of specific amino acid residues leads to similar shifts in the wavelength of maximum sensitivity in both vertebrates and invertebrates [83]. Retinal is covalently bound to opsin via a Schiff base and the charges of the amino acid residues near the Schiff base influence the ability of retinal to change conformation and λmax of the associated opsin [84,85], which has been experimentally confirmed using directed mutagenesis [37,86,87]. Opsin sequence duplication followed by divergence has been observed in many taxa, especially among invertebrates, though electrophysiological investigation of the effects of these sequence divergences has been under-studied [50]. Thus, opsin evolutionary history such as mutation biases and duplications may account for the effect of phylogeny on visual ability in our analyses. Future research should consider whether there are inherent differences in the electronic charge of the binding pocket between ciliary and rhabdomeric type opsins and should examine the physiological consequences of sequence divergence. Additionally, studies examining whether non-opsin means of visual tuning, including the differential absorption of light by screening pigments, differ between animals which use ciliary and rhabdomeric opsins and which live in the same light environment may prove particularly illuminating.
(e) . Expanding invertebrate opsin data may offer new insights into spectral tuning
Our study incorporates the visual sensitivities of both invertebrates and vertebrates into its analyses. However, the number of sighted aquatic vertebrate species, particularly ray-finned fishes, are relatively overrepresented, considering the number of species of sighted invertebrates and sighted terrestrial vertebrates that exist. Invertebrates, especially arthropods, have been found to exhibit striking diversity in the wavelengths of light they can best see [50,73,88]. Future studies focusing on documenting visual diversity among invertebrate species and including a greater number of phyla that have undergone aquatic to terrestrial transitions (Mollusca and Annelida, for example) may paint a fuller picture of visual adaptations across the Metazoa and broaden our understanding of constraints to visual tuning.
5. Conclusion
Here we used visual sensitivity data from nearly 450 animal species and four phyla to conduct a systematic survey of the effects of habitat light on the wavelengths of light animals are most sensitive to. We found that terrestrial animals and aquatic animals possess different ranges of spectral sensitivity from each other, but that evolutionary processes such as the c-opsin/r-opsin transition may have limited chordates' ability to tune their opsins to blue light. Additionally, we only recover an effect of forest canopy cover on the spectral tuning of animals living in terrestrial habitats when excluding habitat generalists. Future research should consider whether inherent differences between chordate and non-chordate opsin amino acid sequences, or downstream neural signalling, are responsible for evolutionary limitations to visual tuning.
Acknowledgements
We would like to thank Adam Siepielski for training in meta-analysis, Jeremy Beaulieu for advice on conducting phylogenetically weighted regressions and Nagayasu Nakanishi for his valuable feedback on early versions of this project and manuscript.
Data accessibility
Data pertaining to this study are available in the electronic supplementary material [89] or from Dryad Digital Repository [90]. Code pertaining to this study is available at GitHub repository: https://github.com/mjosmurphy/opsin-evolutionary-ecology.
Authors' contributions
M.J.M.: conceptualization, data curation, formal analysis, methodology, writing—original draft; E.L.W.: conceptualization, funding acquisition, methodology, writing—original draft.
Both authors gave final approval for publication and agreed to be held accountable for the work performed therein.
Conflict of interest declaration
We declare we have no competing interests.
Funding
This project was partially supported by the University of Arkansas and by an Arkansas Biosciences Institute grant to E.L.W.
References
- 1.Uetz GW, Roberts JA, Taylor PW. 2009. Multimodal communication and mate choice in wolf spiders: female response to multimodal versus unimodal signals. Anim. Behav. 78, 299-305. ( 10.1016/j.anbehav.2009.04.023) [DOI] [Google Scholar]
- 2.Thurman TJ, Seymoure BM. 2015. A bird's eye view of two mimetic tropical butterflies: coloration matches predator's sensitivity. J. Zool. 298, 159-168. ( 10.1111/jzo.12305) [DOI] [Google Scholar]
- 3.Lindstrôm L, Rowe C, Guilford T. 2001. Pyrazine odour makes visually conspicuous prey aversive. Proc. R. Soc. Lond. B 268, 159-162. ( 10.1098/rspb.2000.1344) [DOI] [PMC free article] [PubMed] [Google Scholar]
- 4.Endler JA. 1978. A Predator's View of Animal Color Patterns. In Evolutionary biology, vol. 11 (eds Hecht MK, Steere WC, Wallace B), pp. 319-364. New York, NY: Plenum Press. [Google Scholar]
- 5.Cheroske AG, Cronin TW, Durham MF, Caldwell RL. 2009. Adaptive signalling behaviour in stomatopods under varying light conditions. Mar. Freshw. Behav. Physiol. 42, 219-232. ( 10.1080/10236240903169222) [DOI] [Google Scholar]
- 6.Endler JA. 1992. Signals, signal conditions, and the direction of evolution. Am. Nat. 139, S125-S153. ( 10.1086/285308) [DOI] [Google Scholar]
- 7.Guilford T, Dawkins MS. 1991. Receiver psychology and the evolution of animal signals. Anim. Behav. 42, 1-14. ( 10.1016/S0003-3472(05)80600-1) [DOI] [Google Scholar]
- 8.Majerus MEN, Brunton CFA, Stalker J. 2000. A bird's eye view of the peppered moth. J. Evol. Biol. 13, 155-159. ( 10.1046/j.1420-9101.2000.00170.x) [DOI] [Google Scholar]
- 9.Cook LM, Grant BS, Saccheri IJ. 2012. Selective bird predation on the peppered moth: the last experiment of Michael Majerus. Biol. Lett. 8, 609-612. ( 10.1098/rsbl.2011.1136) [DOI] [PMC free article] [PubMed] [Google Scholar]
- 10.Johnsen S, Sosik HM. 2003. Cryptic coloration and mirrored sides as camouflage strategies in near-surface pelagic habitats: implications for foraging and predator avoidance. Limnol. Oceanogr. 48, 1277-1288. ( 10.4319/lo.2003.48.3.1277) [DOI] [Google Scholar]
- 11.Johnsen S. 2005. The red and the black: bioluminescence and the color of animals in the deep sea. Integr. Comp. Biol. 45, 234-246. ( 10.1093/icb/45.2.234) [DOI] [PubMed] [Google Scholar]
- 12.Harmon JP, Losey E. 1998. The role of vision and color in the close proximity foraging behavior of four coccinellid species. Oecologia 115, 287-292. ( 10.1007/s004420050518) [DOI] [PubMed] [Google Scholar]
- 13.Endler JA, Day LB. 2006. Ornament colour selection, visual contrast and the shape of colour preference functions in great bowerbirds, Chlamydera nuchalis. Anim. Behav. 72, 1405-1416. ( 10.1016/j.anbehav.2006.05.005) [DOI] [Google Scholar]
- 14.Heindl M, Winkler H. 2003. Female canaries (Serinus canaria) associate more with males that contrast strongly against the background. Ethology 109, 259-271. ( 10.1046/j.1439-0310.2003.00869.x) [DOI] [Google Scholar]
- 15.Fleishman LJ, Wadman CS, Maximov KJ. 2020. The interacting effects of total light intensity and chromatic contrast on visual signal visibility in an Anolis lizard. Anim. Behav. 167, 263-273. ( 10.1016/j.anbehav.2020.07.008) [DOI] [Google Scholar]
- 16.Gomez D, Théry M. 2004. Influence of ambient light on the evolution of colour signals: comparative analysis of a Neotropical rainforest bird community. Ecol. Lett. 7, 279-284. ( 10.1111/j.1461-0248.2004.00584.x) [DOI] [Google Scholar]
- 17.Pincebourde S, Théry M, Feer F. 2008. Dusk light environment optimizes visual perception of conspecifics in a crepuscular horned beetle. Behav. Ecol. 29, 627-634. ( 10.1093/beheco/arn024) [DOI] [Google Scholar]
- 18.Endler JA, Théry M. 1996. Interacting effects of lek placement, display behavior, ambient light, and color patterns in three neotropical forest-dwelling birds. Am. Nat. 148, 421-452. ( 10.1086/285934) [DOI] [Google Scholar]
- 19.Håstad O, Victorsson J, Ödeen A. 2005. Differences in color vision make passerines less conspicuous in the eyes of their predators. Proc. Natl Acad. Sci. USA 102, 6391-6394. ( 10.1073/pnas.0409228102) [DOI] [PMC free article] [PubMed] [Google Scholar]
- 20.Cole GL, Endler JA. 2016. Male courtship decisions are influenced by light environment and female receptivity. Proc. R. Soc. B 283, 20160861. ( 10.1098/rspb.2016.0861) [DOI] [PMC free article] [PubMed] [Google Scholar]
- 21.Marshall KLA, Stevens M. 2014. Wall lizards display conspicuous signals to conspecifics and reduce detection by avian predators. Behav. Ecol. 25, 1325-1337. ( 10.1093/beheco/aru126) [DOI] [PMC free article] [PubMed] [Google Scholar]
- 22.Sherratt TN, Beatty CD. 2003. The evolution of warning signals as reliable indicators of prey defense. Am. Nat. 162, 377-389. ( 10.1086/378047) [DOI] [PubMed] [Google Scholar]
- 23.Cronin TW, Johnsen S, Marshall NJ, Warrant EJ. 2014. Visual ecology. Princeton, NJ: Princeton University Press. [Google Scholar]
- 24.Lythgoe JN. 1979. The ecology of vision. New York, NY: Oxford University Press. [Google Scholar]
- 25.Endler JA. 1993. The color of light in forests and its implications. Ecol. Monogr. 63, 1-27. ( 10.2307/2937121) [DOI] [Google Scholar]
- 26.Federer CA, Tanner CB. 1966. Spectral distribution of light in the forest. Ecology 47, 555-560. ( 10.2307/1933932) [DOI] [Google Scholar]
- 27.Arikawa K, Stavenga D. 1997. Random array of colour filters in the eyes of butterflies. J. Exp. Biol. 200, 2501-3256. ( 10.1242/jeb.200.19.2501) [DOI] [PubMed] [Google Scholar]
- 28.Arikawa K, Scholten DGW, Kinoshita M, Stavenga DG, Arikawa K, Scholten DGW, Kinoshita M. 1999. Tuning of photoreceptor spectral sensitivities by red and yellow pigments in the butterfly Papilio xuthus. Zoolog. Sci. 16, 17-24. ( 10.2108/zsj.16.17) [DOI] [Google Scholar]
- 29.Stavenga DG, Arikawa K. 2006. Evolution of color and vision of butterflies. Arthropod Struct. Dev. 35, 307-318. ( 10.1016/j.asd.2006.08.011) [DOI] [PubMed] [Google Scholar]
- 30.Stavenga DG. 2002. Reflections on colourful ommatidia of butterfly eyes. J. Exp. Biol. 205, 1077-1085. ( 10.1242/jeb.205.8.1077) [DOI] [PubMed] [Google Scholar]
- 31.Cronin TW, Marshall NJ. 1989. Multiple spectral classes of photoreceptors in the retinas of gonodactyloid stomatopod crustaceans. J. Comp. Physiol. A 166, 261-275. ( 10.1007/BF00193471) [DOI] [Google Scholar]
- 32.Ogawa Y, Awata H, Wakakuwa M, Kinoshita M, Stavenga DG, Arikawa K. 2012. Coexpression of three middle wavelength-absorbing visual pigments in sexually dimorphic photoreceptors of the butterfly Colias erate. J. Comp. Physiol. A Neuroethol. Sensory. Neural. Behav. Physiol. 198, 857-867. ( 10.1007/s00359-012-0756-8) [DOI] [PubMed] [Google Scholar]
- 33.Hart NS, Partridge JC, Cuthill IC. 1999. Visual pigments, cone oil droplets, ocular media and predicted spectral sensitivity in the domestic turkey (Meleagris gallopavo). Vision Res. 39, 3321-3328. ( 10.1016/S0042-6989(99)00071-1) [DOI] [PubMed] [Google Scholar]
- 34.Hart NS. 2004. Microspectrophotometry of visual pigments and oil droplets in a marine bird, the wedge-tailed shearwater Puffinus pacificus: topographic variations in photoreceptor spectral characteristics. J. Exp. Biol. 207, 1229-1240. ( 10.1242/jeb.00857) [DOI] [PubMed] [Google Scholar]
- 35.Beason RC, Loew ER. 2008. Visual pigment and oil droplet characteristics of the bobolink (Dolichonyx oryzivorus), a new world migratory bird. Vision Res. 48, 1-8. ( 10.1016/j.visres.2007.10.006) [DOI] [PubMed] [Google Scholar]
- 36.Yokoyama S, Radlwimmer FB, Blow NS. 2000. Ultraviolet pigments in birds evolved from violet pigments by a single amino acid change. Proc. Natl Acad. Sci. USA 97, 7366-7371. ( 10.1073/pnas.97.13.7366) [DOI] [PMC free article] [PubMed] [Google Scholar]
- 37.Yokoyama R, Knox BE, Yokoyama S. 1995. Rhodopsin from the fish, Astyanax: role of tyrosine 261 in.the red shift. Investig. Ophthalmol. Vis. Sci. 36, 939-945. [PubMed] [Google Scholar]
- 38.Carvalho LS, Cowing JA, Wilkie SE, Bowmaker JK, Hunt DM. 2007. The molecular evolution of avian ultraviolet- and violet-sensitive visual pigments. Mol. Biol. Evol. 24, 1843-1852. ( 10.1093/molbev/msm109) [DOI] [PubMed] [Google Scholar]
- 39.Butlin R, et al. 2012. What do we need to know about speciation? Trends Ecol. Evol. 27, 27-39. ( 10.1016/j.tree.2011.09.002) [DOI] [PubMed] [Google Scholar]
- 40.Van Hazel I, Sabouhanian A, Day L, Endler JA, Chang BS.. 2013. Functional characterization of spectral tuning mechanisms in the great bowerbird short-wavelength sensitive visual pigment (SWS1), and the origins of UV/violet vision in passerines and parrots. BMC Evol. Biol. 13, 250. ( 10.1186/1471-2148-13-250) [DOI] [PMC free article] [PubMed] [Google Scholar]
- 41.Townson SM, Chang BSW, Salcedo E, Chadwell LV, Pierce NE, Britt SG. 1998. Honeybee blue- and ultraviolet-Sensitive opsins: cloning, heterologous expression in Drosophila, and physiological characterization. J. Neurosci. 18, 2412-2422. ( 10.1523/JNEUROSCI.18-07-02412.1998) [DOI] [PMC free article] [PubMed] [Google Scholar]
- 42.Yokoyama S. 2002. Molecular bases of color vision in vertebrates. Genes Genet. Syst. 74, 189-199. ( 10.1266/ggs.74.189) [DOI] [PubMed] [Google Scholar]
- 43.Yokoyama S, Bernhard Radlwimmer F. 2001. The molecular genetics and evolution of red and green color vision in vertebrates. Genetics 158, 1697-1710. ( 10.1093/genetics/158.4.1697) [DOI] [PMC free article] [PubMed] [Google Scholar]
- 44.Frentiu FD, Briscoe AD. 2008. A butterfly eye's view of birds. Bioessays 30, 1151-1162. ( 10.1002/bies.20828) [DOI] [PubMed] [Google Scholar]
- 45.Hunt DM, Wilkie SE, Bowmaker JK, Poopalasundaram S. 2001. Vision in the ultraviolet. Cell. Mol. Life Sci. 58, 1583-1598. ( 10.1007/PL00000798) [DOI] [PMC free article] [PubMed] [Google Scholar]
- 46.Fasick JI, Robinson PR. 2000. Spectral-tuning mechanisms of marine mammal rhodopsins and correlations with foraging depth. Vis. Neurosci. 17, 781-788. ( 10.1017/S095252380017511X) [DOI] [PubMed] [Google Scholar]
- 47.Schweikert LE, Fitak RR, Caves EM, Sutton TT, Johnsen S. 2018. Spectral sensitivity in ray-finned fishes: diversity, ecology, and shared descent. J. Exp. Biol. 221, jeb189761. ( 10.1242/jeb.189761) [DOI] [PubMed] [Google Scholar]
- 48.Partridge JC, Shand J, Archer SN, van Groningen-Luyben WAH. 1989. Interspecific variation in the visual pigments of deep-sea fishes. J. Comp. Physiol. A 164, 513-529. ( 10.1007/BF00610445) [DOI] [PubMed] [Google Scholar]
- 49.Chou A, Lin C, Cronin TW. 2020. Visual metamorphoses in insects and malacostracans: transitions between an aquatic and terrestrial life. Arthropod Struct. Dev. 59, 100974. ( 10.1016/j.asd.2020.100974) [DOI] [PubMed] [Google Scholar]
- 50.Futahashi R, Kawahara-miki R, Kinoshita M, Yoshitake K, Yajima S. 2015. Extraordinary diversity of visual opsin genes in dragonflies. Proc. Natl Acad. Sci. USA 112, 81-118. ( 10.1073/pnas.1424670112) [DOI] [PMC free article] [PubMed] [Google Scholar]
- 51.Almudi I, et al. 2020. Genomic adaptations to aquatic and aerial life in mayflies and the origin of insect wings. Nat. Commun. 11, 1-11. ( 10.1038/s41467-020-16284-8) [DOI] [PMC free article] [PubMed] [Google Scholar]
- 52.Schott RK, Bell RC, Loew ER, Thomas KN, Gower DJ, Streicher JW, Fujita MK. 2021. Genomic and spectral visual adaptation in southern leopard frogs during the ontogenetic transition from aquatic to terrestrial light environments. bioRxiv Prepr. ( 10.1101/2021.02.19.432049) [DOI]
- 53.Labhart T, Nilsson DE. 1995. The dorsal eye of the dragonfly Sympetrum: specializations for prey detection against the blue sky. J. Comp. Physiol. A 176, 437-453. ( 10.1007/BF00196410) [DOI] [Google Scholar]
- 54.Porter ML, Blasic JR, Bok MJ, Cameron EG, Pringle T, Cronin TW, Robinson PR. 2011. Shedding new light on opsin evolution. Proc. R. Soc. B 279, 3-14. ( 10.1098/rspb.2011.1819) [DOI] [PMC free article] [PubMed] [Google Scholar]
- 55.Arendt D, Wittbrodt J. 2001. Reconstructing the eyes of Urbilateria. Phil. Trans. R. Soc. B 356, 20010971. ( 10.1098/rstb.2001.0971) [DOI] [PMC free article] [PubMed] [Google Scholar]
- 56.Ullmann JFP, Gallagher T, Hart NS, Barnes AC, Smullen RP, Collin SP, Temple SE. 2011. Tank color increases growth, and alters color preference and spectral sensitivity, in barramundi (Lates calcarifer). Aquaculture 322–323, 235-240. ( 10.1016/j.aquaculture.2011.10.005) [DOI] [Google Scholar]
- 57.Fuller RC, Claricoates KM. 2011. Rapid light-induced shifts in opsin expression: finding new opsins, discerning mechanisms of change, and implications for visual sensitivity. Mol. Ecol. 20, 3321-3335. ( 10.1111/j.1365-294X.2011.05180.x) [DOI] [PubMed] [Google Scholar]
- 58.Nowak RM. 1983. Walker’s mammals of the world, 4th edn. Baltimore, MD: Johns Hopkins University Press. [Google Scholar]
- 59.Opler PA, Malikul V. 1999. A field guide to eastern butterflies. Boston, MA: Houghton Mifflin Harcourt. [Google Scholar]
- 60.Opler PA. 1999. A field guide to butterflies of western North America. Boston, MA: Houghton Mifflin Harcourt. [Google Scholar]
- 61.Hinchliff C, et al. 2015. Synthesis of phylogeny and taxonomy into a comprehensive tree of life. Proc. Natl Acad. Sci. USA 112, 12 764-12 769. ( 10.1073/pnas.1423041112) [DOI] [PMC free article] [PubMed] [Google Scholar]
- 62.Paradis E, Schliep K. 2018. ape 5.0: an environment for modern phylogenetics and evolutionary analyses in R. Bioinformatics 35, 526-528. ( 10.1093/bioinformatics/bty633) [DOI] [PubMed] [Google Scholar]
- 63.Ho L, Ane C. 2014. A linear-time algorithm for Gaussian and non-Gaussian trait evolution models. Syst. Biol. 63, 397-408. ( 10.1093/sysbio/syu005) [DOI] [PubMed] [Google Scholar]
- 64.Schott RK, Bell RC, Loew ER, Thomas KN, Gower DJ, Streicher JW, Fujita MK. 2021. Genomic and spectral visual adaptation in southern leopard frogs during the ontogenetic transition from aquatic to terrestrial light environments. bioRxiv. ( 10.1101/2021.02.19.432049) [DOI]
- 65.Bloch NI. 2015. Evolution of opsin expression in birds driven by sexual selection and habitat. Proc. R. Soc. B 282, 20142321. ( 10.1098/rspb.2014.2321) [DOI] [PMC free article] [PubMed] [Google Scholar]
- 66.Veilleux CC, Cummings ME. 2012. Nocturnal light environments and species ecology: implications for nocturnal color vision in forests. J. Exp. Biol. 215, 4085-4096. ( 10.1242/jeb.071415) [DOI] [PubMed] [Google Scholar]
- 67.Uy JAC, Endler JA. 2004. Modification of the visual background increases the conspicuousness of golden-collared manakin displays. Behav. Ecol. 15, 1003-1010. ( 10.1093/beheco/arh106) [DOI] [Google Scholar]
- 68.Cestari C, Aurélio Pizo M. 2014. Court cleaning behavior of the White-Bearded Manakin (Manacus manacus) and a test of the anti-predation hypothesis. Wilson J. Ornithol. 126, 98-104. ( 10.1676/13-032.1) [DOI] [Google Scholar]
- 69.Yang E, Osorio D. 1991. Spectral sensitivities of photoreceptors and lamina monopolar cells in the dragonfly, Hemicordula tau. J. Comp. Physiol. A 169, 663-669. ( 10.1007/BF00194895) [DOI] [Google Scholar]
- 70.Bybee SM, Yuan F, Ramstetter MD, Llorente-Bousquets J, Reed RD, Osorio D, Briscoe AD. 2012. UV photoreceptors and UV-yellow wing pigments in Heliconius butterflies allow a color signal to serve both mimicry and intraspecific communication. Am. Nat. 179, 38-51. ( 10.1086/663192) [DOI] [PubMed] [Google Scholar]
- 71.Briscoe AD. 2008. Reconstructing the ancestral butterfly eye: focus on the opsins. J. Exp. Biol. 211, 1805-1813. ( 10.1242/jeb.013045) [DOI] [PubMed] [Google Scholar]
- 72.Everett A, Tong X, Briscoe AD, Monteiro A. 2012. Phenotypic plasticity in opsin expression in a butterfly compound eye complements sex role reversal. BMC Evol. Biol. 12(232), 1-11. ( 10.1186/1471-2148-12-232) [DOI] [PMC free article] [PubMed] [Google Scholar]
- 73.Arikawa K, Stavenga DG. 2014. Insect photopigments: photoreceptor spectral sensitivities and visual adaptations. In Evolution of visual and Non-visual pigments (eds Hunt DM, Hankins MW, Collin SP, Marshall NJ), pp. 1-276. New York, NY: Springer. [Google Scholar]
- 74.Arikawa K. 2005. Sexual dimorphism of short-wavelength photoreceptors in thesmall white butterfly, Pieris rapae crucivora. J. Neurosci. 25, 5935-5942. ( 10.1523/JNEUROSCI.1364-05.2005) [DOI] [PMC free article] [PubMed] [Google Scholar]
- 75.Carvalho LS, Knott B, Berg ML, Bennett ATD, Hunt DM. 2011. Ultraviolet-sensitive vision in long-lived birds. Proc. R. Soc. B 278, 107-114. ( 10.1098/rspb.2010.1100) [DOI] [PMC free article] [PubMed] [Google Scholar]
- 76.Losey GS, Cronin TW, Goldsmith TH, Hyde D, Marshall NJ, McFarland WN. 1999. The UV visual world of fishes: a review. J. Fish Biol. 54, 921-943. ( 10.1111/j.1095-8649.1999.tb00848.x) [DOI] [Google Scholar]
- 77.Marshall NJ, Jennings K, McFarland WN, Loew ER, Losey GS. 2003. Visual biology of Hawaiian coral reef fishes. II. Colors of Hawaiian coral reef fish. Copeia 2003, 455-466. ( 10.1643/01-055) [DOI] [Google Scholar]
- 78.Douglas RH, Jeffery G. 2014. The spectral transmission of ocular media suggests ultraviolet sensitivity is widespread among mammals. Proc. R. Soc. B 281, 20132995. ( 10.1098/rspb.2013.2995) [DOI] [PMC free article] [PubMed] [Google Scholar]
- 79.Hogg C, Neveu M, Stokkan K-A, Folkow L, Cottrill P, Douglas R, Hunt DM, Jeffery G. 2011. Arctic reindeer extend their visual range into the ultraviolet. J. Exp. Biol. 214, 2014-2019. ( 10.1242/jeb.053553) [DOI] [PubMed] [Google Scholar]
- 80.Bowmaker JK, Govardovskii VI, Shukolyukov SA, Zueva J L.V., Hunt DM, Sideleva VG, Smirnova OG. 1994. Visual pigments and the photic environment: the cottoid fish of Lake Baikal. Vision Res. 34, 591-605. ( 10.1016/0042-6989(94)90015-9) [DOI] [PubMed] [Google Scholar]
- 81.Levenson DH, Ponganis PJ, Crognale MA, Deegan JF, Dizon A, Jacobs GH. 2006. Visual pigments of marine carnivores: pinnipeds, polar bear, and sea otter. J. Comp. Physiol. A Neuroethol. Sensory, Neural, Behav. Physiol. 192, 833-843. ( 10.1007/s00359-006-0121-x) [DOI] [PubMed] [Google Scholar]
- 82.Van Der Kooi CJ, Stavenga DG, Arikawa K, Belušič G, Kelber A.. 2021. Evolution of insect color vision: from spectral sensitivity to visual ecology. Annu. Rev. Entomol. 66, 435-461. ( 10.1146/annurev-ento-061720-071644) [DOI] [PubMed] [Google Scholar]
- 83.Chang BSW, Crandall KA, Carulli JP, Hartl DL. 1995. Opsin phylogeny and evolution: a model for blue shifts in wavelength regulation. Mol. Phylogenet. Evol. 4, 31-43. ( 10.1006/mpev.1995.1004) [DOI] [PubMed] [Google Scholar]
- 84.Sekharan S, Katayama K, Kandori H, Morokuma K. 2012. Color vision: ‘OH-site’ rule for seeing red and green. J. Am. Chem. Soc. 134, 10 706-10 712. ( 10.1021/ja304820p) [DOI] [PMC free article] [PubMed] [Google Scholar]
- 85.Honig B, Greenberg AD, Dinur U, Ebrey TG. 1976. Visual-pigment spectra: implications of the protonation of the retinal Schiff base. Biochemistry 15, 4593-4599. ( 10.1021/bi00666a008) [DOI] [PubMed] [Google Scholar]
- 86.Davies WL, Collin SP, Hunt DM. 2009. Adaptive gene loss reflects differences in the visual ecology of basal vertebrates. Mol. Biol. Evol. 26, 1803-1809. ( 10.1093/molbev/msp089) [DOI] [PubMed] [Google Scholar]
- 87.Hiramatsu C, Radlwimmer FB, Yokoyama S, Kawamura S. 2004. Mutagenesis and reconstitution of middle-to-long-wave-sensitive visual pigments of New World monkeys for testing the tuning effect of residues at sites 229 and 233. Vision Res. 44, 2225-2231. ( 10.1016/j.visres.2004.04.008) [DOI] [PubMed] [Google Scholar]
- 88.Cronin TW, Bok MJ, Justin Marshall N, Caldwell RL. 2014. Filtering and polychromatic vision in mantis shrimps: themes in visible and ultraviolet vision. Phil. Trans. R. Soc. B 369, 20130032. ( 10.1098/rstb.2013.0032) [DOI] [PMC free article] [PubMed] [Google Scholar]
- 89.Murphy MJ, Westerman EL. 2022. Evolutionary history limits species' ability to match colour sensitivity to available habitat light. FigShare. ( 10.6084/m9.figshare.c.5967131) [DOI] [PMC free article] [PubMed]
- 90.Murphy MJ, Westerman EL. 2022. Data from: evolutionary history limits species' ability to match colour sensitivity to available habitat light. Dryad Digital Repository. ( 10.5061/dryad.47d7wm3fc) [DOI] [PMC free article] [PubMed]
Associated Data
This section collects any data citations, data availability statements, or supplementary materials included in this article.
Data Citations
- Murphy MJ, Westerman EL. 2022. Evolutionary history limits species' ability to match colour sensitivity to available habitat light. FigShare. ( 10.6084/m9.figshare.c.5967131) [DOI] [PMC free article] [PubMed]
- Murphy MJ, Westerman EL. 2022. Data from: evolutionary history limits species' ability to match colour sensitivity to available habitat light. Dryad Digital Repository. ( 10.5061/dryad.47d7wm3fc) [DOI] [PMC free article] [PubMed]
Data Availability Statement
Data pertaining to this study are available in the electronic supplementary material [89] or from Dryad Digital Repository [90]. Code pertaining to this study is available at GitHub repository: https://github.com/mjosmurphy/opsin-evolutionary-ecology.