

Abstract
Cannabis demand (i.e., reinforcing value) can be assessed using a marijuana purchase task (MPT; assesses hypothetical purchasing of cannabis at escalating prices) and has been related to use frequency, problems, and cannabis use disorder symptoms in adults. Cannabis demand has yet to be studied in adolescents, which can inform prevention and intervention efforts to reduce cannabis-related risks. The present study sought to validate the MPT with a sample of late adolescent lifetime cannabis users. Participants aged 15–18 years old (n = 115, Mage = 16.9, SD = 0.9) residing in a state with legalized cannabis use completed online assessments at baseline and 6-month follow-up. Convergent and divergent validity was examined, while principal component analysis was conducted to determine the factor structure and assess predictive validity. Three indices, Omax (i.e., maximum expenditure on cannabis), breakpoint (i.e., price suppressing consumption to zero), and alpha (i.e., degree to which consumption decreases with increasing price) were all significantly associated with cannabis use, consequences, craving, and expenditures and significantly differentiated low-risk users and high-risk users as measured by the Cannabis Use Disorders Identification Test-Revised (CUDIT-R). A two-factor solution reflecting amplitude (intensity, alpha, Omax) and persistence (breakpoint, Pmax) was observed. Both factors were associated with cannabis use and consequences in baseline regression models. At follow-up, persistence was associated with consequences; amplitude was not associated with either outcome. These findings provide initial evidence that the MPT is a valid measure for assessing cannabis demand among adolescents and can be used to understand mechanisms of adolescent cannabis use.
Keywords: reinforcing value (RV), behavioral economics, purchase task, cannabis, adolescents
Behavioral economics is a framework that combines operant psychology and economics to understand the etiology of health-related behaviors, particularly problematic substance use (Bickel & Vuchinich, 2000). Within this framework, substance demand is a key construct that provides information about the relative reinforcing value (RV) of a substance by examining the relation between the exchange of one commodity for another (e.g., money for cannabis). Thus, RV is a quantitative measure of the strength of motivation to obtain the specified commodity (Johnson & Bickel, 2006). Persistent elevated RV partially makes up what has been conceptualized as reinforcer pathology, which in turn has been theoretically posited to underlie substance misuse and use disorders (e.g., Bickel et al., 2011).
Substance demand is commonly assessed via hypothetical purchase tasks in which participants indicate the amount of a substance they would purchase and consume at escalating price points, starting with zero cost (Aston & Cassidy, 2019; Zvorsky et al., 2019). Five distinct demand indices can be obtained from purchase task performance (definitions of indices appear in parentheses): intensity (i.e., consumption of substance at zero cost), breakpoint (i.e., the price at which consumption is suppressed to zero), alpha1 (i.e., rate of change in elasticity, or the degree to which consumption decreases with increasing price; Gilroy et al., 2020), Omax (i.e., peak overall expenditure), and Pmax (i.e., price per substance unit corresponding to peak expenditure). Moreover, demand curves can be derived from purchase data reflecting the relation between the proportional changes in purchasing behavior as a function of the proportional changes in substance price (Bickel et al., 2014). In addition to providing quantitative measures of motivation, there are several benefits to utilizing purchase tasks. First, they utilize self-report, which makes them cost-effective and easy to administer in different contexts (e.g., clinical settings, online). Second, they are hypothetical, which makes it possible to study populations in which drug administration would not be ethical (e.g., adolescents, treatment-seeking individuals).
In recent years, the behavioral economic framework has been extended to cannabis use using the marijuana purchase task (MPT; see Aston & Meshesha, 2020 for review). In a seminal study on cannabis demand, similar to findings from research on other substances, demand for cannabis was sensitive to price—as prices increased, consumption decreased (Collins et al., 2014). Intensity, alpha, Omax, and Pmax were predictive of real-time cannabis use. Similarly, Aston et al. (2015) found that intensity and Omax were positively correlated with percent of cannabis use days and subjective craving, and alpha was negatively correlated with subjective craving (i.e., less price sensitivity associated with greater craving). Further, the MPT differentiated users with and without DSM-IV CUD symptoms. In laboratory studies, exposure to cannabis in the form of cues or drug administration affected subsequent demand (Hindocha et al., 2017; Metrik et al., 2016). For example, Metrik et al. (2016) found that relative to neutral cue exposure, exposure to cannabis cues increased intensity and Omax, decreased alpha (i.e., sustained consumption despite price increases), and increased subjective craving.
Similar to other substance use demand studies, demand indices captured by the MPT are typically correlated with one another (Aston et al., 2015). While these indices are conceptually related, they represent unique characteristics of demand that are differentially related to the etiology of substance use disorders. Factor analytic studies of alcohol (MacKillop et al., 2009; Skidmore et al., 2014) and tobacco purchase task data (Bidwell et al., 2012; O’Connor et al., 2016) suggest that these indices reflect two latent factors of demand. One factor, “amplitude,” refers to the maximum level of ad libitum consumption and is typically associated with quantity and frequency of use (MacKillop et al., 2009; Skidmore et al., 2014). “Persistence” references the maintenance of consumption despite increasing costs and is typically associated with substance-related problems (Skidmore et al., 2014). Consistent with findings from alcohol and tobacco studies, indices derived from the MPT load onto two factors generally reflecting amplitude and persistence. While one study found that intensity alone loaded on to the amplitude latent factor (Aston et al., 2017), another found that amplitude comprises intensity, Omax, and alpha (i.e., elasticity; Minhas et al., 2021). Despite differences in factor structure loadings, persistence and amplitude were uniquely related to different cannabis-related outcomes among adults (Aston et al., 2017; Minhas et al., 2021). Thus, utilizing a latent factor structure provides a more parsimonious framework by which to understand the relations between demand and substance use outcomes. Further, by reducing the number of demand variables from five individual indices to two latent factors reduces risks of multi-collinearity and type I errors in statistical tests (Amlung et al., 2015; Aston et al., 2016; Bidwell et al., 2012).
Findings from previous studies provide evidence for the validity of the MPT among adult cannabis users. However, a notable gap in the behavioral economic literature is the assessment of cannabis demand during adolescence, a critical period of development marked by elevated risk associated with cannabis use. According to the most recent data from the Monitoring the Future study, cannabis is the most commonly used psychoactive drug among adolescents, with 44% of 12th-grade students reporting cannabis use in their lifetime (Johnston et al., 2021). Further, daily cannabis use has steadily increased, comparable to peak rates observed during the 1990s. Recreational cannabis use often first occurs prior to the age of 18, with earlier use associated with poorer cognitive (Jacobus et al., 2009) and psychosocial outcomes (Beverly et al., 2019; Hasin, 2018). Relative to adults, adolescents are at greater risk for cannabis use disorder (CUD), with greater risk associated with earlier onset of use (Richter et al., 2017). Despite these consequences, adolescent attitudes toward cannabis have become more permissive with the rise of cannabis legalization across many states, and in turn, adolescents are less likely to perceive cannabis use as risky (D’Amico et al., 2017). Given the high prevalence of cannabis use and the associated negative consequences, it is important to understand and characterize the RV of cannabis among adolescents, which can in turn inform individual and systemic prevention and intervention efforts.
There are important developmental considerations suggesting that demand for cannabis may be uniquely expressed in youth and that psychometric evaluation of the MPT among this age group is needed. First, purchase tasks rely on participants being able to consider a hypothetical scenario that involves purchasing and consuming a substance in various quantities. Given that adolescents are unable to purchase cannabis for recreational use from legal markets (Hall & Lynskey, 2020) and often obtain cannabis for free from friends (Wagner et al., 2021), they may have less knowledge regarding reasonable prices per unit of cannabis. Second, adolescents are not typically financially independent and may have limited or irregular financial support to purchase cannabis, resulting in increased sensitivity to costs. While there is a dearth of evidence pertaining to cannabis spending, previous findings suggest that adolescents who engage in cigarette smoking (Friend et al., 2011) and moderate to heavy alcohol consumption (Xu & Chaloupka, 2011) are sensitive to increases in cost, particularly when compared to adults (Ding, 2003).
In sum, cannabis use and purchase behavior is complex among adolescents as this is a heterogeneous population with broad ranges in ease of access, finances, and behavior. Given these complexities, it is important to utilize psychometrically valid measures to assess the RV of cannabis among adolescents. Exploring whether individual differences in price sensitivity are meaningfully related to cannabis use outcomes among adolescents is important for policy and prevention given the expanding legal market and availability of cannabis products.
Purpose of Present Study
The purpose of the present study was to evaluate the validity of the MPT with a sample of adolescents reporting recent cannabis use and current demand (i.e., willingness to pay) for cannabis. Consistent with previous MPT research, we predicted that self-reported cannabis consumption would decrease as the cost of cannabis increased. We also predicted that the MPT would show convergent, divergent, and predictive validity. To establish convergent validity, we expected that MPT indices would be significantly correlated with cross-sectional cannabis use outcomes, including use, consequences, craving, and recent expenditures on cannabis. To establish divergent validity, we expected that demand indices would differentiate low- and high-risk users as determined by the Cannabis Use Disorders Identification Test-Revised (CUDIT-R). Finally, we sought to examine the latent factor structure of the MPT. Consistent with previous studies examining the MPT among adult samples, we expected that MPT indices would load onto two factors, one reflecting demand amplitude and another reflecting demand persistence. To establish predictive validity, we expected that these factors would be uniquely associated with cannabis use and consequences at baseline and 6-month follow-up.
Method
Participants and Procedure
We report how we determined our sample size, all data exclusions, all manipulations (not applicable), and all measures in the study. These data are part of a larger longitudinal study (N = 168) examining associations between self-identification as a cannabis user and cannabis use outcomes (Ramirez, 2020). To be eligible for the study, participants needed to be between the ages of 15–18 and live in the greater metropolitan area of a Northwestern state with legalized recreational cannabis use. Data collection for the study occurred between 2019 and 2020. For context, residents voted to legalize cannabis for nonmedical use for individuals ages 21+ in 2012 and the first retail cannabis outlets opened in 2014. Recruitment was stratified by cannabis use history and recent frequency to include sufficient representation of late adolescents that (a) never used cannabis in their lifetime, (b) used 1–3 days in the past 3 months, (c) used 4–11 days in the past 3 months, and (d) used 12+ days in the past 3 months. Recruitment was further stratified by birth sex to include roughly equal numbers of males and females within strata of cannabis use groups. Recruitment for the parent study took place predominantly via social media (e.g., Instagram ads) that directed interested individuals to a screening survey. Those who completed screening and were eligible for the study were contacted by phone to verify their identity and complete consent procedures. Participants were then sent an online baseline survey in addition to 3-month (n = 145, 86.3%) and 6-month (n = 139, 82.7%) follow-up surveys. Each survey took between 30 and 45 min to complete, and participants were compensated in the form of Amazon.com gift cards in amounts of $25 for baseline, $30 for 3-month, $35 for 6-month, and a $10 bonus if all three surveys were completed. Data from this study are from the baseline assessment and 6-month assessment in the parent study. The present study was not preregistered. All study procedures and measures were approved by the university’s Institutional Review Board, and a federal Certificate of Confidentiality was obtained. All participants provided informed consent online before beginning the study.
Measures
Attention Check
Three attention check questions (e.g., please select the country “Canada” from the following list of five countries) were included in each survey to check for reliable responses. All participants correctly answered at least two of the three questions at baseline (97.6% answered all three correctly) and 6-month assessment (99.3% answered all three correctly) and were retained for analyses.
Cannabis Demand
The MPT was administered to assess behavioral economic demand for cannabis (Aston et al., 2021). Participants were provided with the following instructions to complete the MPT, which included a reference image to indicate scale for a half gram and full gram of cannabis: On the following page you will see a number of questions that ask how much marijuana you would use at different levels of price. Please respond to these questions as if you were actually in this situation. At each price, choose how many GRAMS you would use. In case it is helpful, 1/8th of an ounce is 3.5 GRAMS. At each price, choose the amount you would use over A TYPICAL WEEK (7 DAYS). Assume that: You can only get marijuana from this source. You can’t go to a different source for cheaper marijuana, and you cannot use any marijuana you may have saved. You have the typical amount of money available to you to purchase marijuana. You did NOT use marijuana or use any other drugs right before making these decisions. You will NOT have an opportunity to use marijuana elsewhere after making these decisions. You would use all the marijuana that you purchase. You can’t save the marijuana for a later date. The marijuana you will purchase will be similar to the quality and strength of what you typically use. You can only buy a maximum of 99 grams. Whether you are with people or alone, assume this amount of marijuana is only for your personal use. Remember, this is for a typical week, you can only get marijuana from this source, it is similar to your typical quality and strength, and you will use all of marijuana you purchase (you can’t save extra marijuana and this amount is only for your personal use). Given the previous conditions, how many GRAMS of marijuana would you use during a TYPICAL WEEK at the following prices? Participants were then asked to indicate how many grams of marijuana they would use at the following prices per gram: free, $1, $2, $4, $6, $8, $10, $12, $14, $16, $18, $20, $25, $30, $35, $40, $45, $50, $55, and $60.
Cannabis Use Outcomes
Cannabis use frequency was measured with a single item assessing the number of self-reported cannabis use days in the past 3 months. In addition, participants estimated number of typical hours high on each day of the week in the past 3 months with the Marijuana Daily Questionnaire (Lee et al., 2013). Typical hours high were summed across days to calculate hours high in a typical week in the past 3 months. Cannabis consequences were assessed with the marijuana consequences checklist (Lee et al., 2021), a 26-item measure assessing the presence and frequency of cannabis-related consequences (e.g., “had trouble remembering things,” “felt paranoid,” “had your driving affected after using marijuana”) over the past 3 months with strong internal consistency in the present study (Cronbach’s α = 0.93). Cannabis craving was assessed with the 12-item short-form version of the Marijuana Craving Questionnaire (Heishman et al., 2009) which also had strong internal consistency (Cronbach’s α = 0.88). Cannabis expenditures were assessed with a single item asking, “In the past 30 days how much money did you spend on marijuana?” Potentially problematic or harmful cannabis use was measured with the eight-item (CUDIT-R; Adamson et al., 2010; Cronbach’s α in present study = 0.78). In the initial validation study, scores of 13 or higher were indicative of a CUD using DSM-IV criteria (Adamson & Sellman, 2003); however, recent studies suggest that lower cutoff scores (6, 9, 10) on the CUDIT-R may be more appropriate when validated against DSM-5 criteria (Bonn-Miller et al., 2016), particularly for younger samples (Schultz et al., 2019; Trangenstein et al., 2021). Thus, consistent with previous literature (Bonn-Miller et al., 2016; Trangenstein et al., 2021), we used a cut score of 9 as a conservative estimate of low- and high-risk use in the sample.
Data Preparation and Analytic Plan
Given that our current aim was to validate the MPT among adolescents for which cannabis has RV, we first excluded 28 participants from the greater study who reported no use of cannabis in their lifetime. We sought to calculate alpha among the sample which requires variable hypothetical consumption (i.e., consumption beyond free cost). We therefore excluded an additional 17 participants based on this criterion, which is consistent with prior studies utilizing similar purchase tasks (e.g., Vedelago et al., 2022). Further, only four of these 17 participants reported any consumption (0.3, 1.0, 1.0, and 2.0 grams) at free cost suggesting that these 17 excluded participants had no or minimal interest in cannabis use (i.e., negligible RV). Demand data cleaning with the remaining 123 participants was completed consistent with standard practice, which consists of using three criteria to identify nonsystematic data: trend (i.e., overall reduction in responding), bounce (i.e., frequent price-to-price increases in consumption), and reversals from zero (i.e., positive value after a reported zero; Stein et al., 2015). Based on these criteria, seven additional participants were removed for exhibiting bounce responding or reversals from zero, and one participant was removed due to missing data, leaving a final analytic sample of 115 participants.
Prior to calculation of demand indices, raw MPT data were examined for outliers using standard scores (i.e., Z = 3.29 or greater; Tabachnick & Fidell, 2019). A small number of outliers were detected (2.6% of all datapoints) and recoded as one unit higher than the largest nonoutlying value. Observed values for intensity, Omax, Pmax, and breakpoint were estimated by directly examining MPT performance. Alpha (i.e., rate of change in elasticity of demand) was empirically derived by fitting individual curves in GraphPad Prism using an exponentiated demand equation (Koffarnus et al., 2015):
| (1) |
where Q = quantity consumed, Q0 = derived intensity, k = a constant across individuals that denotes the range of the dependent variable (i.e., cannabis grams), C = the cost of the commodity, and α = alpha or the rate constant determining the rate of decline in consumption based on increases in price (i.e., essential value). The appropriate k value was determined by subtracting the log10-transformed average consumption at the highest price ($60) from the log10-transformed average consumption at the lowest price used in curve fitting ($1). The k value used in analyses was 2.652. An R2 value was generated to reflect percentage of variance accounted for by the demand equation (i.e., the adequacy of the fit of the model to the data).
Upon generation of demand indices, data were examined for distribution normality. Omax, Pmax, and alpha were significantly positively skewed and transformed using a logarithmic transformation which considerably decreased skewness. Skewness for intensity and breakpoint were negligible and nontransformed indices were used in analyses.
Convergent validity was examined with correlational analyses between demand indices and cannabis outcomes (i.e., cannabis use, consequences, craving, and recent cannabis expenditures). Divergent validity was examined with t tests of group differences between high-risk (CUDIT-R scores of 9 or greater) and low-risk users (CUDIT-R scores of 8 or less) on demand indices. The factor structure of cannabis demand was examined with principal component analysis followed by Oblimin rotation. Following extraction, a two-factor solution was confirmed by parallel analysis (Zwick & Velicer, 1986). The entered variables included all five demand indices but with an inverse value for alpha (i.e., 1/α) to improve the ease of interpretation such that greater values indicated greater demand. A factor loading of 0.40 (absolute value) on the pattern matrix was set as the threshold for significant loadings onto a factor. Factor scores were derived by regression methods and reflect standardized regression coefficients. Resulting factors were then included in negative binomial regression models that controlled for age and sex to examine unique associations between factors and measures of cannabis use frequency and consequences at baseline and 6-month follow-up. Models predicting 6-month outcomes also included baseline levels of their respective outcomes (i.e., either cannabis use or consequences) as covariates. For additional data and study materials, please contact the last author.
Results
Descriptive Statistics
The final analytic sample (n = 115) had a mean age of 16.9 (SD = 0.9) and included 52% females, 64% high school students and 21% 4-year college students. Of these participants, 88% identified as White/Caucasian, 17.4% as Asian/Asian American, 4.3% as Black or African American, 2.6% as American Indian or Alaska Native, 1.7% as Native Hawaiian or Pacific Islander, 3.5% identified with another race, and 15.7% identified their ethnicity as Hispanic or Latinx.
Participants in the analytic sample reported using cannabis on an average of 28.8 days (SD = 30.8) in the past 3 months, being high for an average of 1.88 hr (SD = 2.10, range = 0–12) on a typical day in the past 3 months, and spending $32.86 (SD = $60.40, range = $0–$400) on cannabis in the past 30 days. Regarding usual mode of cannabis administration in the past 30 days, 46.1% of participants reported smoking cannabis in a joint, bong, pipe, or blunt, 20.9% reported vaporizing cannabis (e.g., via vape pen), 12.2% reported consuming cannabis in edible form (e.g., edibles), 1.7% reported using some other way, and 19.1% reported not using cannabis in that timeframe.
With regard to observed indices of cannabis demand, the mean number of grams consumed at free cost (intensity) was 27.15 (SEM = 3.50), the mean maximum overall expenditure on cannabis (Omax) was $37.81 (SEM = 5.00), the mean price per gram at which inelastic consumption shifts to elastic consumption (Pmax) was $8.83 (SEM = 0.77), and the mean price per gram at which participants would stop purchasing cannabis (breakpoint) was $16.34 (SEM = 1.17; see Table 1 for additional details). Figure 1 shows the log-transformed mean consumption in grams (left) and log-transformed mean expenditure in dollars (right) at each price point. As expected, as the cost of cannabis increased, hypothetical purchasing decreased.
Table 1.
Descriptive Statistics for Cannabis Demand Indices (N = 115)
| Metric | M | SEM | Range |
|---|---|---|---|
| Intensity | 27.15 | 3.50 | 0.20–99.00 |
| O max | 37.81 | 5.00 | 0.40–247.60 |
| P max | 8.83 | 0.77 | 1.00–60.00 |
| Breakpoint | 16.34 | 1.17 | 2.00–60.00 |
| α | .013 | .003 | 0.0003–0.2582 |
Note. SEM = standard error of the mean. All descriptive statistics are presented for nontransformed demand indices.
Figure 1.
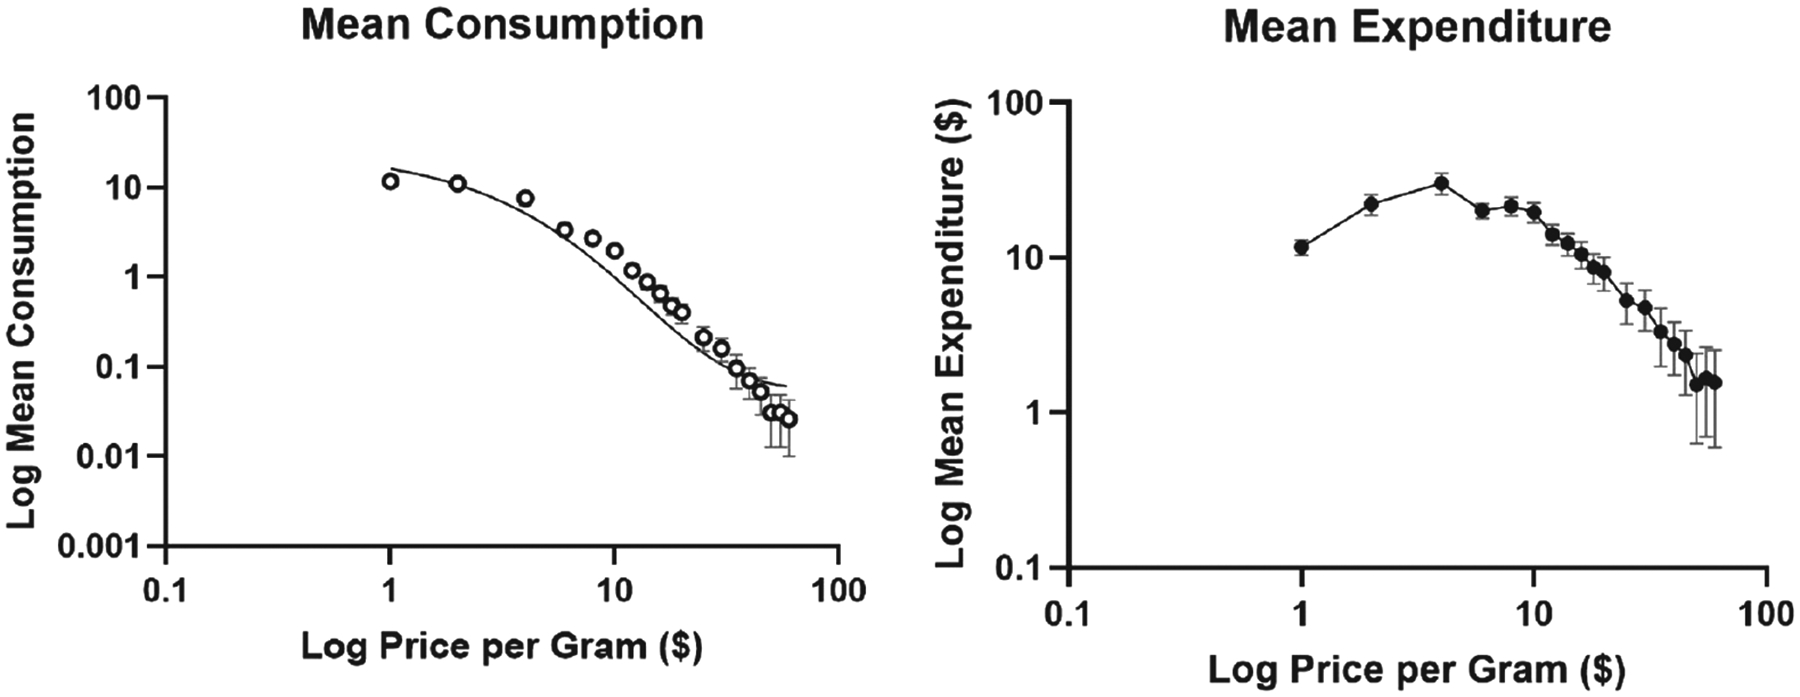
Mean Consumption and Expenditure Curves for Analytic Sample
Note. The x-axis represents log-transformed price per gram in both plots, and the y-axis represents log-transformed mean consumption in grams (left) and mean expenditure in dollars (right). Error bars represent standard error of the means (SEMs).
Convergent Validity
Table 2 shows correlations between demand indices and cannabis-related outcomes. Three demand indices were significantly correlated with all cannabis use outcomes in the hypothesized directions; Omax and breakpoint were positively correlated with cannabis use, consequences, craving, and cannabis expenditures (ps < .05), and alpha was significantly negatively correlated with cannabis use, consequences, craving, and cannabis expenditures (ps < .05). Intensity was significantly positively correlated with craving and cannabis expenditures (ps < .05), but not with cannabis use or consequences. Pmax was not associated with any cannabis outcome variables.
Table 2.
Correlations Between Demand Indices and Cannabis Use Outcomes
| Correlations | ||||||||||
|---|---|---|---|---|---|---|---|---|---|---|
| Variable | 1 | 2 | 3 | 4 | 5 | 6 | 7 | 8 | 9 | 10 |
| 1. Intensity | — | |||||||||
| 2. Omax | 0.54*** | |||||||||
| 3. Pmax | −0.14 | 0.35*** | — | |||||||
| 4. Breakpoint | 0.11 | 0.48*** | 0.62*** | — | ||||||
| 5. α | −0.55*** | −0.98*** | −0.32*** | −0.49*** | — | |||||
| 6. Use (days) | 0.07 | 0.32*** | 0.18 | 0.26** | −0.35*** | — | ||||
| 7. Use (hours) | 0.11 | 0.30** | 0.12 | 0.20* | −0.35*** | 0.70*** | — | |||
| 8. Conseq. | 0.11 | 0.29** | 0.17 | 0.22* | −0.33*** | 0.61*** | 0.55*** | — | ||
| 9. Craving | 0.27** | 0.33*** | 0.13 | 0.34*** | −0.38*** | 0.29** | 0.31** | 0.41*** | — | |
| 10. Spending | 0.24* | 0.39*** | 0.11 | 0.27** | −0.41*** | 0.42*** | 0.40*** | 0.44*** | 0.33*** | — |
Note. Use (days) represents the number of cannabis use days in the past three months; Use (hours) represents the number of hours high in a typical week in the past 3 months; Conseq. represent sum scores on marijuana consequences checklist; Craving represents mean scores on Marijuana Craving Questionnaire; Spending represents money spent on cannabis in the past 30 days.
p < .05.
p < .01.
p < .001.
Divergent Validity
To establish divergent validity, we compared low-risk users (n = 48) to high-risk users (n = 67) across all outcome measures, including demand indices (see Table 3). First, there were no group differences between low- and high-risk users with regard to age and birth sex. Compared to low-risk users, high-risk users engaged in more frequent cannabis use, endorsed more consequences, endorsed greater craving, and spent more money on cannabis in the past 30 days. Further, high-risk users also scored significantly higher on Omax and breakpoint, and significantly lower on alpha. No significant differences were observed for Pmax or intensity. Figure 2 shows the log-transformed mean consumption in grams (left) and log-transformed mean expenditure in dollars (right) separately for low-risk (n = 48) and high-risk using (n = 67) subsamples.
Table 3.
Cannabis Demand as a Function of CUD Risk
| Metric | Low-risk users (n = 48) M (SEM) | High-risk users (n = 67) M (SEM) | t | p |
|---|---|---|---|---|
| Use (days) | 9.88 (2.48) | 42.27 (3.83) | 7.10 | <.001 |
| Use (hours) | 6.40 (1.21) | 18.06 (1.99) | 5.01 | <.001 |
| Consequences | 12.56 (1.32) | 28.57 (2.06) | 6.54 | <.001 |
| Craving | 38.31 (1.85) | 45.15 (1.76) | 2.62 | 0.005 |
| Spending | $7.89 (2.22) | $50.64 (9.00) | 4.61 | <.001 |
| Intensity | 22.87 (5.24) | 30.21 (4.68) | 1.04 | 0.151 |
| O max | $29.98 (7.16) | $43.43 (6.84) | 2.34 | 0.010 |
| P max | $7.65 (0.79) | $9.69 (1.18) | 1.58 | 0.058 |
| Breakpoint | $13.77 (1.48) | $18.18 (1.68) | 1.87 | 0.032 |
| α | 0.019 (0.006) | 0.008 (0.001) | 2.54 | 0.006 |
Note. CUD = cannabis use disorder; SEM = standard error of the mean; Use (days) represents the number of cannabis use days in the past three months; Use (hours) represents the number of hours high in a typical week in the past 3 months; Consequences represent sum scores on marijuana consequences checklist; Craving represents mean scores on Marijuana Craving Questionnaire; Spending represents money spent on cannabis in the past 30 days. Low-risk users had cumulative CUDIT scores of 8 or less, high-risk users had CUDIT scores of 9 or more. Means and SEMs of nontransformed demand indices shown here for interpretability; t tests performed on transformed variables for Omax, Pmax, and alpha.
Figure 2.
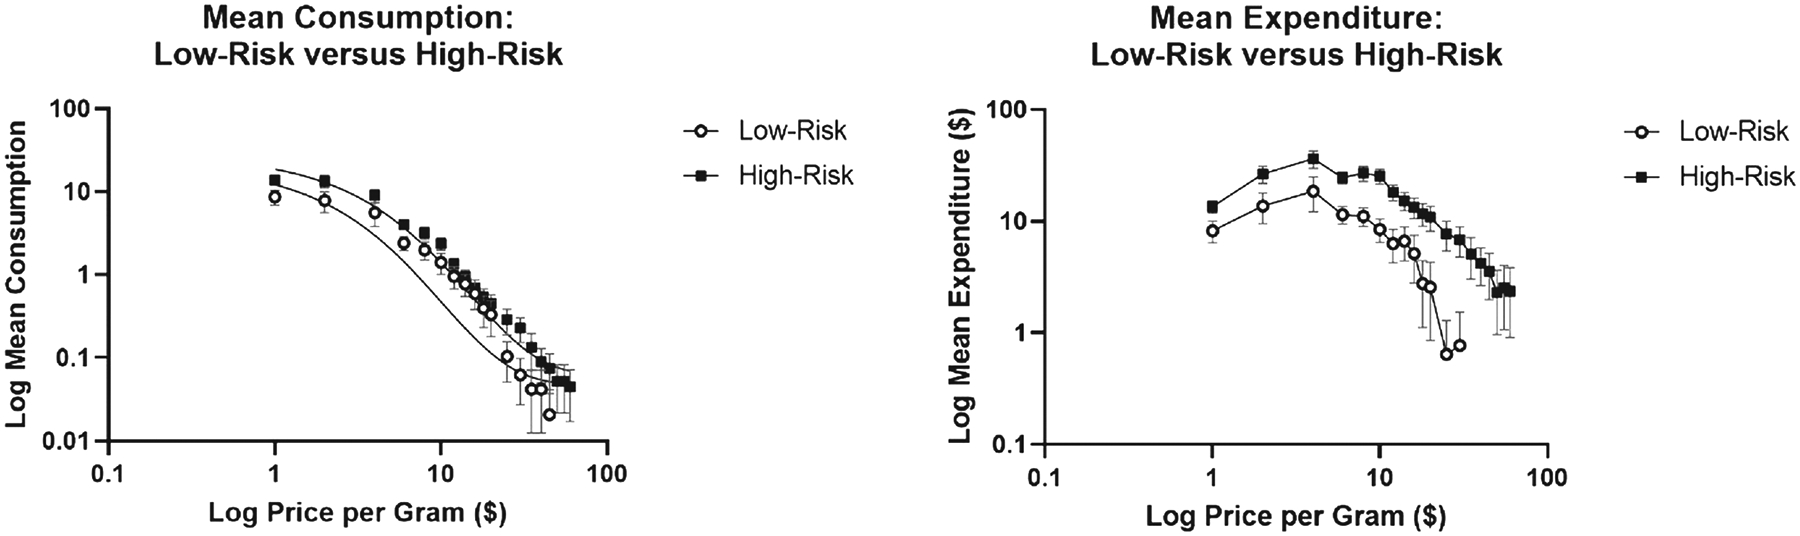
Mean Consumption and Expenditure Curves for Low-Risk (n = 48) Versus High-Risk (n = 67) Subsamples
Note. The x-axis represents log-transformed price per gram, and the y-axis represents log-transformed mean consumption in grams. Error bars represent standard error of the means (SEMs).
Principal Components Analysis
Examination of scree plot, eigenvalues >1.0, and proportion of total variance accounted for revealed a two-factor solution as the best solution which was confirmed by the parallel analysis with 5,000 random sample data sets. Eigenvalues in descending order were 2.70, 1.34, 0.54, 0.31, and 0.12. The two-factor solution accounted for 80.68% of the total variance. The two factors were weakly, albeit significantly negatively correlated (r = −0.21, p = .027). Table 4 presents the factor loadings of all five MPT demand indices on each of the rotated factors. Intensity, Omax, and alpha loaded onto the first factor referred to as “amplitude” which accounted for 53.97% of variance. Pmax and breakpoint loaded onto the second factor referred to as “persistence” which accounted for 26.72% of variance.
Table 4.
Principal Component Analysis Factor Loadings
| Metric | Factor 1 | Factor 2 |
|---|---|---|
| Intensity | 0.893* | 0.338 |
| O max | 0.826* | −0.328 |
| P max | −0.094 | −0.932* |
| Breakpoint | 0.150 | −0.801* |
| α | 0.740* | −0.363 |
| Eigenvalues | 2.70 | 1.34 |
| % Variance | 53.97% | 26.72% |
Note. The entered variables were intensity, Omax, Pmax, breakpoint, and 1/α. Omax, Pmax, and α were log10 transformed to meet normality assumptions.
denotes absolute value >0.40 used as threshold for significant loading onto factor.
To assess predictive validity, amplitude and persistence were both included in negative binomial regression models predicting baseline and 6-month (a) cannabis use frequency and (b) cannabis-related consequences while controlling for age and sex, as well as baseline use or consequences for those respective outcomes in 6-month analyses (See Table 5). Both factors were uniquely, significantly associated with baseline cannabis use frequency (ps < .01) and consequences (ps < .01). Somewhat inconsistent with hypotheses, at 6-months, only persistence was associated with consequences (p < .05) after controlling for baseline levels of consequences. Neither amplitude nor persistence was associated with cannabis use at 6 months after controlling for baseline levels of use (ps > .05).
Table 5.
Negative Binomial Regression Models Predicting Concurrent and Prospective Cannabis Use and Consequences
| BL cannabis use (n = 115) | BL cannabis consequences (n = 115) | |||
|---|---|---|---|---|
| Variable | B | SE | B | SE |
| Age | −0.01 | 0.12 | −0.08 | 0.07 |
| Sex | 0.28 | 0.21 | 0.06 | 0.14 |
| BL amplitude | 0.38** | 0.12 | 0.24** | 0.08 |
| BL persistence | −0.35** | 0.11 | −0.17** | 0.05 |
| M6 cannabis use (n = 92) | M6 cannabis consequences (n = 92) | |||
| Variable | B | SE | B | SE |
| Age | −0.06 | 0.13 | 0.04 | 0.08 |
| Sex | 0.18 | 0.25 | 0.26 | 0.15 |
| BL amplitude | −0.04 | 0.13 | 0.00 | 0.07 |
| BL persistence | −0.10 | 0.10 | −0.16* | 0.06 |
| BL use | 0.03*** | 0.00 | — | — |
| BL consequences | — | — | 0.03*** | 0.01 |
Note. BL = baseline assessment. M6 = Month 6 assessment. Cannabis use represents the number of cannabis use days in the past 3 months. Cannabis consequences represent sum scores on the marijuana consequences checklist. SE = standard error of the mean. Sex was coded as male = 0, female = 1. Amplitude consisted of intensity, Omax, and α. Persistence consisted of Pmax and breakpoint. Models predicting Month 6 outcomes controlled for baseline levels of the respective outcome for each model.
p < .05.
p < .01.
p < .001.
Discussion
The present study provides initial evidence of the validity of the MPT among a sample of late adolescent cannabis users from a state with legalized recreational use. Consistent with purchase task data from adult samples across different substances (Aston et al., 2015; Collins et al., 2014; MacKillop et al., 2008; Murphy & MacKillop, 2006), adolescents showed price sensitivity on the MPT—as the cost of cannabis increased, hypothetical purchasing decreased. Convergent validity was established via correlations in the expected directions among demand indices and cannabis-related outcomes, with the exception of intensity (significantly associated with craving and spending only) and Pmax (no significant associations observed). Moreover, divergent validity was established as demand indices, with the exception of intensity and Pmax, differentiated low- and high-risk users as measured by the CUDIT-R. Finally, principal component analysis suggested that demand indices loaded onto two unique factors, each independently associated with cannabis use and consequences at baseline.
Notably, the mean intensity score in the current sample (M = 27.15 grams) was higher than those observed in adult samples (mean range 7–14), while the mean scores for the remaining observed indices (i.e., Omax, Pmax, breakpoint) were lower (Aston et al., 2021; McIntyre-Wood et al., 2021; Patel & Amlung, 2019). These findings at face value suggest that relative to adults, adolescents would use more cannabis at free cost, but are more sensitive to changes in price (i.e., sharper declines in purchasing as a function of increasing costs). Previous research has suggested that intensity is a particularly important metric among young adults (Zvorsky et al., 2019), as it reflects ones’ ability to modulate behavior in the absence of other environmental contingencies (e.g., cost; Murphy & Dennhardt, 2016). Given that studies have shown that the most common pathway for high school seniors to obtain cannabis is free from friends (Wagner et al., 2021), adolescents may use cannabis more frequently and in greater quantities when first initiating use as they tend to use at zero cost. This has important implications for understanding the etiology of problematic cannabis use among this age group and may help explain why adolescents are at increased risk for developing CUD compared to adults (Richter et al., 2017), as heavier cannabis use is an important predictor of cannabis-related problems, including dependence (Walden & Earleywine, 2008). In addition to the etiological implications, relatively low demand on metrics involving expenditures have prevention implications. Specifically, these findings may reflect the impact of greater constraints on discretionary spending availability (i.e., due to limited income from all sources) among adolescents, highlighting the importance of restricting access, particularly free access, to cannabis for this age group.
Despite high mean intensity observed in the current sample, intensity was not associated with cannabis use or cannabis-related consequences, nor did it differentiate low- and high-risk users, which contrasts previous findings among comparatively older populations (Aston et al., 2015). It is possible that adolescents have less experience purchasing cannabis relative to adult counterparts and therefore may have less knowledge regarding units of cannabis consumption, resulting in inflated intensity scores. If so, this may attenuate the predictive validity of intensity among adolescents more so than indices that reflect price sensitivity. That is to say, adolescents may have a better understanding of their financial limitations and thresholds on purchasing cannabis (e.g., breakpoint), but may be less informed regarding how much cannabis one could realistically use in a week if it were freely available. It is also possible that these findings reflect adolescents’ developmental stage which is marked by greater impulsivity and sensation-seeking behavior (i.e., greater consumption at free cost just because it is free; Donohew et al., 1999; Kopstein et al., 2001). While caution is warranted in making direct comparisons between adolescents and adults based on the present study, as well as between studies using different demand equations, these findings highlight the need for future research to explore mechanisms that may explain differences in intensity, as well as the remaining demand indices, among adolescent and adult cannabis users.
Previous studies examining the latent factor structure of alcohol (MacKillop et al., 2009), tobacco cigarettes (Bidwell et al., 2012), and cannabis (Aston et al., 2017) purchase tasks have found that intensity typically loads on a factor (sometimes with Omax) labeled amplitude, while the remaining four indices all load onto a second factor labeled persistence. This contrasts findings from the present study, which found that indices of intensity, Omax, and alpha loaded onto a single factor, while only Pmax and breakpoint loaded onto a second factor. While this factor structure is atypical, it has been replicated twice in a recent study examining cannabis demand among emerging adults (age ranges 18.5–24.9 across two samples; Minhas et al., 2021). As noted by Minhas et al. (2021), these unique findings may be attributable to several factors, including the use of an exponentiated curve equation (Koffarnus et al., 2015), sample characteristics (individuals identified as risky users vs. those with identified cannabis use disorder), as well as the use of the constant, k, to calculate alpha (Gilroy et al., 2021). Given that this study included a range of infrequent to frequent users, it will be worth further examining the factor structure among studies with greater proportions of frequent adolescent users presumably with more purchasing experience.
At baseline, amplitude and persistence were only weakly correlated with each other, and yet each was independently associated with cannabis use and consequences in cross-sectional regression models that included both factors. At 6-month follow-ups, persistence was associated with consequences after controlling for baseline levels of consequences (akin to predicting changes in consequences over time), whereas amplitude was not associated with prospective use or consequences. These findings suggest that each factor may represent independent facets of cannabis demand that are each uniquely acting as markers of recent use and consequences. The prospective analyses further suggest that persistence in purchasing behavior (reflected by breakpoint and Pmax) may have additional utility in predicting worsening consequences attributable to cannabis use across this developmental period.
There are several limitations to note with suggestions for future research. First, we used a conservative approach in excluding adolescents who indicated that they would only consume cannabis for free on the MPT. Although it is possible that this exclusionary criterion could have resulted in exclusion of more opportunistic regular users (i.e., adolescents who regularly obtain and use cannabis at free cost), this would not appear to be the case in the present study. Only four excluded participants reported hypothetical consumption at free cost and only one participant reported using cannabis on a monthly basis or more (none at a weekly basis). Further, the MPT is best suited to assess the reinforcing value of cannabis among individuals with previous purchasing experience, and it is unclear if cannabis is reinforcing to those with very limited use experiences and who are unwilling to spend resources on the substance itself. Future studies should explore the reinforcing value of cannabis among adolescents without spending history using alternative measures (Acuff et al., 2019). Second, this study was conducted in a state with legalized cannabis use for individuals ages 21 and over. While adolescents across the United States are unable to legally purchase cannabis, future studies should assess adolescents’ demand in states where cannabis use is not legalized for recreational purposes to parse out the effects of legal status. Third, while adults find grams preferable to hits on the MPT (Aston et al., 2021; Ferguson et al., 2021), particularly given that it is the typical unit of measure in which cannabis is purchased (Wadsworth et al., 2020; Wetherill et al., 2016), adolescents may have different measurement preferences given their inability to purchase in legal markets. Replication using adaptive purchase tasks that allow individuals to select their preferred product and route of administration is warranted (Ferguson et al., 2021). Fourth, the present study utilized the CUDIT-R, a self-report measure of risk for CUD, to differentiate low- and high-risk users. Future studies should replicate these findings against more stringent measures of CUD (i.e., structured diagnostic interviews). Finally, we did not assess discretionary spending or other proxies of income among our sample, and future studies should do so in order to delineate the influence of this variable on cannabis demand.
Despite the aforementioned limitations, the present study significantly contributes to the demand literature by becoming the first to examine the validity of MPT among a sample of adolescent cannabis users from a state with legalized recreational use. These findings have significant clinical implications, particularly in the context of cannabis legalization across the majority of U.S. states and increasing acceptability of cannabis use by adolescents and parents. Of particular importance, adolescents in the present study showed sensitivity to price, with hypothetical purchasing decreasing as a function of increasing cost. Further, in comparison to studies with adult cannabis users, adolescents reported greater demand at free cost (intensity), but more sensitivity to price, and metrics demonstrating price sensitivity were more reliably associated with cannabis use outcomes relative to intensity. Therefore, the financial costs associated with cannabis use may be especially important within this population. Prevention efforts may wish to focus attention on limiting means of cannabis access at little or no financial costs. Parental monitoring can play a large role both in ensuring limited access to potentially free cannabis (e.g., friends, siblings, parents themselves) and by increasing monitoring of adolescents’ expenditures. Further, prior studies have demonstrated that cannabis users view legal cannabis as a superior commodity compared to illegal cannabis on versions of the MPT and are willing to pay more for legal product (Amlung et al., 2019). Although cannabis remains illegal for recreational use among adolescents across the country, the shifting legal climate may be contributing to decreased perceptions of cannabis risks among adolescents (Johnston et al., 2021). Clear prevention messages that communicate the risks, including the legal risks, to adolescents are needed at the family, community, and state levels.
Public Health Significance.
This study provides initial evidence that the marijuana purchase task is a valid measure to assess the reinforcing value of cannabis among adolescents. In addition to differentiating low- and high-risk users cross-sectionally, demand indices loaded on two latent factors, amplitude and persistence. Both factors were associated with cannabis use and consequences at baseline; persistence was associated with consequences at 6 months. These findings suggest that adolescents may be particularly sensitive to cannabis cost.
Acknowledgments
This research was supported by National Institute on Drug Abuse (NIDA) R21DA045092 (PI: Ramirez). Manuscript preparation was also supported by National Institute on Alcohol Abuse and Alcoholism (NIAAA) F32AA028667 (PI: Schultz); National Institute of General Medical Sciences (NIGMS) P20GM130414 (PI: Aston); and R01AA024091 (PI: Metrik). The content is solely the responsibility of the authors and does not necessarily represent the official views of the National Institutes of Health. The authors declare no competing interests.
Footnotes
This study was not preregistered. For additional data and study materials, please contact the last author.
A subset of the findings appearing in the manuscript were disseminated at the annual meeting of the Research Society on Marijuana in July, 2021.
α is also commonly referred to as elasticity within behavioral economic substance use literature.
References
- Acuff SF, Dennhardt AA, Correia CJ, & Murphy JG (2019). Measurement of substance-free reinforcement in addiction: A systematic review. Clinical Psychology Review, 70, 79–90. 10.1016/j.cpr.2019.04.003 [DOI] [PMC free article] [PubMed] [Google Scholar]
- Adamson SJ, Kay-Lambkin FJ, Baker AL, Lewin TJ, Thornton L, Kelly BJ, & Sellman JD (2010). An improved brief measure of cannabis misuse: The Cannabis Use Disorders Identification Test-Revised (CUDIT-R). Drug and Alcohol Dependence, 110(1–2), 137–143. 10.1016/j.drugalcdep.2010.02.017 [DOI] [PubMed] [Google Scholar]
- Adamson SJ, & Sellman JD (2003). A prototype screening instrument for cannabis use disorder: The Cannabis Use Disorders Identification Test (CUDIT) in an alcohol-dependent clinical sample. Drug and Alcohol Review, 22(3), 309–315. 10.1080/0959523031000154454 [DOI] [PubMed] [Google Scholar]
- Amlung M, Reed DD, Morris V, Aston ER, Metrik J, & MacKillop J (2019). Price elasticity of illegal versus legal cannabis: A behavioral economic substitutability analysis. Addiction, 114(1), 112–118. 10.1111/add.14437 [DOI] [PubMed] [Google Scholar]
- Amlung M, Yurasek A, McCarty KN, MacKillop J, & Murphy JG (2015). Area under the curve as a novel metric of behavioral economic demand for alcohol. Experimental and Clinical Psychopharmacology, 23(3), 168–175. 10.1037/pha0000014 [DOI] [PMC free article] [PubMed] [Google Scholar]
- Aston ER, & Cassidy RN (2019). Behavioral economic demand assessments in the addictions. Current Opinion in Psychology, 30, 42–47. 10.1016/j.copsyc.2019.01.016 [DOI] [PMC free article] [PubMed] [Google Scholar]
- Aston ER, Farris SG, MacKillop J, & Metrik J (2017). Latent factor structure of a behavioral economic marijuana demand curve. Psychopharmacology, 234(16), 2421–2429. 10.1007/s00213-017-4633-6 [DOI] [PMC free article] [PubMed] [Google Scholar]
- Aston ER, & Meshesha LZ (2020). Assessing cannabis demand: A comprehensive review of the marijuana purchase task. Neurotherapeutics; the Journal of the American Society for Experimental NeuroTherapeutics, 17(1), 87–99. 10.1007/s13311-019-00819-z [DOI] [PMC free article] [PubMed] [Google Scholar]
- Aston ER, Metrik J, Amlung M, Kahler CW, & MacKillop J (2016). Interrelationships between marijuana demand and discounting of delayed rewards: Convergence in behavioral economic methods. Drug and Alcohol Dependence, 169, 141–147. 10.1016/j.drugalcdep.2016.10.014 [DOI] [PMC free article] [PubMed] [Google Scholar]
- Aston ER, Metrik J, & MacKillop J (2015). Further validation of a marijuana purchase task. Drug and Alcohol Dependence, 152, 32–38. 10.1016/j.drugalcdep.2015.04.025 [DOI] [PMC free article] [PubMed] [Google Scholar]
- Aston ER, Metrik J, Rosen RK, Swift R, & MacKillop J (2021). Refining the marijuana purchase task: Using qualitative methods to inform measure development. Experimental and Clinical Psychopharmacology, 29(1), 23–35. 10.1037/pha0000355 [DOI] [PMC free article] [PubMed] [Google Scholar]
- Beverly HK, Castro Y, & Opara I (2019). Age of first marijuana use and its impact on education attainment and employment status. Journal of Drug Issues, 49(2), 228–237. 10.1177/0022042618823007 [DOI] [PMC free article] [PubMed] [Google Scholar]
- Bickel WK, Jarmolowicz DP, Mueller ET, & Gatchalian KM (2011). The behavioral economics and neuroeconomics of reinforcer pathologies: Implications for etiology and treatment of addiction. Current Psychiatry Reports, 13(5), 406–415. 10.1007/s11920-011-0215-1 [DOI] [PMC free article] [PubMed] [Google Scholar]
- Bickel WK, Johnson MW, Koffarnus MN, MacKillop J, & Murphy JG (2014). The behavioral economics of substance use disorders: Reinforcement pathologies and their repair. Annual Review of Clinical Psychology, 10, 641–677. 10.1146/annurev-clinpsy-032813-153724 [DOI] [PMC free article] [PubMed] [Google Scholar]
- Bickel WK, & Vuchinich RE (2000). Reframing health behavior change with behavioral economics. Lawrence Erlbaum Publishers. 10.4324/9781410605061 [DOI] [Google Scholar]
- Bidwell LC, MacKillop J, Murphy JG, Tidey JW, & Colby SM (2012). Latent factor structure of a behavioral economic cigarette demand curve in adolescent smokers. Addictive Behaviors, 37(11), 1257–1263. 10.1016/j.addbeh.2012.06.009 [DOI] [PMC free article] [PubMed] [Google Scholar]
- Bonn-Miller MO, Heinz AJ, Smith EV, Bruno R, & Adamson S (2016). Preliminary development of a brief cannabis use disorder screening tool: The Cannabis Use Disorder Identification Test Short-Form. Cannabis and Cannabinoid Research, 1(1), 252–261. 10.1089/can.2016.0022 [DOI] [PMC free article] [PubMed] [Google Scholar]
- Collins RL, Vincent PC, Yu J, Liu L, & Epstein LH (2014). A behavioral economic approach to assessing demand for marijuana. Experimental and Clinical Psychopharmacology, 22(3), 211–221. 10.1037/a0035318 [DOI] [PMC free article] [PubMed] [Google Scholar]
- D’Amico EJ, Tucker JS, Pedersen ER, & Shih RA (2017). Understanding rates of marijuana use and consequences among adolescents in a changing legal landscape. Current Addiction Reports, 4(4), 343–349. 10.1007/s40429-017-0170-y [DOI] [PMC free article] [PubMed] [Google Scholar]
- Ding A (2003). Youth are more sensitive to price changes in cigarettes than adults. The Yale Journal of Biology and Medicine, 76, 115–124. [PMC free article] [PubMed] [Google Scholar]
- Donohew RL, Hoyle RH, Clayton RR, Skinner WF, Colon SE, & Rice RE (1999). Sensation seeking and drug use by adolescents and their friends: Models for marijuana and alcohol. Journal of Studies on Alcohol, 60(5), 622–631. 10.15288/jsa.1999.60.622 [DOI] [PubMed] [Google Scholar]
- Ferguson E, Bush N, Yurasek A, & Boissoneault J (2021). The effect of next day responsibilities and an adaptive purchase task on cannabis demand. Drug and Alcohol Dependence, 227, Article 108919. 10.1016/j.drugalcdep.2021.108919 [DOI] [PubMed] [Google Scholar]
- Friend KB, Lipperman-Kreda S, & Grube JW (2011). The impact of local U.S. tobacco policies on youth tobacco use: A critical review. Open Journal of Preventive Medicine, 1(2), 34–43. 10.4236/ojpm.2011.12006 [DOI] [PMC free article] [PubMed] [Google Scholar]
- Gilroy SP, Kaplan BA, & Reed DD (2020). Interpretation(s) of elasticity in operant demand. Journal of the Experimental Analysis of Behavior, 114(1), 106–115. 10.1002/jeab.610 [DOI] [PubMed] [Google Scholar]
- Gilroy SP, Kaplan BA, Schwartz LP, Reed DD, & Hursh SR (2021). A zero-bounded model of operant demand. Journal of the Experimental Analysis of Behavior, 115(3), 729–746. 10.1002/jeab.679 [DOI] [PubMed] [Google Scholar]
- Hall W, & Lynskey M (2020). Assessing the public health impacts of legalizing recreational cannabis use: The US experience. World Psychiatry, 19(2), 179–186. 10.1002/wps.20735 [DOI] [PMC free article] [PubMed] [Google Scholar]
- Hasin DS (2018). US epidemiology of cannabis use and associated problems. Neuropsychopharmacology, 43(1), 195–212. 10.1038/npp.2017.198 [DOI] [PMC free article] [PubMed] [Google Scholar]
- Heishman SJ, Evans RJ, Singleton EG, Levin KH, Copersino ML, & Gorelick DA (2009). Reliability and validity of a short form of the Marijuana Craving Questionnaire. Drug and Alcohol Dependence, 102(1–3), 35–40. 10.1016/j.drugalcdep.2008.12.010 [DOI] [PMC free article] [PubMed] [Google Scholar]
- Hindocha C, Lawn W, Freeman TP, & Curran HV (2017). Individual and combined effects of cannabis and tobacco on drug reward processing in non-dependent users. Psychopharmacology, 234(21), 3153–3163. 10.1007/s00213-017-4698-2 [DOI] [PMC free article] [PubMed] [Google Scholar]
- Jacobus J, Bava S, Cohen-Zion M, Mahmood O, & Tapert SF (2009). Functional consequences of marijuana use in adolescents. Pharmacology Biochemistry and Behavior, 92(4), 559–565. 10.1016/j.pbb.2009.04.001 [DOI] [PMC free article] [PubMed] [Google Scholar]
- Johnson MW, & Bickel WK (2006). Replacing relative reinforcing efficacy with behavioral economic demand curves. Journal of the Experimental Analysis of Behavior, 85(1), 73–93. 10.1901/jeab.2006.102-04 [DOI] [PMC free article] [PubMed] [Google Scholar]
- Johnston LD, Miech RA, O’malley PM, Bachman JG, Schulenberg JE, & Patrick ME (2021). Monitoring the Future national survey results on drug use 1975–2020: Overview, key findings on adolescent drug use. Institute for Social Research, University of Michigan. [Google Scholar]
- Koffarnus MN, Franck CT, Stein JS, & Bickel WK (2015). A modified exponential behavioral economic demand model to better describe consumption data. Experimental and Clinical Psychopharmacology, 23(6), 504–512. 10.1037/pha0000045 [DOI] [PMC free article] [PubMed] [Google Scholar]
- Kopstein AN, Crum RM, Celentano DD, & Martin SS (2001). Sensation seeking needs among 8th and 11th graders: Characteristics associated with cigarette and marijuana use. Drug and Alcohol Dependence, 62(3), 195–203. 10.1016/S0376-8716(00)00170-8 [DOI] [PubMed] [Google Scholar]
- Lee CM, Kilmer JR, Neighbors C, Atkins DC, Zheng C, Walker DD, & Larimer ME (2013). Indicated prevention for college student marijuana use: A randomized controlled trial. Journal of Consulting and Clinical Psychology, 81(4), 702–709. 10.1037/a0033285 [DOI] [PMC free article] [PubMed] [Google Scholar]
- Lee CM, Kilmer JR, Neighbors C, Cadigan JM, Fairlie AM, Patrick ME, Logan DE, Walter T, & White HR (2021). A marijuana consequences checklist for young adults with implications for brief motivational intervention research. Prevention Science, 22(6), 758–768. 10.1007/s11121-020-01171-x [DOI] [PMC free article] [PubMed] [Google Scholar]
- MacKillop J, Murphy JG, Ray LA, Eisenberg DT, Lisman SA, Lum JK, & Wilson DS (2008). Further validation of a cigarette purchase task for assessing the relative reinforcing efficacy of nicotine in college smokers. Experimental and Clinical Psychopharmacology, 16(1), 57–65. 10.1037/1064-1297.16.1.57 [DOI] [PubMed] [Google Scholar]
- Mackillop J, Murphy JG, Tidey JW, Kahler CW, Ray LA, & Bickel WK (2009). Latent structure of facets of alcohol reinforcement from a behavioral economic demand curve. Psychopharmacology, 203(1), 33–40. 10.1007/s00213-008-1367-5 [DOI] [PMC free article] [PubMed] [Google Scholar]
- McIntyre-Wood C, Minhas M, Balodis I, Murphy JG, & MacKillop J (2021). A reinforcer pathology approach to cannabis misuse: Evaluation of independent and interactive roles of cannabis demand and delay discounting in a sample of community adults. Experimental and Clinical Psychopharmacology. Advance online publication. 10.1037/pha0000485 [DOI] [PubMed] [Google Scholar]
- Metrik J, Aston ER, Kahler CW, Rohsenow DJ, McGeary JE, Knopik VS, & MacKillop J (2016). Cue-elicited increases in incentive salience for marijuana: Craving, demand, and attentional bias. Drug and Alcohol Dependence, 167, 82–88. 10.1016/j.drugalcdep.2016.07.027 [DOI] [PMC free article] [PubMed] [Google Scholar]
- Minhas M, Balodis I, Aston ER, Murphy JG, & MacKillop J (2021). Using an optimized marijuana purchase task to examine cannabis demand in relation to cannabis misuse in heavy drinking emerging adults. Journal of Studies on Alcohol and Drugs, 82(3), 351–361. 10.15288/jsad.2021.82.351 [DOI] [PMC free article] [PubMed] [Google Scholar]
- Murphy JG, & Dennhardt AA (2016). The behavioral economics of young adult substance abuse. Preventive Medicine, 92, 24–30. 10.1016/j.ypmed.2016.04.022 [DOI] [PMC free article] [PubMed] [Google Scholar]
- Murphy JG, & MacKillop J (2006). Relative reinforcing efficacy of alcohol among college student drinkers. Experimental and Clinical Psychopharmacology, 14(2), 219–227. 10.1037/1064-1297.14.2.219 [DOI] [PubMed] [Google Scholar]
- O’Connor RJ, Heckman BW, Adkison SE, Rees VW, Hatsukami DK, Bickel WK, & Cummings KM (2016). Persistence and amplitude of cigarette demand in relation to quit intentions and attempts. Psychopharmacology, 233(12), 2365–2371. 10.1007/s00213-016-4286-x [DOI] [PMC free article] [PubMed] [Google Scholar]
- Patel H, & Amlung M (2019). Elevated cannabis demand is associated with driving after cannabis use in a crowd-sourced sample of adults. Experimental and Clinical Psychopharmacology, 27(2), 109–114. 10.1037/pha0000240 [DOI] [PubMed] [Google Scholar]
- Ramirez JJ (2020). Marijuana and me: Adapting the implicit association test to measure associations between marijuana and the self among late adolescents [abstract]. Cannabis (Research Society on Marijuana), 3(1), 136–137. [Google Scholar]
- Richter L, Pugh BS, & Ball SA (2017). Assessing the risk of marijuana use disorder among adolescents and adults who use marijuana. American Journal of Drug and Alcohol Abuse, 43(3), 247–260. 10.3109/00952990.2016.1164711 [DOI] [PubMed] [Google Scholar]
- Schultz NR, Bassett DT, Messina BG, & Correia CJ (2019). Evaluation of the psychometric properties of the cannabis use disorders identification test - revised among college students. Addictive Behaviors, 95, 11–15. 10.1016/j.addbeh.2019.02.016 [DOI] [PubMed] [Google Scholar]
- Skidmore JR, Murphy JG, & Martens MP (2014). Behavioral economic measures of alcohol reward value as problem severity indicators in college students. Experimental and Clinical Psychopharmacology, 22(3), 198–210. 10.1037/a0036490 [DOI] [PMC free article] [PubMed] [Google Scholar]
- Stein JS, Koffarnus MN, Snider SE, Quisenberry AJ, & Bickel WK (2015). Identification and management of nonsystematic purchase task data: Toward best practice. Experimental and Clinical Psychopharmacology, 23(5), 377–386. 10.1037/pha0000020 [DOI] [PMC free article] [PubMed] [Google Scholar]
- Tabachnick BG, & Fidell LS (2019). Using Multivariate Statistics (7th ed.). Pearson. [Google Scholar]
- Trangenstein PJ, Whitehill JM, Jenkins MC, Jernigan DH, & Moreno MA (2021). Cannabis marketing and problematic cannabis use among adolescents. Journal of Studies on Alcohol and Drugs, 82(2), 288–296. 10.15288/jsad.2021.82.288 [DOI] [PMC free article] [PubMed] [Google Scholar]
- Vedelago L, Wardell JD, Kempe T, Patel H, Amlung M, MacKillop J, & Keough MT (2022). Getting high to cope with COVID-19: Modelling the associations between cannabis demand, coping motives, and cannabis use and problems. Addictive Behaviors, 124, Article 107092. 10.1016/j.addbeh.2021.107092 [DOI] [PMC free article] [PubMed] [Google Scholar]
- Wadsworth E, Driezen P, Goodman S, & Hammond D (2020). Differences in self-reported cannabis prices across purchase source and quantity purchased among Canadians. Addiction Research and Theory, 28(6), 474–483. 10.1080/16066359.2019.1689961 [DOI] [Google Scholar]
- Wagner AC, Parks MJ, & Patrick ME (2021). How do high school seniors get marijuana? Prevalence and sociodemographic differences. Addictive Behaviors, 114, Article 106730. 10.1016/j.addbeh.2020.106730 [DOI] [PMC free article] [PubMed] [Google Scholar]
- Walden N, & Earleywine M (2008). How high: Quantity as a predictor of cannabis-related problems. Harm Reduction Journal, 5(1), Article 20. 10.1186/1477-7517-5-20 [DOI] [PMC free article] [PubMed] [Google Scholar]
- Wetherill RR, Hager N, Guthier E, & Franklin TR (2016). Gram years: A method to standardize and quantify lifetime cannabis consumption. Cannabis and Cannabinoid Research, 1(1), 216–217. 10.1089/can.2016.0025 [DOI] [PMC free article] [PubMed] [Google Scholar]
- Xu X, & Chaloupka FJ (2011). The effects of prices on alcohol use and its consequences. Alcohol Research & Health, 34(2), 236–245. [PMC free article] [PubMed] [Google Scholar]
- Zvorsky I, Nighbor TD, Kurti AN, DeSarno M, Naudé G, Reed DD, & Higgins ST (2019). Sensitivity of hypothetical purchase task indices when studying substance use: A systematic literature review. Preventive Medicine, 128, Article 105789. 10.1016/j.ypmed.2019.105789 [DOI] [PMC free article] [PubMed] [Google Scholar]
- Zwick WR, & Velicer WF (1986). Comparison of five rules for determining the number of components to retain. Psychological Bulletin, 99(3), 432–442. 10.1037/0033-2909.99.3.432 [DOI] [Google Scholar]