

Abstract
Background
A systemic and dysregulated immune response to infection contributes to morbidity and mortality associated with sepsis. Peripheral blood‐derived mesenchymal stromal cells (PB‐MSC) mitigate inflammation in animal models of sepsis. Allogeneic PB‐MSC administered IV to horses is well‐tolerated but therapeutic benefits are unknown.
Hypothesis
After IV lipopolysaccharide (LPS) infusion, horses treated with PB‐MSC would have less severe clinical signs, clinicopathological abnormalities, inflammatory cytokine gene expression, and oxidative stress compared to controls administered a placebo.
Animals
Sixteen horses were included in this study.
Methods
A randomized placebo‐controlled experimental trial was performed. Sixteen healthy horses were assigned to 1 of 2 treatment groups (1 × 109 PB‐MSC or saline placebo). Treatments were administered 30 minutes after completion of LPS infusion of approximately 30 ng/kg. Clinical signs, clinicopathological variables, inflammatory cytokine gene expression, and oxidative stress markers were assessed at various time points over a 24‐hour period.
Results
A predictable response to IV LPS infusion was observed in all horses. At the dose administered, there was no significant effect of PB‐MSC on clinical signs, clinicopathological variables, or inflammatory cytokine gene expression at any time point. Antioxidant potential was not different between treatment groups, but intracellular ROS increased over time in the placebo group. Other variables that changed over time were likely due to effects of IV LPS infusion.
Conclusions and Clinical Importance
Administration of allogeneic PB‐MSC did not cause clinically detectable adverse effects in healthy horses. The dose of PB‐MSC used here is unlikely to exert a beneficial effect in endotoxemic horses.
Keywords: allogeneic, endotoxemia, horses, oxidative stress
Abbreviations
- β‐GUS
beta‐glucuronidase
- CV
coefficient of variation
- dROM
determinants of reactive oxygen metabolites
- FBS
fetal bovine serum
- FRAS‐5
free radical analytical system‐5
- H2O2
hydrogen peroxide
- IFNγ
interferon gamma
- IL1β
interleukin 1 beta
- IL6
interleukin 6
- LPS
lipopolysaccharide
- MFI
median fluorescence intensity
- NO
nitric oxide
- PAC
plasma antioxidant capacity
- PB‐MSC
peripheral blood‐derived mesenchymal stromal cells
- ROS
reactive oxygen species
- SAA
serum amyloid A
- TNFα
tumor necrosis factor alpha
1. INTRODUCTION
Sepsis is a common cause of morbidity and mortality in neonatal foals and adult horses. 1 , 2 , 3 A systemic and dysregulated host immune response to infection can lead to multiple organ failure and death despite pathogen elimination. 4 In horses, sepsis is often caused by gram‐negative bacterial infection and is associated with increased pro‐inflammatory cytokine gene expression, acute‐phase protein production, and oxidative stress. 5 , 6 , 7 , 8 , 9 Low‐dose lipopolysaccharide (LPS; endotoxin) administered IV to horses results in moderate and transient clinical signs and clinicopathological abnormalities typical of sepsis. 10 , 11 , 12 This model of equine endotoxemia increases pro‐inflammatory cytokine gene expression as well as serum amyloid A (SAA) and reactive oxygen species (ROS) production. 10 , 12 , 13 , 14
Mesenchymal stromal cells (MSC) have potential for treating sepsis. Mesenchymal stromal cells are highly proliferative, pluripotent, self‐renewing cells capable of regulating host innate immune inflammatory responses through interactions with nearly all cells of the immune system. 15 Mesenchymal stromal cells can be obtained from several host tissues including peripheral blood, umbilical cord, bone marrow, and adipose tissue. 16 , 17 , 18 , 19 Mesenchymal stromal cells express immune‐related genes, which appear to be activated in the presence of inflammation. 20 When stimulated by an inflammatory milieu, MSC secrete mediators such as interleukin 6 (IL6), prostaglandin E2 (PGE2), and nitric oxide (NO) that inhibit lymphocyte proliferation as well as tumor necrosis factor alpha (TNFα) and interferon gamma (IFNγ) production. 18 Mesenchymal stromal cells also inhibit leukocyte infiltration into target organs and modulate organ failure. 21 , 22 , 23 In human viral sepsis, MSC therapy has been shown to improve survival and shorten recovery time. 24 Autologous MSC administration is not feasible in septic patients given the urgent nature of disease and the delay necessary for cell expansion. Allogeneic MSC administration is safe in humans and rodents because of the low immunogenicity of MSC. 24 , 25 , 26 , 27 In adult horses, safety data suggest that IV administration of varying doses (105 to 10 8 ) of allogeneic MSC is well‐tolerated, even when MHC haplotypes between donor and recipient are unknown or unmatched. 19 , 28 , 29 , 30
Peripheral blood (PB) is a readily available, non‐invasive source for MSC that can be easily collected, expanded, and cryopreserved until its use as a treatment modality is needed. 19 , 31 , 32 Given the immunomodulatory effects of MSC and the ease of obtaining them, allogeneic PB‐MSC is a potentially attractive candidate for therapy of systemic inflammation associated with sepsis.
The objective of the current study was to determine the efficacy of IV administration of PB‐MSC after sublethal LPS infusion in healthy horses. We hypothesized that after IV LPS infusion, horses treated with PB‐MSC would have decreased clinical signs, clinicopathological abnormalities, pro‐inflammatory cytokine gene expression, and oxidative stress compared to placebo controls.
2. MATERIALS AND METHODS
2.1. Animals and experimental design
A blinded, randomized placebo‐controlled experimental trial was performed in 16 healthy adult horses obtained from a university teaching herd. Horses were randomly assigned to 1 of 2 groups using a random number generator. Eight horses per group were expected to provide >80% power (α = .05) to show at least a 50% difference between groups in white blood cell (WBC) abnormalities (leukocyte and neutrophil counts) 1‐hour post‐LPS administration. 12 For horses to be included in the study, an unremarkable physical examination, pain score, 33 WBC count and differential, serum biochemical analysis, and serum amyloid A (SAA) had to be documented. Additionally, all horses had to demonstrate a response to LPS infusion as determined by increased rectal temperature (>101.5°F), increased pain score (>13), or development of neutropenia within 2 hours of IV LPS infusion during execution of the current study. 10 A total of 17 horses were administered LPS but 1 was excluded because of lack of response to LPS leaving 16 horses for inclusion into the study. Of the 16 horses included in the study, 9 were geldings and 7 were mares (median age 17 years; range, 5‐25 years). Six breeds were represented including 5 Quarter Horses, 5 Thoroughbreds, 3 Warmbloods, 2 Paint Horses, and 1 Standardbred. The median weight of the horses was 488 kg (range, 414‐640 kg). Horses were housed in individual, temperature‐controlled box stalls starting 1 day before the study day and were returned to pasture the day after. Two horses per group (4 total) were tested per week during the month of July. All horses had access to free‐choice water and grass hay throughout the study. This study was approved by the university's Institutional Animal Care and Use Committee.
2.2. Peripheral blood‐derived mesenchymal stromal cell culture
Approximately 30 mL of whole blood was collected aseptically from the jugular vein of a healthy adult horse from a university teaching herd. The MHC haplotype of the horse was not determined. Peripheral blood‐derived mesenchymal stromal cells were isolated and cultured as previously described. 34 Briefly, plasma with buffy coat was subjected to density gradient centrifugation using Ficoll Paque (GE Healthcare, Waukesha, Wisconsin). The interphase was collected and after washing, cells were seeded at 16 × 104 cells/cm2 in a medium consisting of DMEM with low (1000 mg/L) glucose (Lonza, LLC, Mapleton, Illinois), 30% fetal bovine serum (FBS; Cytiva Life Sciences, Marlborough, Massachusetts), antibiotic‐antimycotic solution (penicillin [10 000 units/mL], streptomycin [10 000 μg/mL], and amphotericin B [25 μg/mL]; Gibco, ThermoFisher Scientific Inc., Waltham, Massachusetts), l‐alanine‐l‐glutamine (GlutaMAX, Gibco, ThermoFisher Scientific Inc., Waltham, Massachusetts) and 1 × 10⁻⁷ M dexamethasone (MP Biomedicals, LLC, Santa Ana, California). Cells presumed to be PB‐MSC were visible 10 to 12 days after seeding. At 70% to 80% confluency, cells were trypsinized with 0.25% trypsin‐EDTA and were transferred to fresh DMEM medium without dexamethasone in T75 flasks. At 70% to 80% confluency, the cells were detached from the flask using trypsin and were centrifuged. Cells were reconstituted in fresh DMEM medium with 10% FBS and 10% DMSO and stored in liquid nitrogen until use. To confirm the “stemness” of the cultured cells, multicolor flow cytometry was used for immunophenotyping. Cells that were positive (> 90%) for the cellular protein markers CD29 (Clone TMD29, MilliporeSigma, Burlington, Massachusetts), CD44 (Clone IM7, ThermoFisher Scientific Inc., Waltham, Massachusetts), and CD90 (DH24A, Washington State University, Pullman, Washington), and negative (< 10%) for CD45 (Clone F10‐89‐4, Bio‐Rad Laboratories, Hercules, California), CD79a (Clone HM57, Bio‐Rad Laboratories, Hercules, California), CD105 (Clone SN6, Bio‐Rad Laboratories, Hercules, California), monocyte/macrophage marker and MHC II (ThermoFisher Scientific, Inc., Waltham, Massachusetts) were considered MSC. 17 , 18 , 34 In addition, tri‐lineage differentiation was used to confirm the osteogenic, chondrogenic and adipogenic differentiation potential of the cultured cells. 17 , 35 Within 30 minutes before administration, PB‐MSC were thawed, centrifuged and reconstituted in DMEM medium without DMSO or FBS, and then added to 0.9% sodium chloride.
2.3. Endotoxin and drug administration
The sampling protocol is shown in Figure 1. Briefly, the evening before the start of the study, a jugular catheter was aseptically placed. On the day of the study, endotoxemia was induced in all horses by IV infusion of 15 μg (23‐36 ng/kg) LPS (Escherichia coli 0111:B4, Sigma‐Aldrich, St. Louis, Missouri) in 500 mL 0.9% sodium chloride over a 30‐minute period (T−1.5 to T−1 hours). 10 , 12 , 36 Horses in the treatment group received 1 × 109 PB‐MSC reconstituted in 500 mL sterile 0.9% sodium chloride IV. This dose was based on in vitro inhibition of TNFα production by LPS‐stimulated equine monocytes after adding PB‐MSC (data not shown) and considering the time needed for PB‐MSC culture. Horses in the control group were administered 500 mL sterile 0.9% sodium chloride IV. Treatment (eg, PB‐MSC or placebo) was administered 30 minutes after completion of LPS infusion and was administered over a 30‐minute period (T−0.5 to T0 hours). Treatment was administered after LPS infusion to better mimic a clinical case and to expose PB‐MSC to inflammatory mediators for enhanced activation.
FIGURE 1.
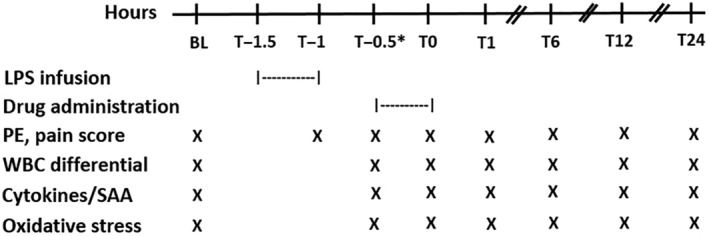
Daily schedule from baseline (BL) to 24 hours after drug administration in 16 adult horses. The asterisk indicates that the T−0.5 blood sample was collected immediately before drug administration. LPS, lipopolysaccharide; PE, physical examination; WBC, white blood cell; SAA, serum amyloid A
2.4. Clinical and clinicopathological assessment
Physical examinations were performed at baseline (BL; within 30 minutes before the start of LPS infusion), within 5 minutes of completion of LPS infusion (T−1 h), within 5 minutes before the start of drug administration (T−0.5), within 5 minutes of completion of drug administration (T0), T1, 6, 12 and 24 hours. At each examination time point, pain scores were obtained before entering the stall. Whole blood anticoagulated with EDTA was collected from the IV catheter for WBC analysis (Advia 2120, Siemens Healthcare Diagnostics, Inc., Tarrytown, New York) and plasma SAA concentration (StableLab, Zoetis, Parsippany, New Jersey) 37 at BL, T−0.5, 0, 1, 6, 12, and 24 hours. As with physical examinations, T−0.5‐hour samples were collected within 5 minutes before drug administration and T0 samples were collected within 5 minutes of completion of drug administration. Manual WBC analysis was performed by counting 100 cells in a monolayer in all samples to confirm automated counts.
2.5. Inflammatory cytokine analyses
Blood was collected from each horse at BL, T−0.5, 0, 1, 6, 12, and 24 hours to determine pro‐inflammatory cytokine gene expression including TNFα, interleukin 1 beta (IL1β), and IL6. Sample of blood was immediately placed into Tempus RNA Blood Tubes (Applied Biosystems, Beverly, Massachusetts) within 15 seconds of collection, shaken as directed by the manufacturer, and frozen at −20°C until analysis. Ribonucleic acid was isolated using a benchtop purification instrument (KingFisher Flex System, ThermoFisher Scientific, Inc., Waltham, Massachusetts) and nucleic acid purification kit (MagMAX CORE Nucleic Acid Purification Kit, Applied Biosystems, Beverly, Massachusetts) per manufacturer recommendations, except there was no DNase step and the pelleted RNA was re‐suspended in 600 μL viral lysis buffer (Invitrogen, ThermoFisher Scientific Inc., Waltham, Massachusetts). 38 Gene expression was determined using the relative quantitation method, 39 where the baseline sample from each horse was used as its calibrator for each gene. Beta‐glucuronidase (β‐GUS) was used as the housekeeping gene for all samples, 40 and samples were assayed in duplicate using commercially available primers and probes (ThermoFisher Scientific Inc., Waltham, Massachusetts) 41 :
β‐GUS (Ec03470630_m1)
TNFα (Ec03467871_m1)
IL1β (Ec04260298_s1)
IL6 (Ec03468678_m1)
2.6. Oxidative stress analyses
A photometer (free radical analytical system‐5, FRAS‐5, Innovatics Laboratories, Inc., Philadelphia, Pennsylvania) was used to measure oxidative stress in 2 ways after validation for use in horses. Plasma concentrations of determinants of reactive oxygen metabolites (dROM) were measured to reflect ROS concentrations and plasma antioxidant capacity (PAC) was measured to reflect antioxidant potential. 42 , 43 Validation of the photometer for use in horses was performed by spiking aliquots of the same equine blood sample with various concentrations of hydrogen peroxide (H2O2; 0.001%, 0.002%, 0.005%, and 0.01%) to act as known concentrations of reactive oxygen metabolites. The samples demonstrated a dose‐dependent increase in dROM values. To validate the PAC assay, aliquots of the same blood sample were spiked with ascorbic acid, a known antioxidant, at concentrations of 1.56, 3.125, 6.25, 12.5, and 25 mM. Samples demonstrated a dose‐dependent response until appearing to reach saturation at 12.5 mM. A range of normal baseline values in healthy Quarter Horses was also determined by assessing dROM in 45 healthy horses (3‐20 years, mean 12.5 ± 5.0; 13 mares, 32 geldings). Values for dROM and PAC were expressed as arbitrary Carratelli units (U Carr) and Cornelli units (U Cor), respectively, because of the chemical heterogeneity of free radicals generated during ROS breakdown (1 U Carr = 0.08 mg/dL of H2O2; 1 U Cor = 1.4 μmol/L of ascorbic acid). 44 The mean dROM value was 103 ± 20.7 U Carr and the mean PAC value was 2881 ± 313.9 U Cor. In the current study, whole blood anticoagulated with heparin was collected at BL, T−0.5, 0, 1, 6, 12, and 24 hours. Plasma was separated within 1 hour of collection, stored in amber tubes to reduce effects of light on oxidation, and stored at −80°C until analysis.
In addition to the photometric assessment of oxidative stress, flow cytometry was used to detect intraerythrocytic and intraleukocytic ROS. This method utilizes the fluorescent marker 2′‐7′‐dichlorodihydrofluorescein diacetate (DCFH‐DA) to directly label intracellular ROS. 45 Two samples of whole blood anticoagulated with EDTA were collected from each horse at BL, T−0.5, 0, 1, 6, 12, and 24 hours and were stored at 4°C until analysis up to 12 hours after collection. One of the 2 whole blood samples for each horse was used for intraerythrocytic ROS measurement as previously described. 46 Briefly, samples were centrifuged at 3000g for 5 minutes at 4°C and the erythrocyte pellet was diluted in phosphate saline buffer (PBS, pH 7.4; 137 mM NaCl [EMD Chemicals Inc, Savannah, Georgia], 10 mM Na2HPO4 [Sigma‐Aldrich, St. Louis, Missouri], 2.7 mM KCl [Mallinckrodt Specialty Chemicals Co., St. Louis, Missouri], and 1.8 mM KH2PO4 [Mallinckrodt Specialty Chemicals Co., St. Louis, Missouri]) supplemented with 1% w/v albumin (PBSA, Fisher Scientific, Pittsburg, Pennsylvania). The second blood sample was used for intraleukocytic ROS measurement after buffy coat separation and erythrocyte lysis. This consisted of incubating 1 volume of cells with 9 volumes of an aqueous solution containing 150 mM NH4Cl, 10 mM NaHCO3, and 1.3 mM EDTA (pH 7.4, all Sigma‐Aldrich, St. Louis, Missouri) for 10 minutes under constant gentle shaking, followed by 2 washing steps with 1% PBSA. Samples were incubated with 50 μM DCFH‐DA (Sigma‐Aldrich, St. Louis, Missouri) or DMSO (vehicle control, American Bioanalytical, Natick, Massachusetts) for 20 minutes at 37°C.
For both intraerythrocytic and intraleukocytic analyses, cells were either left unstimulated to represent the current oxidative status of the cells, or were stimulated with 1.82 mM H2O2 (Sigma‐Aldrich, St Louis, Missouri) for 20 minutes at room temperature to promote the generation of ROS within cells and therefore represent the indirect capacity of the cells to neutralize ROS. Unstimulated samples received PBS at the same volume as H2O2 and were incubated for 20 minutes at room temperature. Then, all samples were quenched with 300 μL 1% PBSA and immediately analyzed by flow cytometry (BD Accuri C6 Plus flow cytometer, Becton & Dickinson and Co., Franklin Lakes, New Jersey). All samples were run in triplicate except for 2 horses whose samples were run in duplicate because of insufficient quantity of cells. The raw median fluorescence intensity (MFI) was recorded and exported to Flow Jo V10.5.3 software (Flow Jo, Ashland, Oregon) for a proper gating strategy to analyze erythrocytes and leukocytes.
2.7. Statistical analysis
Outcome variables related to the physical examination (heart rate, temperature, and pain score), clinicopathological tests (WBC, segmented neutrophil count, lymphocyte count, and SAA), gene expression for cytokines (TNFα, IL1β, and IL6), and oxidative stress markers (PAC and dROM) were assessed for changes over time and by treatment group (PB‐MSC vs placebo). These assessments were performed as repeated measures analysis using a mixed‐effect model with the horse as a random effect and time and treatment groups as fixed effects. Normality of the residuals in the models was assessed by q‐q plots and distribution graphs.
Outcome variables related to flow cytometry measures of ROS were also assessed for changes over time and by treatment group. Geisser‐Greenhouse's correction was used to adjust for violations of sphericity in the repeated measures analysis. The coefficient of variation (CV) for flow cytometric data was set at ≤20%. 46 Replicates causing the CV to be >20% were considered outliers and were removed (186 outliers out of approximately 2500 measurements).
Flow Jo‐treated data were exported and analyzed on GraphPad Prism 8.0.2 (GraphPad, San Diego, California). Fixed effects of all models were compared by computation of least square means. Tukey's multiple comparison adjustment in calculation of P‐values was used for post‐hoc pairwise comparisons in analyses if time or treatment groups were determined to be significant variables. Alpha (type I) error rate was set at .05.
3. RESULTS
Lipopolysaccharide infusion resulted in fever and increased pain scores in all horses within 2 hours of completion of LPS infusion, that is, by T1 hour (P < .0001; Figure 2). Clinicopathological variables that changed over time after LPS infusion included WBC count, segmented neutrophils, lymphocytes, and SAA (P < .0001; Figure 3). Treatment with PB‐MSC did not affect rectal temperature, heart rate or pain score compared to placebo controls (P = .77, .37, and .09, respectively). The lymphocyte count was lower in the PB‐MSC group compared to the control group as an overall effect (P = .03), but was not significantly different at any specific time point when adjusted for multiple comparisons. The WBC count, segmented neutrophils, and SAA were not different between treatment groups (P = .66, .51, and .93, respectively). Gene expression of TNFα, IL6, and IL1β changed over time after LPS infusion (P < .0001; Figure 4). Only gene expression of IL1β significantly differed between treatments (P < .001), being significantly lower in the PB‐MSC treatment group compared to controls at T0 hour (within 5 minutes of completion of drug administration; P < .0001) and T1 hour (P < .0001).
FIGURE 2.
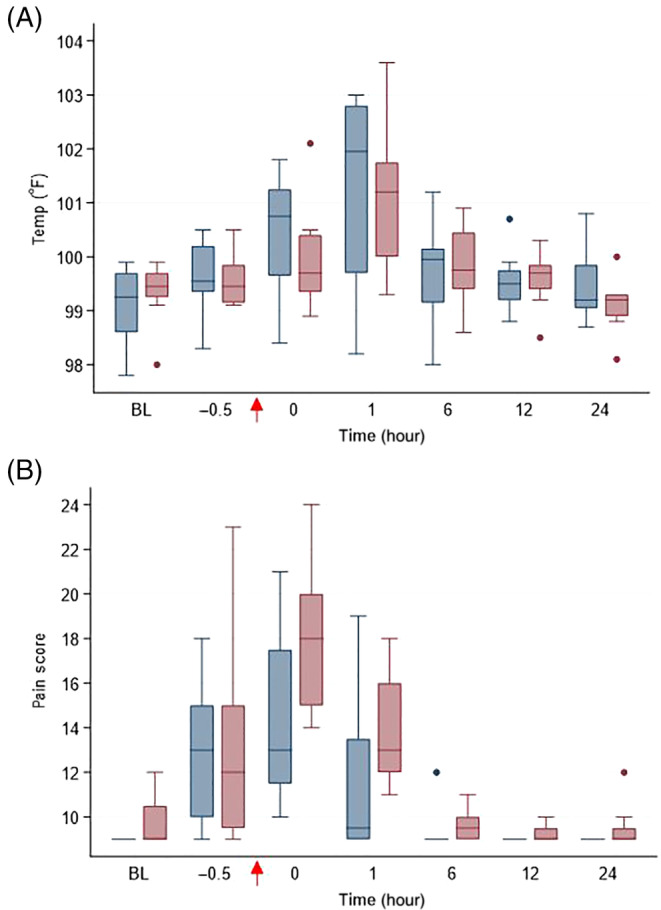
(A) Rectal temperature (°F) and (B) pain score in horses administered peripheral blood‐derived mesenchymal stromal cells (PB‐MSC; n = 8, blue bars) or saline (placebo; n = 8; red bars) after LPS infusion. The arrow indicates completion time of drug administration (PB‐MSC or saline). Box and whisker plots are displayed with median (line) within box (IQR). Whiskers represent range except for points, which extend >1.5 times IQR; these points or outliers are displayed as filled circles. BL: baseline
FIGURE 3.
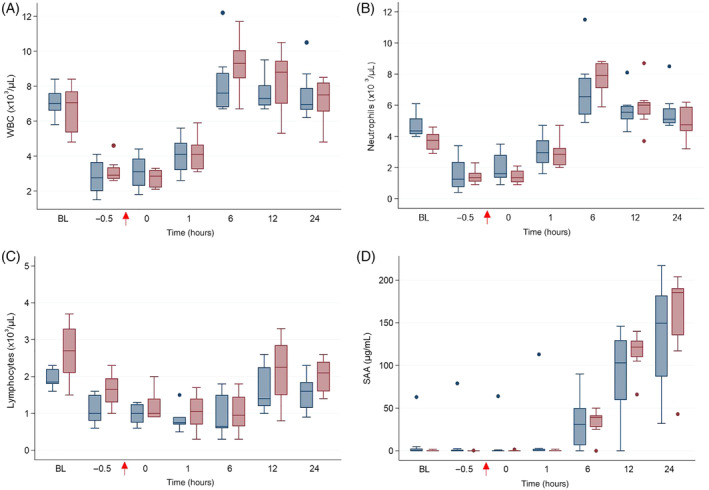
(A) WBC count, (B) segmented neutrophil count, (C) lymphocyte count and (D) serum amyloid A (SAA) in horses administered peripheral blood‐derived mesenchymal stromal cells (PB‐MSC; n = 8, blue bars) or saline (placebo; n = 8; red bars) after LPS infusion. The arrow indicates completion time of drug administration (PB‐MSC or saline). Box and whisker plots are displayed with median (line) within box (IQR). Whiskers represent range except for points, which extend >1.5 times IQR; these points or outliers are displayed as filled circles. BL: baseline
FIGURE 4.
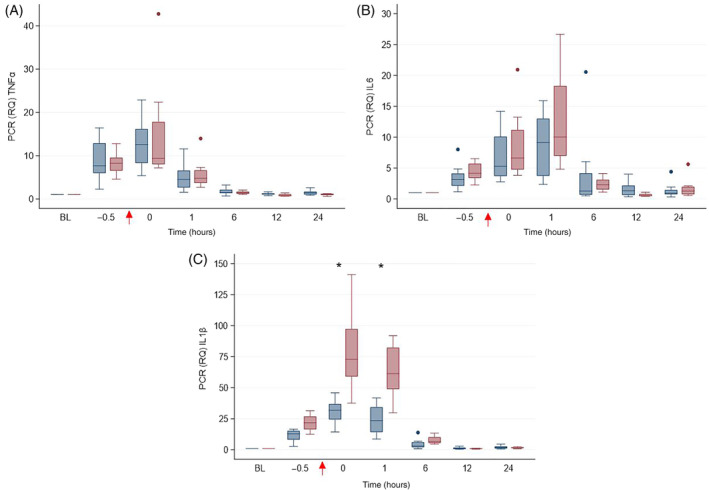
Gene expression of (A) TNFα, (B) ILprio6, and (C) IL1β in horses administered peripheral blood‐derived mesenchymal stromal cells (PB‐MSC; n = 8, blue bars) or saline (placebo; n = 8; red bars) after LPS infusion. The arrow indicates completion time of drug administration (PB‐MSC or saline). Box and whisker plots are displayed with median (line) within box (IQR). Whiskers represent range except for points, which extend >1.5 times IQR; these points or outliers are displayed as filled circles. Asterisks denote differences between treatment groups. BL: baseline
Plasma antioxidant capacity decreased over time after LPS infusion (P = .02) but dROM did not (P = .15; Figure 5). Treatment did not affect PAC or dROM.
FIGURE 5.
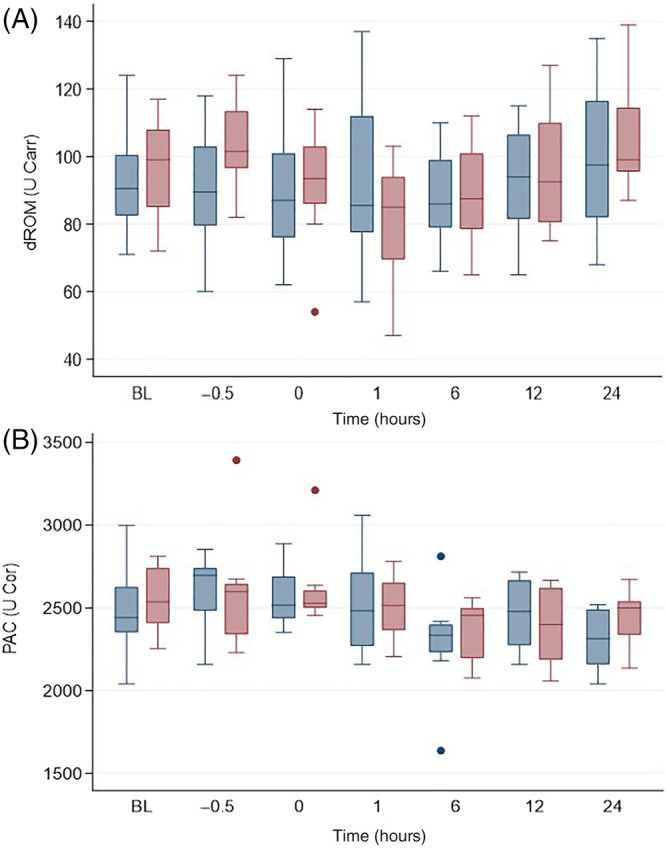
Determinants of (A) reactive oxygen metabolites (dROM) and (B) plasma antioxidant capacity (PAC) in horses administered peripheral blood‐derived mesenchymal stromal cells (PB‐MSC; n = 8, blue bars) or saline (placebo; n = 8; red bars) after LPS infusion. The arrow indicates completion time of drug administration (PB‐MSC or saline). Box and whisker plots are displayed with median (line) within box (IQR). Whiskers represent range except for points, which extend >1.5 times IQR; these points or outliers are displayed as filled circles. BL: baseline
Intraerythrocytic concentrations of ROS were obtained from 8 horses treated with PB‐MSC and 7 placebo controls; samples from 1 horse were unprocessed due to technical errors. Intraerythrocytic ROS significantly varied over time in the placebo group (P = .02; Figure 6), with significant differences between T−0.5 and T12 hours, T−0.5 and T24 hours and T1 and T24 hours (P = .05, .03 and .05, respectively). However, intracellular ROS were not different between treatment groups. No difference was observed regarding the intraerythrocytic antioxidant potential (ie, cells stimulated with H2O2) between PB‐MSC and placebo.
FIGURE 6.
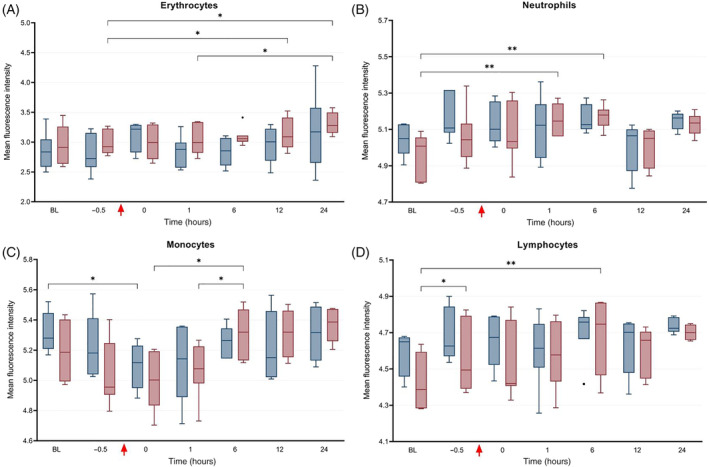
Median fluorescence intensity (IQR and range) as determined by flow cytometry representing the direct concentration of intracellular reactive oxygen species (ie, current oxidative status) in peripheral blood (A) erythrocytes, (B) neutrophils, (C) monocytes, and (D) lymphocytes in horses administered peripheral blood‐derived mesenchymal stromal cells (PB‐MSC; erythrocytes: n = 8, leukocytes: n = 6; red bars) or saline (placebo; n = 7, blue bars) after LPS infusion. The bars indicate differences between groups. *P < .05; **P < .01
Intraleukocytic concentrations of ROS were obtained from 6 horses treated with PB‐MSC and the same 7 placebo controls as for intraerythrocytic ROS analysis; samples from 3 horses were unprocessed because of technical errors. Intracellular ROS significantly differed at various times (Figure 6) in neutrophils, monocytes, and lymphocytes (P = .0006, .0001, and .004, respectively). These differences were as follows: ROS were increased in neutrophils between BL and T1 hour and between BL and T6 hour in the placebo group; ROS were increased in monocytes between T0 and T6 hours and between T1 and T6 hours in the placebo group, and decreased between BL and T0 hour in the PB‐MSC group; and ROS were increased in lymphocytes between BL to T−0.5 hour and BL to T6 hour in the placebo group. Intraleukocytic concentrations of ROS were not different between treatment groups for any cell analyzed. With respect to intraleukocytic antioxidant potential (ie, cells stimulated with H2O2), a significant increase was observed from BL to T−0.5 hour and from BL to T1 hour in neutrophils in the placebo group (P < .05; Figure 7); however, there was no difference in the antioxidant potential of monocytes or lymphocytes between treatment groups at any time point.
FIGURE 7.
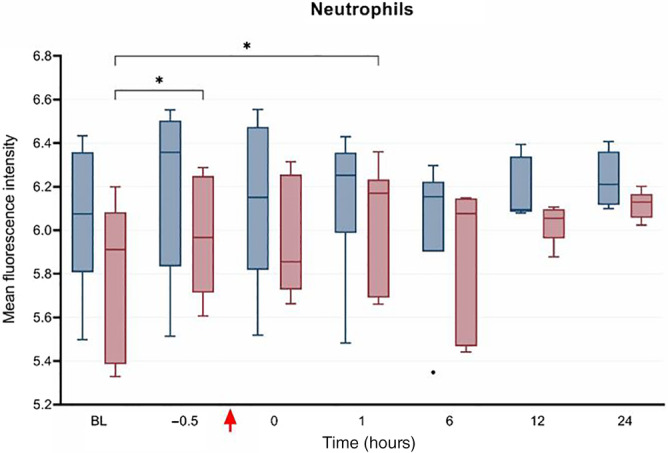
Median fluorescence intensity (IQR and range) as determined by flow cytometry representing the antioxidant potential (ie, intracellular concentration of reactive oxygen species after stimulation with hydrogen peroxide) in neutrophils from horses administered peripheral blood‐derived mesenchymal stromal cells (PB‐MSC: n = 6, red bars) or saline (placebo; n = 7, blue bars) after LPS infusion. The bars indicate differences between groups. *P < .05
4. DISCUSSION
At a dose of 1 × 10⁹ allogeneic PB‐MSC per horse, administered 30 minutes after IV LPS infusion, there was no effect of PB‐MSC compared to placebo controls on clinical signs, leukocyte count, neutrophil count, plasma SAA concentration, or pro‐inflammatory cytokine gene expression at any time point. This is consistent with results from a pilot study investigating effects of 1 × 10⁸ allogeneic bone marrow‐derived MSC on similar variables using the same LPS infusion model. 28 In the current study, IV administration of PB‐MSC was associated with decreased lymphocyte counts but this was likely clinically irrelevant given that pre‐treatment lymphocyte counts were lower in the PB‐MSC group. In addition, PB‐MSC administration was associated with lower IL1β gene expression at T0 and T1 hours compared to placebo controls. Given that PB‐MSC administration was completed at T0 hour after a 30‐min infusion, it was unlikely to produce an effect on gene expression that quickly. 18 It is unclear if the magnitude of dose affects timing of gene expression. Thus, the difference in IL1β gene expression between treatment groups was likely clinically inconsequential.
In the current study, ROS production was assessed by measuring plasma dROM concentrations as well as intraerythrocytic and intraleukocytic ROS. Although dROM and intracellular ROS concentrations were not different between treatment groups at any time point, intracellular ROS increased over time only in the placebo group. Increased intracellular ROS is expected after LPS infusion so the fact that this increase was only observed in the placebo group might suggest an antioxidant effect of PB‐MSC administration. It is likely that plasma ROS concentrations take longer to increase after an inflammatory stimulus than cellular ROS, which could explain why dROM did not increase over time. Decreased ROS production in monocytes over time in the PB‐MSC group might also support a protective effect of PB‐MSC treatment; however, this effect would have been immediate given that PB‐MSC administration was completed at T0 h. Antioxidant potential was measured by plasma PAC and H2O2‐stimulated erythrocytes and leukocytes, none of which were different between treatment groups. It is possible that changes in antioxidant potential are not observed until >24 hours after a therapeutic intervention and were therefore not captured in this study. A decrease in myeloperoxidase, an enzyme that catalyzes formation of ROS in the presence of H2O2, was demonstrated in neutrophils 6 days after experimental LPS infusion in horses. 47 In addition, antioxidant potential might not be an appropriate measure of oxidative stress in horses. Finally, the dose of PB‐MSC used in this study might not have been high enough to affect antioxidant potential.
The lack of efficacy of PB‐MSC in mitigating clinical signs and inflammatory responses to endotoxemia might be due to several reasons. Lipopolysaccharide was administered before PB‐MSC in this study to better mimic clinical endotoxemia and because anti‐inflammatory effects of PB‐MSC require exposure to inflammatory mediators for activation of their immunosuppressive properties. 48 , 49 , 50 However, it is possible that a longer duration of endotoxemia was required before treatment to sufficiently activate PB‐MSC. In addition, the low dose of LPS used to induce endotoxemia might not have been sufficient to test the potential benefit of PB‐MSC. Higher doses of LPS are associated with severe disease and death, rendering this an unsuitable model. 51 , 52 , 53 Furthermore, it is possible that the dose of PB‐MSC administered in vivo might have been too low to exert substantial anti‐inflammatory and antioxidant effects. At a 1:1 ratio of equine monocytes to PB‐MSC, monocyte production of TNFα decreased by 22% compared to monocytes alone, whereas a ratio of 1:10 and 1:100 resulted in 57% and 91% reduction in TNFα, respectively (data not shown). A PB‐MSC dose required to meet a 1:10 or 1:100 ratio of monocytes to PB‐MSC would require high throughput culture systems, which might not be practical in a non‐commercial setting. Furthermore, the half‐life of PB‐MSC after IV administration in horses is unknown. Molecular imaging technologies have been used in rodent models to track the fate of IV injected MSC, 80% of which become trapped in lung microvasculature within 1 hour of injection due to the relatively large size of MSC. 54 , 55 , 56 , 57 , 58 , 59 , 60 In rodents and dogs, pulmonary embolism and myocardial infarction occur after intra‐arterial MSC injection because of MSC thrombus formation. 61 , 62 Similarly, 80% of cats treated with IV MSC for chronic kidney disease developed respiratory distress within 30 minutes of injection, possibly due to pulmonary embolism. 63 In the current study, it is possible that PB‐MSC were trapped in organ microvasculature, rendering them ineffective in combating systemic inflammation, but no clinically detectable adverse effects suggesting infarcts were observed. Notably, no pulmonary adverse events have been reported in >300 horses in which the safety of IV allogeneic stromal cells has been evaluated. 19 , 28 , 29 , 30 Pharmacokinetics of allogeneic equine MSC and their secreted factors after IV administration might elucidate future approaches for MSC therapy in horses. Finally, it is possible that PB‐MSC viability was reduced before or after IV administration. Before IV administration, cell viability was not assessed after reconstitution in 0.9% sodium chloride. Although this might have resulted in osmotic shock and subsequent cell death, 1 study found that nearly 80% of umbilical cord‐derived MSC stored in 0.9% sodium chloride were viable after 6 hour of storage at room temperature. 64 In the current study, PB‐MSC were administered within 30 minutes of thawing, centrifugation and reconstitution in saline, so storage time and temperature were unlikely factors in viability. After IV administration of PB‐MSC, pre‐existing circulating antibodies could have elicited antibody‐mediated cytotoxicity of the cells, precluding appreciable anti‐inflammatory effects. Anti‐bovine antibodies are commonly found in adult horses given that some vaccines contain FBS. Although FBS was removed from PB‐MSC before administration, residual expression of FBS‐derived genes from cells cultured in FBS is possible. 65 In addition, circulating antibodies against foreign MHC proteins might have led to destruction of PB‐MSC after administration.
In summary, IV administration of PB‐MSC at a dose of 1 × 10⁹ in adult horses after low‐dose LPS infusion resulted in minimal changes when compared to a placebo control group. Variables that changed over time were most likely a reflection of effects from IV LPS infusion, although it is possible that PB‐MSC mitigated IL1β expression and intracellular ROS production. High throughput PB‐MSC culture systems are necessary to test the benefit of higher doses of PB‐MSC in this model of equine endotoxemia.
CONFLICT OF INTEREST DECLARATION
George E. Moore serves as Consulting Editor for Experimental Design and Statistics for the Journal of Veterinary Internal Medicine. He was not involved in review of this manuscript. No other authors have a conflict of interest.
OFF‐LABEL ANTIMICROBIAL DECLARATION
Authors declare no off‐label use of antimicrobials.
INSTITUTIONAL ANIMAL CARE AND USE COMMITTEE (IACUC) OR OTHER APPROVAL DECLARATION
Approved by the IACUC of Purdue University, protocol number 506001264E001.
HUMAN ETHICS APPROVAL DECLARATION
Authors declare human ethics approval was not needed for this study.
ACKNOWLEDGMENT
This study was supported by the Purdue University Showalter Trust (Project # 208453), Purdue University AgSEED Agricultural Research and Extension Program, and the USDA National Institute of Food and Agriculture (Hatch Project # 1016369). The authors thank Dr. Gerlinde Van de Walle, Dr. Jose Goni, Dr. Anna Smith, Dr. Sarah Carl, Theresa Jeffrey, Laura Murray and Anisa Dunham for their technical assistance.
Taylor SD, Serpa PBS, Santos AP, et al. Effects of intravenous administration of peripheral blood‐derived mesenchymal stromal cells after infusion of lipopolysaccharide in horses. J Vet Intern Med. 2022;36(4):1491‐1501. doi: 10.1111/jvim.16447
Funding information USDA National Institute of Food and Agriculture, Grant/Award Number: 1016369; Purdue University AgSEED Agricultural Research and Extension Program; Purdue University Showalter Trust, Grant/Award Number: 208453
REFERENCES
- 1. Cohen ND. Causes of and farm management factors associated with disease and death in foals. J Am Vet Med Assoc. 1994;204:1644‐1651. [PubMed] [Google Scholar]
- 2. Peek SF, Semrad S, McGuirk SM, et al. Prognostic value of clinicopathologic variables obtained at admission and effect of antiendotoxin plasma on survival in septic and critically ill foals. J Vet Intern Med. 2006;20:569‐574. [DOI] [PubMed] [Google Scholar]
- 3. Arroyo MG, Slovis NM, Moore GE, Taylor SD. Factors associated with survival in 97 horses with septic pleuropneumonia. J Vet Intern Med. 2017;31:894‐900. [DOI] [PMC free article] [PubMed] [Google Scholar]
- 4. Bone RC, Balk RA, Cerra FB, et al. Definitions for sepsis and organ failure and guidelines for the use of innovative therapies in sepsis. The ACCP/SCCM consensus conference Committee. American College of Chest Physicians/Society of Critical Care Medicine. Chest. 1992;101:1644‐1655. [DOI] [PubMed] [Google Scholar]
- 5. Werners AH, Bull S, Fink‐Gremmels J. Endotoxaemia: a review with implications for the horse. Equine Vet J. 2005;37:371‐383. [DOI] [PubMed] [Google Scholar]
- 6. Castagnetti C, Mariella J, Pirrone A, Cinotti S, Mari G, Peli A. Expression of interleukin‐1beta, interleukin‐8, and interferon‐gamma in blood samples obtained from healthy and sick neonatal foals. Am J Vet Res. 2012;73:1418‐1427. [DOI] [PubMed] [Google Scholar]
- 7. Pusterla N, Magdesian KG, Mapes S, Leutenegger CM. Expression of molecular markers in blood of neonatal foals with sepsis. Am J Vet Res. 2006;67:1045‐1049. [DOI] [PubMed] [Google Scholar]
- 8. Fratto MA, Hart KA, Norton NA, Barton MH, Giguère S, Hurley DJ. The effect of free and carrier‐bound cortisol on equine neutrophil function. Vet Immunol Immunopathol. 2017;183:16‐21. [DOI] [PubMed] [Google Scholar]
- 9. Borba LA, Nogueira CEW, Bruhn FRP, et al. Peripheral blood markers of sepsis in foals born from mares with experimentally induced ascending placentitis. Vet Rec. 2020;187:29. [DOI] [PubMed] [Google Scholar]
- 10. Anderson MJ, Ibrahim AS, Cooper BR, Woolcock AD, Moore GE, Taylor SD. Effects of administration of ascorbic acid and low‐dose hydrocortisone after infusion of sublethal doses of lipopolysaccharide to horses. J Vet Intern Med. 2020;34:2710‐2718. [DOI] [PMC free article] [PubMed] [Google Scholar]
- 11. Barton MH, Bruce EH, Moore JN, Norton N, Anders B, Morris DD. Effect of tumor necrosis factor antibody given to horses during early experimentally induced endotoxemia. Am J Vet Res. 1998;59:792‐797. [PubMed] [Google Scholar]
- 12. Jacobs CC, Holcombe SJ, Cook VL, Gandy JC, Hauptman JG, Sordillo LM. Ethyl pyruvate diminishes the inflammatory response to lipopolysaccharide infusion in horses. Equine Vet J. 2012;45:333‐339. [DOI] [PubMed] [Google Scholar]
- 13. Nieto JE, MacDonald MH, Braim AE, et al. Effect of lipopolysaccharide infusion on gene expression of inflammatory cytokines in normal horses in vivo. Equine Vet J. 2009;41:717‐719. [DOI] [PubMed] [Google Scholar]
- 14. MacKay RJ, Lester GD. Induction of the acute‐phase cytokine, hepatocyte‐stimulating factor/interleukin 6, in the circulation of horses treated with endotoxin. Am J Vet Res. 1992;53:1285‐1289. [PubMed] [Google Scholar]
- 15. Spaggiari GM, Capobianco A, Abdelrazik H, Becchetti F, Mingari MC, Moretta L. Mesenchymal stem cells inhibit natural killer‐cell proliferation, cytotoxicity, and cytokine production: role of indoleamine 2,3‐dioxygenase and prostaglandin E2. Blood. 2008;111:1327‐1333. [DOI] [PubMed] [Google Scholar]
- 16. Vidal MA, Kilroy GE, Lopez MJ, et al. Characterization of equine adipose tissue‐derived stromal cells: adipogenic and osteogenic capacity and comparison with bone marrow‐derived mesenchymal stromal cells. Vet Surg. 2007;36:613‐622. [DOI] [PubMed] [Google Scholar]
- 17. De Schauwer C, Goossens K, Piepers S, et al. Characterization and profiling of immunomodulatory genes of equine mesenchymal stromal cells from non‐invasive sources. Stem Cell Res Ther. 2014;5:6. [DOI] [PMC free article] [PubMed] [Google Scholar]
- 18. Carrade DD, Lame MW, Kent MS, Clark KC, Walker NJ, Borjesson DL. Comparative analysis of the immunomodulatory properties of equine adult‐derived mesenchymal stem cells. Cell Med. 2012;4:1‐11. [DOI] [PMC free article] [PubMed] [Google Scholar]
- 19. Broeckx S, Borena BM, Zimmerman M, et al. Intravenous application of allogenic peripheral blood‐derived mesenchymal stem cells: a safety assessment in 291 equine recipients. Curr Stem Cell Res Ther. 2014;9:452‐457. [DOI] [PubMed] [Google Scholar]
- 20. Kern S, Eichler H, Stoeve J, Klüter H, Bieback K. Comparative analysis of mesenchymal stem cells from bone marrow, umbilical cord blood, or adipose tissue. Stem Cells. 2006;24:1294‐1301. [DOI] [PubMed] [Google Scholar]
- 21. Shin S, Kim Y, Jeong S, et al. The therapeutic effect of human adult stem cells derived from adipose tissue in endotoxemic rat model. Int J Med Sci. 2013;10:8‐18. [DOI] [PMC free article] [PubMed] [Google Scholar]
- 22. Zhang S, Danchuk SD, Imhof KM, et al. Comparison of the therapeutic effects of human and mouse adipose‐derived stem cells in a murine model of lipopolysaccharide‐induced acute lung injury. Stem Cell Res Ther. 2013;4:13. [DOI] [PMC free article] [PubMed] [Google Scholar]
- 23. Bosmann M, Meta F, Ruemmler R, et al. Regulation of IL‐17 family members by adrenal hormones during experimental sepsis in mice. Am J Pathol. 2013;182:1124‐1130. [DOI] [PMC free article] [PubMed] [Google Scholar]
- 24. Lanzoni G, Linetsky E, Correa D, et al. Umbilical cord mesenchymal stem cells for COVID‐19 acute respiratory distress syndrome: a double‐blind, phase 1/2a, randomized controlled trial. Stem Cells Transl Med. 2021;10:660‐673. [DOI] [PMC free article] [PubMed] [Google Scholar]
- 25. Lin CS, Lin G, Lue TF. Allogeneic and xenogeneic transplantation of adipose‐derived stem cells in immunocompetent recipients without immunosuppressants. Stem Cells Dev. 2012;21:2770‐2778. [DOI] [PMC free article] [PubMed] [Google Scholar]
- 26. Le Blanc K, Samuelsson H, Gustafsson B, et al. Transplantation of mesenchymal stem cells to enhance engraftment of hematopoietic stem cells. Leukemia. 2007;21:1733‐1738. [DOI] [PubMed] [Google Scholar]
- 27. Wang M, Yang Y, Yang D, et al. The immunomodulatory activity of human umbilical cord blood‐derived mesenchymal stem cells in vitro. Immunology. 2009;126:220‐232. [DOI] [PMC free article] [PubMed] [Google Scholar]
- 28. Kilcoyne I, Nieto JE, Watson JL, Galuppo LD, Borjesson DL. Do allogeneic bone marrow derived mesenchymal stem cells diminish the inflammatory response to lipopolysaccharide infusion in horses? A pilot study. Vet Immunol Immunopathol. 2021;231:110146. [DOI] [PubMed] [Google Scholar]
- 29. Williams LB, Co C, Koenig JB, Tse C, Lindsay E, Koch TG. Response to intravenous allogeneic equine cord blood‐derived mesenchymal stromal cells administered from chilled or frozen state in serum and protein‐free media. Front Vet Sci. 2016;3:56. [DOI] [PMC free article] [PubMed] [Google Scholar]
- 30. Mund SJK, Kawamura E, Awang‐Junaidi AH, et al. Homing and engraftment of intravenously administered equine cord blood‐derived multipotent mesenchymal stromal cells to surgically created cutaneous wound in horses: a pilot project. Cell. 2020;9:1162. [DOI] [PMC free article] [PubMed] [Google Scholar]
- 31. Martinello T, Bronzini I, Maccatrozzo L, et al. Cryopreservation does not affect the stem characteristics of multipotent cells isolated from equine peripheral blood. Tissue Eng Part C Methods. 2010;16:771‐781. [DOI] [PubMed] [Google Scholar]
- 32. Spaas JH, De Schauwer C, Cornillie P, et al. Culture and characterisation of equine peripheral blood mesenchymal stromal cells. Vet J. 2013;195:107‐113. [DOI] [PubMed] [Google Scholar]
- 33. Pritchett LC, Ulibarri C, Roberts MC, Schneider RK, Sellon DC. Identification of potential physiological and behavioral indicators of postoperative pain in horses after exploratory celiotomy for colic. Appl Anim Behav Sci. 2003;80:31‐43. [Google Scholar]
- 34. De Schauwer C, Meyer E, Cornillie P, et al. Optimization of the isolation, culture, and characterization of equine umbilical cord blood mesenchymal stromal cells. Tissue Eng Part C Methods. 2011;17:1061‐1070. [DOI] [PubMed] [Google Scholar]
- 35. Renzi S, Ricco S, Dotti S, et al. Autologous bone marrow mesenchymal stromal cells for regeneration of injured equine ligaments and tendons: a clinical report. Res Vet Sci. 2013;95:272‐277. [DOI] [PubMed] [Google Scholar]
- 36. Bonelli F, Meucci V, Divers TJ, Wagner B, Intorre L, Sgorbini M. Kinetics of plasma procalcitonin, soluble CD14, CCL2 and IL‐10 after a sublethal infusion of lipopolysaccharide in horses. Vet Immunol Immunopathol. 2017;184:29‐35. [DOI] [PubMed] [Google Scholar]
- 37. Schwartz D, Pusterla N, Jacobsen S, Christopher MM. Analytical validation of a new point‐of‐care assay for serum amyloid a in horses. Equine Vet J. 2018;50:678‐683. [DOI] [PubMed] [Google Scholar]
- 38. Page AE, Adam E, Arthur R, et al. Expression of select mRNA in thoroughbreds with catastrophic racing injuries. Equine Vet J. 2021;54:63‐73. [DOI] [PubMed] [Google Scholar]
- 39. Livak KJ, Schmittgen TD. Analysis of relative gene expression data using real‐time quantitative PCR and the 2(‐Delta Delta C[T]) method. Methods. 2001;25:402‐408. [DOI] [PubMed] [Google Scholar]
- 40. Breathnach CC, Sturgill‐Wright T, Stiltner JL, Adams AA, Lunn DP, Horohov DW. Foals are interferon gamma‐deficient at birth. Vet Immunol Immunopathol. 2006;112:199‐209. [DOI] [PubMed] [Google Scholar]
- 41. Page AE, Stewart JC, Holland RE, et al. The impact of training regimen on the inflammatory response to exercise in 2‐year‐old thoroughbreds. J Equine Vet. 2017;58:78‐83. [Google Scholar]
- 42. Shono S, Gin A, Minowa F, Okubo K, Mochizuki M. The oxidative stress markers of horses‐the comparison with other animals and the influence of exercise and disease. Animals (Basel). 2020;10:617. [DOI] [PMC free article] [PubMed] [Google Scholar]
- 43. Sgorbini M, Bonelli F, Marmorini P, et al. Maternal and neonatal evaluation of derivated reactive oxygen metabolites (d‐ROMs) and biological antioxidant potential in the horse. Theriogenology. 2015;83:48‐51. [DOI] [PubMed] [Google Scholar]
- 44. Celi P, Sullivan M, Evans D. The stability of the reactive oxygen metabolites (d‐ROMs) and biological antioxidant potential (BAP) tests on stored horse blood. Vet J. 2010;183:217‐218. [DOI] [PubMed] [Google Scholar]
- 45. Amer J, Goldfarb A, Fibach E. Flow cytometric measurement of reactive oxygen species production by normal and thalassaemic red blood cells. Eur J Haematol. 2003;70:84‐90. [DOI] [PubMed] [Google Scholar]
- 46. Serpa PBS, Woolcock A, Taylor SD, Pires dos Santos A. Validation of a flow cytometric assay to detect intraerythrocytic reactive oxygen species in horses. Vet Clin Pathol. 2021;50:20‐27. [DOI] [PubMed] [Google Scholar]
- 47. Lilliehook I, Tvedten HW, Brojer J, et al. Time‐related changes in equine neutrophils after experimental endotoxemia: myeloperoxidase staining, size, and numbers. Vet Clin Pathol. 2016;45:66‐72. [DOI] [PubMed] [Google Scholar]
- 48. Cuerquis J, Romieu‐Mourez R, Francois M, et al. Human mesenchymal stromal cells transiently increase cytokine production by activated T cells before suppressing T‐cell proliferation: effect of interferon‐gamma and tumor necrosis factor‐alpha stimulation. Cytotherapy. 2014;16:191‐202. [DOI] [PubMed] [Google Scholar]
- 49. Barrachina L, Remacha AR, Romero A, et al. Priming equine Bone marrow‐derived mesenchymal stem cells with proinflammatory cytokines: implications in immunomodulation‐immunogenicity balance, cell viability, and differentiation potential. Stem Cells Dev. 2017;26:15‐24. [DOI] [PubMed] [Google Scholar]
- 50. Barrachina L, Remacha AR, Romero A, et al. Effect of inflammatory environment on equine bone marrow derived mesenchymal stem cells immunogenicity and immunomodulatory properties. Vet Immunol Immunopathol. 2016;171:57‐65. [DOI] [PubMed] [Google Scholar]
- 51. Kelmer G, Doherty TJ, Elliott S, et al. Evaluation of dimethyl sulphoxide effects on initial response to endotoxin in the horse. Equine Vet J. 2008;40:358‐363. [DOI] [PubMed] [Google Scholar]
- 52. Burrows GE. The effects of repeated administration of Escherichia coli lipopolysaccharides to ponies. Can J Comp Med. 1979;43:321‐327. [PMC free article] [PubMed] [Google Scholar]
- 53. Ward DS, Fessler JF, Bottoms GD, Turek J. Equine endotoxemia: cardiovascular, eicosanoid, hematologic, blood chemical, and plasma enzyme alterations. Am J Vet Res. 1987;48:1150‐1156. [PubMed] [Google Scholar]
- 54. Eggenhofer E, Benseler V, Kroemer A, et al. Mesenchymal stem cells are short‐lived and do not migrate beyond the lungs after intravenous infusion. Front Immunol. 2012;3:297. [DOI] [PMC free article] [PubMed] [Google Scholar]
- 55. Eggenhofer E, Luk F, Dahlke MH, Hoogduijn MJ. The life and fate of mesenchymal stem cells. Front Immunol. 2014;5:148. [DOI] [PMC free article] [PubMed] [Google Scholar]
- 56. Ge J, Guo L, Wang S, et al. The size of mesenchymal stem cells is a significant cause of vascular obstructions and stroke. Stem Cell Rev Rep. 2014;10:295‐303. [DOI] [PubMed] [Google Scholar]
- 57. Gao J, Dennis JE, Muzic RF, Lundberg M, Caplan AI. The dynamic in vivo distribution of bone marrow‐derived mesenchymal stem cells after infusion. Cells Tissues Organs. 2001;169:12‐20. [DOI] [PubMed] [Google Scholar]
- 58. Zheng B, von See MP, Yu E, et al. Quantitative magnetic particle imaging monitors the transplantation, biodistribution, and clearance of stem cells in vivo. Theranostics. 2016;6:291‐301. [DOI] [PMC free article] [PubMed] [Google Scholar]
- 59. Furlani D, Ugurlucan M, Ong L, et al. Is the intravascular administration of mesenchymal stem cells safe? Mesenchymal stem cells and intravital microscopy. Microvasc Res. 2009;77:370‐376. [DOI] [PubMed] [Google Scholar]
- 60. Barbash IM, Chouraqui P, Baron J, et al. Systemic delivery of bone marrow‐derived mesenchymal stem cells to the infarcted myocardium: feasibility, cell migration, and body distribution. Circulation. 2003;108:863‐868. [DOI] [PubMed] [Google Scholar]
- 61. Vulliet PR, Greeley M, Halloran SM, MacDonald KA, Kittleson MD. Intra‐coronary arterial injection of mesenchymal stromal cells and microinfarction in dogs. Lancet. 2004;363:783‐784. [DOI] [PubMed] [Google Scholar]
- 62. Walczak P, Zhang J, Gilad AA, et al. Dual‐modality monitoring of targeted intraarterial delivery of mesenchymal stem cells after transient ischemia. Stroke. 2008;39:1569‐1574. [DOI] [PMC free article] [PubMed] [Google Scholar]
- 63. Quimby JM, Webb TL, Habenicht LM, Dow SW. Safety and efficacy of intravenous infusion of allogeneic cryopreserved mesenchymal stem cells for treatment of chronic kidney disease in cats: results of three sequential pilot studies. Stem Cell Res Ther. 2013;4:48. [DOI] [PMC free article] [PubMed] [Google Scholar]
- 64. Chen Y, Yu B, Xue G, et al. Effects of storage solutions on the viability of human umbilical cord mesenchymal stem cells for transplantation. Cell Transplant. 2013;22:1075‐1086. [DOI] [PubMed] [Google Scholar]
- 65. Wei Z, Batagov AO, Carter DR, et al. Fetal bovine serum RNA interferes with the cell culture derived extracellular RNA. Sci Rep. 2016;6:31175. [DOI] [PMC free article] [PubMed] [Google Scholar]