

Abstract
In this study, highly fluorescent sulfur and nitrogen doped carbon quantum dots (S,N-CQDs) were used as fluorescent nanosensors for direct spectrofluorimetric estimation of each of gliclazide (GLZ) and saxagliptin (SXG) without any pre-derivatization steps for the first time. S,N-CQDs were synthesized employing a simple hydrothermal technique using citric acid and thiosemicarbazide. The produced S,N-CQDs were characterized using different techniques including fluorescence emission spectroscopy, UV spectrophotometry, high-resolution transmission electron microscopy and FT-IR spectroscopy. Following excitation at 360 nm, S,N-CQDs exhibited a strong emission peak at 430 nm. The native fluorescence of S,N-CQDs was quantitatively enhanced by addition of increased concentrations of the studied drugs. The fluorescence enhancement of S,N-CQDs and the concentrations of the studied drugs revealed a wide linear relationship in the range of 30.0–500.0 µM and 75.0–600.0 µM with limits of detection of 5.0 and 10.15 µM for GLZ and SXG, respectively. The proposed method was efficiently used for determination of cited drugs in their commercial tablets with % recoveries ranging from 98.6% to 101.2% and low % relative standard deviation values (less than 2%). The mechanism of interaction between S,N-CQDs and the two drugs was studied. Validation of the proposed method was carried out in accordance with International Conference on Harmonization (ICH) guidelines.
Keywords: gliclazide, saxagliptin, sulfur and nitrogen–carbon quantum dots, fluorescent nanosensors, tablets
1. Introduction
Gliclazide (GLZ) (N-[[(hexahydrocylopenta[c]pyrrol-2(1H)-yl)amino]carbony]-4-methylbenzene sulfonamide) (figure 1a) is a second generation sulfonylurea used for the control of type 2 diabetes mellitus (DM) by increasing insulin amount secreted by the pancreatic cells [1]. Previous reports showed that GLZ slows down the progression of diabetic retinopathy. It also has low incidence of hypoglycaemia and good tolerability. Consequently, it is considered as the drug of choice for long-term management of non-insulin-dependent DM patients [1,2].
Figure 1.

Structural formulae of GLZ (a) and SXG (b).
Saxagliptin (SXG) ((1S,3S,5S)-2-[(2S)-2-amino-2-(3-hydroxy-1-adamantyl)acetyl]-2-azabicyclo[3.1.0]hexane-3-carbonitrile) [3] (figure 1b) is an oral dipeptidylpeptidase-4 inhibitor (DPP-4) which is considered as a novel therapeutic strategy for type 2 DM. It prevents the inactivation of incretins and also stimulates the glucose dependent insulin release [4].
Different methods for estimating GLZ in dosage forms have been reported. These methods include high performance liquid chromatography (HPLC) [5–7], spectrophotometry [2,8–12] and spectrofluorimetry [13–15]. Similarly, SXG was determined using HPLC [16–18], spectrophotometric [19–24] and spectrofluourimetric [20,22,25] methods. The reported spectrofluorimetric methods for GLZ [13–15] and SXG [20,22,25] required prior chemical derivatization reactions using specific reagents; which in turn renders them time consuming and tedious, with a decrease of their greenness profiles. Whereas, in the current study, a green, rapid and simple spectrofluorimetric method was developed for direct estimation of both GLZ and SXG without the need for pre-derivatization steps for the first time. The proposed approach is based on the quantitative enhancement of the sulfur and nitrogen doped carbon quantum dots (S,N-CQDs) native fluorescence upon increasing the concentrations of the studied drugs.
Carbon quantum dots (CDs) are considered as a novel type of fluorescence nanomaterials that range in size from 2.0 to 10.0 nm. They are biocompatible, non-toxic, easily synthesized from cheap starting materials and chemically stable with good photoluminescence properties. Furthermore, they can be easily functionalized using a variety of species and they are highly water soluble [26–29]. For preparation of fluorescent CDs, various approaches have been reported like chemical oxidation [30], microwave-assisted [31], carbonizing organic methods [32] and hydrothermal synthesis [33]. Synthesis of doped CDs is usually carried out by inserting heteroatoms (such as nitrogen (N), phosphorus (P), sulfur (S), fluorine (F), boron (B)) into the CDs' general structure to enhance their photoluminescence properties [26,34–36]. From literature, CDs were efficiently applied as sensitive probes for the determination of many pharmaceutical compounds in different matrices [26,37,38].
In the present study, a green, simple and economic method was adopted for preparation of S,N-CQDs applying a hydrothermal synthetic approach using thiosemicarbazide (TS) as nitrogen and sulfur source and citric acid (CA) as carbon source producing fluorescence probes for the estimation of each of GLZ and SXG [26].
2. Experimental
2.1. Materials and reagents
GLZ and SXG were obtained from National Organization of Drug Control and Research Center (NODCAR), Cairo, Egypt. Diamicron Tablets (30 mg GLZ/tablet, batch no. (10)29309, Servier Pharmaceutical Co., Cairo, Egypt) and Formigliptin Tablets (5 mg SXG/tablet, batch no. 001087, Multicare Pharmaceutical Co., Cairo, Egypt) were obtained from a local pharmacy in the Egyptian market. CA, TS, sodium acetate, boric acid, glacial acetic acid, methanol and sodium hydroxide were obtained from Sigma Aldrich (St Louis, MO, USA). Analytical grade chemicals and reagents were used. Double distilled water was used during the study.
Different buffers including borate and acetate buffers (0.2 M) were prepared according to the United States Pharmacopeia (USP) [39].
2.2. Instruments and software
UV-1601 PC spectrophotometer was used to carry out UV spectrophotometric measurements (Shimadzu, Kyoto, Japan) using a 1 cm quartz cell. Agilent Technologies' Cary Eclipse fluorescence spectrophotometer was used for fluorescence measurements (Santa Clara, USA). The slit width was adjusted to 5 nm and the instrument was set to 750 V mode. Thermo-Fisher Scientific Nicolet—iS10 FT-IR spectrometer was used to obtain the FT-IR spectra (Waltham, MA, USA). It had a 4000–1000 cm−1 deuterated triglycine sulfate (DTGS) detector and a Ge/KBr beam splitter. The measurements were taken in 32 scans with a resolution of 4 cm−1. A JEM-2100 high-resolution transmission electron microscope (HRTEM) (JEOL, Tokyo) working at 200 kV was used to investigate morphology of S,N-CQDs. pH-meter (Consort, NVP- 901, Belgium) was also used.
2.3. Standard stock solutions
GLZ and SXG are relatively insoluble in water so their standard stock solutions (1.0 mM) were prepared in methanol and different concentrations were obtained by serial dilution with double distilled water as appropriate. The prepared solutions were stable for about 10 days when stored at 4°C.
2.4. Synthesis of S,N-CQDs
Synthesis of S,N-CQDs was performed by applying a hydrothermal methodology that was recently reported by Magdy et al. [26]. S,N-CQDs were prepared through mixing of 0.52 g CA and 0.68 g TS with 20 ml of double distilled water, and ultrasonication was carried out for 20 min. The mixture was refluxed at 160°C for 12 h until highly fluorescent S,N-CQDs (dark orange colour) were formed, then cooled and kept in the refrigerator for further use.
2.5. Fluorescence emission spectroscopy
For GLZ, serial concentrations (0, 30.0, 40.0, 50.0, 100.0, 150.0, 200.0, 300.0, 400.0, 500.0 µM) were mixed with 100 µl of S,N-CQDs at pH 7 using 1 ml of borate buffer, and the mixture was heated at 40°C for 10 min. While for SXG, serial concentrations (0, 75.0, 100.0, 150.0, 200.0, 300.0, 400.0, 500.0, 600.0 µM) were added to 150 µl of S,N-CQDs at pH 11 using 1 ml of borate buffer at 25°C for 10 min. Measurement of the fluorescence intensities for both compounds was carried out at 430 nm following excitation at 360 nm. Calibration curves were constructed by graphing each of GLZ and SXG concentrations (in µM) against the difference in fluorescence intensities, then the corresponding regression equations were generated.
2.6. Quantum yield measurements
The following equation [40,41] was used to calculate the quantum yield of S,N-CQDs:
where Φ is the quantum yield, F represents the integrated measured emission intensity, η is the solvent refractive index and A is the absorbance.
The standard used was quinine sulfate (QS). It was dissolved in 0.1 M H2SO4 (QY: 0.54 at 350 nm). In the aqueous solutions ηS,N-CQDs/ηst equals to 1.
2.7. Analysis of GLZ and SXG in their tablets
Ten tablets of each of Diamicron or Formigliptin were separately weighed and homogeneously ground. An accurately weighed quantity of the powder corresponding to 30 mg of GLZ or 5 mg of SXG was transferred into a measuring flask (100 ml), followed by addition of 40 ml of methanol. Sonication for 20 min, dilution with methanol to the mark then filtration were performed. Suitable aliquots were transferred from the filtrate into 10 ml measuring flasks, and then the procedure described in §2.5 was performed. The nominal content of tablets was calculated using the corresponding regression equation.
3. Results and discussion
3.1. Characterization of S,N-CQDs
A facile approach was applied in this study to prepare highly fluorescent S,N-CQDs. The adopted approach is based on the hydrothermal treatment of TS as nitrogen and sulfur source and CA as a carbon source [26]. Under UV light, the S,N-CQDs solution exhibited strong blue fluorescence with a long-lasting homogeneous phase and no apparent precipitation for around 14 days in the refrigerator. Spectrofluorimetry, UV absorption spectroscopy, FT-IR and HRTEM were used to characterize S,N-CQDs.
Figure 2A shows the UV absorption spectra of S,N-CQDs, CA and TS. S,N-CQDs had a clear UV absorption band at a maximum wavelength of 330 nm [26,42,43]. Figure 2B also shows the S,N-CQDs fluorescence emission and excitation spectra in aqueous solution. The optimum excitation and emission wavelengths were found to be 360 and 430 nm, respectively. When the excitation wavelength was changed from 340 to 380 nm, the fluorescence spectra of S,N-CQDs shift, and the highest fluorescence intensity was found at 360 nm (figure 2C).
Figure 2.

(A) UV absorption spectra of citric acid (a), thiosemcarbazide (b) and S,N-CQDs (c); (B) fluorescence excitation and emission spectra of S,N-CQDs; (C) fluorescence spectra of S,N-CQDs at different excitation wavelengths.
The size and surface morphological characteristics of S,N-CQDs were studied by HRTEM. The samples were placed onto carbon-coated Cu-grid (200 mesh) and investigated using HRTEM at a voltage of 200 kV. As presented in figure 3a, S,N-CQDs are spherical in shape and range in size from 8 to 20 nm.
Figure 3.

(a) The typical HRTEM images of S,N-CQDs; (b) FT-IR spectra of N,S-CQDs.
To study the main surface functional groups of S,N-CQDs, FT-IR analysis was used. As shown in figure 3b, several distinct vibrational modes were observed. The stretching modes of O–H/N–H groups are represented by broad bands at 3500–3100 cm−1. C–N vibration is responsible for the band at 2065 cm−1. At 1700 cm–1, the C=O of the carboxylic acid group is displayed. C=S and C=C are responsible for the stretching maxima of 1233 and 1621 cm−1, respectively. A vibration peak was also observed at 578 cm−1 for C–H bond [26,44,45].
The quantum yield of S,N-CQDs was also studied as mentioned in §2.6, and they showed a high quantum yield (58.5%) using QS as a reference.
3.2. Interaction mechanism between S,N-CQD and GLZ or SXG
S,N-CQDs emission fluorescence spectra in the presence of various GLZ and SXG concentrations are shown in figures 4 and 5, respectively. By increasing the concentrations of the studied drugs, S,N-CQDs fluorescence intensity was quantitatively enhanced. The native fluorescence of S,N-CQDs was enhanced by 37% and 70% by addition of GLZ (500.0 µM) and SXG (600.0 µM), respectively. The fluorescence enhancement may be attributed to the interaction of each of GLZ and SXG with S,N-CQDs. However, GLZ and SXG cannot form any aggregates with S,N-CQDs, otherwise, the interaction of GLZ or SXG with S,N-CQDs would lead to decrease of surface defects [46–48]. Moreover, the enhancement of fluorescence intensities may be due to saturation of the dangling bonds at the surface of QDs which effectively removes the QDs surface defects. Due to efficient blocking of non-radiative electron/hole recombination on the surface of QDs, the removal of local trap positions leads to formation of more radiative centres. It seems that the increasing concentrations of GLZ and SXG in the solution get attached to the QDs surface and thereby correct the defective energy levels. This removal of defect levels improves the exciton emissions and subsequently enhances the fluorescence emission intensities of the QDs [46–48].
Figure 4.

Fluorescence emission spectra of S,N-CQDs in aqueous solution upon addition of various concentrations of GLZ (from bottom to top: 0, 30.0, 40.0, 100.0, 150.0, 200.0, 300.0, 400.0, 500.0 µM).
Figure 5.
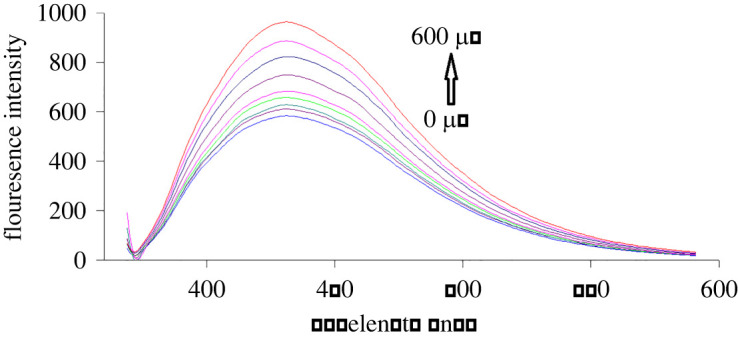
Fluorescence emission spectra of S,N-CQDs in aqueous solution upon addition of various concentrations of SXG (from bottom to top: 0, 75.0, 100.0, 150.0, 200.0, 300.0, 400.0, 500.0, 600.0 µM).
3.3. Inner filter effect of GLZ and SXG
The inner filter effect of the studied drugs was carefully studied to confirm that the enhancement of the fluorescence intensity of S,N-CQDs is due to the interaction between QDs and drugs and not due to the native fluorescence of the studied drugs. It was found that 500.0 µM of GLZ and 600.0 µM of SXG (the maximum concentrations in this study) have neither native fluorescence at 430 nm after excitation at 360 nm nor absorbance at 360 nm, indicating that, there was no inner filter effect of either GLZ or SXG (figure 6).
Figure 6.

(A) A co-plot showing that there is no overlap between fluorescence excitation spectrum of the S,N-CQDs (a) and the UV–Vis absorption spectrum of the GLZ (500.0 µM) (b); (B) A co-plot showing that there is no overlap between fluorescence excitation spectrum of the S,N-CQDs (a) and the UV–Vis absorption spectrum of the SXG (600.0 µM) (c).
3.4. Optimization of factors affecting interaction of GLZ and SXG with S,N-CQDs
To achieve the maximum sensitivity of the method for GLZ and SXG determination, different factors influencing the fluorescence intensities were studied; including pH of the medium, incubation time and temperature.
3.4.1. Effect of pH
To investigate the impact of pH, the experiments were carried out over pH range from 3.5 to 12 using acetate and borate buffers. It was found that the maximum S,N-CQDs emission intensities were achieved at pH 7 and 11 for GLZ and SXG, respectively (figure 7A). Accordingly, the volume of borate buffer was examined from 0.5 to 4 ml, and it was found that the optimum volume is 1 ml for both drugs.
Figure 7.

Effect of pH (A), incubation time (B) and temperature (C) on the enhancement of the fluorescence intensity of S,N-CQDs by GLZ (300.0 µM) (a), SXG (200.0 µM) (b).
3.4.2. Incubation time
The incubation time of S,N-CQDs with the investigated drugs was studied by recording the emission fluorescence spectra at time intervals ranging from 1 min to 1 h. The obtained outcomes displayed a fast increasing response after mixing the cited drugs and QDs that reached a constant value after 10 min. The fluorescence signals remained stable for 1 h, giving the suggested method an additional advantage (figure 7B).
3.4.3. Effect of temperature
Over a temperature range of 20–60°C, the influence of temperature on signal enhancing effect of GLZ and SXG was studied. The obtained results demonstrated that the maximum response was achieved at 40°C and 25°C for GLZ and SXG, respectively (figure 7C).
3.5. Method validation
The developed method was validated according to ICHQ2(R1) guidelines [49].
3.5.1. Linearity and range
The calibration plots were constructed by graphing the concentrations of each drug (μM) versus the difference in fluorescence intensity (ΔF = F − F0). The linear range was found to be 30.0–500.0 µM and 75.0–600.0 µM for GLZ and SXG, respectively. The regression equations that represent rectilinear relationship are as follows:
| 3.1 |
and
| 3.2 |
where F0 and F are the QDs fluorescence intensities in absence and presence of cited drugs, respectively, C is the concentration in μM. Values of correlation coefficients (r) approximating unity indicate the acceptable linearity of the developed procedure (table 1).
Table 1.
Analytical performance data for the proposed method.
| parameter | GLZ | SXG |
|---|---|---|
| linearity range (µM) | 30.0–500.0 | 75.0–600.0 |
| limit of detection (LOD)a (µM) | 5.0 | 10.16 |
| limit of quantitation (LOQ)b (µM) | 15.17 | 30.78 |
| regression equation | F − F0 = 0.37C + 20.83 | F − F0 = 0.67C + 28.90 |
| correlation coefficient (r) | 0.9999 | 0.9998 |
| standard deviation (s.d.) | 1.01 | 1.87 |
| percentage relative standard deviation (% RSD) | 1.01 | 1.86 |
| Sy/x, s.d. of the residuals | 0.95 | 3.10 |
| Sa, s.d. of the intercept | 0.56 | 2.07 |
| Sb, s.d. of the slope | 0.0021 | 0.0061 |
aLOD = 3.3 Sa/b.
bLOQ = 10 Sa/b, where Sa is the standard deviation of the intercept and b is the slope.
3.5.2. LOD and LOQ
The following equations were used to calculate limit of quantitation (LOQ) and limit of detection (LOD) values:
LOD = 3.3 Sa/b, LOQ = 10 Sa/b, where Sa is the standard deviation of y-intercept, b is the slope. The obtained results are abridged in table 1.
3.5.3. Precision and accuracy
Three different concentrations of the cited drugs and three replicates of each concentration were used to test the intra-day and inter-day precisions. The obtained results showed small % relative standard deviation (RSD) values (less than 2%), indicating an acceptable precision of the developed approach (table 2). The accuracy and precision were demonstrated by statistical comparison of the obtained results with those given by comparison methods for both drugs [2,23], showing insignificant difference between them as presented by t and F values, respectively [50] (table 3).
Table 2.
Intra-day and inter-day precision data for the determination of the studied drugs by the proposed method. Each result is the average of three separate determinations.
| analyte | conc. taken (µM) | intra-daya |
inter-dayb |
||||
|---|---|---|---|---|---|---|---|
| conc. found ± s.d. (μM) | % RSD | % errorc | conc. found ± s.d. (μM) | % RSD | % errorc | ||
| GLZ | 100.0 | 101.01 ± 0.93 | 0.92 | 0.53 | 101.11 ± 1.32 | 1.31 | 0.75 |
| 200.0 | 197.69 ± 0.86 | 0.87 | 0.5 | 198.82 ± 1.51 | 1.52 | 0.88 | |
| 300.0 | 302.14 ± 0.98 | 0.97 | 0.56 | 301.21 ± 1.49 | 1.48 | 0.86 | |
| SXG | 100.0 | 101.1 ± 1.1 | 1.09 | 0.63 | 102.07 ± 1.24 | 1.22 | 0.7 |
| 200.0 | 196.09 ± 0.63 | 0.65 | 0.37 | 196.81 ± 0.7 | 0.71 | 0.41 | |
| 300.0 | 293.84 ± 0.36 | 0.37 | 0.21 | 294.3 ± 0.73 | 0.74 | 0.43 | |
aWithin the day.
bThree consecutive days.
c% Error = % RSD/√n.
Table 3.
Application of the proposed method for the determination of GLZ and SXG in pure forms.
| parameter | proposed method |
|||
|---|---|---|---|---|
| GLZ |
SXG |
|||
| conc. taken (µM) | % founda | conc. taken (µM) | % founda | |
| 30.0 | 100.21 | 75.0 | 102.94 | |
| 40.0 | 100.18 | 100.0 | 102.23 | |
| 100.0 | 100.93 | 150.0 | 102.03 | |
| 150.0 | 99.6 | 200.0 | 98.17 | |
| 200.0 | 98.15 | 300.0 | 98.36 | |
| 300.0 | 101.61 | 400.0 | 99.68 | |
| 400.0 | 99.86 | 500.0 | 99.08 | |
| 500.0 | 99.82 | 600.0 | 101.15 | |
| mean ± s.d. | 100.05 | 100.46 | ||
| 1.01 | 1.87 | |||
| % RSD | 1.011 | 1.859 | ||
| % error | 0.357 | 0.66 | ||
| comparison method |
||||
| GLZ [2] |
SXG [23] |
|||
| mean ± s.d. | 100.56 ± 2.48 | 99.18 ± 2.35 | ||
| Nc | 3.0 | 3.0 | ||
| F-value | 5.33 (19)b | 4.74 (19)b | ||
| t-value | 0.29 (2.77)b | 0.58 (2.77)b | ||
aMean of three determinations.
bThe values between parentheses are the tabulated t- and F-values at P = 0.05 [50].
cNumber of samples.
3.5.4. Robustness
The method robustness was studied by examining the influence of slight variations in experimental parameters affecting fluorescence intensity of studied drugs. The influence of incubation time (10 ± 1 min) for both drugs, pH (7 ± 0.1) for GLZ and (11 ± 0.1) for SXG, temperature (40 ± 1°C) for GLZ and (25 ± 1°C) for SXG and S,N-CQDs volume (100.0 µl ± 1) for GLZ and (150.0 µl ± 1) for SXG were investigated and showed insignificant impact on % RSD values and % recoveries (table 4).
Table 4.
Robustness evaluation of the proposed method.
| variation | % recovery | % RSD |
|---|---|---|
| GLZ | ||
| 1. Volume of N,S-CQDs (100.0 µl ± 1) | ||
| 99.0 µl | 97.97 | 1.24 |
| 100.0 µl | 98.48 | 1.29 |
| 101.0 µl | 100.43 | 1.31 |
| 2. Incubation time (10 ± 1 min) | ||
| 9 min | 101.11 | 1.09 |
| 10 min | 100.35 | 1.06 |
| 11 min | 102.46 | 1.07 |
| 3. pH (7 ± 0.1) | ||
| 6.9 | 100.89 | 1.13 |
| 7 | 100.12 | 1.07 |
| 7.1 | 100.41 | 1.11 |
| 4. Temperature (40 ± 1°C) | ||
| 39°C | 97.21 | 1.59 |
| 40°C | 100.41 | 1.68 |
| 41°C | 98.06 | 1.62 |
| SXG | ||
| 1. Volume of N,S-CQDs (150 µl ± 1) | ||
| 149 µl | 100.05 | 0.54 |
| 150 µl | 100.88 | 0.41 |
| 151 µl | 100.44 | 0.63 |
| 2. Incubation time (10 ± 1 min) | ||
| 9 min | 100.74 | 0.53 |
| 10 min | 101.78 | 0.73 |
| 11 min | 102.18 | 0.64 |
| 3. pH (11 ± 0.1) | ||
| 10.9 | 101.82 | 0.86 |
| 11 | 100.93 | 0.8 |
| 11.1 | 100.21 | 0.79 |
| 4. Temperature (25 ± 1°C) | ||
| 24°C | 99.37 | 0.73 |
| 25°C | 100.01 | 0.64 |
| 26°C | 100.64 | 0.61 |
3.5.5. Selectivity
The proposed method's selectivity was proved by its capacity to estimate the cited drugs in presence of other antidiabetic drugs including metformin, dapagliflozin, empagliflozin, canagliflozin, alogliptin, omarigliptin and glebenclamide. The tolerance limits of these drugs were calculated as the concentration that results in 2% relative error [51] and the obtained results are summarized in table 5. In addition, the method selectivity was confirmed by its capacity to analyse the drugs in their tablets with low % RSD values (less than 2%) and high % recoveries (98.64–101.21%); demonstrating no interference from common excipients (table 6).
Table 5.
Tolerance limits for other antidiabetic drugs in presence of GLZ and SXG.
| drug | tolerance limit with GLZ (µM) | tolerance limit with SXG (µM) |
|---|---|---|
| omarigliptin | 96 | 16 |
| alogliptin | 13 | 13 |
| glebenclamide | 5 | 17 |
| metformin | 15 | 10 |
| dapagliflozin | 111 | 55 |
| canagliflozin | 90 | 16 |
| empagliflozin | 50 | 23 |
Table 6.
Application of the proposed method for the determination of GLZ and SXG in tablet dosage forms.
| GLZ | ||||
|---|---|---|---|---|
| pharmaceutical preparation | proposed method |
comparison method [2] |
||
| conc. taken (µM) | % founda | conc. taken (µM) | % founda | |
| Diamicron tablets (30 mg GLZ/tab) | 30.0 | 99.19 | 30.0 | 100.55 |
| 60.0 | 100.83 | 60.0 | 98.73 | |
| 90.0 | 99.73 | 90.0 | 99.94 | |
| mean ± s.d. | 99.92 ± 0.84 | 99.74 ± 0.93 | ||
| F-value | 1.23 (19)b | |||
| t-value | 0.25 (2.77)b | |||
| SXG | ||||
| proposed method |
comparison method [23] |
|||
| pharmaceutical preparation | conc. taken (µM) | % founda | conc. taken (µM) | % founda |
| Formigliptin tablets (5 mg SXG/tab) | 75.0 | 101.21 | 75.0 | 96.72 |
| 100.0 | 98.64 | 100.0 | 102.54 | |
| 150.0 | 100.30 | 150.0 | 98.76 | |
| mean ± s.d. | 100.05 ± 1.3 | 99.34 ± 2.95 | ||
| F-value | 5.14 (19)b | |||
| t-value | 0.38 (2.77)b | |||
aMean of three determinations.
bThe values between parentheses are the tabulated t- and F-values at p = 0.05 [50].
3.6. Analysis of GLZ and SXG in their tablets
Due to the high selectivity and reproducibility of the developed method, it was efficiently used to estimate the cited drugs in their commercial tablets with low % RSD values and high % recoveries. Statistical analysis of obtained results with those given by comparison methods for GLZ and SXG [2,23], showed insignificant difference between them regarding precision and accuracy as indicated by the F- and t-values, respectively [50] (table 6).
4. Conclusion
In this study, a facile hydrothermal approach was used for synthesis of S,N-CQDs using CA and TS. The prepared S,N-CQDs were characterized using various techniques. S,N-CQDs were used as fluorescent nanosensors for estimation of each of GLZ and SXG depending on their enhancement effect on S,N-CQDs fluorescence intensities. The developed method showed good selectivity for estimation of GLZ and SXG in their tablets and in presence of other antidiabetic drugs. The proposed method is rapid, simple and cost-effective without the need for sophisticated instruments or prior derivatization of the studied drugs. Full validation of the proposed method was performed in accordance with ICH recommendations.
Data accessibility
Data available from the Dryad Digital Repository: https://doi.org/10.5061/dryad.8cz8w9gsm [52].
Authors' contributions
G.M.: conceptualization, data curation, investigation, methodology, supervision, writing—review and editing; A.A.A.: formal analysis, methodology, validation, visualization, writing—original draft; F.B.: conceptualization, investigation, resources, supervision, writing—review and editing; R.A.E.-D.: investigation, supervision, writing—review and editing; A.M.A.-M.: conceptualization, investigation, supervision, writing—review and editing.
All authors gave final approval for publication and agreed to be held accountable for the work performed therein.
Conflict of interest declaration
The authors declare that they have no competing interests.
Funding
We received no funding for this study.
References
- 1.Sweetman SC, Blake P. 2011. Martindale: the complete drug reference. 33. London, UK: Pharmaceutical Press. [Google Scholar]
- 2.Panigrahi R, Behera S, Choudhury PK, Mishra G. 2012. Development of new spectrophotometric method for the estimation of gliclazide. Int. J. Adv. Pharm. Biol. Sci. 2, 124-127. [Google Scholar]
- 3.Kim S, et al. 2016. PubChem substance and compound databases. Nucleic Acids Res. Spec. Publ. 44, D1202-D1213. ( 10.1093/nar/gkv951) [DOI] [PMC free article] [PubMed] [Google Scholar]
- 4.Augeri DJ, et al. 2005. Discovery and preclinical profile of saxagliptin (BMS-477118): a highly potent, long-acting, orally active dipeptidyl peptidase IV inhibitor for the treatment of type 2 diabetes. J. Med. Chem. 48, 5025-5037. ( 10.1021/jm050261p) [DOI] [PubMed] [Google Scholar]
- 5.Gedawy A, Al-Salami H, Dass CR. 2019. Development and validation of a new analytical HPLC method for simultaneous determination of the antidiabetic drugs, metformin and gliclazide. J. Food Drug Anal. 27, 315-322. ( 10.1016/j.jfda.2018.06.007) [DOI] [PMC free article] [PubMed] [Google Scholar]
- 6.Vijayaraj S, Palei NN, Katyayani T. 2019. Quality by design (Qbd) approach to develop HPLC method for estimation of gliclazide and its impurity (gliclazide impurity A) in bulk drug. Curr. Pharm. Anal. 15, 716-723. ( 10.2174/1573412914666180523092012) [DOI] [Google Scholar]
- 7.Shinde GS, Rahul KG, Jadhav R. 2019. Quantitative estimation and validation of metformin hydrochloride and gliclazide in their tablet dosage form by RP-HPLC. JUET Res. J. Sci. Technol. 11, 201-207. ( 10.5958/2349-2988.2019.00030.5) [DOI] [Google Scholar]
- 8.Jeha B, Salami M. 2019. Spectrophotometric determination of gliclazide in bulk and pharmaceutical formulation using 1, 2-naphthoquinone-4-sulfonic acid sodium salt. Res. J. Pharm. Technol. 12, 5310-5314. ( 10.5958/0974-360X.2019.00920.X) [DOI] [Google Scholar]
- 9.Satheesh KG, et al. 2019. Eco-friendly spectrophotometric estimation of gliclazide using hydrotropic solubilization technique. Asian J. Pharm. Anal. 9, 45-48. ( 10.5958/2231-5675.2019.00010.3) [DOI] [Google Scholar]
- 10.Hassib ST, Taha EA, Elkady EF, Barakat GH. 2019. Development and validation of spectrophotometric methods for the determination of canagliflozin or gliclazide and metformin in the presence of metformin impurity (1-cyanoguanidine). J. AOAC Int. 102, 1112-1124. ( 10.5740/jaoacint.18-0234) [DOI] [PubMed] [Google Scholar]
- 11.Marchokova N, Petkova V, Dimitrov M. 2019. UV-spectrophotometric approach in comparative studies of gliclazide modified-release tablets. Bulg. Chem. Commun. 51, 592-595. [Google Scholar]
- 12.El-Enany N. 2004. Spectrophotometric determination of gliclazide in pharmaceuticals and biological fluids through ternary complex formation with eosin and palladium (II). Farmaco 59, 63-69. ( 10.1016/j.farmac.2003.08.007) [DOI] [PubMed] [Google Scholar]
- 13.El-Enany N. 2003. Spectrofluorimetric and spectrophotometric determination of gliclazide in pharmaceuticals by derivatization with 4-chloro-7-nitrobenzo-2-oxa-1,3-diazole. J. AOAC Int. 86, 209-214. ( 10.1093/jaoac/86.2.209) [DOI] [PubMed] [Google Scholar]
- 14.Sharma VK, Mazumder B. 2014. Analytical methods for the determination of gliclazide in pharmaceutical formulations and biological fluids. World J. Pharm. Res. 3, 979-997. [Google Scholar]
- 15.Szkudlarek A, Pożycka J, Maciążek-Jurczyk M. 2019. Influence of piracetam on gliclazide—glycated human serum albumin interaction. A spectrofluorometric study. Molecules 24, 111-131. ( 10.3390/molecules24010111) [DOI] [PMC free article] [PubMed] [Google Scholar]
- 16.Godge RK, Shinde GS, Joshi S. 2019. Simultaneous estimation and validation of dapagliflozin and saxagliptin in bulk drug and dosage form by RP-HPLC. JUET Res. J. Sci. Technol. 11, 59-63. ( 10.5958/2349-2988.2019.00008.1) [DOI] [Google Scholar]
- 17.More SS, Sonawane SS, Chhajed SS, Kshirsagar SJ. 2018. Development and validation of RP-HPLC method for simultaneous estimation of saxagliptin and dapagliflozin in tablets. Asian J. Pharm. Technol. 8, 145-148. ( 10.5958/2231-5713.2018.00023.5) [DOI] [Google Scholar]
- 18.Rao BR, Rao VV, Venkateswarlu B. 2019. RP-HPLC method for simultaneous estimation of dapagliflozin and saxagliptin in bulk samples. J. Pharm. Sci. 11, 254-257. [Google Scholar]
- 19.El-Bagary RI, Elkady EF, Ayoub BM. 2012. Spectrophotometric methods based on charge transfer complexation reactions for the determination of saxagliptin in bulk and pharmaceutical preparation. Int. J. Biomed. Sci. 8, 204-208. [PMC free article] [PubMed] [Google Scholar]
- 20.Moneeb MS. 2013. Spectrophotometric and spectrofluorimetric methods for the determination of saxagliptin and vildagliptin in bulk and pharmaceutical preparations. Bull. Fac. Pharm. Cairo Univ. 51, 139-150. ( 10.1016/j.bfopcu.2013.03.003) [DOI] [Google Scholar]
- 21.Lotfy HM, Mohamed D, Elshahed MS. 2019. Novel univariate spectrophotometric determination of the recently released solid dosage form comprising dapagliflozin and saxagliptin via factorized response spectra: assessment of the average content and dosage unit uniformity of tablets. Spectrochim. Acta A: Mol. Biomol. Spectrosc. 222, 117-120. ( 10.1016/j.saa.2019.05.025) [DOI] [PubMed] [Google Scholar]
- 22.Abdel-Aziz O, Ayad MF, Tadros MM. 2015. Compatible validated spectrofluorimetric and spectrophotometric methods for determination of vildagliptin and saxagliptin by factorial design experiments. Spectrochim. Acta A: Mol. Biomol. Spectrosc. 140, 229-240. ( 10.1016/j.saa.2014.12.102) [DOI] [PubMed] [Google Scholar]
- 23.Shinde BS, Kalshetti M, Kokane AP. 2020. UV-spectrophotometric method development and validation for estimation of saxagliptin in API and pharmaceutical dosage form. Int. J. Curr. Pharm. Res. 12, 63-66. ( 10.22159/ijcpr.2020v12i5.39768) [DOI] [Google Scholar]
- 24.Bhadauria RS, Agarwal V. 2019. Development and validation of UV spectroscopic method for simultaneous estimation of dapagliflozin and saxagliptin in marketed formulation. J. Drug Deliv. Ther. 9, 1160-1164. [Google Scholar]
- 25.Barseem A, Ahmed H, El-Shabrawy Y, Belal F. 2019. The use of SDS micelles as additive to increase fluorescence analysis of sitagliptin and saxagliptin derivatives in their tablets and human plasma. Microchem. J. 146, 20-24. ( 10.1016/j.microc.2018.12.054) [DOI] [Google Scholar]
- 26.Magdy G, Hakiem AFA, Belal F, Abdel-Megied AM. 2021. Green one-pot synthesis of nitrogen and sulfur co-doped carbon quantum dots as new fluorescent nanosensors for determination of salinomycin and maduramicin in food samples. Food Chem. 343, 128539. ( 10.1016/j.foodchem.2020.128539) [DOI] [PubMed] [Google Scholar]
- 27.Yuan F, Li S, Fan Z, Meng X, Fan L, Yang S. 2016. Shining carbon dots: synthesis and biomedical and optoelectronic applications. Nano Today 11, 565-586. ( 10.1016/j.nantod.2016.08.006) [DOI] [Google Scholar]
- 28.Molaei MJ. 2019. Carbon quantum dots and their biomedical and therapeutic applications: a review. RSC Adv. 9, 6460-6481. ( 10.1039/C8RA08088G) [DOI] [PMC free article] [PubMed] [Google Scholar]
- 29.Molaei MJ. 2020. Principles, mechanisms, and application of carbon quantum dots in sensors: a review. Anal. Methods 12, 1266-1287. ( 10.1039/C9AY02696G) [DOI] [Google Scholar]
- 30.Li Y, Hu Y, Zhao Y, Shi G, Deng L, Hou Y, Qu L. 2011. An electrochemical avenue to green-luminescent graphene quantum dots as potential electron-acceptors for photovoltaics. Adv. Mater. 23, 776-780. ( 10.1002/adma.201003819) [DOI] [PubMed] [Google Scholar]
- 31.Li L, Yu B, You T. 2015. Nitrogen and sulfur co-doped carbon dots for highly selective and sensitive detection of Hg (II) ions. Biosens. Bioelectron. 74, 263-269. ( 10.1016/j.bios.2015.06.050) [DOI] [PubMed] [Google Scholar]
- 32.Tang L, et al. 2012. Deep ultraviolet photoluminescence of water-soluble self-passivated graphene quantum dots. ACS Nano 6, 5102-5110. ( 10.1021/nn300760g) [DOI] [PubMed] [Google Scholar]
- 33.Xue M, Zhang L, Zou M, Lan C, Zhan Z, Zhao S. 2015. Nitrogen and sulfur co-doped carbon dots: a facile and green fluorescence probe for free chlorine. Sens. Actuators B Chem. 219, 50-56. ( 10.1016/j.snb.2015.05.021) [DOI] [Google Scholar]
- 34.Li F, Yang D, Xu H. 2019. Non-metal-heteroatom-doped carbon dots: synthesis and properties. Chem. Eur. J. 25, 1165-1176. ( 10.1002/chem.201802793) [DOI] [PubMed] [Google Scholar]
- 35.Atabaev TS. 2018. Doped carbon dots for sensing and bioimaging applications: a minireview. Nanomaterials 8, 342-351. ( 10.3390/nano8050342) [DOI] [PMC free article] [PubMed] [Google Scholar]
- 36.El-Maghrabey M, El-Shaheny R, Belal F, Kishikawa N, Kuroda N. 2020. Green sensors for environmental contaminants. In Nanosensor technologies for environmental monitoring, pp. 491-516. Berlin, Germany: Springer. [Google Scholar]
- 37.El-Malla SF, Elshenawy EA, Hammad SF, Mansour FR. 2021N. Doped carbon dots as a fluorescent nanosensor for determination of colchicine based on inner filter effect. J. Fluoresc. 31, 675-684. ( 10.1007/s10895-021-02698-0) [DOI] [PubMed] [Google Scholar]
- 38.Zhang C, Han Y, Lin L, Deng N, Chen B, Liu Y. 2017. Development of quantum dots-labeled antibody fluorescence immunoassays for the detection of morphine. J. Agric. Food Chem. 65, 1290-1295. ( 10.1021/acs.jafc.6b05305) [DOI] [PubMed] [Google Scholar]
- 39.2007. United States Pharmacopeial Convention: United States Pharmacopoeia 30; National Formulary 25. Rockville, MD: US Pharmacopoeia Convention.
- 40.Simões EF, Leitão JM, da Silva JCE. 2017. Sulfur and nitrogen co-doped carbon dots sensors for nitric oxide fluorescence quantification. Anal. Chim. Acta 960, 117-122. ( 10.1016/j.aca.2017.01.007) [DOI] [PubMed] [Google Scholar]
- 41.Rurack K. 2008. Fluorescence quantum yields: methods of determination and standards. In Standardization and quality assurance in fluorescence measurements I, pp. 101-145. Berlin, Germany: Springer. [Google Scholar]
- 42.Wang X, Cao L, Yang ST, Lu F, Meziani MJ, Tian L, Sun KW, Bloodgood MA, Sun YP. 2010. Bandgap-Like strong fluorescence in functionalized carbon nanoparticles. Angew. Chem. Int. 49, 5310-5314. ( 10.1002/anie.201000982) [DOI] [PMC free article] [PubMed] [Google Scholar]
- 43.Anilkumar P, et al. 2011. Toward quantitatively fluorescent carbon-based ‘quantum’ dots. Nanoscale 3, 2023-2027. ( 10.1039/c0nr00962h) [DOI] [PubMed] [Google Scholar]
- 44.Xue M, Zhang L, Zhan Z, Zou M, Huang Y, Zhao S. 2016. Sulfur and nitrogen binary doped carbon dots derived from ammonium thiocyanate for selective probing doxycycline in living cells and multicolor cell imaging. Talanta 150, 324-330. ( 10.1016/j.talanta.2015.12.024) [DOI] [PubMed] [Google Scholar]
- 45.Hu L, Sun Y, Zhou Y, Bai L, Zhang Y, Han M, Huang H, Liu Y, Kang Z. 2017. Nitrogen and sulfur co-doped chiral carbon quantum dots with independent photoluminescence and chirality. Inorg. Chem. Front. 4, 946-953. ( 10.1039/C7QI00118E) [DOI] [Google Scholar]
- 46.Gazizadeh M, Dehghan G, Amjadi M. 2019. Ultrasensitive detection of glibenclamide based on its enhancing effect on the fluorescence emission of CdTe quantum dots. J. Luminescence 34, 297-303. ( 10.1002/bio.3608) [DOI] [PubMed] [Google Scholar]
- 47.Rodrigues SSM, Ribeiro DS, Molina-Garcia L, Medina AR, Prior JA, Santos JL. 2014. Fluorescence enhancement of CdTe MPA-capped quantum dots by glutathione for hydrogen peroxide determination. Talanta 122, 157-165. ( 10.1016/j.talanta.2014.01.031) [DOI] [PubMed] [Google Scholar]
- 48.Liu Z, Liu S, Yin P, He Y. 2012. Fluorescence enhancement of CdTe/CdS quantum dots by coupling of glyphosate and its application for sensitive detection of copper ion. Anal. Chim. Acta 745, 78-84. ( 10.1016/j.aca.2012.07.033) [DOI] [PubMed] [Google Scholar]
- 49.2005. ICH harmonized tripartite guideline, validation of analytical procedures: text and methodology, Q2 (R1), current step 4 version, parent guidelines on methodology, dated 6 November 1996, incorporated in November. In Int. Conf. on Harmonization, Geneva. See http://www.fda.gov/downloads/Regulator%20yInformation/Guidances/UCM128049.pdf. (accessed 8 August 2021).
- 50.Miller J, Miller JC. 2018. Statistics and chemometrics for analytical chemistry. London, UK: Pearson Education. [Google Scholar]
- 51.Walash M, El-Brashy A, El-Enany N, Kamel M. 2009. Spectrofluorimetric determination of famotidine in pharmaceutical preparations and biological fluids: application to stability studies. J. Fluoresc. 19, 333-344. ( 10.1007/s10895-008-0421-3) [DOI] [PubMed] [Google Scholar]
- 52.Magdy G, Al-enna AA, Belal F, El-Domany RA, Abdel-Megied AM. 2022. Data from: Application of sulfur and nitrogen doped carbon quantum dots as sensitive fluorescent nanosensors for the determination of saxagliptin and gliclazide. Dryad Digital Repository. ( 10.5061/dryad.8cz8w9gsm) [DOI] [PMC free article] [PubMed]
Associated Data
This section collects any data citations, data availability statements, or supplementary materials included in this article.
Data Citations
- Magdy G, Al-enna AA, Belal F, El-Domany RA, Abdel-Megied AM. 2022. Data from: Application of sulfur and nitrogen doped carbon quantum dots as sensitive fluorescent nanosensors for the determination of saxagliptin and gliclazide. Dryad Digital Repository. ( 10.5061/dryad.8cz8w9gsm) [DOI] [PMC free article] [PubMed]
Data Availability Statement
Data available from the Dryad Digital Repository: https://doi.org/10.5061/dryad.8cz8w9gsm [52].