

Abstract
Cryogenic correlative light and electron microscopy (cryo-CLEM) seeks to leverage orthogonal information present in two powerful imaging modalities. While recent advances in cryogenic electron microscopy (cryo-EM) allow for the visualization and identification of structures within cells at the nanometer scale, information regarding the cellular environment, such as pH, membrane potential, ionic strength etc. that influence the observed structures remains absent. Fluorescence microscopy can potentially be used to reveal this information when specific labels, known as fluorescent biosensors, are used, but there has been minimal use of such biosensors in cryo-CLEM to date.
Here we demonstrate the applicability of one such biosensor, the fluorescent protein roGFP2, for cryo-CLEM experiments. At room temperature, the ratio of roGFP2 emission brightness when excited at 425 nm or 488 nm is known to report on the local redox potential. When samples containing roGFP2 are rapidly cooled to 77K in a manner compatible with cryo-EM, the ratio of excitation peaks remains a faithful indicator of the redox potential at the time of freezing. Using purified protein in different oxidizing/reducing environments, we generate a calibration curve which can be used to analyze in situ measurements. As a proof-of-principle demonstration, we investigate the oxidation/reduction state within vitrified Caulobacter crescentus cells. The polar organizing protein Z (PopZ) localizes to the polar regions of C. crescentus where it is known to form a distinct microdomain. By expressing an inducible roGFP2-PopZ fusion we can visualize individual microdomains in the context of their redox environment.
Keywords: Cryogenic electron tomography, biosensor, CLEM, fluorescence microscopy, oxidation/reduction, bacteria
Introduction
Cryogenic electron tomography (cryo-ET) is a powerful tool to visualize the three-dimensional structure and organization of biomolecules in frozen-hydrated cells or cell fragments at the nanometer scale. Subtomogram averaging and segmentation can be used to identify different molecular structures or reveal subcellular organization, but these approaches lack the contextual information regarding local chemistry, such as local pH, redox potential, etc., that could help explain the observed structures.
Fluorescence microscopy is in many ways a complementary technique to cryo-ET. While the resolution is lower, and the context of cellular structure is less readily available, fluorescent labels can be used to extract a variety of types of information. Cryogenic correlative light and electron microscopy (cryo-CLEM) is the combination of these two techniques and has seen numerous advances and applications in recent years.1–3 These efforts have generally exploited the specificity of fluorescent labeling to identify the spatial location of a specific biomolecule of interest to either identify cells for cryo-ET, or the position of the molecule of interest within a tomographic reconstruction.4 The fluorescence images are generally diffraction limited, although super-resolved cryo-CLEM is an emerging area.5, 6
There are few examples of fluorescence microscopy being used to extract information beyond simply the positions of specifically labelled biomolecules for cryo-CLEM. In 2018, Metskas and Briggs used autoquenching of dialkylcarbocyanine in plunge-frozen samples to detect membrane fusion state.7 In 2019, Hoffmann et al. studied the dependence of organization in the ER-plasma membrane contacts on Ca2+ concentration using cryogenic fluorescence from GCaMP to identify cells with high Ca+2 levels.8 More recently, simultaneous observation of emission spectrum and excitation dipole orientation was correlated with 3D structure of plunge-frozen quantum dots.9 These examples represent the beginning of the application of well-established room-temperature fluorescence measurements to cryogenic temperatures in a way that is compatible with cryo-CLEM.
In this work, we seek to expand the available fluorescence tools by exploring the use of fluorescent biosensors for cryo-CLEM. There are many types of biosensors both in target and readout mechanism; for a helpful review, see Ref.10 Potential targets include chemical properties of the cellular environment such as pH and redox potential, metabolites including ATP and NADH, and ions like Ca2+.11–14 A variety of fluorescent proteins and small molecules have been designed to study each of these targets, with readout mechanisms including FRET, intensity ratio, and excitation ratio.
Ratiometric excitation and emission readout mechanisms generally depend on a fluorescent protein in equilibrium between two or more spectrally distinct states, where the equilibrium is sensitive to the biosensor’s target analyte. At room temperature, molecules can readily interchange between these states. However, previous work on plunge-frozen fluorescent proteins has shown that transitions between photophysical states are often suppressed compared to room temperature.15–18 Because each individual fluorescent protein becomes trapped in the state it occupied at the time of freezing, the equilibrium of spectral states is preserved in the populations. This allows for an ensemble measurement of the spectral state of many molecules to remain a faithful reporter of the environmental variable of interest at the time of freezing. For this reason, we believe excitation and emission ratio readouts are promising for cryo-CLEM.
Here we explore the applicability for cryo-CLEM of roGFP2, a redox-sensitive derivative of green fluorescent protein with an excitation ratio readout mechanism.19 First, we calibrate the protein’s response to changes in redox potential in plunge-frozen samples by comparison to room temperature data. We then apply this approach and calibration to a proof-of-principle cryo-CLEM experiment on a protein fused to roGFP2 in bacteria.
Results
Bulk Spectroscopy and Plunge-frozen Calibration
The redox sensitivity of roGFP2 arises from a pair of cysteine residues on the outward facing surface of the protein’s β–barrel. In an oxidizing environment, the two cysteine residues form a disulfide bridge, influencing the chromophore photophysics and leading to two distinct peaks in the fluorescence excitation spectrum centered around 400 nm and 490 nm. Upon reduction, the bridge breaks, and the 400 nm peak is suppressed. Fluorescence excitation spectra of purified roGFP2 in different redox environments at room temperature are shown in Figure 1a, and at cryogenic temperatures in Figure S4. By analyzing the ratio of the two excitation peaks at room temperature, the fraction of reduced roGFP2 proteins (R) can be determined (see Methods). Then, the redox potential of the environment can be inferred upon reference to the calibration curve generated with purified roGFP2 in different oxidizing/reducing environments.19
Figure 1.
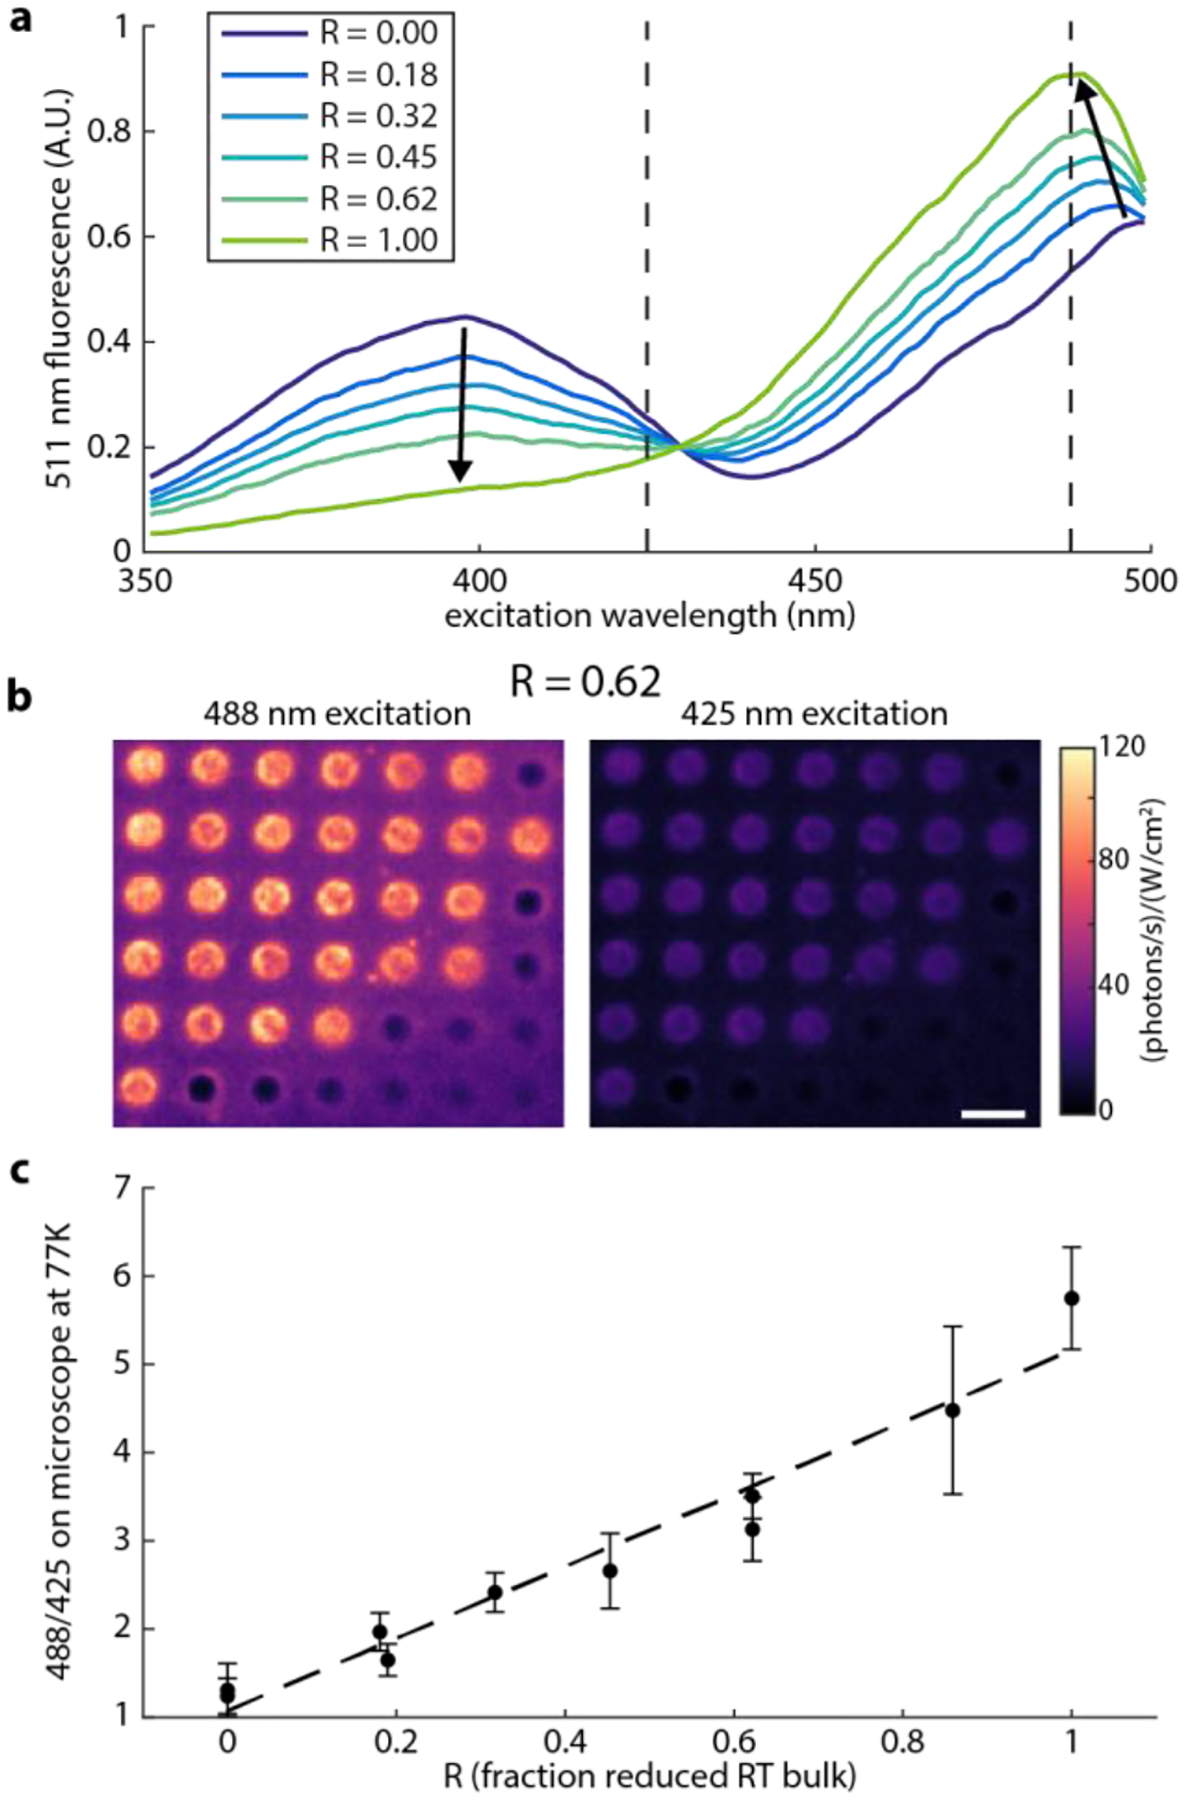
Bulk spectroscopy of roGFP2 in different redox environments. a) Excitation spectra for different degrees of reduction, controlled by varying the concentration of DTT at room temperature. Dark blue is fully oxidized, and light green is fully reduced. Arrows highlight changes in peaks with increasing concentration of DTT, leading to a more reduced sample. Dashed lines highlight the pumping wavelengths used in this experiment. b) Sample fluorescence images of roGFP2 solutions plunge frozen on calibration grids. roGFP2 prepared with R=0.62 imaged with 488 nm (left) and 425 nm (right) excitation shows more emission under 488. The dark holes are empty. Some holes appear brighter near the edge, as the ice is thinner near the center. In some cases, fluorescent proteins can self-associate, possibly leading to some of the bright puncta. Many comparable images contribute to one point in c), the calibration of fluorescence excitation ratio measured on the cryogenic fluorescence microscope with reduced fraction of roGFP2 of the same sample determined by room temperature bulk spectroscopy. Scale bar is 4 μm in (b).
In order for roGFP2 to be used as a cryo-CLEM label, we must demonstrate that a similar ratiometric excitation readout is preserved when samples are prepared via standard plunge-freezing techniques. To this end, small aliquots of purified roGFP2 protein in buffer spanning the full range of its redox sensitivity, including those with bulk spectra shown in Figure 1a, were first measured at room temperature and then plunge frozen on electron microscopy grids. These grids were then loaded on a cryogenic light microscope, and excited with interleaved 425 nm and 488 nm light (Figure 1b). The recovered ratio of brightnesses under 488 nm and 425 nm excitation, denoted F, was seen to be linearly dependent on the fraction of reduced roGFP2 molecules observed at room temperature (Figure 1c). Thus, there is a simple correspondence between the observed brightness ratios in cryogenically prepared samples and the redox potential. This result is expected given the assumption that observed fluorescence intensities from the frozen ensemble-averaged data are a linear combination of some molecules in a 400 nm absorbing state and some molecules in a 488 nm absorbing state. This understanding is further supported by the observation of single plunge-frozen roGFP2 molecules, which are predominately excited by either 488 or 425 nm illumination (Figure S1), indicative of being in distinct spectral states. By combining the spectra of all these molecules, an estimate of the redox state can be made.
Redox State of the Polar Region of Plunge-frozen C. Crescentus
To demonstrate the suitability of roGFP2 for cryo-CLEM, we have chosen to visualize the redox state of the polar microdomain formed by the polar organizing protein Z (PopZ) in the freshwater bacterium C. crescentus, a model organism for asymmetric cell division. C. crescentus asymmetrically divides into two morphologically distinct daughter cells, a sessile stalked cell and a motile swarmer cell. The two daughter cells have distinct structural and metabolic properties: The daughter stalked cell is replication competent while the motile daughter swarmer cell, bearing a single polar flagellum, can only initiate replication once it has differentiated into a stalked cell. PopZ is known to form space-filling microdomains at both the stalked and flagellated poles. The polar microdomain plays a crucial role in selectively sequestering phospho-signaling proteins that enhance chemical gradients within the small cellular volume prior to the asymmetric cell division.20, 21 It has been shown previously that the intracellular redox state of C. crescentus varies during cell cycle progression and is hypothesized to play a role in regulating cell differentiation.22 The redox environment of the PopZ microdomain has not been explored.
C. crescentus cells expressing a roGFP2-PopZ fusion were plunge frozen on electron microscopy grids and imaged on a cryogenic fluorescence microscope. Figure 2a shows a portion of a square imaged with fluorescence as well as reflected white light to provide context, with the empty grid holes appearing as dark circles. The outlines of the cells are visible in the reflected white light, and the polar regions with significant roGFP2-PopZ are clearly revealed by the fluorescent signal. By comparing the brightness of a cell pole with some of the brightest single roGFP2 molecules measured on the same microscope (Figure S1), the copy number of roGFP2 in the pole is found to be on the order of thousands.
Figure 2.
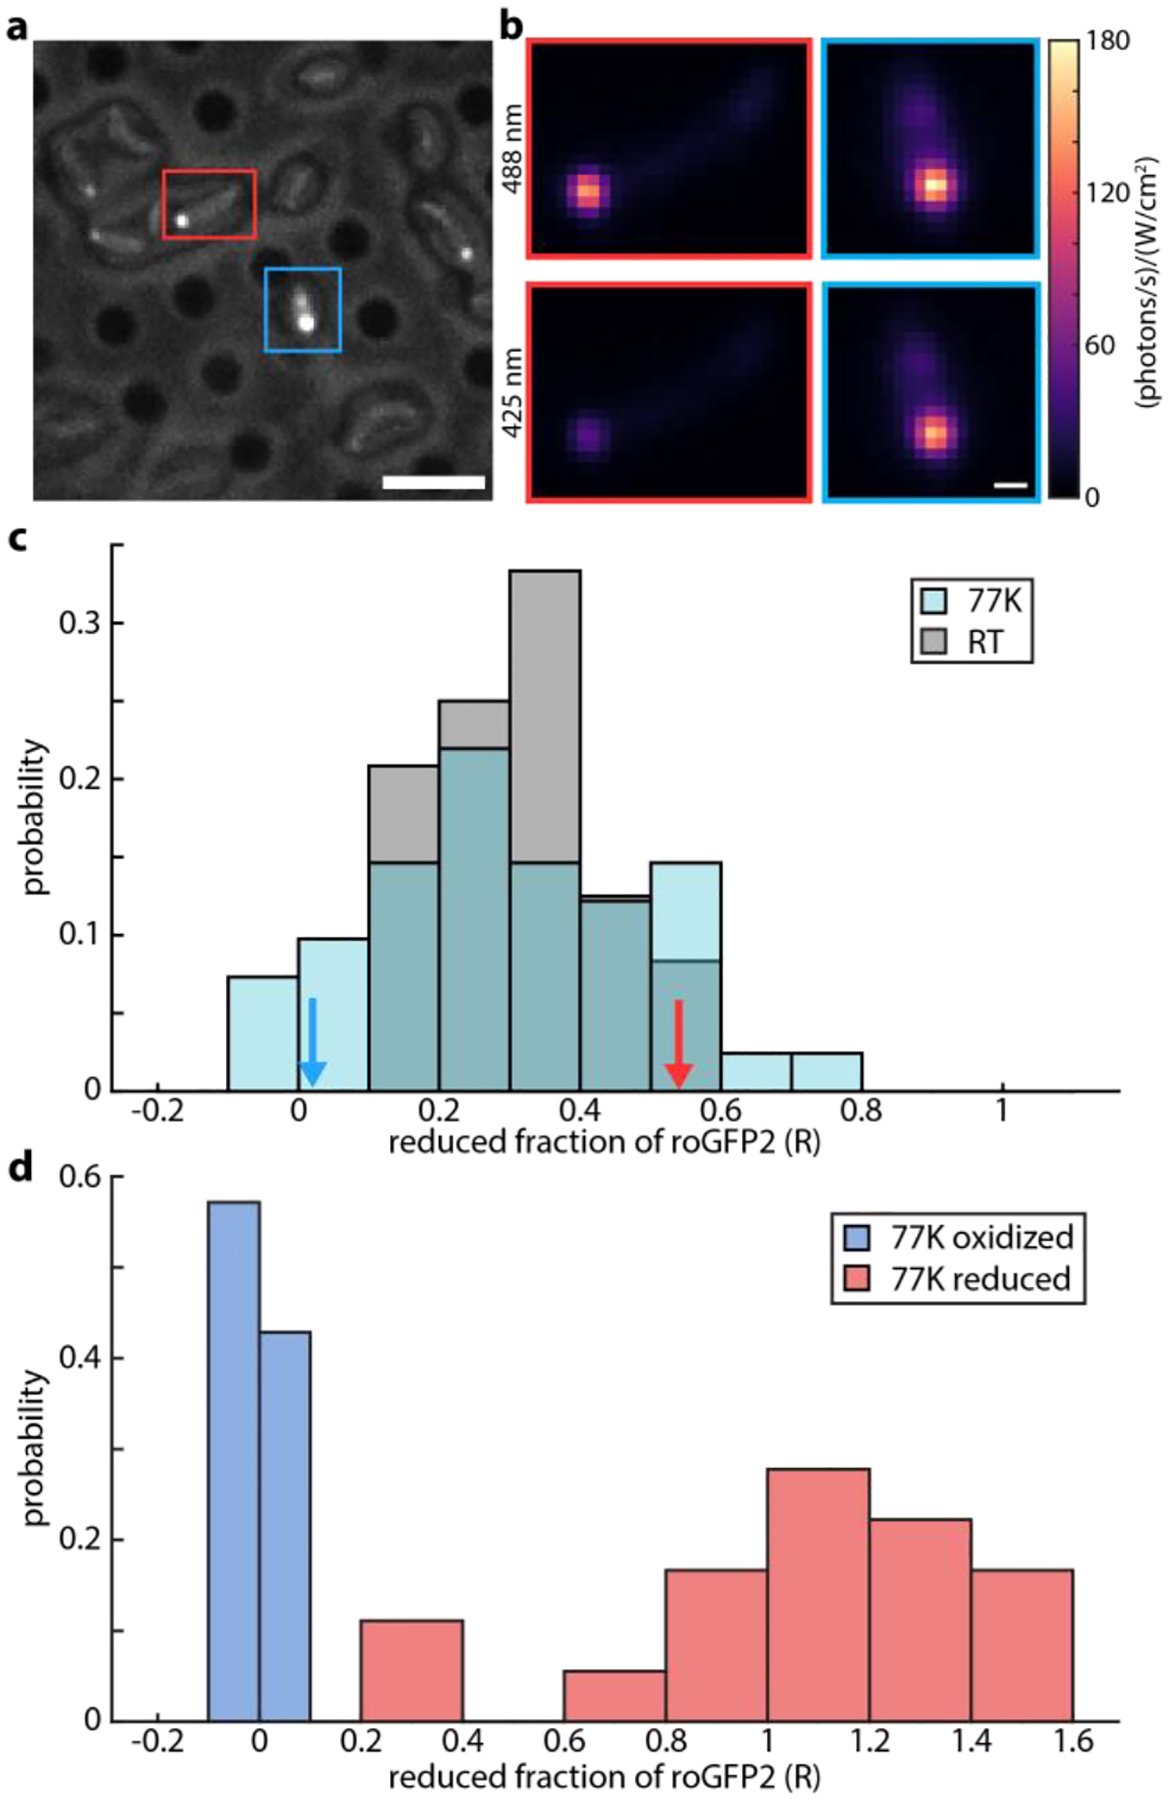
Determination of fraction of roGFP2 reduced in polar region of plunge-frozen C. crescentus. a) Simultaneous reflected white light and fluorescence image. Holey carbon grid is visible, with vitrified cells on top. Poles are fluorescent from roGFP2-PopZ fusion. b) Average fluorescence under 488 nm and 425 nm excitation in the top and bottom panels, respectively. Cell 1, on the left, is highlighted in red in panel a), while Cell 2, on the right, is highlighted in blue. c) Histogram of reduced fraction of roGFP2 in the polar region of 41 plunge-frozen (blue) and 17 room temperature (grey) C. crescentus cells. Red and blue arrows mark the R values measured for Cell 1 and Cell 2, respectively. d) Reduced fraction of roGFP2-PopZ in plunge frozen C. crescentus cells in reducing (red) and oxidizing (blue) environments. Histograms include 18 reduced and 21 oxidized cells. Scale bars 5 μm (a), 500 nm (b).
Averaged fluorescence-only images from both lasers of two adjacent cells in this field of view are shown in Figure 2b after normalizing for beam profile and power. Cell 1, marked with a red box, shows more fluorescence from 488 nm excitation than 425 nm excitation, corresponding to fluorescence ratio F=3.3 and fraction reduced R=0.5, see Methods. This means about half of the roGFP2 molecules are reduced in this cell pole. On the other hand, Cell 2, marked with a blue box, shows almost equal fluorescence from both lasers, giving F=1.1 and R=0.0, or no reduced roGFP2 in the pole.
This analysis was repeated for 41 cells across multiple fields of view on two grids, where the roGFP2 signal in the pole was clearly visible above cellular autofluorescence. Most of the cell poles were observed to contain more oxidized roGFP2 than reduced, however R was found to span from almost zero to one, with a mean of 0.30 and standard deviation of 0.20. The distribution observed for the same cell culture at room temperature displayed a mean of 0.31 and standard deviation of 0.12. The results are presented as a histogram in Figure 2c. It is clear that there is heterogeneity in the redox state from cell to cell in this unsynchronized sample.
To further validate that the redox sensitivity of roGFP2 is preserved in plunge-frozen cells, C. crescentus expressing roGFP2-PopZ were prepared in reducing and oxidizing environments prior to plunge freezing. Reduced fraction of roGFP2 was then measured for 18 reduced and 21 oxidized vitrified cells. The results of this analysis are shown in Figure 2d. The oxidized sample showed a tight distribution around a reduced fraction of zero. In contrast, the reduced sample displayed a much broader distribution around R=1. The clear separation of these distributions shows roGFP2 can report on its environment in plunge-frozen cells. The widths of these distributions are also informative, as they show how the uncertainty in the measurement changes over the range of reduced fraction. Because R=0 corresponds to an excitation ratio near 1, there is significant fluorescence from roGFP2 under both 425 and 488 nm excitation, and the signal is high relative to autofluorescence. However, when R approaches one, the excitation ratio is close to five (see Figure 1c), and there is very little roGFP2 emission under 425 excitation. This means the signal is very close to the autofluorescence background, and the ratio and reduced fraction cannot be determined precisely.
The agreement between the cryogenic and room temperature fluorescence results in situ, as well as the clearly resolved populations of reduced and oxidized plunge frozen cells, suggest plunge freezing does not perturb the ability of roGFP2 to report on cellular redox environment.
Visualization of 3D Organization of C. Crescentus Pole with Redox Measurements
Following fluorescence imaging, C. crescentus cells bearing roGFP2-PopZ on grids maintained in liquid nitrogen were loaded into a cryogenic electron microscope for tomography. Tilt series of several cells were recorded, including Cell 1 and Cell 2 shown in Figure 2, and their 3D volumes were reconstructed. Fluorescence images were then transformed into the coordinates of the reconstructions, colored based on R, and visualized on top of central slices of the reconstructions in Figure 3a. As expected, the (diffraction-limited) fluorescence is observed to come from the PopZ microdomain of the cell pole, identifiable by a lower frequency of large dense structures such as ribosomes.20
Figure 3.
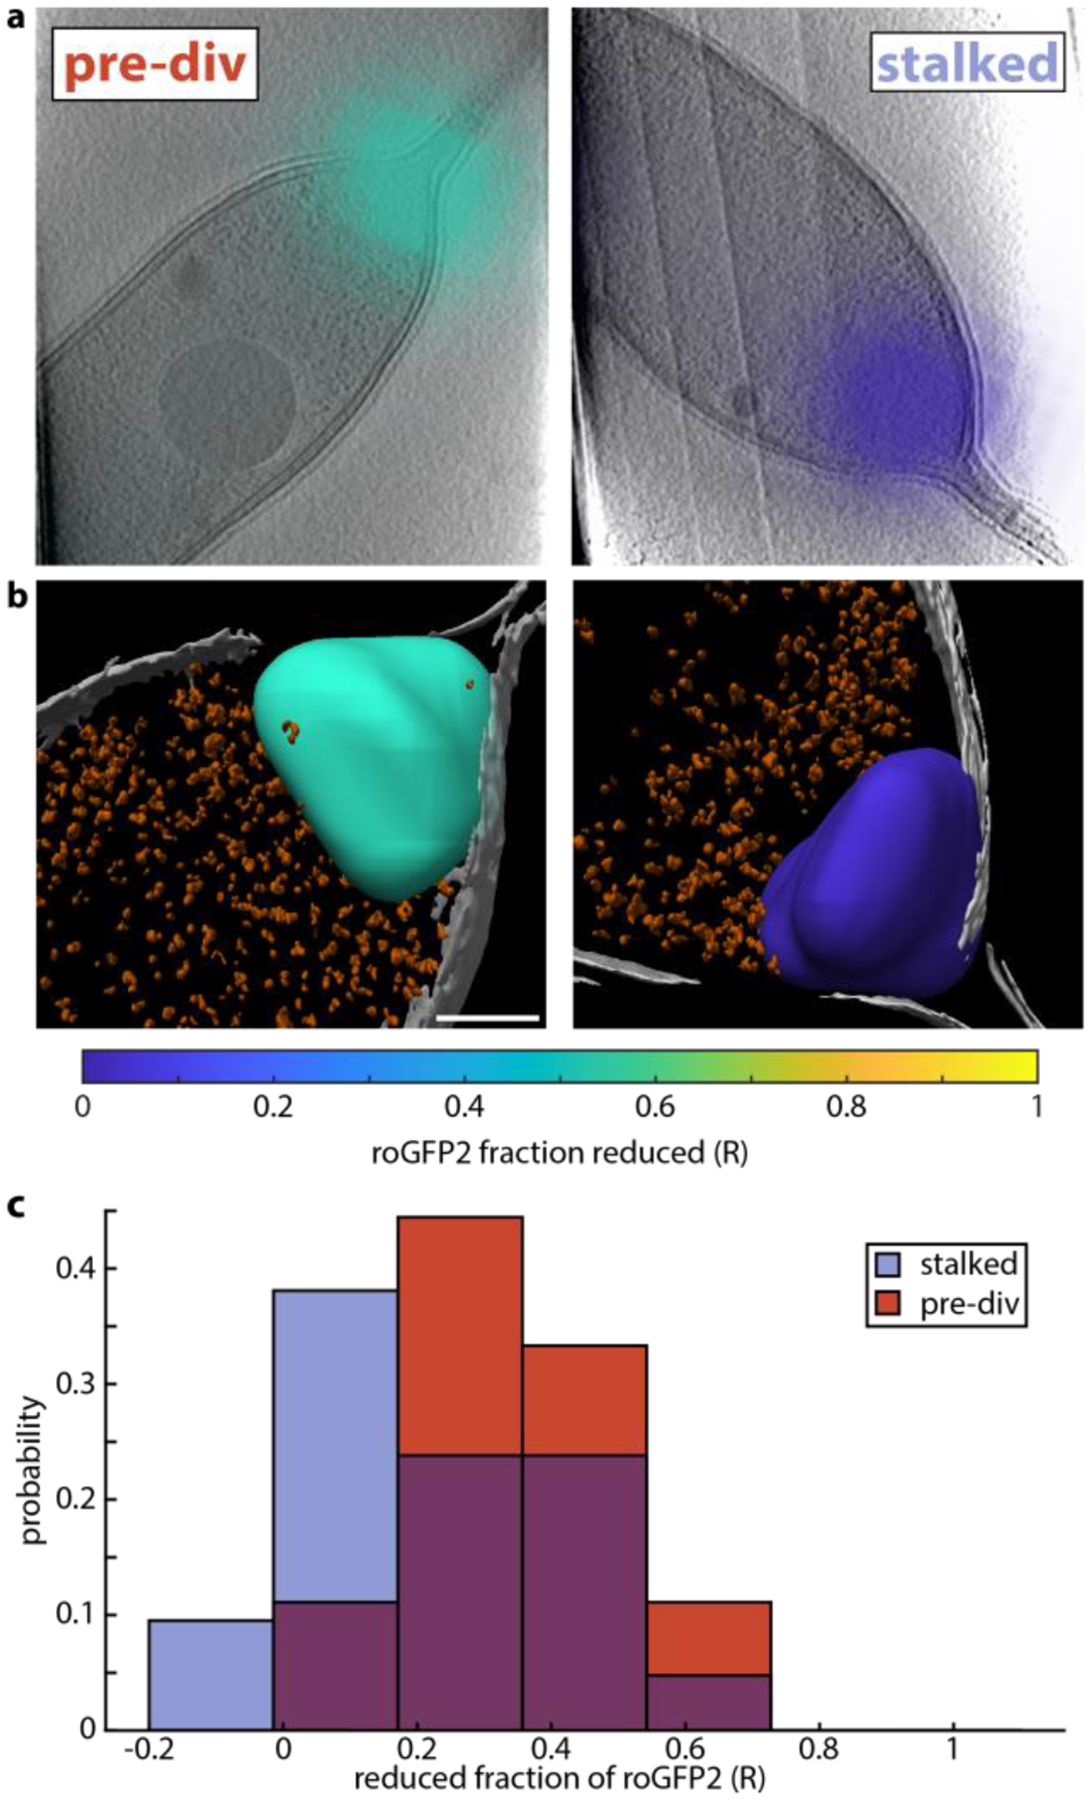
Tomographic reconstructions of C. crescentus visualized with local redox information. a) 14 nm slice of the tomographic reconstructions of Cell 1 (left) and Cell 2 (right). Overlaid are interpolated fluorescence images of roGFP2-PopZ, colored based on the measured reduced fraction averaged over a diffraction limited volume. b) Annotation of inner membrane (gray), dense puncta (orange), and PopZ ribosome-excluded region colored based on average reduced fraction of roGFP2. c) Histogram of 77K reduced fractions from Figure 2c, subdivided into cells with and without a clear division plane. 21 stalked cells without a clear division plane are plotted in blue, while 9 pre-divisional cells with a clear division plane are shown in red. Scale bars 200 nm (a) and 100 nm (b).
Using established techniques (see Methods), the reconstructions were segmented and annotated as shown in Figure 3b. The inner membrane, ribosomes and other dense structures, and the PopZ ribosome-excluded region are specifically highlighted. Extensive previous work showed that PopZ localizes in the ribosome-excluded polar region of the cell, even when labeled with fluorescent proteins,20, 21 which means the roGFP2 signal is reporting on the redox state of just this volume. While the fluorescence image in Figure 3a is diffraction-limited, the redox measurement is limited to the PopZ volume identified in the tomographic reconstruction. This measurement averages over the ensemble of roGFP2 molecules present, and differences within the PopZ volume cannot be discerned. Therefore, in the annotation the PopZ microdomain is colored based on the measured reduced fraction of roGFP2. These examples show roGFP2 can be used as an environmental reporter for cryo-CLEM. Specifically, the label faithfully reports on the local redox environment inside cells while preserving the cellular ultrastructure for analysis in cryo-ET.
Using a combination of lower magnification electron micrographs, fluorescence, and reflected white light images, untreated cells were classified as either stalked cells (21) or pre-divisional cells (9) if there was a clear constriction in the middle of the cell. Note that in general, swarmer cells have less PopZ at their poles and therefore provide little signal for this measurement. The cryogenic reduced fraction histogram, shown first in Figure 2c, was then replotted separately for cells in each class, Figure 3c. While the means of these distributions are distinct with over 90% confidence as determined by a two-sample t-test, 0.41 for pre-div cells and 0.25 for stalked cells, there is significant overlap. This result is in accordance with previous work showing oxidized cytoplasm during the G1 to S transition and the early S phase,22 but the large widths of our distributions suggest that cell cycle state is not the only factor involved in determining local redox. Narayanan et al. propose a model where oxidized cytoplasm leads to a dimerization of negative switch for topo IV decatenation activity (NstA, 7 kDa), which then binds and inhibits topoisomerase IV (316 kDa). The binding of NstA to topoisomerase IV is an interesting target for future subtomogram averaging studies, and our work shows that using cell state as a proxy for redox state is not sufficient at the single-cell level, demonstrating a potential future use of this methodology.
Conclusion
In this work, we have explored the use of fluorescent biosensors in cryo-CLEM experiments by demonstrating the utility of roGFP2 as an environmental reporter in cryogenically prepared samples. We showed roGFP2 maintains its ability to report on redox state upon plunge freezing, and that the trend of excitation ratio versus reduced fraction is roughly linear. Further, we have demonstrated the application of this label to report on the local redox environment inside plunge-frozen cells by studying C. crescentus cells expressing a roGFP2-PopZ fusion. We showed the compatibility of this measurement with cryo-ET by visualizing 3D tomographic reconstructions of individual cells with the chemical context provided by the reduced fraction of roGFP2.
This method has many potential applications to studying changes in 3D structure and organization of proteins in cells in response to local environmental changes or chemistry. In future work, interesting redox differences identified with room temperature fluorescence microscopy, for example, may be investigated with cryo-CLEM to explore structural differences. This approach can also be used in conjunction with subtomogram averaging, where different classes of molecular structure may be found to correlate with different local redox environments. Local chemical information will greatly assist in determining the structure-function relationship for biomolecules and subcellular structures.
We believe this method could also be extended to many other ratiometric environmental reporters sensitive to variables such as pH, membrane potential, specific metabolites, and more that have been demonstrated at room temperature. This correlated information could provide crucial context for observations at the ultrastructural and even molecular level. While the environmental sensor based on ensemble averaging reported here works on the scale of the optical diffraction limit of ~300 nm, we hope for alternative strategies in the future that provide true environmental information on the nanoscale.
Materials and Methods
Cryogenic Fluorescence Microscopy
Cryogenic fluorescence microscopy was conducted at 77K on a homebuilt setup described previously.15 The tip of a long working distance objective (Nikon CFI Tu Plan Apo 100x/N.A. 0.9) was immersed in cold nitrogen vapor above a plunge-frozen grid in the sample chamber of a cryogenic fluorescence stage designed for cryo-CLEM (Linkam Scientific CMS196). Fluorescence was excited by interleaving 425 nm (Omicron LuxX) and 488 nm (Coherent Sapphire) lasers in alternating frames with emission acquired by an EMCCD camera (Andor iXon+) every 300 ms. Peak excitation powers were kept between 1 and 10 W/cm2. Fluorescence emission over the range 500 nm to 550 nm was distinguished from scattered excitation by a dichroic mirror (488 DCM), a long pass filter (Semrock 488 nm EdgeBasic) and two band pass filters (Semrock 525/50 BrightLine).
After acquisition, the frames were drift-corrected by cross-correlation, and deinterleaved. All frames with 425 nm excitation were averaged together, and frames with 488 nm excitation were averaged together. These frames, averaged over about one minute, were then normalized by their respective excitation powers and beam profiles. The cell imaging data were then processed to remove potential interfering background from flavin adenine dinucleotide (see SI for details). Several pixels within cells, but away from the fluorescently labelled polar microdomain were selected to use as reference for background estimation in each color, which was subtracted from points of interest (e.g., the cellular pole). Finally, for each point of interest, the ratio of fluorescence with 488 nm excitation to fluorescence with 425 nm excitation was calculated.
Purification of roGFP2
BL21 E. coli cells expressing N-terminally his tagged roGFP2 were grown to log phase, induced with 500 μM IPTG, and grown overnight at 18C. Cells were spun down and resuspended in 50 mM Tris, 300 mM NaCl, 20 mM imidazole pH 7.5, PMSF, benzonase, and lysozyme and lysed on an Emulsiflex homogenizer and spun down to clarify. The supernatant was loaded onto a Ni-NTA resin in a gravity column and allowed to flow through before washing with ~20x the resin volume in 50 mM Tris, 300 mM NaCl, and 60 mM imidazole pH 7.5. Protein was eluted in 50 mM Tris, 300 mM NaCl, and 300 mM imidazole pH 7.5. Fractions with the highest yield were concentrated and then buffer exchanged using a PD-10 desalting column into 50 mM Tris, 150 mM NaCl, pH 7.5.
Calibration
While the performance of roGFP2 at room temperature is well characterized,19, 23 its behavior at 77K in plunge-frozen samples was unexplored. To use roGFP2 as an environmental sensor for cryo-CLEM, it was crucial to quantify the change in fluorescence excitation ratio in plunge-frozen samples on the cryogenic fluorescence microscope as a function of redox chemistry. To this end, concentrations of dithiolthreitol (DTT) ranging from 20 to 200 μM were added to purified roGFP2 (0.75 to 3.7 mg/mL) in Tris buffer to reduce some fraction of the protein. The mixture was allowed to sit for 20–40 minutes, then was split into two aliquots. One portion was deposited onto glow-discharged holey carbon grids with copper support (Quantifoil R 2/2 G200F1), blotted on both sides for 2–3 seconds, and plunge frozen (Gatan CP3). The rest of the mixture was diluted in a cuvette, and its room temperature fluorescence excitation spectrum was recorded (Horiba Fluorolog 3). Both the freezing and room-temperature fluorescence excitation spectra were carried out within 5 minutes of each other to ensure the room temperature measurement was representative of the environment of the sample at the time of plunge freezing.
The room temperature excitation spectrum was used to estimate the reduced fraction of roGFP2 molecules (R) following19, where
| (1) |
F is the ratio of excitation at 488 nm to 425 nm, and Fox and Fred are F values for a completely oxidized and completely reduced sample, respectively. The plunge-frozen purified protein is then imaged on the cryogenic fluorescence microscope with interleaved 488 nm and 425 nm excitation, and the ratio F is measured. Care was taken to ensure that intensities were low enough to prevent photo-induced switching, confirmed by observing a stable excitation ratio over time (Figure S6).
This process is repeated for several concentrations of DTT, and the results are fit to a line to generate a calibration to map from F measured in a plunge-frozen sample on the microscope to R, the reduced fraction of roGFP2, shown in Figure 1c. The results of two of 12 experiments were not included in this analysis as they were clear outliers.
Production of roGFP2-PopZ C. Crescentus Strain
To construct the N-terminal fusion, roGFP2-PopZ with a –GGGSGGGSGGGS– linker was synthesized and cloned into pXyl-YFPC-2 that was digested by NdeI/NheI using the Gibson Assembly protocol.24, 25 The ligation product was transformed into Escherichia coli DH5α cells and selected on LB-kan plates. Sequence-verified plasmid was then transformed into C. crescentus NA1000 cells via electroporation.
Those cells were then grown overnight in M2G with 5 μg/mL kanamycin and 0.3% xylose to induce transcription of the roGFP2-popZ fusion. 3 μL of cells were then deposited onto glow-discharged electron microscopy grids (Quantifoil R 2/2 G200F1), blotted for 2.5 seconds, and plunge frozen in liquid ethane (Gatan CP3).
To prepare cells in a reducing environment, 10 mM DTT was added to the culture about 30 minutes before plunge freezing. For an oxidizing environment, a small aliquot of cells was allowed to oxidize in air for roughly 30 minutes before freezing.
Room Temperature Fluorescence Microscopy
For room temperature measurements of roGFP2-PopZ, a small aliquot of cells was mounted on M2G agarose pads and allowed to settle. Fluorescence excitation ratio measurements were then made as described above. For calibration, purified roGFP2 either fully oxidized or reduced by a high concentration of DTT (5 mM) is placed between two coverslips and excitation ratios are measured, yielding Fox=2.5 and Fred=8.2. To convert excitation ratios to redox measurements, Equation 1 is used with these boundary values.
Cryogenic Electron Tomography
Cryogenic electron tomograms were acquired on a 300-keV electron microscope (Titan Krios Thermo Fisher) with an energy filter and direct detector (Gatan K3). Tilt series were collected from ±45° dose-symmetrically in 1° steps. Total dose was ~100 e−/Å2 with a pixel size of 3.44 Å and a defocus target of −10 μm. Reconstructions were performed in IMOD26 and annotated in EMAN227 and visualized with Chimera.28 The ribosome-excluded region that defines the PopZ microdomain was annotated manually.
Registration of Fluorescence and cryo-ET
Fluorescence images were registered to the tomographic reconstructions following a procedure similar to4. Briefly, because correlative experiments were done on finder grids, ensuring imaging is done for the same square and same cell is trivial. Fine alignment was performed by first identifying the lateral locations of holes in the electron microscopy grid in both the fluorescence and low magnification electron microscopy images. Then these hole centers were used as control point pairs to determine a transformation that maps the fluorescence onto the electron micrograph. Then, identifiable features (center of vesicle, base of stock, etc.) were selected in low magnification micrographs and in the projections of tomographic reconstructions to generate a transformation from low magnification to high magnification electron microscopy data sets. Finally, both transformations were applied to the fluorescence image to overlay fluorescence information on the tomographic reconstruction.
Supplementary Material
Acknowledgments
The authors extend special thanks to Saumya Saurabh, Corey Hecksel, Wah Chiu, and David Savage for helpful advice throughout the duration of this project. The authors would also like to thank Lauren Metskas for an inspiring conversation at the initial phase of this project. This work was supported in part by the U. S. Department of Energy, Office of Science, Office of Basic Energy Sciences, Chemical Sciences, Geosciences, & Biosciences Division, Physical Biosciences Program, under Award Number DE-FG02-07ER15892 (W.E.M.) and by the National Institute of General Medical Sciences Grant No. R35GM118067 (W.E.M.). D.D.P. was supported by a Stanford Graduate Fellowship. P.D.D. was supported in part by the Panofsky Fellowship at the SLAC National Accelerator Laboratory and by Grant 2021-234593 from the Chan Zuckerberg Initiative DAF, an advised fund of Silicon Valley Community Foundation. Electron tomography was conducted on instruments funded by a National Institutes of Health Shared Instrumentation Grant No. S10 OD021600.
References
- 1.Hoffman DP; Shtengel G; Xu CS; Campbell KR; Freeman M; Wang L; Milkie DE; Pasolli HA; Iyer N; Bogovic JA; Stabley DR; Shirinifard A; Pang S; Peale D; Schaefer K; Pomp W; Chang C-L; Lippincott-Schwartz J; Kirchhausen T; Solecki DJ; Betzig E; Hess HF, Correlative three-dimensional super-resolution and block-face electron microscopy of whole vitreously frozen cells. Science 2020, 367 (6475), eaaz5357. [DOI] [PMC free article] [PubMed] [Google Scholar]
- 2.Bykov YS; Cortese M; Briggs JAG; Bartenschlager R, Correlative light and electron microscopy methods for the study of virus–cell interactions. FEBS Letters 2016, 590 (13), 1877–1895. [DOI] [PubMed] [Google Scholar]
- 3.Wu G-H; Mitchell PG; Galaz-Montoya JG; Hecksel CW; Sontag EM; Gangadharan V; Marshman J; Mankus D; Bisher ME; Lytton-Jean AK, Multi-scale 3D cryo-correlative microscopy for vitrified cells. Structure 2020, 28 (11), 1231–1237. e3. [DOI] [PMC free article] [PubMed] [Google Scholar]
- 4.Dahlberg PD; Saurabh S; Sartor AM; Wang JR; Mitchell PG; Chiu W; Shapiro L; Moerner WE, Cryogenic single-molecule fluorescence annotations for electron tomography reveal in situ organization of key in Caulobacter. Proceedings of the National Academy of Sciences of the United States of America 2020, 117 (25), 13937–13944. [DOI] [PMC free article] [PubMed] [Google Scholar]
- 5.Dahlberg PD; Moerner WE, Cryogenic Super-Resolution Fluorescence and Electron Microscopy Correlated at the Nanoscale. Annual Review of Physical Chemistry 2021, 72 (1), 253–278. [DOI] [PMC free article] [PubMed] [Google Scholar]
- 6.DeRosier DJ, Where in the cell is my protein? Quarterly Reviews of Biophysics 2021, 54, e9. [DOI] [PubMed] [Google Scholar]
- 7.Metskas LA; Briggs JAG, Fluorescence-Based Detection of Membrane Fusion State on a Cryo-EM Grid using Correlated Cryo-Fluorescence and Cryo-Electron Microscopy. Microsc Microanal 2019, 25 (4), 942–949. [DOI] [PMC free article] [PubMed] [Google Scholar]
- 8.Hoffmann PC; Bharat TA; Wozny MR; Boulanger J; Miller EA; Kukulski W, Tricalbins contribute to cellular lipid flux and form curved ER-PM contacts that are bridged by rod-shaped structures. Developmental cell 2019, 51 (4), 488–502. e8. [DOI] [PMC free article] [PubMed] [Google Scholar]
- 9.Dahlberg P; Perez D; Su Z; Chiu W; Moerner WE, Cryogenic Correlative Single-Particle Photoluminescence Spectroscopy and Electron Tomography for Investigation of Nanomaterials. Angewandte Chemie International Edition 2020, 59 (36), 15642–15648. [DOI] [PMC free article] [PubMed] [Google Scholar]
- 10.Greenwald EC; Mehta S; Zhang J, Genetically Encoded Fluorescent Biosensors Illuminate the Spatiotemporal Regulation of Signaling Networks. Chemical Reviews 2018, 118 (24), 11707–11794. [DOI] [PMC free article] [PubMed] [Google Scholar]
- 11.Shen Y; Rosendale M; Campbell RE; Perrais D, pHuji, a pH-sensitive red fluorescent protein for imaging of exo-and endocytosis. Journal of Cell Biology 2014, 207 (3), 419–432. [DOI] [PMC free article] [PubMed] [Google Scholar]
- 12.Yaginuma H; Kawai S; Tabata KV; Tomiyama K; Kakizuka A; Komatsuzaki T; Noji H; Imamura H, Diversity in ATP concentrations in a single bacterial cell population revealed by quantitative single-cell imaging. Scientific reports 2014, 4 (1), 1–7. [DOI] [PMC free article] [PubMed] [Google Scholar]
- 13.Bilan DS; Matlashov ME; Gorokhovatsky AY; Schultz C; Enikolopov G; Belousov VV, Genetically encoded fluorescent indicator for imaging NAD+/NADH ratio changes in different cellular compartments. Biochimica et Biophysica Acta (BBA)-General Subjects 2014, 1840 (3), 951–957. [DOI] [PMC free article] [PubMed] [Google Scholar]
- 14.Fosque BF; Sun Y; Dana H; Yang C-T; Ohyama T; Tadross MR; Patel R; Zlatic M; Kim DS; Ahrens MB, Labeling of active neural circuits in vivo with designed calcium integrators. Science 2015, 347 (6223), 755–760. [DOI] [PubMed] [Google Scholar]
- 15.Dahlberg PD; Sartor AM; Wang JR; Saurabh S; Shapiro L; Moerner WE, Identification of PAmKate as a Red Photoactivatable Fluorescent Protein for Cryogenic Super-Resolution Imaging. Journal of the American Chemical Society 2018, 140 (39), 12310–12313. [DOI] [PMC free article] [PubMed] [Google Scholar]
- 16.Chang YW; Chen S; Tocheva EI; Treuner-Lange A; Lobach S; Sogaard-Andersen L; Jensen GJ, Correlated cryogenic photoactivated localization microscopy and cryo-electron tomography. Nature methods 2014, 11 (7), 737–739. [DOI] [PMC free article] [PubMed] [Google Scholar]
- 17.Weisenburger S; Boening D; Schomburg B; Giller K; Becker S; Griesinger C; Sandoghdar V, Cryogenic optical localization provides 3D protein structure data with Angstrom resolution. Nature Methods 2017, 14, 141. [DOI] [PubMed] [Google Scholar]
- 18.Le Gros MA; McDermott G; Uchida M; Knoechel CG; Larabell CA, High-aperture cryogenic light microscopy. Journal of microscopy 2009, 235 (1), 1–8. [DOI] [PMC free article] [PubMed] [Google Scholar]
- 19.Hanson GT; Aggeler R; Oglesbee D; Cannon M; Capaldi RA; Tsien RY; Remington SJ, Investigating Mitochondrial Redox Potential with Redox-sensitive Green Fluorescent Protein Indicators*. Journal of Biological Chemistry 2004, 279 (13), 13044–13053. [DOI] [PubMed] [Google Scholar]
- 20.Bowman GR; Comolli LR; Gaietta GM; Fero M; Hong SH; Jones Y; Obayashi J; Downing KH; Ellisman MH; McAdams HH; Shapiro L, Caulobacter PopZ forms a polar subdomain dictating sequential changes in pole composition and function. Mol. Microbiol 2010, 76 (1), 173–189. [DOI] [PMC free article] [PubMed] [Google Scholar]
- 21.Lasker K; von Diezmann L; Zhou X; Ahrens DG; Mann TH; Moerner WE; Shapiro L, Selective sequestration of signalling proteins in a membraneless organelle reinforces the spatial regulation of asymmetry in Caulobacter crescentus. Nat Microbiol 2020, 5 (3), 418–429. [DOI] [PMC free article] [PubMed] [Google Scholar]
- 22.Narayanan S; Janakiraman B; Kumar L; Radhakrishnan SK, A cell cycle-controlled redox switch regulates the topoisomerase IV activity. Genes & development 2015, 29 (11), 1175–1187. [DOI] [PMC free article] [PubMed] [Google Scholar]
- 23.Wierer S; Peter S; Elgass K; Mack H-G; Bieker S; Meixner AJ; Zentgraf U; Schleifenbaum F, Determination of the in vivo redox potential by one-wavelength spectro-microscopy of roGFP. Analytical and bioanalytical chemistry 2012, 403 (3), 737–744. [DOI] [PubMed] [Google Scholar]
- 24.Thanbichler M; Iniesta AA; Shapiro L, A comprehensive set of plasmids for vanillate- and xylose-inducible gene expression in Caulobacter crescentus. Nucleic Acids Res. 2007, 35 (20), e137. [DOI] [PMC free article] [PubMed] [Google Scholar]
- 25.Gibson DG; Young L; Chuang RY; Venter JC; Hutchison CA 3rd; Smith HO, Enzymatic assembly of DNA molecules up to several hundred kilobases. Nature methods 2009, 6 (5), 343–345. [DOI] [PubMed] [Google Scholar]
- 26.Kremer JR; Mastronarde DN; McIntosh JR, Computer Visualization of Three-Dimensional Image Data Using IMOD. Journal of structural biology 1996, 116 (1), 71–76. [DOI] [PubMed] [Google Scholar]
- 27.Tang G; Peng L; Baldwin PR; Mann DS; Jiang W; Rees I; Ludtke SJ, EMAN2: An extensible image processing suite for electron microscopy. In Software tools for macromolecular microscopy, 2007; Vol. 157, pp 38–46. [DOI] [PubMed] [Google Scholar]
- 28.Pettersen EF; Goddard TD; Huang CC; Couch GS; Greenblatt DM; Meng EC; Ferrin TE, UCSF Chimera--A visualization system for exploratory research and analysis. Journal of Computational Chemistry 2004, 25 (13), 1605–1612. [DOI] [PubMed] [Google Scholar]
Associated Data
This section collects any data citations, data availability statements, or supplementary materials included in this article.