

Abstract
This study explores thermal design aspects of nanowarming-assisted recovery of the heart from indefinite cryogenic storage, where nanowarming is the volumetric heating effect of ferromagnetic nanoparticles excited by a radio frequency electromagnet field. This study uses computational means while focusing on the human heart and the rat heart models. The underlying nanoparticle loading characteristics are adapted from a recent, proof-of-concept experimental study. While uniformly distributed nanoparticles can lead to uniform rewarming, and thereby minimize adverse effects associated with ice crystallization and thermomechanical stress, the combined effects of heart anatomy and nanoparticle loading limitations present practical challenges which this study comes to address. Results of this study demonstrate that under such combined effects, nonuniform nanoparticles warming may lead to a subcritical rewarming rate in some parts of the domain, excessive heating in others, and increased exposure potential to cryoprotective agents (CPAs) toxicity. Nonetheless, the results of this study also demonstrate that computerized planning of the cryopreservation protocol and container design can help mitigate the associated adverse effects, with examples relating to adjusting the CPA and/or nanoparticle concentration, and selecting heart container geometry, and size. In conclusion, nanowarming may provide superior conditions for organ recovery from cryogenic storage under carefully selected conditions, which comes with an elevated complexity of protocol planning and optimization.
Keywords: cryopreservation, vitrification, simulation, nanowarming, thermal analysis
1 Introduction
About 70% of U.S. donor hearts were discarded rather than being transplanted in 2017, largely due to preservation limitations while undergoing assessment and waiting for acceptable matching [1]. If half of the discarded hearts were utilized for transplantation, the waitlists could be extinguished in 2–3 years [2]. While individual cells and small specimens can be readily cryopreserved [3–11], large mammalian tissues and organs have shown to be adversely affected by crystal formation, which hinders their long-term cryogenic storage. Cryopreservation by vitrification, where ice formation is completely avoided and the material is preserved in the amorphous state, is widely considered as the only alternative for cryopreservation of large organs, such as the heart (vitreous means glassy in Greek) [12–14]. Vitrification requires relatively high cooling and rewarming rates, to outrun the rate of ice nucleation and growth [13,15,16].
The simplest and probably the most investigated protocols to recover vitrified specimens from cryogenic storage were based on convective rewarming at the container boundaries (i.e., an inward rewarming process). While convective rewarming may be beneficial for smaller specimens, the underlying principles of heat transfer and solid mechanics present size limitations on successful cryopreservation. The decaying rewarming rate with the distance from the outer surface can reach the threshold below which rewarming phase crystallization (RPC) prevails [17], where ice formation is the cornerstone of cryogenic damage at the cellular level. Furthermore, the temperature variation across the domain gives rise to thermomechanical stresses, which increase with the specimen size, potentially leading to structural damage with fracturing as its most dramatic outcome [18–20].
An alternative approach to reduce the likelihood of both RPC and thermomechanical stresses is volumetric heating, with electromagnetic radiation in the radio frequency (RF) range as an example for direct tissue heating [21–23]. Another example is nanoparticle-mediated heating, or nanowarming, where the volumetric heating effect is achieved by heating volumetrically distributed nanoparticles, which are excited by an external magnetic field [24–29]. Nanowarming may be superior to RF heating under selected conditions by reducing the overall electrical power needed, the size of the apparatus [22,30], and adverse effects associated with the so-called thermal runaway. This study focuses on thermal aspects of nanowarming to recover the organ from cryogenic storage.
Importantly, one aspect of determining the volumetric heating effect for nanowarming is understanding the concentration of nanoparticles throughout the organ and the surrounding fluid. This effect is quantified by the specific absorption rate (SAR) and is measured in W/g tissue. While the concentration in the fluid is entirely under the investigators control, understanding the precise concentration distribution throughout the perfused organ after loading and after washout is now at the forefront of experimental research. For example, average iron concentration in organs has been experimentally obtained from inductively coupled plasma-optical emission spectrometry and calibrated against several quantitative imaging approaches such as micro-CT (usually in the mg Fe/g tissue [27,31]) and MRI (from 0.01 up to ∼3 mg Fe/mL tissue [32–34]). Experimental evaluation of the nanoparticles concentration distribution and its dependency on the applied loading protocol is critical for successful translation of the approaches presented here to clinical success [29].
A recent experimental study demonstrated the feasibility of nanowarming-assisted cryopreservation by vitrification of the rat heart [29]. That study opened new questions about the container size, shape, and scale-up considerations, which this study aims to explore. In particular, this study examines the potential in volumetric rewarming of the heart by silica-coated iron oxide nanoparticles (sIONPs) [25,26,29,31]. One of the difficulties that have been observed in that recent experimental study is the variation in nanoparticle concentration between different regions in the domain, which may adversely affect rewarming uniformity [29]. For example, being restricted to the organ vasculature may lead to a varying rewarming power between the heart muscle, the solution contained in its ventricles, and the surrounding solution in which the heart is immersed. This study aims at investigating relating thermal effects and highlight key parameters for optimization.
2 Mathematical Modeling
2.1 Geometrical Model.
An MRI-based geometrical model of a healthy adult heart was obtained from the Visible Heart Laboratory at the University of Minnesota [35], as illustrated in Fig. 1(a). This model was obtained in an stl format, based on 662,192 triangular faces. In the scope of this study, the geometrical model was further processed to reduce its order to 1570 triangular faces, using the Quadratic Edge Collapse Decimation procedure in meshlab (an open-source software package for processing and editing 3D triangular meshes). Next, hyperworks (an open-architecture computer-aided engineering software) was used to manually clean up the model and make it watertight (that is a single enclosed surface with no gaps) for the purpose of finite element analysis (FEA). Finally, the model was imported into the FEA software package ansys and scaled for the average human heart size of 195 mL, as compiled from Refs. [36] and [37]. In the absence of compatible data for the rat heart, the same model was further scaled down to 0.686 mL, assuming geometric similarity between the human heart and the rat heart [38]. While there are modest variations in scaling detail between the species [39–41], these are not expected to affect the generality of the conclusions presented in this study, and especially given the fact that the heart is highly permeated with a cryoprotective agent (CPA) and is immersed in the same CPA solution. Figure 1(b) displays the mesh of the heart after geometric processing, ready for FEA simulations.
Fig. 1.
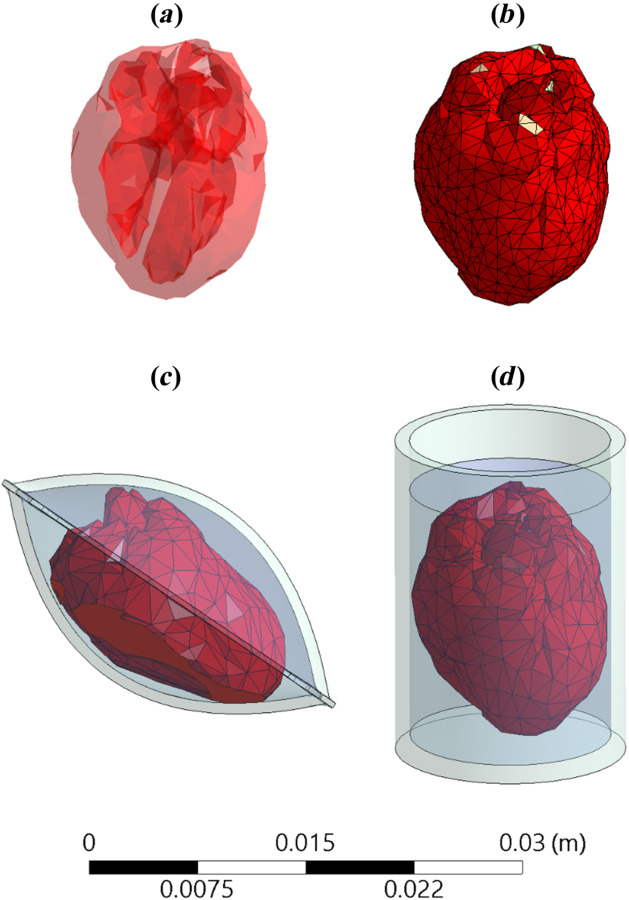
Illustrations of (a) an MRI-based geometrical model of a human heart, (b) the FEA mesh representation of the heart, (c) a heart model contained in a cryobag, and (d) a heart model in a cylindrical container
Two container configurations are investigated in this study, a pillow-shape cryobag (previously created in solidworks by Solanki et. al. [18]) and a cylinder, as illustrated in Figs. 1(c) and 1(d), respectively. The specific dimensions of the containers were selected to closely match the heart volume with minimum surrounding solution, as listed in Table 1. The wall thickness for all containers and cryobags was selected to be 1 mm. The heart is assumed to be fully perfused with a CPA solution, its chambers filled with CPA solution and the heart is fully immersed in CPA solution.
Table 1.
Geometric parameters used in this study
| Model | Volume, mL | Dimensions, mm | |
|---|---|---|---|
| Rat | Heart | 0.69 | 17.5 × 13 × 11 |
| Cryobag1 | 2.2 | 23.4 × 17.5 × 12.5 | |
| Cylinder2 | 2.5 | 17.5 (L) × 13.5 (D) ; 22 (C) | |
| 10 | 17.5 (L) × 27 (D) ; 22 (C) | ||
| Human | Heart | 195 | 115 × 85 × 70 |
| Cryobag | 618 | 154 × 115.5 × 85 | |
Inner dimensions of the cryobag, which has a wall thickness of 1 mm.
D and L represent the diameter and height of the CPA solution, respectively, while C represents the height of the container, which has a wall thickness of 1 mm.
2.2 Heat Transfer Model.
Due to the already high viscosity of the CPA solution at the initial temperature [42], heat transfer within the container-organ-CPA solution system is assumed to be governed solely by conduction
| (1) |
where C is the volumetric specific heat, T is temperature, k is thermal conductivity, the dot represents a time derivative, and is the heat generated due to nanowarming
| (2) |
where SAR is the specific absorption rate of the nanoparticles and Cn is the nanoparticles concentration in the CPA cocktail [31,32].
Continuity in temperature and heat flux is assumed on all internal boundaries, while a combined convective and radiative heat transfer is assumed between the outer surface of the container and the cooling chamber environment
| (3) |
where is the normal to the container outer surface, U is overall heat transfer coefficient by convection and radiation [42], and the subscript c and s refer to the cooling environment, and the surface exposed to heat exchange with it, respectively.
2.3 Physical Properties and Operational Parameters.
Consistent with recently performed experiments on the rat heart model [29], the simulations presented in this study consider the material properties of VS55 as a CPA solution when loaded with silica-coated iron nanoparticles (sIONPs). VS55 is a cocktail of 3.1 M dimethyl sulfoxide, 2.2 M propylene glycol, and 3.1 M formamide. Additionally, VS55 mixed with 0.6 M sucrose as a synthetic ice modulator (SIM) [43] loaded with sIONPs is considered in this study for the human heart study due to its favorable thermal properties in inhibiting ice nucleation and growth [44] and the overall volume to be vitrified. Note that both the critical cooling rate (CCR) and the critical warming rate (CWR) of VS55 mixed with 0.6 M sucrose are below 1 °C/min based on differential scanning calorimetry, but the specific values remain undetermined [44]. While the melting temperature of VS55 is −38 °C (which is also the upper temperature boundary for heterogeneous nucleation), the melting temperature of the cocktail VS55 + 0.6M sucrose remains unknown. A previous differential scanning calorimetry study on the closely related CPA cocktail DP6 (3 M dimethyl sulfoxide and 3 M propylene glycol) suggested that 0.6 M sucrose may lower the melting temperature (and hence the upper boundary of heterogeneous nucleation) by more than 10 °C by extrapolation, but specific measurements have not been obtainable in that study due to experimentation limitations and extremely low nucleation rate [45].
Table 2 lists the physical properties of both the solutions used in this study. In the absence of physical properties of CPA-loaded tissue, due to the high CPA concentration in the tissue, and consistent with previous studies [52,53], the same CPA properties are taken for both the heart model and the surrounding solution. In this context, previous experimental results based on micro-CT imaging demonstrated 100% CPA solution loading in the ventricles, and up to 86% CPA solution loading of the heart on average [29]. In this context, 100% loading means that the entire respective volume is filled with the CPA solution with no dilution. Furthermore, Peyridieu et al. [54] has demonstrated experimentally that the CCR and the CWR in CPA-loaded tissues may be dramatically lower than those required for pure CPA. With these experimental observations in mind, the use of original CPA solution physical properties for the CPA-loaded tissue is considered a good approximation in this study, with a somewhat conservative CCR and CWR criteria to ensure vitrification based on computer modeling.
Table 2.
Material properties used in this study
The specific heat generation rate for nanowarming is taken from recent measurements of VS55 mixed with sIONPs (EMG-308, Ferrotec, Bedford, NH) when excited at a field strength of 62 kA/m and frequency of 185 kHz [29]. Based on a previous experimental study [27], the SAR was approximated to be constant between the temperatures of −120 °C and −80 °C, having a value of 691 W/g Fe, and to be linearly decreasing from 691 to 415 W/g Fe within the temperatures of −80 °C and −20 °C, respectively. A follow-up experimental study (unpublished) suggests that the latter linear trend between −80 °C and −20 °C continues up to 0 °C, which was taken into account in this study. Finally, in the absence of SAR experimental data below −120 °C and given its constant value between −120 °C and −80 °C, the same constant SAR value was kept even in lower temperatures, down to the minimum value of −150 °C simulated in this study.
The overall heat transfer coefficient between the container and the surrounding was investigated within the range of 15 W/m2 °C, representative of free convection and radiation (evaluated under similar experimental conditions [29]) and 350 W/m2 °C, representative of the highest overall heat transfer coefficient that was achievable in a commercial controlled-rate cooling chamber (measured experimentally as an upper boundary in a controlled-rate cooler [42]).
2.4 Cryogenic Protocols.
The cooling portion of the cryogenic protocol for the rat heart model was replicated from a previous experimental investigation [29], including: (a) initial cooling at a constant rate of 40 °C/min from an initial temperature of −20 °C down to −122 °C, (b) temperature hold at 122 °C until the specimen reaches thermal equilibrium, (c) further cooling at a constant rate of 40 °C/min to the cryogenic storage temperature of −150 °C, and (d) potentially indefinite temperature hold at cryogenic storage. This protocol resulted in complete vitrification of the rat heart muscle and surrounding solution [29].
Due to the human heart size and the underlying principles of heat transfer, the cooling portion of the cryogenic protocol for the human heart model was modified from the rat heart model protocol to project complete vitrification as follows: (a) initial cooling at a constant rate of 40 °C/min from an initial temperature of −30 °C down to −118 °C, (b) temperature hold at −118 °C until the specimen reaches thermal equilibrium, (c) further cooling at a rate of 1 °C/min to the cryogenic storage temperature of −150 °C, and (d) potentially indefinite temperature hold at cryogenic storage. Specifically, the temperature hold at −118 °C was chosen to be 3 °C below the glass transition temperature of VS55 + 0.6M sucrose to facilitate stress relaxation [20]. This protocol resulted in supra-CCR above −90 °C, which is most relevant to crystal growth [51], to satisfy the conditions for vitrification.
Based on prior experiments of the rat heart model [29], sIONP concentration of 10 mg Fe/ml was selected for the heart chambers, which resulted in 1.47 mg Fe/ml in the heart muscle due to the underlying effects governing nanoparticles loading. For reasons articulated in the discussion section below, the sIONP concentration in the surrounding solution was varied within a concentration range not exceeding 10 mg Fe/ml, with examples listed in Table 3. Also listed in Table 3 are selected combinations of boundary conditions and container geometries, which are discussed in detail below.
Table 3.
Case study parameters: boundary condition and nanoparticle concentration in the surrounding CPA solution, where the nanoparticle concentration in the ventricles and the heart muscle was kept unchanged between cases at the values of 10 mg Fe/mL and 1.47 mg Fe/mL, respectively [29]; the time, t, is measured in seconds
| Case | Nanoparticle concentration in the surrounding CPA, Cn, mg Fe/mL | Boundary conditions | Container |
|---|---|---|---|
| I | 10 | Adiabatic | Cryobag |
| II | 7.5 | Adiabatic | Cryobag, Cylinder |
| III | 5 | Adiabatic | Cryobag |
| IV | 3.75 | Adiabatic | Cryobag |
| V | 5 | U =15 W/m2 °C [29] | Cryobag |
| Tc = 22 °C | |||
| VI | 3.75 | U =350 W/m2 °C [42] | Cryobag |
| Tc = −150 °C + 100t |
2.5 Numerical Solution.
The FEA commercial code ansys was used for thermal analysis, where tetrahedral elements (SOLID87) were used to generate an adequate mesh. In total, between 25,219 and 68,811 elements were used in the case of the rat heart model which satisfied a mesh convergence analysis for the thermal solution for all three simulated containers. For the human heart-cryobag model, 33,039 elements were used, for which a time-step convergence study yielded a value of 0.5 s. After convergence studies for the appropriate mesh and time-step sizes, the ansys solution was validated against experimental observations in our previous study [29]. This study builds upon that and expends the analysis as discussed below.
3 Results and Discussion
The discussion section is presented below in an increasing model size order. It starts with the rat heart model and experimental conditions reported in the literature relating to the nanoparticles concentration in the heart chambers, heart muscle, and heat generation rate [29]. The analysis starts with the simplest scenario as a benchmark, where the nanoparticles concentration in the surrounding CPA solution and the chambers is equal, and the cryobag is isolated from the surroundings (i.e., an adiabatic boundary condition). Then it advances to explore what-if scenarios which are rationalized by the outcome of the benchmark case and the underlying principles of heat transfer, and finally, it concludes with the analysis of the human heart model.
3.1 Rat Heart Model
3.1.1 Surrounding Solution Concentration Variation.
Figure 2 displays the temperature distribution and thermal history on selected surfaces of the heart muscle at the end of nanowarming for the benchmark case (case I, in Table 3), which corresponds to vitrification using VS55 containing 10 mg Fe/mL sIONP concentration in a cryobag, subject to an adiabatic boundary condition. Nanowarming is terminated when the lowest temperature anywhere in the heart exceeds the melting temperature of the CPA solution (−38 °C for VS55 [25,51]) by a 3 °C safety margin [29]. At that point in time, the highest temperature in the heart muscle is 1.5 °C which is found on the epicardium at the base of the heart (Fig. 2(a)). Further note that the variation in temperature on the epicardium is a result of the varying thickness of the heart muscle, having a lower concentration of nanoparticles, and the shape of the cryobag. It can be seen from Fig. 2(a) that the coldest temperature is found on the epicardium near the left ventricle, which is the lower boundary of a 36.5 °C temperature difference across the heart. Figure 2(b) displays the thermal history during the nanowarming in the heart muscle, where the temperature differences increase with the progression of rewarming. The initial rapid rewarming rates in some areas in the domain are the result of the low specific heat of the CPA solution below the glass transition temperature, which increases with temperature while potentially reducing the rewarming rate.
Fig. 2.
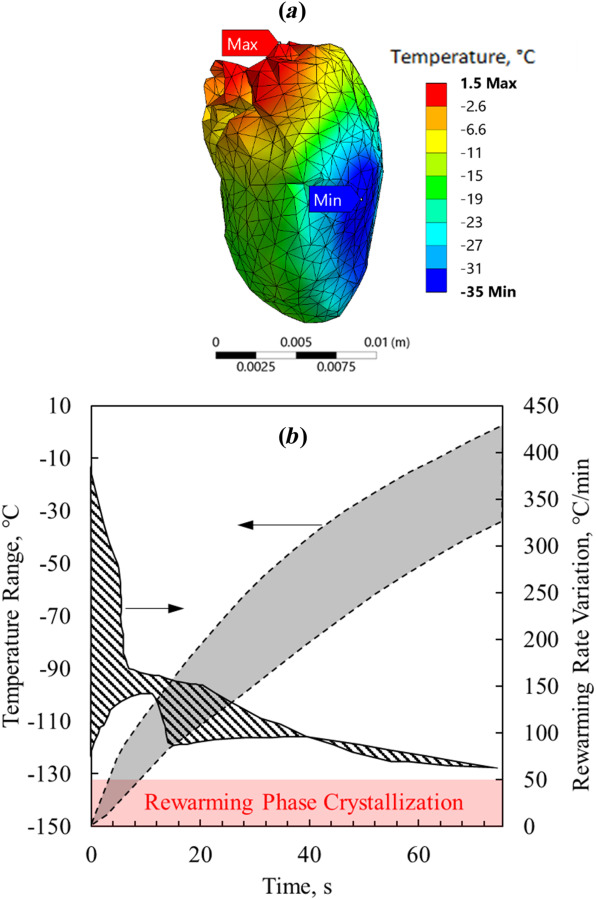
Thermal results for the benchmark case of the rat heart model—Case I (Table 3): (a) temperature distribution at the end of nanowarming superimposed on the heart model, when the lowest temperature in the heart surpasses −35 °C and (b) thermal history in the heart muscle during the process of nanowarming
Although the rewarming rates anywhere in the domain in the benchmark case exceed the CWR, which is favorable for preventing RPC, the highest temperature at the end of nanowarming is 1.5 °C, which may increase the likelihood of tissue damage due to CPA toxicity [15,55,56]. The extended exposure of some areas to higher temperatures is expected to intensify the toxicity potential of the CPA, which generally increases with the increasing temperature and time. An effective means to decrease the toxicity effect during either CPA loading or unloading of large specimens and organs is the so-called liquidus tracking method [57–59]. There the CPA is stepwise loaded, where each step includes an increased CPA solution concentration while loading at a lower temperature. This method is consistent with the combined tendencies of exponentially decreased toxicity with the decreasing temperature and decreased heterogeneous nucleation point with the increasing concentration, which in essence follows the liquidus curve on the phase diagram. Following this approach, unloading is done in reverse order. While this could be advantageous in larger specimens, where loading and unloading require longer times [59], the implications are that: (i) warming should be arrested for the first step of unloading shortly after the lowest temperature in the specimen surpasses the melting point with some safety margins, and (ii) the temperature variation across the specimen at that instant should be as low as possible. Of course, the corresponding temperature variation at that stage is affected by numerous factors, which can also be conveniently associated with the so-called toxicity cost-function [60,61].
With the benchmark case results in mind, five additional scenarios are considered to explore the possibilities of reducing the temperature variation at the end of nanowarming—Cases II–IV in Table 3. These cases are used to demonstrate the unmet need and provide insight into nanowarming protocol optimization by stepwise changing various parameters. Given the numerous parameters involved, a full-blown parametric optimization is left for a future study when an experimental protocol is designed for a particular experimental setup and operational conditions. In this study, the following guidelines have been kept when exploring the nanowarming effects on the heart muscle: (i) the CWR must be exceeded between glass transition temperature and end of nanowarming to avoid RPC; (ii) the nanowarming protocol ends when the lowest temperature in the heart surpasses −35 °C to safely prevent crystallization during CPA unloading; and (iii) the maximum temperature must be below 0 °C at the end of nanowarming, to reduce the CPA toxicity effects [15,55,56], while minimizing the temperature variation at that time is desired for reduced toxicity and liquidus tracking purposes.
Figure 3 displays result from a parametric study on the concentration of the surrounding tissue in a cryobag subject to perfect insulation on the boundaries (an adiabatic boundary condition). As pointed out earlier, the concentration of nanoparticles loaded into the muscle tissue is linked with the nanoparticle concentration contained in the heart chambers for physical reasons [29]. However, it is quite easy to change the nanoparticle concentration in the surrounding domain. It can be seen from Fig. 3(a) that, out of the four surrounding solution concentrations simulated, a 7.5 mg Fe/mL is the minimum concentration that can facilitate rewarming rate above the CWR of VS55. It can be seen from Fig. 3(b) that the latter concentration also leads to the smallest temperature variation across the heart at the end of nanowarming. Note that reducing the nanoparticle concentration below 7.5 mg Fe/mL does not only reduce the rewarming rate below the CWR in some areas but also adversely increases the temperature variation across the organ at the end of rewarming.
Fig. 3.
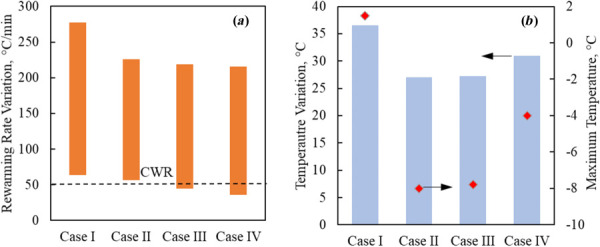
Thermal results for the rat heart muscle contained in a cryobag in Cases I–IV (Table 3): (a) rewarming rates range when the heart muscle temperature is between the glass transition temperature and the end of nanowarming, and (b) temperature variation at the end of nanowarming when the lowest temperature in the heart surpasses −35 °C (bars), and the maximum temperature at the instant (red diamonds)
While Figs. 2 and 3 display the overall range of temperatures and rewarming rates, the spatial points of maximum temperatures and minimum rewarming rate change along the rewarming process. For example, while the highest and lowest temperatures in case I were found at the base of the heart and the endocardium of the heart, respectively, they were found at the interatrial septum and myocardium near the left ventricle, in case IV, respectively (Fig. 4).
Fig. 4.
Temperature distribution superimposed on the rat model at the end of nanowarming in Case IV (Table 3) when the lowest temperature surpasses −35 °C
3.1.2 Boundary Conditions.
While an adiabatic boundary condition would result in uniform rewarming in the ideal case of uniform nanoparticle distribution and when the electromagnet field is excited by a large enough coil [26,31], the results presented above suggest that this may not be the case in some practical conditions even for the same large coil size, resulting from nanoparticle loading into the tissue and its geometry. A potential way to improve temperature uniformity during rewarming is by combining heat exchange with the surrounding in the process. To demonstrate this possibility, two additional cases are considered subject to heat transfer from surroundings at room temperature, and rapid warming to an environment in a controlled-rate cooler, Cases V and VI in Table 3, respectively.
Figure 5 displays results of rewarming in a cryobag for Cases III-VI, where the latter two cases represent the repetition of the first two cases with changes in the boundary conditions only, respectively. It can be seen from Fig. 5 that the heat exchange with the surrounding selected for Cases V and VI leads to improved thermal outcomes: increased minimum rewarming rates about the CWR and decreased maximum temperature variation across the organ at the end of rewarming. Figure 5(c) displays the temperature distribution across the heart and visible surfaces at the end of the nanowarming protocol for case VI. In comparison to case IV (Fig. 4), heat exchange with the surrounding reduces the temperature difference at the end of nanowarming by 8 °C. In particular, the low nanoparticle concentration in the surrounding solution in case VI, together with the nanoparticle concentrations in the heart chambers and muscle, mirror those conditions in a recent experimental investigation, although in a different container (only a partially filled cryobag there) [29]. With the added rewarming conditions suggested in this study, the cryopreservation outcome is expected to improve.
Fig. 5.
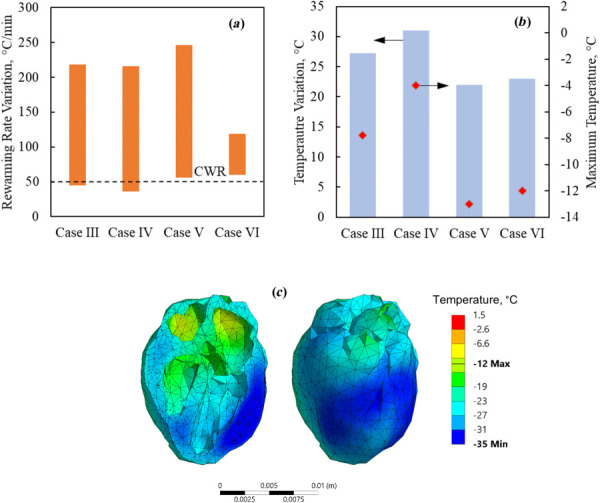
Thermal results for the rat heart muscle contained in a cryobag for Cases III- VI: (a) rewarming rates range when the heart muscle temperature is between the glass transition temperature and the end of nanowarming, (b) temperature variation at the end of nanowarming when the lowest temperature in the heart surpasses −35 °C (bars), and the maximum temperature at the instant (red diamonds), and (c) temperature distribution superimposed on the heart model at the end of nanowarming for Case VI
Based on the information gained from cases III and IV, the specific boundary conditions in Cases V and VI were selected to facilitate the additional heat required to ensure supra-CWR condition throughout the nanowarming stage without increasing the temperature variation at the end of it. While a generalized conclusion that heating at the boundaries is always favorable for nanowarming cannot be drawn, it is demonstrated that such boundary conditions may improve the cryopreservation outcome when selected carefully. Tailoring the optimal boundary condition for cryopreservation must be done for the specific experimental conditions.
3.1.3 Shape and Volume of the Container.
While this study focuses on cryobag as a choice of practice in many concurrent experimental setups, a cylindrical container is a viable alternative as illustrated in Fig. 1(d). One possible adverse effect of the usage of a cylindrical container is related to its potential stiff walls, with implications on the resulting thermomechanical stress [20], which are beyond the scope of this study. For the current comparison, recall that the cryobag in case II is associated with the best thermal results for the adiabatic boundary condition, and hence it serves as a reference hereon.
Figure 6 displays thermal results for case II in Table 3 and the geometrical parameters specified in Table 1 for the rat heart model. In particular, the smaller cylinder represents a tight fit to the rat heart, while the bigger cylinder essentially corresponds to double the diameter and quadruple the volume container. It can be seen from Fig. 6 that the tight-fit cylinder leads to somewhat similar thermal outcomes in terms of rewarming rates and maximum temperature difference compared with rewarming in a cryobag, but that the larger cylinder leads to better results on both counts.
Fig. 6.
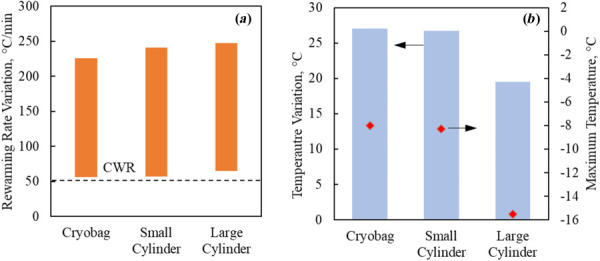
Thermal results for the rat heart muscle contained in a cryobag, small cylindrical container, and a large cylindrical container in Case II (Tables 1 and 3): (a) rewarming rates range when the heart muscle temperature is between the glass transition temperature and the end of nanowarming and (b) temperature variation at the end of nanowarming when the lowest temperature in the heart surpasses −35 °C (bars), and the maximum temperature at the instant (red diamonds)
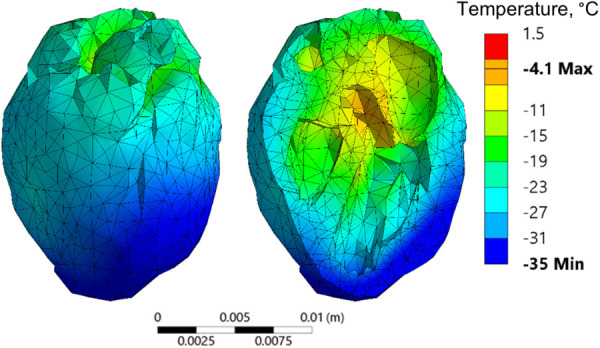
Figure 7 provides more detail relevant to the comparison summarized in Fig. 6, displaying the temperature distribution in the heart cross sections where the lowest temperature in the heart muscle is found (Figs. 7(a) and 7(b)), the corresponding temperature distribution across the heart and the surrounding CPA solution (Figs. 7(c) and 7(d)), and the FEA mesh in that cross section, highlighting the heart geometric model (Figs. 7(e) and 7(f)). Note that the same rat heart model is used in both cases, but the smaller cylinder is selected to tightly fit the heart, while the geometric center of the heart is aligned with the cylinder centerline for the larger container. This difference in positioning results in different heart cross section contours displayed between Figs. 7(e) and 7(f). As can be observed from Fig. 7, placing the heart at the center of a bigger cylindrical container leads to a more uniform temperature distribution of the heart muscle. In comparison with the reference smaller cylinder, similar effects are contributing favorably to moderate the temperature distribution in the cases of an adiabatic larger cylindrical container and a nonadiabatic boundary conditions in the cryobag, as heat from the heart surroundings compensates for reduced nanowarming effect in the heart muscle. Of course, the preferable effect is essentially a matter of specific practical constraints, experimental design, and thermal protocol optimization, while conclusions on the preferred approach cannot be generalized.
Fig. 7.
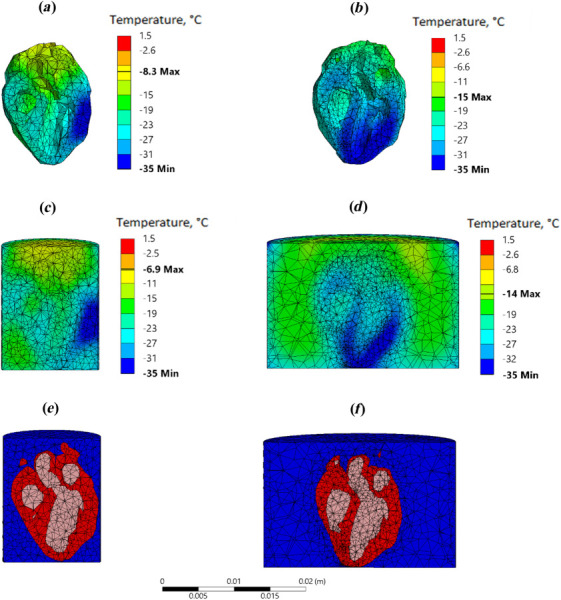
Temperature distribution comparison for rat heart model between a small cylindrical container and a large cylindrical container in Case II (Tables 1 and 3, Fig. 6): (a) and (b) temperature distribution in the heart cross sections where the lowest temperature is found; (c) and (d) the corresponding temperature distribution across the heart and the surrounding CPA solution; and (e) and (f) the FEA mesh in that cross section, highlighting the heart geometric model, where red represents the heart muscle, blue represents the surrounding CPA solution, and pink represents the CPA solution within the heart chambers. Note that the same rat heart model is used in both cases, but the smaller cylinder is selected to tightly fit the heart, while the geometric center of the heart is aligned with the cylinder centerline for the larger container. This difference in positioning results in different heart cross section contours displayed between Figs. 7(e) and 7(f).
3.2 Human Heart Model.
Due to its sheer size, nanowarming of the human heart (about ×270 the volume of the rat heart) presents new challenges, with Fig. 8 displaying a representative temperature distribution that corresponds to conditions same as those of Case II in the rat model study. With a maximum temperature distribution of 106 °C and rewarming rates in the single digits (not presented), improving the rewarming outcomes cannot be merely achieved by modifying the container geometry and/or the boundary conditions. Hence, the approach taken in this study in order identifies favorable conditions for human heart vitrification combines two additional elements: (i) selecting a modified vitrification solution for the analysis, and (ii) modifying the thermal protocol.
Fig. 8.
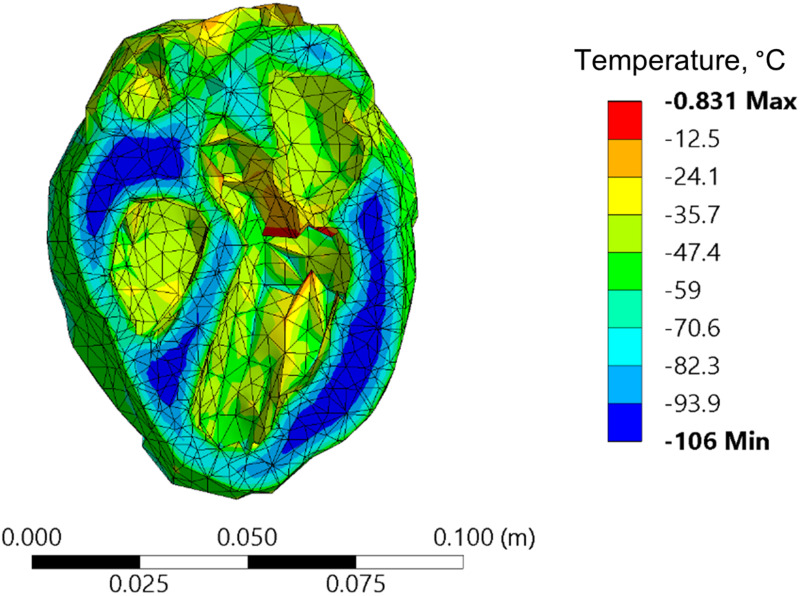
An example of temperature distribution in the human heart model when rewarmed with nanoparticles while following a thermal protocol design for the rat heart model (Case II)
The human heart analysis focuses on the CPA cocktail VS55 combined with 0.6 M sucrose as a SIM, Table 2, which facilitates vitrification even under a similar cooling protocol that was selected for the rat heart model. Recall that the melting temperature (maximum heterogeneous nucleation temperature) may be suppressed by 10 °C or more when 0.6 M sucrose is mixed with VS55. Nonetheless, the rewarming in the human heart case was terminated at the exact same temperature as in the rat heart model (−35 °C) for the purpose of comparison, while increasing the safety margins of warming above the melting temperature from 3 °C to about 13 °C.
While data on sIONP in VS55+sucrose is not available, evaluation of Eq. (2) combined with the human heart size and rat heart analyses results suggests a need for much lower volumetric heat generation. Since the analysis now delves into experimentally uncharted territory, two guiding principles are kept for nanoparticle loading: (i) the ratio of nanoparticle concentration between the various domains is kept consistent with the rat heart experimental study, that is 10 mg Fe/mL in the chambers, 1.47 mg Fe/mL in the heart muscle, and 3.75 mg Fe/mL in the surroundings CPA solution (case VI in Table 3, for example,); and (ii) the analysis focuses on the resulting volumetric heat generation while leaving the selection of the appropriate nanoparticle concentrations and SAR characterization to follow up investigation.
The rewarming portion of the thermal protocol for the human heart analysis was modified as follows: (a) slow cooling chamber rewarming from a storage temperature of −150 °C to −116 °C (1 °C below Tg) at a rate of 1 °C/min; (b) temperature hold when the boundary temperature reaches −116 °C to achieve thermal equilibrium (evaluated by a maximum temperature variation across the heart of less than 0.01 °C); and (c) nanowarming combined with cooling chamber rewarming at a rate of 5 °C/min above −116 °C, subject to an overall heat transfer coefficient of 350 W/m2 °C. The selection of nanowarming power and chamber rewarming rate was done sequentially as described below.
When a lower nanoparticles concentration was searched, the concentrations ratio of 10 to 1.47 to 3.75 was kept unchanged between the chambers, the muscle, and the surroundings, respectively, while adiabatic boundary condition was maintained. In this searching process over a sequence of simulations, the functional dependency of the heat generation on temperature was maintained as with the rat heart model, while the maximum volumetric heat generation rate was reduced repeatedly by a factor of two between consecutive runs. This process started with the values used in the rat heart model and continued until the minimum rewarming rate in the domain reached the CWR. This process yielded a constant heat generation rate of 423 W/m3 below −80 °C, followed by a linearly dependent rate between 423 W/m3 at −80 °C and 206 W/m3 at 0 °C in the chambers of the heart. With these values, the highest temperature was found to be 16 °C when the lowest temperature in the heart muscle surpassed −35 °C. The latter temperature was found on the outer surface of the heart muscle, which was in contact with the cryobag. Next, in order to increase the temperature at the boundary when compared with the temperatures within the domain, the adiabatic condition was replaced with heat exchange between the outer surface and the controlled-rate cooler environment. Here, the upper limit for the overall heat transfer coefficient U, Eq. (3), was selected, and the rewarming rate of the cooling chamber was gradually increased in 1 °C/min increments. Finally, a cooling chamber rewarming rate of 5 °C/min resulted in temperature variation between −35 °C and 0 °C in the heart muscle, while maintaining supra-CWR anywhere in the domain.
Figure 9 displays the resulting thermal history during nanowarming for this example as well as the temperature distribution across the heart at the end of nanowarming, which suggests adequate rewarming rates range and temperature variation at higher temperatures. Nonetheless, points with the coldest temperatures are observed in the areas with the thicker heart muscle walls. It is reemphasized that Fig. 9 displays the results of only one encouraging example for the application of nanowarming to facilitate cryopreservation by vitrification of the human heart. It is envisioned that the unmet need for thermal protocol optimization will intensify with the development of new CPAs, new SIMs, new nanoparticles technology (for example, higher heating, colloidally stable nanoparticles [31]), and advances in experimental techniques.
Fig. 9.
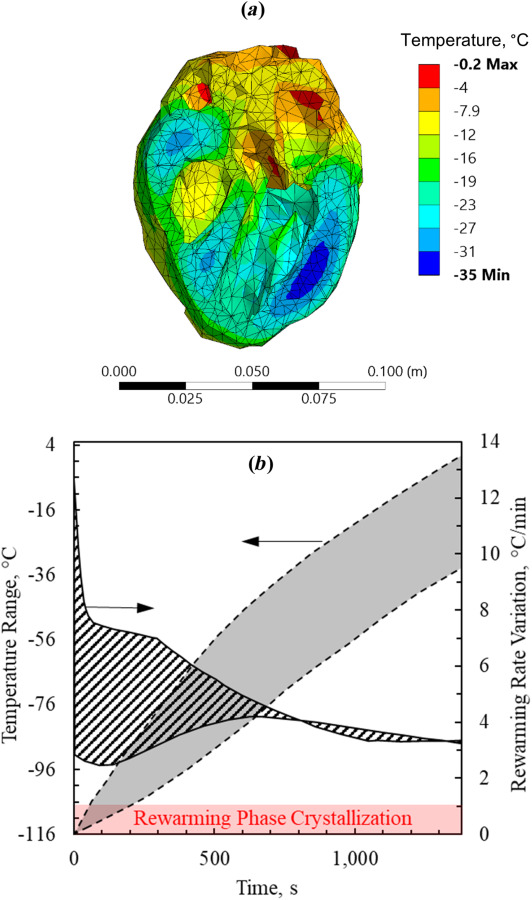
Thermal results for the human heart muscle contained in a cryobag for a modified thermal protocol while assuming properties of VS55 + 0.6 M sucrose: (a) temperature distribution at the end of nanowarming when the lowest temperature in the heart surpasses −35 °C and (b) during the process of nanowarming
4 Summary and Conclusions
The objective of this study is to explore the potential benefits and limitations of nanowarming in the service of cryopreservation by vitrification of the heart. While this study is based on heat transfer modeling, it builds upon recent advances in nanowarming technology [24] and applications [25,26], which were demonstrated experimentally on the rat heart model [29]. This study also includes the analysis of the human heart, which represents a 270-fold size increase from the rat heart.
While a uniform nanoparticle distribution has been shown to lead to uniform rewarming rates across the specimen, this study demonstrates that the thermal history may vary significantly across the organ when realistic geometry and loading parameters are considered. This variation is associated with competing constraints, a combination of which may adversely affect cryopreservation success. For example, it has been demonstrated in some studied cases that significant differences in nanoparticle concentration between the heart muscle and the ventricles may result in either subcritical rewarming rate in some parts of the domain or dangerously elevated temperatures in other parts of the domain, depending on the actual heating power applied. It can be concluded from another example that the need to wait for temperature equilibration above the melting point of the CPA solution may lead to toxicity effects in larger organs, although toxicity has not been modeled explicitly. Finally, it has been demonstrated that the container volume, geometry, and the nanoparticle concentration in the surrounding solution are key parameters that can assist in mitigating those adverse effects.
By using the underlying principles of heat transfer, this study demonstrates that computerized planning of the cryopreservation protocol can increase the likelihood of cryopreservation success, potentially avoiding crystallization, overheating, and elongated tissue exposure to the CPA in higher temperatures. While no single generic thermal protocol can be devised for the successful application of nanowarming, computerized planning can be used to tailor it to a specific organ geometry and physical parameters in order to increase the likelihood of cryopreservation success. This approach could be used in combination with advanced clinical imaging techniques (CT and MRI), which have shown promise for quantifying regional nanoparticle concentrations [27,31–34] and which will serve as a critical input in the computerized planning workflow.
Acknowledgment
Research reported in this paper was supported in parts by the National Heart Lung and Blood Institute (NHLBI) of the National Institutes of Health under (NIH) award numbers R01HL135046 and R01HL127618. This research was also supported in part by the National Science Foundation (NSF) award number EEC 1941543. The content of this paper is solely the responsibility of the authors and does not necessarily represent the official views of the NIH or the NSF.
Funding Data
National Heart Lung and Blood Institute (NHLBI) of the National Institutes of Health under (NIH) (Award Nos. R01HL135046 and R01HL127618; Funder ID: 10.13039/100000002).
National Science Foundation (NSF) (Award No. EEC 1941543; Funder ID: 10.13039/100000001).
References
- [1]. Giwa, S. , Lewis, J. K. , Alvarez, L. , Langer, R. , Roth, A. E. , Church, G. M. , Markmann, J. F. , Sachs, D. H. , Chandraker, A. , Wertheim, J. A. , Rothblatt, M. , Boyden, E. S. , Eidbo, E. , Lee, W. P. A. , Pomahac, B. , Brandacher, G. , Weinstock, D. M. , Elliott, G. , Nelson, D. , Acker, J. P. , Uygun, K. , Schmalz, B. , Weegman, B. P. , Tocchio, A. , Fahy, G. M. , Storey, K. B. , Rubinsky, B. , Bischof, J. , Elliott, J. A. W. , Woodruff, T. K. , Morris, G. J. , Demirci, U. , Brockbank, K. G. M. , Woods, E. J. , Ben, R. N. , Baust, J. G. , Gao, D. , Fuller, B. , Rabin, Y. , Kravitz, D. C. , Taylor, M. J. , and Toner, M. , 2017, “ The Promise of Organ and Tissue Preservation to Transform Medicine,” Nat. Biotechnol., 35(6), pp. 530–542. 10.1038/nbt.3889 [DOI] [PMC free article] [PubMed] [Google Scholar]
- [2]. Lewis, J. K. , Bischof, J. C. , Braslavsky, I. , Brockbank, K. G. M. , Fahy, G. M. , Fuller, B. J. , Rabin, Y. , Tocchio, A. , Woods, E. J. , Wowk, B. G. , Acker, J. P. , and Giwa, S. , 2016, “ The Grand Challenges of Organ Banking: Proceedings From the First Global Summit on Complex Tissue Cryopreservation,” Cryobiology, 72(2), pp. 169–182. 10.1016/j.cryobiol.2015.12.001 [DOI] [PubMed] [Google Scholar]
- [3]. Campbell, B. K. , Hernandez-Medrano, J. , Onions, V. , Pincott-Allen, C. , Aljaser, F. , Fisher, J. , McNeilly, A. S. , Webb, R. , and Picton, H. M. , 2014, “ Restoration of Ovarian Function and Natural Fertility Following the Cryopreservation and Autotransplantation of Whole Adult Sheep Ovaries,” Hum. Reprod., 29(8), pp. 1749–1763. 10.1093/humrep/deu144 [DOI] [PMC free article] [PubMed] [Google Scholar]
- [4]. Mazur, P. , 1984, “ Freezing of Living Cells: Mechanisms and Implications,” Am. J. Physiol, 247(3 Pt 1), p. 4. 10.1152/ajpcell.1984.247.3.C125 [DOI] [PubMed] [Google Scholar]
- [5]. Lakey, J. R. T. , Anderson, T. J. , and Rajotte, R. V. , 2001, “ Novel Approaches to Cryopreservation of Human Pancreatic Islets,” Transplantation, 72(6), pp. 1005–1011. 10.1097/00007890-200109270-00005 [DOI] [PubMed] [Google Scholar]
- [6]. Elami, A. , Gavish, Z. , Korach, A. , Houminer, E. , Schneider, A. , Schwalb, H. , and Arav, A. , 2008, “ Successful Restoration of Function of Frozen and Thawed Isolated Rat Hearts,” J. Thorac. Cardiovasc. Surg., 135(3), pp. 666–673. 10.1016/j.jtcvs.2007.08.056 [DOI] [PubMed] [Google Scholar]
- [7]. Wang, Z. , He, B. , Duan, Y. , Shen, Y. , Zhu, L. , Zhu, X. , and Zhu, Z. , 2014, “ Cryopreservation and Replantation of Amputated Rat Hind Limbs,” Eur. J. Med. Res., 19(1), pp. 1–9. 10.1186/2047-783X-19-28 [DOI] [PMC free article] [PubMed] [Google Scholar]
- [8]. Berz, D. , McCormack, E. M. , Winer, E. S. , Colvin, G. A. , and Quesenberry, P. J. , 2007, “ Cryopreservation of Hematopoietic Stem Cells,” Am. J. Hematol., 82(6), pp. 463–472. 10.1002/ajh.20707 [DOI] [PMC free article] [PubMed] [Google Scholar]
- [9]. Hunt, C. J. , 2011, “ Cryopreservation of Human Stem Cells for Clinical Application: A Review,” Transfus. Med. Hemotherapy, 38(2), pp. 107–123. 10.1159/000326623 [DOI] [PMC free article] [PubMed] [Google Scholar]
- [10]. Basu, P. K. , 1995, “ A Review of Methods for Storage of Corneas for Keratoplasty,” Indian J. Ophthalmol., 43(2), pp. 55–58.https://www.ijo.in/text.asp?1995/43/2/55/25257 [PubMed] [Google Scholar]
- [11]. Kenmochi, T. , Asano, T. , Maruyama, M. , Saigo, K. , Akutsu, N. , Iwashita, C. , Ohtsuki, K. , Suzuki, A. , and Miyazaki, M. , 2008, “ Cryopreservation of Human Pancreatic Islets From Non-Heart-Beating Donors Using Hydroxyethyl Starch and Dimethyl Sulfoxide as Cryoprotectants,” Cell Transplant., 17(1–2), pp. 61–67. 10.3727/000000008783907026 [DOI] [PubMed] [Google Scholar]
- [12]. Baicu, S. , Taylor, M. J. , Chen, Z. , and Rabin, Y. , 2008, “ Cryopreservation of Carotid Artery Segments Via Vitrification Subject to Marginal Thermal Conditions: Correlation of Freezing Visualization With Functional Recovery,” Cryobiology, 57(1), pp. 1–8. 10.1016/j.cryobiol.2008.03.002 [DOI] [PMC free article] [PubMed] [Google Scholar]
- [13]. Fahy, G. M. , Wowk, B. , Wu, J. , Phan, J. , Rasch, C. , Chang, A. , and Zendejas, E. , 2004, “ Cryopreservation of Organs by Vitrification: Perspectives and Recent Advances,” Cryobiology, 48(2), pp. 157–178. 10.1016/j.cryobiol.2004.02.002 [DOI] [PubMed] [Google Scholar]
- [14]. Rall, W. F. , and Fahy, G. M. , 1985, “ Ice-Free Cryopreservation of Mouse Embryos at -196 °C by Vitrification,” Nature, 313(6003), pp. 573–575. 10.1038/313573a0 [DOI] [PubMed] [Google Scholar]
- [15]. Fahy, G. M. , MacFarlane, D. R. , Angell, C. A. , and Meryman, H. T. , 1984, “ Vitrification as an Approach to Cryopreservation,” Cryobiology, 21(4), pp. 407–426. 10.1016/0011-2240(84)90079-8 [DOI] [PubMed] [Google Scholar]
- [16]. Wowk, B. , 2010, “ Thermodynamic Aspects of Vitrification,” Cryobiology, 60(1), pp. 11–22. 10.1016/j.cryobiol.2009.05.007 [DOI] [PubMed] [Google Scholar]
- [17]. Joshi, P. , and Rabin, Y. , 2021, “ Analysis of Crystallization During Rewarming in Suboptimal Vitrification Conditions: A Semi-Empirical Approach,” Cryobiology, in press. 10.1016/j.cryobiol.2021.09.007 [DOI] [PMC free article] [PubMed] [Google Scholar]
- [18]. Solanki, P. K. , Bischof, J. C. , and Rabin, Y. , 2017, “ Thermo-Mechanical Stress Analysis of Cryopreservation in Cryobags and the Potential Benefit of Nanowarming,” Cryobiology, 76, pp. 129–139. 10.1016/j.cryobiol.2017.02.001 [DOI] [PMC free article] [PubMed] [Google Scholar]
- [19]. Eisenberg, D. P. , Bischof, J. C. , and Rabin, Y. , 2016, “ Thermomechanical Stress in Cryopreservation Via Vitrification With Nanoparticle Heating as a Stress-Moderating Effect,” ASME J. Biomech. Eng., 138(1), pp. 1–8. 10.1115/1.4032053 [DOI] [PubMed] [Google Scholar]
- [20]. Eisenberg, D. P. , Steif, P. S. , and Rabin, Y. , 2014, “ On the Effects of Thermal History on the Development and Relaxation of Thermo-Mechanical Stress in Cryopreservation,” Cryog. (Guildf.), 64, pp. 86–94. 10.1016/j.cryogenics.2014.09.005 [DOI] [PMC free article] [PubMed] [Google Scholar]
- [21]. Wusteman, M. , Robinson, M. , and Pegg, D. , 2004, “ Vitrification of Large Tissues With Dielectric Warming: Biological Problems and Some Approaches to Their Solution,” Cryobiology, 48(2), pp. 179–189. 10.1016/j.cryobiol.2004.01.002 [DOI] [PubMed] [Google Scholar]
- [22]. Robinson, M. P. , Wusteman, M. C. , Wang, L. , and Pegg, D. E. , 2002, “ Electromagnetic Re-Warming of Cryopreserved Tissues: Effect of Choice of Cryoprotectant and Sample Shape on Uniformity of Heating,” Phys. Med. Biol., 47(13), pp. 2311–2325. 10.1088/0031-9155/47/13/309 [DOI] [PubMed] [Google Scholar]
- [23]. Ruggera, P. S. , and Fahy, G. M. , 1990, “ Rapid and Uniform Electromagnetic Heating of Aqueous Cryoprotectant Solutions From Cryogenic Temperatures,” Cryobiology, 27(5), pp. 465–478. 10.1016/0011-2240(90)90035-3 [DOI] [PubMed] [Google Scholar]
- [24]. Etheridge, M. L. , and Bischof, J. C. , 2013, “ Optimizing Magnetic Nanoparticle Based Thermal Therapies Within the Physical Limits of Heating,” Ann. Biomed. Eng., 41(1), pp. 78–88. 10.1007/s10439-012-0633-1 [DOI] [PubMed] [Google Scholar]
- [25]. Etheridge, M. L. , Xu, Y. , Rott, L. , Choi, J. , Glasmacher, B. , and Bischof, J. C. , 2014, “ RF Heating of Magnetic Nanoparticles Improves the Thawing of Cryopreserved Biomaterials,” Technology, 02(03), pp. 229–242. 10.1142/S2339547814500204 [DOI] [Google Scholar]
- [26]. Manuchehrabadi, N. , Gao, Z. , Zhang, J. , Ring, H. L. , Shao, Q. , Liu, F. , McDermott, M. , Fok, A. , Rabin, Y. , Brockbank, K. G. M. , Garwood, M. , Haynes, C. L. , and Bischof, J. C. , 2017, “ Improved Tissue Cryopreservation Using Inductive Heating of Magnetic Nanoparticles,” Sci. Transl. Med., 9(379), p. eaah4586. 10.1126/scitranslmed.aah4586 [DOI] [PMC free article] [PubMed] [Google Scholar]
- [27]. Sharma, A. , Rao, J. S. , Han, Z. , Gangwar, L. , Namsrai, B. , Gao, Z. , Ring, H. L. , Magnuson, E. , Etheridge, M. , Wowk, B. , Fahy, G. M. , Garwood, M. , Finger, E. B. , and Bischof, J. C. , 2021, “ Vitrification and Nanowarming of Kidneys,” Adv. Sci., 8(19), p. 2101691. 10.1002/advs.202101691 [DOI] [PMC free article] [PubMed] [Google Scholar]
- [28]. Chiu-Lam, A. , Staples, E. , Pepine, C. J. , and Rinaldi, C. , 2021, “ Perfusion, Cryopreservation, and Nanowarming of Whole Hearts Using Colloidally Stable Magnetic Cryopreservation Agent Solutions,” Sci. Adv., 7(2), p. eabe3005. 10.1126/sciadv.abe3005 [DOI] [PMC free article] [PubMed] [Google Scholar]
- [29]. Gao, Z. , Namsrai, B. , Han, Z. , Joshi, P. , Rao, J. S. , Ravikumar, V. , Sharma, A. , Ring, H. L. , Idiyatullin, D. , Magnuson, E. C. , Iaizzo, P. A. , Tolkacheva, E. G. , Garwood, M. , Rabin, Y. , Etheridge, M. , Finger, E. B. , and Bischof, J. C. , 2021, “ Vitrification and Rewarming of Magnetic Nanoparticle‐Loaded Rat Hearts,” Adv. Mater. Technol., p. 2100873. 10.1002/admt.202100873 [DOI] [PMC free article] [PubMed] [Google Scholar]
- [30]. Solanki, P. K. , and Rabin, Y. , 2021, “ Thermomechanical Stress Analysis of Rabbit Kidney and Human Kidney During Cryopreservation by Vitrification With the Application of Radiofrequency Heating,” Cryobiology, 100, pp. 180–192. 10.1016/j.cryobiol.2021.01.002 [DOI] [PMC free article] [PubMed] [Google Scholar]
- [31]. Gao, Z. , Ring, H. L. , Sharma, A. , Namsrai, B. , Tran, N. , Finger, E. B. , Garwood, M. , Haynes, C. L. , and Bischof, J. C. , 2020, “ Preparation of Scalable Silica-Coated Iron Oxide Nanoparticles for Nanowarming,” Adv. Sci., 7(4), p. 1901624. 10.1002/advs.201901624 [DOI] [PMC free article] [PubMed] [Google Scholar]
- [32]. Ring, H. L. , Sharma, A. , Ivkov, R. , and Bischof, J. C. , 2020, “ The Impact of Data Selection and Fitting on SAR Estimation for Magnetic Nanoparticle Heating,” Int. J. Hyperth., 37(3), pp. 100–107. 10.1080/02656736.2020.1810332 [DOI] [PMC free article] [PubMed] [Google Scholar]
- [33]. Zhang, J. , Chamberlain, R. , Etheridge, M. , Idiyatullin, D. , Corum, C. , Bischof, J. , and Garwood, M. , 2014, “ Quantifying Iron-Oxide Nanoparticles at High Concentration Based on Longitudinal Relaxation Using a Three-Dimensional SWIFT Look-Locker Sequence,” Magn. Reson. Med., 71(6), pp. 1982–1988. 10.1002/mrm.25181 [DOI] [PMC free article] [PubMed] [Google Scholar]
- [34]. Zhang, J. , Ring, H. L. , Hurley, K. R. , Shao, Q. , Carlson, C. S. , Idiyatullin, D. , Manuchehrabadi, N. , Hoopes, P. J. , Haynes, C. L. , Bischof, J. C. , and Garwood, M. , 2017, “ Quantification and Biodistribution of Iron Oxide Nanoparticles in the Primary Clearance Organs of Mice Using T1 Contrast for Heating,” Magn. Reson. Med., 78(2), pp. 702–712. 10.1002/mrm.26394 [DOI] [PMC free article] [PubMed] [Google Scholar]
- [35].University of Minnesota, “Heart Histories | Atlas of Human Cardiac Anatomy,” accessed Dec. 14, 2021, http://www.vhlab.umn.edu/atlas/histories/histories.shtml
- [36].Clement, C. H. , ed., 2009, Adult Reference Computational Phantoms, ICRP Publication 110, Ann. ICRP 39(2). [DOI] [PubMed] [Google Scholar]
- [37]. Vinnakota, K. C. , and Bassingthwaighte, J. B. , 2004, “ Myocardial Density and Composition: A Basis for Calculating Intracellular Metabolite Concentrations,” Am. J. Physiol. Hear. Circ. Physiol., 286(5 55-5), pp. 1742–1749. 10.1152/ajpheart.00478.2003.Myocardial [DOI] [PubMed] [Google Scholar]
- [38]. Tanase, H. , Yamori, Y. , Hansen, C. T. , and Lovenberg, W. , 1982, “ Heart Size in Inbred Strains of Rats,” Hypertension, 4(6), pp. 864–873. 10.1161/01.HYP.4.6.864 [DOI] [PubMed] [Google Scholar]
- [39]. Kusunose, K. , Penn, M. S. , Zhang, Y. , Cheng, Y. , Thomas, J. D. , Marwick, T. H. , Popović, Z. B. , and Popović, P. , 2012, “ How Similar Are the Mice to Men? Between-Species Comparison of Left Ventricular Mechanics Using Strain Imaging,” PLoS One, 7(6), p. e40061. 10.1371/journal.pone.0040061 [DOI] [PMC free article] [PubMed] [Google Scholar]
- [40]. Kaese, S. , and Verheule, S. , 2012, “ Cardiac Electrophysiology in Mice: A Matter of Size,” Front. Physiol., 3, p. 345. 10.3389/fphys.2012.00345 [DOI] [PMC free article] [PubMed] [Google Scholar]
- [41]. Papadimitriou, D. , Xanthos, T. , Dontas, I. , Lelovas, P. , and Perrea, D. , 2008, “ The Use of Mice and Rats as Animal Models for Cardiopulmonary Resuscitation Research,” Lab. Anim., 42(3), pp. 265–276. 10.1258/la.2007.006035 [DOI] [PubMed] [Google Scholar]
- [42]. Feig, J. S. G. , Solanki, P. K. , Eisenberg, D. P. , and Rabin, Y. , 2016, “ Polarized Light Scanning Cryomacroscopy, Part II: Thermal Modeling and Analysis of Experimental Observations,” Cryobiology, 73(2), pp. 272–281. 10.1016/j.cryobiol.2016.06.004 [DOI] [PMC free article] [PubMed] [Google Scholar]
- [43]. Ehrlich, L. E. , Malen, J. A. , and Rabin, Y. , 2016, “ Cryobiology Thermal Conductivity of the Cryoprotective Cocktail DP6 in Cryogenic Temperatures, in the Presence and Absence of Synthetic Ice Modulators,” Cryobiology, 73(2), pp. 196–202. 10.1016/j.cryobiol.2016.07.012 [DOI] [PMC free article] [PubMed] [Google Scholar]
- [44]. Phatak, S. , Natesan, H. , Choi, J. , Brockbank, K. G. M. , and Bischof, J. C. , 2018, “ Measurement of Specific Heat and Crystallization in VS55, DP6, and M22 Cryoprotectant Systems With and Without Sucrose,” Biopreserv. Biobank, 16(4), pp. 270–277. 10.1089/bio.2018.0006 [DOI] [PubMed] [Google Scholar]
- [45]. Wowk, B. , Fahy, G. M. , Ahmedyar, S. , Taylor, M. J. , and Rabin, Y. , 2018, “ Vitrification Tendency and Stability of DP6-Based Vitrification Solutions for Complex Tissue Cryopreservation,” Cryobiology, 82, pp. 70–77. 10.1016/j.cryobiol.2018.04.006 [DOI] [PMC free article] [PubMed] [Google Scholar]
- [46]. Gaur, U. , Lau, S. F. , Wunderlich, B. B. , and Wunderlich, B. , 1983, “ Heat Capacity and Other Thermodynamic Properties of Linear Macromolecules. VIII. Polyesters and Polyamides,” J. Phys. Chem. Ref. Data, 12(1), pp. 65–89. 10.1063/1.555678 [DOI] [Google Scholar]
- [47]. Sheldon, R. P. , and Lane, S. K. , 1965, “ Thermal Conductivities of Polymers II-Polyethylene,” Polymer (Guildford), 6(4), pp. 205–212. 10.1016/0032-3861(65)90042-X [DOI] [Google Scholar]
- [48]. Rios, J. L. J. , and Rabin, Y. , 2006, “ Thermal Expansion of Blood Vessels in Low Cryogenic Temperatures, Part II—Vitrification VS55, DP6, 7.05 M DMSO,” Cryobiology, 52(2), pp. 284–294. 10.1016/j.cryobiol.2005.12.006 [DOI] [PMC free article] [PubMed] [Google Scholar]
- [49]. Zhang, X. , Hendro, W. , Fujii, M. , Tomimura, T. , and Imaishi, N. , 2002, “ Measurements of the Thermal Conductivity and Thermal Diffusivity of Polymer Melts With the Short-Hot-Wire Method,” Int. J. Thermophys., 23(4), pp. 1077–1090. 10.1023/A:1016394104244 [DOI] [Google Scholar]
- [50]. Ehrlich, L. E. , Gao, Z. , Bischof, J. C. , and Rabin, Y. , 2020, “ Thermal Conductivity of Cryoprotective Agents Loaded With Nanoparticles, With Application to Recovery of Preserved Tissues and Organs From Cryogenic Storage,” PLoS One, 15(9), p. e0238941. 10.1371/journal.pone.0238941 [DOI] [PMC free article] [PubMed] [Google Scholar]
- [51]. Mehl, P. M. , 1993, “ Nucleation and Crystal Growth in a Vitrification Solution Tested for Organ Cryopreservation by Vitrification,” Cryobiology, 30(5), pp. 509–518. 10.1006/cryo.1993.1051 [DOI] [PubMed] [Google Scholar]
- [52]. Ehrlich, L. E. , Fahy, G. M. , Wowk, B. G. , Malen, J. A. , and Rabin, Y. , 2018, “ Thermal Analyses of a Human Kidney and a Rabbit Kidney During Cryopreservation by Vitrification,” ASME J. Biomech. Eng., 140(1), p. 011005. 10.1115/1.4037406 [DOI] [PMC free article] [PubMed] [Google Scholar]
- [53]. Solanki, P. K. , and Rabin, Y. , 2020, “ Scaling Effects on the Residual Thermomechanical Stress During Ice-Free Cooling to Storage Temperature,” ASME J. Appl. Mech., 87(10), p. 101003. 10.1115/1.4047420 [DOI] [PMC free article] [PubMed] [Google Scholar]
- [54]. Peyridieu, J. F. , Baudot, A. , Boutron, P. , Mazuer, J. , Odin, J. , Ray, A. , Chapelier, E. , Payen, E. , and Descotes, J. L. , 1996, “ Critical Cooling and Warming Rates to Avoid Ice Crystallization in Small Pieces of Mammalian Organs Permeated With Cryoprotective Agents,” Cryobiology, 33(4), pp. 436–446. 10.1006/cryo.1996.0044 [DOI] [PubMed] [Google Scholar]
- [55]. Clark, P. , Fahy, G. M. , and Karow, A. M. , 1984, “ Factors Influencing Renal Cryopreservation: II—Toxic Effects of Three Cryoprotectants in Combination With Three Vehicle Solutions in Nonfrozen Rabbit Cortical Slices,” Cryobiology, 21(3), pp. 274–284. 10.1016/0011-2240(84)90323-7 [DOI] [PubMed] [Google Scholar]
- [56]. Arakawa, T. , Carpenter, J. F. , Kita, Y. A. , and Crowe, J. H. , 1990, “ The Basis for Toxicity of Certain Cryoprotectants: A Hypothesis,” Cryobiology, 27(4), pp. 401–415. 10.1016/0011-2240(90)90017-X [DOI] [Google Scholar]
- [57]. Farrant, J. , 1965, “ Mechanism of Cell Damage During Freezing and Thawing and Its Prevention,” Nature, 205(4978), pp. 1284–1287. 10.1038/2051284a0 [DOI] [Google Scholar]
- [58]. Wang, L. , Pegg, D. E. , Lorrison, J. , Vaughan, D. , and Rooney, P. , 2007, “ Further Work on the Cryopreservation of Articular Cartilage With Particular Reference to the Liquidus Tracking (LT) Method,” Cryobiology, 55(2), pp. 138–147. 10.1016/j.cryobiol.2007.06.005 [DOI] [PubMed] [Google Scholar]
- [59]. Puschmann, E. , Selden, C. , Butler, S. , and Fuller, B. , 2017, “ Liquidus Tracking: Large Scale Preservation of Encapsulated 3-D Cell Cultures Using a Vitrification Machine,” Cryobiology, 76, pp. 65–73. 10.1016/j.cryobiol.2017.04.006 [DOI] [PubMed] [Google Scholar]
- [60]. Benson, J. D. , Higgins, A. Z. , Desai, K. , and Eroglu, A. , 2018, “ A Toxicity Cost Function Approach to Optimal CPA Equilibration in Tissues,” Cryobiology, 80, pp. 144–155. 10.1016/j.cryobiol.2017.09.005 [DOI] [PMC free article] [PubMed] [Google Scholar]
- [61]. Davidson, A. F. , Glasscock, C. , Mcclanahan, D. R. , Benson, J. D. , and Higgins, A. Z. , 2015, “ Toxicity Minimized Cryoprotectant Addition and Removal Procedures for Adherent Endothelial Cells,” PLoS One, 10(11), p. e0142828. 10.1371/journal.pone.0142828 [DOI] [PMC free article] [PubMed] [Google Scholar]