

Abstract
Technological advances in the field of animal tracking have greatly expanded the potential to remotely monitor animals, opening the door to exploring how animals shift their behaviour over time or respond to external stimuli. A wide variety of animal‐borne sensors can provide information on an animal's location, movement characteristics, external environmental conditions and internal physiological status.
Here, we demonstrate how piecewise regression can be used to identify the presence and timing of potential shifts in a variety of biological responses using multiple biotelemetry data streams. Different biological latent states can be inferred by partitioning a time‐series into multiple segments based on changes in modelled responses (e.g. their mean, variance, trend, degree of autocorrelation) and specifying a unique model structure for each interval.
We provide six example applications highlighting a variety of taxonomic species, data streams, timescales and biological phenomena. These examples include a short‐term behavioural response (flee and return) by a trumpeter swan Cygnus buccinator following a GPS collar deployment; remote identification of parturition based on movements by a pregnant moose Alces alces; a physiological response (spike in heart‐rate) in a black bear Ursus americanus to a stressful stimulus (presence of a drone); a mortality event of a trumpeter swan signalled by changes in collar temperature and overall dynamic body acceleration; an unsupervised method for identifying the onset, return, duration and staging use of sandhill crane Antigone canadensis migration; and estimation of the transition between incubation and brood‐rearing (i.e. hatching) for a breeding trumpeter swan.
We implement analyses using the mcp package in R, which provides functionality for specifying and fitting a wide variety of user‐defined model structures in a Bayesian framework and methods for assessing and comparing models using information criteria and cross‐validation measures.
These simple modelling approaches are accessible to a wide audience and offer a straightforward means of assessing a variety of biologically relevant changes in animal behaviour.
The authors demonstrate how piecewise regression can be used to identify the presence and timing of potential shifts within multiple biotelemetry datasets. These simple modelling approaches are accessible to a wide audience and offer a straightforward means of assessing a variety of biologically relevant changes in animal behaviour.

1. INTRODUCTION
Recent technological advancements in the field of biotelemetry have greatly expanded the potential for remotely monitoring animals (Cagnacci et al., 2010; Hebblewhite & Haydon, 2010; Tomkiewicz et al., 2010). Historically, animals were tracked using very‐high‐frequency (VHF) telemetry, which requires a receiver in close proximity to an animal to triangulate its location (Craighead, 1982). Global positioning system (GPS) transmitters, now the standard for many wildlife studies, are small enough to be placed on bats and songbirds weighing less than 20 grams (Cvikel et al., 2015). In many applications, current GPS technology provides copious fine‐scale data over long study durations and spatial coverages. Other biotelemetry sensors such as accelerometers, temperature‐depth recorders, light‐level geolocators and heart‐rate monitors, also produce valuable, high‐frequency data on physiological and external conditions affecting animals (Cooke et al., 2004; Jonsen et al., 2007; Wilmers et al., 2015). Raw measurements (e.g. location, acceleration, body temperature) or derived metrics (e.g. net‐squared displacement for distance moved over time, overall dynamic body acceleration (ODBA) for energy expenditure: Wilson et al., 2006; Bunnefeld et al., 2011) can elucidate behavioural patterns (foraging, migration, predator/prey dynamics) and provide information about demographic parameters such as fecundity and survival; however, processing high‐volume data can be complex and time‐consuming (Brooks et al., 2019; Hamilton et al., 2017; Kramer et al., 2018). Flexible and widely accessible tools are necessary to facilitate efficient analysis of animal biotelemetry data to examine behaviour over time and response to external stimuli (Patterson et al., 2017).
Analyses of biotelemetry data collected at a high frequency often begin by partitioning datasets into homogeneous segments that correspond to different behavioural states (Edelhoff et al., 2016). Some common segmentation methods include (1) clustering algorithms that minimize a cost function associated with statistical properties of a time series (e.g. the pruned exact linear time algorithm or the penalized contrasts method; Lavielle, 2005; Killick et al., 2012), (2) model‐based approaches that use moving windows to identify shifts in behavioural responses (e.g. behavioural change point analysis [BCPA]; Gurarie et al., 2009; or correlated velocity models; Gurarie et al., 2017) or (3) parametric state‐space or hidden Markov models (HMMs) that explicitly model transitions between latent behavioural states (Glennie et al., 2022; Patterson et al., 2008). Often, these methods require restrictive assumptions (e.g. data are Normally distributed or error and correlation structures are fixed), are computationally intensive, or are restricted to a single data type, such as GPS telemetry (Morelle et al., 2017). Here, we demonstrate how piecewise regression can be used to analyse a wide range of biotelemetry datasets, offering a flexible and user‐friendly approach with easily interpretable results.
1.1. Overview of piecewise regression and applications with the mcp package
Piecewise regression is a statistical method used to model ecological thresholds (Toms & Lesperance, 2003) and can be used to identify change points that signify potential shifts in the relationship between response and explanatory variables (Muggeo, 2003; Toms & Villard, 2015). Piecewise regression is an extremely flexible modelling framework due to the ability to specify unique model structures for each segment between change points. Transitions between segments can be smooth, if segments are joined (meaning segments share a common endpoint), or abrupt, if segments are disjoint (not sharing a common endpoint).
Herein, we focus on a Bayesian formulation of piecewise regression following the formulation of Stephens (1994). Let be the realization of a sequence of random variables of length n, with a change point at . We can write the distribution of as
where and are parameter vectors describing the data‐generating process before and after the change point, respectively. Values of can describe various characteristics of the response distributions, including their means, variances or correlation structures.
Inference is made via the posterior distribution of , and , denoted by :
where , and are prior distributions for the parameters describing the data‐generating process. This approach easily extends to multiple change points, with unique parameter vectors, , describing the likelihood of within each segment.
Consider a simple example represented by separate intercepts before and after a single change point. Let r be the location of the change point along the x‐axis, where the expected value of , , changes from , to :
and can represent combinations of additive or multiplicative effects of covariates. The R package mcp, developed by Lindeløv (2020), implements piecewise regression as described thus far and has broad applicability beyond ecological data.
The mcp package uses indicator functions to map elements of a dataset (i.e. segments) to statistical models specific to each segment. For a dataset with as the response variable and as the predictor variable, a two‐intercept case is written as:
model=list(y~1, # first intercept, slope = 0 for this segment ~1 # second intercept, slope = 0 for this segment)
Specifying a model structure with a joined segment is also straightforward:
model=list( y~1, # intercept, slope = 0 for this segment~0+x # joined slope sharing the same intercept)
The ‘~0’ term specifies that the second segment shares the same intercept, whereas the ‘+ x’ term assigns a slope term associated with the variable such that the slope is 0 before the change point and afterwards.
The mcp package allows custom model structures for each segment and provides a wide range of statistical distributions and link functions. Model parameters are given suitable vague prior distributions, although these can easily be altered (Lindeløv, 2020). Hierarchical models with random effects can be specified by allowing change points to covary within a group, thereby allowing the estimation of individual‐specific and population‐level change point parameters.
Another advantage of the mcp package is the combination of a user‐friendly interface connected to a robust Bayesian modelling backend. The model structure for each segment uses the familiar syntax of the lme4 and brms packages, then is converted ‘on‐the‐fly’ to JAGS code, (Bates et al., 2014; Bürkner, 2017) and future versions of mcp will have the option of using Stan as a backend. The mcp package returns samples from the marginal posterior distributions for all change points and model parameters, which can be used to visualize model output and produce credible intervals (Gabry et al., 2019).
The mcp package provides robust options for model assessment and comparison, hypothesis testing and data simulation. Markov‐chain Monte Carlo (MCMC) sampler performance can be checked via the Gelman–Rubin statistic, effective sample size and MCMC trace plots. Posterior predictive checks ensure that the fitted model is consistent with the data‐generating process (i.e. simulations from the fitted model resemble the original data; Gelman et al., 1996; Gelman & Shalizi, 2013), and the influence of the priors can be evaluated by comparing prior‐posterior overlap (Youngflesh, 2018). The predictive performance of multiple models can be compared with leave‐one‐out cross‐validation (LOO‐CV), either using WAIC (Widely Applicable Information Criterion) or ELPD (Expected Log Predictive Density), as estimated by the loo package (Gelman et al., 2014; Vehtari et al., 2017). If the ideal number of change points is not known a priori, LOO‐CV allows comparison of the predictive performance of multiple models to determine an optimal number or to compare different model structures and prior distributions. Additionally, hypothesis testing can be performed using point Bayes factors (i.e. the prior‐to‐posterior ratios associated with specific parameter values; Verdinelli & Wasserman, 1995; Wagenmakers et al., 2010); Bayes factors can also be used to compare models that represent alternative hypotheses and for model averaging (Hooten & Hobbs, 2015; Kass & Raftery, 1995).
2. EXAMPLE APPLICATIONS
We demonstrate the use of piecewise regression using the mcp package with six example applications highlighting a variety of taxonomic species, data streams, timescales and biological phenomena. All of our R code is publicly available at the Data Repository for University of Minnesota (https://doi.org/10.13020/qbha‐bs48).
2.1. Identification of altered behaviour post‐capture
Effects of capture, handling and transmitter deployment are not well understood for many species, especially in the period immediately post‐capture. Efforts to quantify animal response have predominantly focused on effects of the transmitter itself (i.e. the weight and aerodynamics of the unit, usually in birds: Evans et al., 2020) or on the physiological effects from chemical immobilization (typically in large mammals: Barron et al., 2010; Brivio et al., 2015; Thompson et al., 2020). Most researchers have sought to quantify effects on vital rates, such as survival and fecundity (Casas et al., 2015; DelGiudice et al., 2005; Lameris & Kleyheeg, 2017) or short‐term ethological responses such as changes in the time spent grooming (Kölzsch et al., 2016; Rachlow et al., 2014). Because capture and handling may result in a short‐term period of altered movement behaviour (Picardi et al., 2021), it is common to remove data from the first week or two post‐capture, although often without biological or empirical justification for the threshold used to filter the data.
Arbitrarily filtering data without knowledge of the existence and duration of capture effects presents issues for movement‐related analyses. Removing data potentially discards useful information, which may already be scarce in studies using VHF telemetry or with small sample sizes (Girard et al., 2002). Alternatively, quantifying behavioural responses post‐capture can provide useful species‐specific information on altered behaviour and inform future studies (Dechen Quinn et al., 2012; Picardi et al., 2022). For example, Stabach et al. (2020) examined effects of GPS collar deployment on scimitar‐horned oryx Oryx dammah to quantify the short‐term responses in activity, behaviour, stress levels and the length of time before these effects subsided.
The effects of capture and handling on movement may also provide insights into how individuals respond to risky situations (e.g. capture, predation). For example, animals may exhibit a ‘flee and return’ response, the strength of which may be indicative of their tolerance of risk as it relates to a fecundity‐survival trade‐off (Ghalambor & Martin, 2001; Montgomerie & Weatherhead, 1988). DelGiudice et al. (2015) documented that capture of moose Alces alces neonates caused some mothers to abandon their calves, and Obermoller et al. (2019) found that adult female moose frequently fled when their calves were depredated and then returned after the risk had subsided. These responses suggest that many adult female moose favour individual survival over protection of their young. Other studies have found similar ‘flee and return’ responses to human activity such as hunting or helicopter‐based capture (Jung et al., 2019; Thurfjell et al., 2013).
In an ongoing study of trumpeter swan Cygnus buccinator movement ecology, we observed a swan leaving the capture area and returning a short time later (D. W. Wolfson, unpubl. data). To determine the prevalence of this behaviour, we needed an objective method for identifying ‘flee and return’ responses immediately post‐capture. By fitting a model with a single intercept (representing no flee) and another with two intercepts (representing a flee and return), we were able to compare these two models with cross‐validation. Figure 1 shows the results of a piecewise regression model for an individual trumpeter swan fit to the relationship between Net‐Squared Displacement (NSD) and time since capture:
FIGURE 1.

Hourly net‐squared displacement measured from the point of release of a trumpeter swan Cygnus buccinator after collar deployment. Grey lines show 25 draws from the posterior distribution, with 95% credible intervals for the mean response shown as red dotted lines. The posterior distribution for the change point is shown in blue on the x‐axis.
model=list(NSD~1, # distance of ‘flee’ response from capture site~1 # stable return distance from capture site)
The NSD value of the first intercept quantifies how far the swan fled and the change point reveals when a return to the capture site occurred. This model, which has two segments with different intercepts and a single change point, had a better fit using LOO‐CV to estimate ELPD, a goodness‐of‐fit measure that estimates the predictive accuracy of a model while balancing the trade‐offs of bias and variance, than an alternative model with a single intercept, suggesting the presence of a flee response (Table 1).
TABLE 1.
Leave‐one‐out cross‐validation used to compute the estimated log predictive density (ELPD) of two different models; one fit with a single intercept and the other with two intercepts separated by a change point. The higher ELPD for the model with two intercepts indicates that it has a higher predictive accuracy
| Model syntax | ELPD difference | SE of difference |
|---|---|---|
| Two intercepts | 0.0 | 0.0 |
| One intercept | −213.3 | 64.2 |
Protocols for capturing and marking trumpeter swans were approved by the University of Minnesota Animal Care and Use Committee (protocol no. 1905‐37072A) and authorized under permits from the Minnesota Department of Natural Resources (Special Permit no. 19017), the U.S. Fish and Wildlife Service (Research & Monitoring Special Use Permit no. K‐10‐001) and the U.S. Geological Survey Bird Banding Laboratory (Federal Bird Banding Permit no. 21631). All other example applications use data collected from other studies.
2.2. Pre‐parturition movement
Accurate estimation of vital rates and their contributions to population dynamics is an essential tenet for population management (Coulson et al., 2005). Signals in movement data can reveal important biological events such as parturition in large ungulates, which relate to fecundity. Although fecundity is a key vital rate, detection of the timing and location of parturition can be difficult, especially in ‘hider’ species that have low parental care of neonates (Lent, 1974; Ralls et al., 1986).
Pregnant ungulates typically make a long‐distance movement immediately preceding parturition and then remain sedentary in areas that may have lower predation risk while still providing sufficient foraging opportunity (Berg, 2019; McGraw et al., 2014). Patterns in movement data thus offer a cost‐effective means for identifying parturition in radio‐collared ungulates (DeMars et al., 2013; Nicholson et al., 2019; Peterson et al., 2018). Although multiple methods have been used to infer parturition events, many are sensitive to parameter choices or involve visual observation of movement metrics, which can be time‐intensive (Dettki & Ericsson, 2008; Mohr et al., 2022).
To demonstrate remote identification of parturition, we provide an example of quantifying movements of a pregnant moose (Figure 2). Severud et al. (2015) confirmed the parturition period by locating the twin calves shortly after their birth. In this case, the first segment is modelled with an intercept and slope of zero, representing typical moose movement, and the second segment is modelled with a change in the mean displacement (i.e. a different intercept) and also a change in variance (‘sigma’ in code below) that is representative of a shift to more sedentary movement at time of parturition.
FIGURE 2.

Displacement (distance from each location to the location at the start of the observation period) for a pregnant moose Alces alces. The green area is the period identified by researchers as immediately preceding parturition. Grey lines represent 25 draws from the posterior distribution of the mean displacement. Red dotted lines depict 95% credible intervals for the mean displacement and green dotted lines depict 80% prediction intervals. The posterior distribution for the change point is shown in blue on the x‐axis.
model<‐list(NSD~1, # baseline moose NSD~1+sigma[1] # movement spike and decreased variability)
LOO‐CV of this model versus one without a change in variance indicated that this model is a better fit to the data, thus illustrating the flexibility in adapting model syntax for each segment that corresponds to the biological situation. Prediction intervals illustrate that the addition of a change in variance for the second segment provides increased precision, therefore allowing the model syntax to reflect the more sedentary behaviour (Figure 2).
Parturition events can be monitored in real time for studies involving the capture of neonates (Figure 2; Obermoller et al., 2019) or identified post‐hoc for retrospective analyses of ungulate breeding and fecundity (Bonar et al., 2018; Long et al., 2009). Previous studies have used piecewise regression to identify change points indicative of ungulate parturition, but the mcp package can provide additional functionality such as informed priors for the change point, cross‐validation and simulation from the fitted model (Berg et al., 2021).
Posterior predictive checks can be used to determine if the model can provide an adequate representation of the data (Gelman et al., 1995); data () are generated from the fitted model by simulating from the posterior predictive distribution and then compared to the observed data () (Hobbs & Hooten, 2015). We demonstrate this approach using the fitted model for moose movement (Figure 3). The two peaks at 3 and 12 km correspond to the two intercepts fit by the model, and overall, the distribution of the simulated and observed data are similar.
FIGURE 3.

A kernel density posterior predictive check compares the distribution of observed outcomes (displacement in kilometres by a pregnant moose Alces alces), shown in the black line, against 50 distributions of replicated datasets produced by the fitted model, each shown as a light blue line.
2.3. Physiological response to drone fly‐over
Remotely piloted aircraft (hereafter drones) allow increased opportunity for remotely monitoring wildlife populations, and recent reductions in their cost have led to widespread adoption as an alternative to traditional aerial surveys (Watts et al., 2010). Drones equipped with remote sensors are now commonly used to estimate animal abundance in remote locations, collect fine‐grain aerial imagery and monitor poaching activities (Anderson & Gaston, 2013; Linchant et al., 2015). The use of drones can decrease costs, reduce the need for hazardous fieldwork and be coupled with computer vision methods to increase the quality and precision of data collection (Chabot & Francis, 2016; Hodgson et al., 2018; Seymour et al., 2017).
Despite the advantages of drones, their presence can influence behaviour or elicit a physiological response in the study species, especially when flown at low altitudes (McEvoy et al., 2016; Mulero‐Pázmány et al., 2017). Drones have been shown to have detrimental effects on wildlife at both immediate (e.g. increased vigilance and decreased foraging behaviour) and long‐term scales (e.g. decreased reproduction and population declines: Blickley & Patricelli, 2010; Senzaki et al., 2020; Shannon et al., 2016). Most studies investigating effects of drones have focused on external responses, such as altered movement and behaviour, whereas internal physiological responses have been limited to quantifying levels of glucocorticoids (e.g. cortisol and corticosterone: Baker et al., 2013; Bennitt et al., 2019; Millspaugh & Washburn, 2004; Vas et al., 2015).
Recently, telemetry data have been paired with physiological data, allowing for new insights into the response of animals to anthropogenic stimuli. Ditmer et al. (2015) measured changes in movement and heart rate levels of black bears Ursus americanus affixed with GPS collars and internally implanted cardiac biologgers during controlled drone flyovers. Although drones rarely elicited an external behavioural response in black bears, heart rate levels were strongly correlated with proximity of drones overhead (Ditmer et al., 2015).
We used piecewise regression to model the relationship between drone presence and black bear heart rate. We include two segments, the initial segment includes an intercept capturing the baseline heart rate of the bear, and the second segment contains a separate intercept (representing the spike in heart rate in response to the drone) and a disjoined slope term reflecting the heart rate gradually decreasing after the initial spike.
model<‐list(HeartRate~1, # intercept for stable background HR~1+time) # HR spike and slope of recovery rate
Figure 4 shows the relationship between drone presence and black bear heart rate in beats per minute (bpm) before and after a controlled flight.
FIGURE 4.

Heart rate of a black bear Ursus americanus in relation to a drone flight. The green box indicates the duration of a drone flight. Grey lines represent 25 draws from the posterior distribution of the mean response. Red dotted lines depict the 95% credible intervals for the mean response. The posterior distribution for the change point is shown in blue on the x‐axis.
The flexibility of piecewise regression to accommodate different model structures for each segment allows for identification of the timing, magnitude and acclimation rate of the stress response caused by the drone presence, thus providing biologically meaningful parameters for each segment.
As shown in Table 2, the change point is estimated to occur approximately 65 (95% credible interval = 63–66) minutes into the observation period, after which the heart rate is estimated to increase by 116 bpm (Intercept 2–Intercept 1) once the drone appears, and then decrease by 0.78 bpm with every minute that passes. If the recovery rate is static, the black bear will return to baseline heart rate (represented by Intercept 1) in approximately 2.5 hr ((Intercept 2–Intercept 1)/Time in minutes = 149 minutes). Lastly, the Sigma parameter captures the variability in heart rate about the overall trend.
TABLE 2.
A summary of output from the model looking at the black bear Ursus americanus heart rate response to a drone flyover
| Model parameter | Posterior mean | Lower CL (2.5%) | Upper CL (97.5%) |
|---|---|---|---|
| Change point 1 | 64.77 | 62.89 | 66.00 |
| Intercept 1 | 43.83 | 39.86 | 47.79 |
| Intercept 2 | 160.14 | 150.22 | 169.43 |
| Time (in minutes) | −0.78 | −1.08 | −0.46 |
| Sigma | 10.92 | 8.95 | 13.07 |
2.4. Mortality signal from acceleration and temperature data
Accurate estimates of vital rates such as survival and fecundity are necessary for modelling population growth. Survival rates can be estimated using mark‐recapture methods, but for wide‐ranging migratory species, individuals in subsequent years may not be resighted due to three possibilities: mortality, emigration or missed detection (Anders & Marshall, 2005). Because it is difficult to separate these components, biologists are often forced to estimate ‘apparent’ survival, as opposed to true survival (Lebreton et al., 1992).
Many studies have illustrated the importance of evaluating vital rates over the entire annual cycle (Rushing et al., 2017; Sillett & Holmes, 2002). The miniaturization of GPS devices now allows for a more direct accounting of survival during the breeding, migration and overwintering seasons (Kays et al., 2015). Increased precision in vital rates during different seasons (and of different age and sex classes) can better inform ecological studies considering life‐history trade‐offs between survival and fecundity, especially concerning survival during migration periods (Buechley et al., 2021; Cheng et al., 2019; Flack et al., 2016).
Despite the advantages that GPS telemetry can offer to survival rate estimation, mechanical failure of transmitters can obscure whether the true fate was mortality or equipment failure. Recovery of a GPS transmitter after a mortality event can be logistically difficult for species that migrate long distances. Different methods have been used to infer mortality versus transmitter failure from transmitter signals (Buechley et al., 2021; Sergio et al., 2019). A common approach is a visual assessment of whether locations appear to be stationary; however, this approach may lead to inconsistencies due to subjective evaluation (Koczur et al., 2017; Nygård et al., 2016; Rotics et al., 2017).
Sensor data such as battery voltage, temperature and accelerometry are increasingly being used to diagnose mortality versus transmitter failure (Burnside et al., 2016; Ely & Meixell, 2016; Hewson et al., 2016). Mortalities often coincide with shifts in the trend or variability in transmitter data; therefore, piecewise regression can be used to identify change points that indicate mortality. This approach can also be extended to monitor nest success with temperature loggers (Hartman & Oring, 2006; Sutti & Strong, 2014; Zangmeister et al., 2009). As part of an ongoing trumpeter swan study (D. W. Wolfson, unpubl. data), we evaluated whether we could remotely detect mortality using piecewise regression models fit separately to ODBA, a proxy for energy expenditure, and temperature data from a confirmed mortality event (Figure 5).
FIGURE 5.
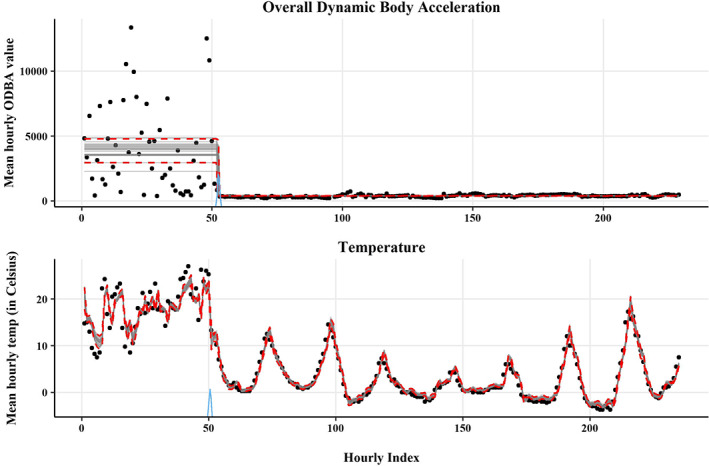
The x‐axis is an index of time since the start of the time series for overall dynamic body acceleration on the top figure and temperature on the bottom figure for a trumpeter swan Cygnus buccinator. Grey lines show 25 draws from the posterior distribution, with 95% credible intervals for the mean response shown as red dotted lines. The posterior distribution for the change point is shown in blue on the x‐axis.
The ODBA model includes a change point separating two segments with differing means and variances.
model<‐list(ODBA~1, # baseline energy expenditure level~1+sigma[1]) # activity drop and decreased variability
The temperature model has a change point separating the first segment, which is modelled with an intercept and a first‐order autoregressive residual term, and the second segment, which is modelled with an intercept and a third‐order autoregressive residual term. A kth order autoregressive term models the correlation in residuals from previous values in the time series and is ideal for data such as temperature that is highly temporally correlated. We allow for autocorrelation by assuming the residuals of the first segment are a function of residuals at time t‐1, and the residuals of the second segment are a function of the residuals at time t − 1, t − 2 and t − 3 (see the full annotated code and a short tutorial on choosing autoregressive terms in the open‐access data repository). Both models showed a clear distinction at the change point representing mortality of the collared swan.
model<‐list(temp~1+ar(1), # collar temp tracks live swan temperature~1+ar(3)) # collar temp tracks ambient air temperature
2.5. Migration phenology including stopovers
Seasonal migration allows species to optimize energetic budgets and undergo reproductive cycles while avoiding harsh environmental conditions and low food availability (Newton, 2010). Knowledge of migration phenology throughout the annual cycle can inform management activities such as timing of water drawdowns and annual surveys to occur during peak migration, advance understanding of disease dynamics based on timing and overlap with other species, and reveal a species' capacity to adapt their migratory timing in response to climate change to preserve optimal breeding conditions and peak food availability (Donnelly et al., 2019; Moller et al., 2008; Newman et al., 2009; Thurber et al., 2020).
Despite the importance of understanding migration phenology, consistent reproducible methods for determining departure and arrival dates have not yet become commonplace (Cerritelli et al., 2020; Soriano‐Redondo et al., 2020). A simple repeatable approach is to segment phases of the migration cycle based on date ranges informed from prior studies (Takekawa et al., 2010; Wolfson et al., 2017a). Other approaches include using a spatial threshold, based on either the absolute distance from the capture origin, breeding territory, or last location; a spatiotemporal threshold, based on a certain distance moved within a period; or a crossing of a chosen latitude or landmark (Flack et al., 2016; Giunchi et al., 2019; Rotics et al., 2016). Although these approaches may yield useful estimates of migration phenology, they often rely on arbitrary criteria or species‐specific thresholds, which limits the ability to generalize to other study systems.
Model‐based methods, including non‐linear theoretical movement models fit to NSD, are also commonly used to estimate migration phenology (Börger & Fryxell, 2012; Bunnefeld et al., 2011; de Grissac et al., 2016; Spitz et al., 2017). Using piecewise regression to segment an annual cycle based on NSD allows for a model‐based approach but is more flexible than typical NSD modelling sensu Bunnefeld et al. (2011) and can also provide additional information on the timing and duration of stop‐overs that is not attainable using traditional NSD‐based methods.
We demonstrate the utility of piecewise regression in assessing movements during the annual cycle of a migratory bird using a NSD time‐series of sandhill crane Antigone canadensis locations in North America (Figure 6; Wolfson et al., 2017b; Wolfson, 2018). Although a basic three‐intercept model would sufficiently discriminate the summer and winter periods, adding additional intercepts reveals each major staging area that the crane used.
FIGURE 6.

An annual migration cycle of a sandhill crane Antigone canadensis. Average daily displacement from the breeding territory (in kilometres) on the y‐axis, and an index of time since the start of the time series on the x‐axis. Grey lines show 25 draws from the posterior distribution, with 95% credible intervals for the mean response shown as red dotted lines and 80% prediction intervals in green dotted lines. The posterior distributions for the change points are shown in blue on the x‐axis.
model<‐list(NSD~1, # summer breeding territory in Minnesota~1, # first fall staging area in Nebraska~1, # second fall staging area in Oklahoma~1, # over‐wintering area along Texas coast~1, # spring staging area in Nebraska~1) # summer breeding territory in Minnesota
The ideal number of stopover sites can be visually examined or empirically derived using cross‐validation to compare multiple models with differing number of change points. We demonstrate a data‐driven model selection method by fitting seven separate models with increasing numbers of intercepts. Table 3 shows that the model with six intercepts (representing two spring staging areas and one fall staging area) is the most well supported using ELPD as a model comparison metric and that adding additional intercepts does not increase the predictive accuracy.
TABLE 3.
Leave‐one‐out cross‐validation was used to compute the estimated log predictive density (ELPD) for seven models of migration phenology of a sandhill crane Antigone canadensis, each with an increasing number of intercepts. The highest ELPD for the model with six intercepts indicates that it has the highest predictive accuracy
| Model syntax | ELPD difference | SE of difference |
|---|---|---|
| Six intercepts | 0.00 | 0.00 |
| Five intercepts | −0.48 | 0.83 |
| Seven intercepts | −19.59 | 32.82 |
| Four intercepts | −24.73 | 9.52 |
| Two intercepts | −57.39 | 14.01 |
| Three intercepts | −324.69 | 16.93 |
| One intercept | −336.17 | 16.73 |
2.6. Segmentation of nesting stages
The timing of nest creation, incubation and hatching events can inform understanding of nest success, juvenile survival and local recruitment. Climate change is advancing the onset of spring, especially in the Arctic, where earlier snowmelt allows some species to adapt their breeding cycles to match changing conditions (Lameris et al., 2018; Nolet et al., 2020). Although data on the timing of breeding are critical to understanding reproduction, locating and regularly monitoring active nests is labor‐intensive and unfeasible in many remote locations (Schreven et al., 2021).
As part of an ongoing trumpeter swan study (D. W. Wolfson, unpubl. data), we collected visual observations on a focal sample of collared swans several times a week during the breeding season to determine nesting status (building a nest, incubation, eggs hatched and cygnets present). We also collected fine‐scale accelerometry data from each observed swan's GPS‐GSM collar to evaluate if we could infer nesting status from ODBA values, representing activity levels. We used the visual observation dataset to ground‐truth model output from piecewise regression applied to a collared swan in the following case study.
Between 1 April and 7 July, 2021, we collected 19 observations of nesting status and 735,311 tri‐axial accelerometer readings taken in 3‐s bursts at 10 Hz every 5 min that were converted to average hourly ODBA values (Figure 7).
FIGURE 7.

The top plot shows the accelerometer sensor dataset for a nesting trumpeter swan Cygnus buccinator, with time on the x‐axis expressed in hourly time intervals and averaged ODBA values on the y‐axis. The bottom plot shows the 19 data points from the visual observation dataset with the estimated hatch date (the midpoint between the last incubation observation and the first cygnet observation; purple dotted line).
We predicted that a shift to higher activity levels would occur once cygnets were present and expected that the change point for a model with two segments with varying intercepts would accurately predict the time of egg hatching.
model<‐list(ODBA~1, # intercept for activity levels during incubation~1) # intercept for increased activity levels post‐incubation
[Correction added on 15 August 2022, after first online publication: The duplication of 'increased' has been deleted in the code.]
Table 4 shows that the model with two intercepts was the best choice at fitting the data based on LOO‐CV using ELPD.
TABLE 4.
Leave‐one‐out cross‐validation used to compute the estimated log predictive density (ELPD) of three different models of trumpeter swan Cygnus buccinator activity; one fit with a single intercept, one with two intercepts and one with three intercepts. The higher ELPD for the model with two intercepts indicates that it has a higher predictive accuracy
| Model syntax | ELPD difference | SE of difference |
|---|---|---|
| Two intercepts | 0.0 | 0.0 |
| Three intercepts | −9.9 | 7.3 |
| One intercept | −188.4 | 19.0 |
The piecewise regression model was able to estimate the transition based on a shift in mean activity levels using remotely sensed data (Figure 8).
FIGURE 8.

Date is on the x‐axis and average hourly overall dynamic body acceleration for a trumpeter swan Cygnus buccinator is on the y‐axis. The coloured markers just above the x‐axis correspond to visual observations of the swan's nesting status. The dashed vertical line in purple is the observed transition from incubation to cygnets, and the solid brown line is the estimated change point from the piecewise regression model. Grey lines show 25 draws from the posterior distribution, with 95% credible intervals for the mean response shown as red lines.
3. DISCUSSION
As we demonstrated with examples of birth, death, migration and behavioural responses (both internal and external), piecewise regression is a flexible tool for identifying a wide variety of biological phenomena across different taxa and data types. When analysing data, we recommend fitting a limited number of models that attempt to capture specific biological hypotheses in the style of Chamberlin's framework of multiple working hypotheses (Chamberlin, 1890; Elliott & Brook, 2007). For example, in the first case study, we highlight two model syntaxes that represent different biological responses (one intercept represents the absence of a flee response, two intercepts indicate a flee and return). ELPD or WAIC, calculated using cross‐validation can then be used to evaluate support for each hypothesis. The mcp package also provides functionality for null‐hypothesis testing and interval estimation for any model parameter within a fitted model object (Lindeløv, 2020).
Piecewise regression, and change point detection in general, is most appropriate when the objective is to partition a dataset into a limited number of heterogeneous segments that may correspond with different biological states. Alternative approaches, such as HMMs or BCPA, may be more appropriate when the goal is to identify recurring behavioural states (e.g. resting and foraging) using information derived from movement metrics (e.g. step lengths, turning angles). Although piecewise regression could be used in these situations, it will often be slower due to the computational challenges of estimating a large number of change points. Similar to BCPA, piecewise regression would also require a two‐step approach in which segments are first identified and then later grouped into homogeneous categories. Unlike BCPA, however, the response data do not have to be Normally distributed when using mcp.
Many R packages can detect change points, although each has unique pros and cons. Several require a user‐defined threshold to detect change points, such as changepoint (Killick & Eckley, 2014), bcp (Erdman & Emerson, 2007) and ecp (James & Matteson, 2014), but the selection of a threshold value may often be species‐specific and hard to generalize. The changepoint package, which only identifies change points based on abrupt changes in the mean or variance, may be a good option for a simple segmentation analysis, but it does not estimate uncertainty or provide methods for model evaluation or comparison. Other packages provide more flexibility in specifying a regression model, such as strucchange (Zeileis et al., 2002) and segmented (Muggeo, 2008), but still offer limited options relative to mcp.
The mcp package offers rigorous statistical methodology, flexibility, ease of use and reproducibility. It allows the user to specify a unique model syntax for each segment between change points; detect changes in mean, variance and autocorrelation; and it also allows for robust inference using full posterior distributions for all parameters and change points. Previous knowledge of the study system can be directly incorporated when specifying parameter ranges and prior distributions. Although computational performance may slow with very large datasets, mcp includes parallel processing to increase computational efficiency. We provide a suite of worked examples and encourage others to consider using piecewise regression for identifying signals in biotelemetry data.
AUTHOR CONTRIBUTIONS
All authors conceived the idea for the review; David W. Wolfson collected the data, conducted the analysis and drafted the initial manuscript; all authors contributed critically to writing and review of the manuscript and gave final approval for publication.
CONFLICT OF INTEREST
The authors have no conflict of interest to declare.
ACKNOWLEDGEMENTS
We thank Victoria Drake, Jon Dachenhaus, Emily Wells, Jeff Fox, John Moriarty, Steven Hogg and Kaia Hilgendorf‐Roost for assistance with fieldwork that resulted in the trumpeter swan and sandhill crane datasets used in the examples. We thank Mark Ditmer for access to black bear data and William Severud, Tyler Obermoller, Glenn DelGiudice and Michelle Carstensen for access to moose data. We thank Simona Picardi, Amy Davis, Althea Archer, one anonymous reviewer, and an associate editor for constructive comments that improved the manuscript. Funding support for David Wolfson was provided by the Minnesota Environmental and Natural Resources Trust Fund as recommended by the Legislative‐Citizen Commission on Minnesota Resources (LCCMR) and the U.S. Geological Survey, Minnesota Cooperative Fish and Wildlife Research Unit. John Fieberg received partial support from the Minnesota Agricultural Experimental Station. Any use of trade, firm, or product names is for descriptive purposes only and does not imply endorsement by the U.S. Government, the University of Minnesota, or the State of Minnesota.
Wolfson, D. W. , Andersen, D. E. , & Fieberg, J. R. (2022). Using piecewise regression to identify biological phenomena in biotelemetry datasets. Journal of Animal Ecology, 91, 1755–1769. 10.1111/1365-2656.13779
Handling Editor: Francesca Cagnacci
[Correction added on 15 August 2022, after first online publication: The formatting of the code and R programs has been corrected.]
DATA AVAILABILITY STATEMENT
All code and data are publicly available in the Data Repository for University of Minnesota, https://doi.org/10.13020/qbha‐bs48 (Wolfson et al., 2022).
REFERENCES
- Anders, A. D. , & Marshall, M. R. (2005). Increasing the accuracy of productivity and survival estimates in assessing landbird population status. Conservation Biology, 19(1), 66–74. 10.1111/j.1523-1739.2005.00543.x [DOI] [Google Scholar]
- Anderson, K. , & Gaston, K. J. (2013). Lightweight unmanned aerial vehicles will revolutionize spatial ecology. Frontiers in Ecology and the Environment, 11(3), 138–146. 10.1890/120150 [DOI] [Google Scholar]
- Baker, M. R. , Gobush, K. S. , & Vynne, C. H. (2013). Review of factors influencing stress hormones in fish and wildlife. Journal for Nature Conservation, 21(5), 309–318. 10.1016/j.jnc.2013.03.003 [DOI] [Google Scholar]
- Barron, D. G. , Brawn, J. D. , & Weatherhead, P. J. (2010). Meta‐analysis of transmitter effects on avian behaviour and ecology. Methods in Ecology and Evolution, 1(2), 180–187. 10.1111/j.2041-210X.2010.00013.x [DOI] [Google Scholar]
- Bates, D. , Mächler, M. , Bolker, B. , and Walker, S. (2014). Fitting linear mixed‐effects models using Lme4. http://arxiv.org/abs/1406.5823
- Bennitt, E. , Bartlam‐Brooks, H. L. A. , Hubel, T. Y. , & Wilson, A. M. (2019). Terrestrial mammalian wildlife responses to Unmanned Aerial Systems approaches. Scientific Reports, 9(1), 2142. 10.1038/s41598-019-38610-x [DOI] [PMC free article] [PubMed] [Google Scholar]
- Berg, J. E. (2019). Shifts in strategy: Calving and calf survival in a partially migratory elk population. University of Alberta. [Google Scholar]
- Berg, J. E. , Reimer, J. , Smolko, P. , Bohm, H. , Hebblewhite, M. , & Merrill, E. H. (2021). Mothers' movements: shifts in calving area selection by partially migratory elk. The Journal of Wildlife Management, 85, 1476–1489. 10.1002/jwmg.22099 [DOI] [Google Scholar]
- Blickley, J. L. , & Patricelli, G. L. (2010). Impacts of anthropogenic noise on wildlife: Research priorities for the development of standards and mitigation. Journal of International Wildlife Law and Policy, 13(4), 274–292. 10.1080/13880292.2010.524564 [DOI] [Google Scholar]
- Bonar, M. , Ellington, E. H. , Lewis, K. P. , & Wal, E. V. (2018). Implementing a novel movement‐based approach to inferring parturition and neonate caribou calf survival. PLoS ONE, 13(2), e0192204. 10.1371/journal.pone.0192204 [DOI] [PMC free article] [PubMed] [Google Scholar]
- Börger, L. , & Fryxell, J. (2012). Quantifying individual differences in dispersal using net squared displacement. In Clobert J., Baguette M., Benton T. G., & Bullock J. M. (Eds.), Dispersal Ecology and Evolution (pp. 222–230). Oxford University Press. 10.1093/acprof:oso/9780199608898.001.0001/acprof-9780199608898-chapter-17 [DOI] [Google Scholar]
- Brivio, F. , Grignolio, S. , Sica, N. , Cerise, S. , & Bassano, B. (2015). Assessing the impact of capture on wild animals: The case study of chemical immobilisation on alpine ibex. PLoS ONE, 10(6), e0130957. 10.1371/journal.pone.0130957 [DOI] [PMC free article] [PubMed] [Google Scholar]
- Brooks, J. L. , Chapman, J. M. , Barkley, A. N. , Kessel, S. T. , Hussey, N. E. , Hinch, S. G. , Patterson, D. A. , Hedges, K. J. , Cooke, S. J. , Fisk, A. T. , Gruber, S. H. , & Nguyen, V. M. (2019). Biotelemetry informing management: Case studies exploring successful integration of biotelemetry data into fisheries and habitat management. Canadian Journal of Fisheries and Aquatic Sciences, 76(7), 1238–1252. 10.1139/cjfas-2017-0530 [DOI] [Google Scholar]
- Buechley, E. R. , Oppel, S. , Efrat, R. , Phipps, W. L. , Alanís, I. C. , Álvarez, E. , Andreotti, A. , Arkumarev, V. , Berger‐Tal, O. , Bermejo, A. B. , Bounas, A. , Ceccolini, G. , Cenerini, A. , Dobrev, V. , Duriez, O. , García, J. , García‐Ripollés, C. , Galán, M. , Gil, A. , … Marra, P. P. (2021). Differential survival throughout the full annual cycle of a migratory bird presents a life‐history trade‐off. Journal of Animal Ecology, 90(5), 1228–1238. 10.1111/1365-2656.13449 [DOI] [PubMed] [Google Scholar]
- Bunnefeld, N. , Börger, L. , van Moorter, B. , Rolandsen, C. M. , Dettki, H. , Solberg, E. J. , & Ericsson, G. (2011). A model‐driven approach to quantify migration patterns: Individual, regional and yearly differences: Quantifying migration patterns. Journal of Animal Ecology, 80(2), 466–476. 10.1111/j.1365-2656.2010.01776.x [DOI] [PubMed] [Google Scholar]
- Bürkner, P.‐C. (2017). Brms: An R package for bayesian multilevel models using Stan . Journal of Statistical Software, 80(1), 1–28. 10.18637/jss.v080.i01 [DOI] [Google Scholar]
- Burnside, R. J. , Collar, N. J. , Scotland, K. M. , & Dolman, P. M. (2016). Survival rates of captive‐bred Asian Houbara Chlamydotis macqueenii in a hunted migratory population. Ibis, 158(2), 353–361. 10.1111/ibi.12349 [DOI] [Google Scholar]
- Cagnacci, F. , Boitani, L. , Powell, R. A. , & Boyce, M. S. (2010). Animal ecology meets GPS‐based radiotelemetry: A perfect storm of opportunities and challenges. Philosophical Transactions of the Royal Society B: Biological Sciences, 365(1550), 2157–2162. 10.1098/rstb.2010.0107 [DOI] [PMC free article] [PubMed] [Google Scholar]
- Casas, F. , Benítez‐López, A. , García, J. T. , Martín, C. A. , Viñuela, J. , & Mougeot, F. (2015). Assessing the short‐term effects of capture, handling and tagging of sandgrouse. Ibis, 157(1), 115–124. 10.1111/ibi.12222 [DOI] [Google Scholar]
- Cerritelli, G. , Vanni, L. , Baldaccini, N. E. , Lenzoni, A. , Sorrenti, M. , Falchi, V. , Luschi, P. , & Giunchi, D. (2020). Simpler methods can outperform more sophisticated ones when assessing bird migration starting date. Journal of Ornithology, 161(3), 901–907. 10.1007/s10336-020-01770-z [DOI] [Google Scholar]
- Chabot, D. , & Francis, C. M. (2016). Computer‐automated bird detection and counts in high‐resolution aerial images: A review. Journal of Field Ornithology, 87(4), 343–359. 10.1111/jofo.12171 [DOI] [Google Scholar]
- Chamberlin, T. C. (1890). The method of multiple working hypotheses. Science, 366, 92–96. 10.1126/science.ns-15.366.92 [DOI] [PubMed] [Google Scholar]
- Cheng, Y. , Fiedler, W. , Wikelski, M. , & Flack, A. (2019). “Closer‐to‐home” strategy benefits juvenile survival in a long‐distance migratory bird. Ecology and Evolution, 9(16), 8945–8952. 10.1002/ece3.5395 [DOI] [PMC free article] [PubMed] [Google Scholar]
- Cooke, S. J. , Hinch, S. G. , Wikelski, M. , Andrews, R. D. , Kuchel, L. J. , Wolcott, T. G. , & Butler, P. J. (2004). Biotelemetry: A mechanistic approach to ecology. Trends in Ecology & Evolution, 19(6), 334–343. 10.1016/j.tree.2004.04.003 [DOI] [PubMed] [Google Scholar]
- Coulson, T. , Gaillard, J.‐M. , & Festa‐Bianchet, M. (2005). Decomposing the variation in population growth into contributions from multiple demographic rates. Journal of Animal Ecology, 74(4), 789–801. 10.1111/j.1365-2656.2005.00975.x [DOI] [Google Scholar]
- Craighead, F. (1982). Track of the grizzly. Random House. [Google Scholar]
- Cvikel, N. , Egert Berg, K. , Levin, E. , Hurme, E. , Borissov, I. , Boonman, A. , Amichai, E. , & Yovel, Y. (2015). Bats aggregate to improve prey search but might be impaired when their density becomes too high. Current Biology, 25(2), 206–211. 10.1016/j.cub.2014.11.010 [DOI] [PubMed] [Google Scholar]
- de Grissac, S. , Börger, L. , Guitteaud, A. , & Weimerskirch, H. (2016). Contrasting movement strategies among juvenile albatrosses and petrels. Scientific Reports, 6, 26103. 10.1038/srep26103 [DOI] [PMC free article] [PubMed] [Google Scholar]
- Dechen Quinn, A. C. , Williams, D. M. , & Porter, W. F. (2012). Postcapture movement rates can inform data‐censoring protocols for GPS‐collared animals. Journal of Mammalogy, 93(2), 456–463. 10.1644/10-MAMM-A-422.1 [DOI] [Google Scholar]
- DelGiudice, G. D. , Sampson, B. A. , Kuehn, D. W. , Powell, M. C. , & Fieberg, J. (2005). Understanding margins of safe capture, chemical immobilization, and handling of free‐ranging white‐tailed deer. Wildlife Society Bulletin, 33(2), 677–687. 10.2193/0091-7648(2005)33[677:UMOSCC]2.0.CO;2 [DOI] [Google Scholar]
- DelGiudice, G. D. , Severud, W. J. , Obermoller, T. R. , Wright, R. G. , Enright, T. A. , & St‐Louis, V. (2015). Monitoring movement behavior enhances recognition and understanding of capture‐induced abandonment of moose neonates. Journal of Mammalogy, 96(5), 1005–1016. 10.1093/jmammal/gyv105 [DOI] [Google Scholar]
- DeMars, C. A. , Auger‐Méthé, M. , Schlägel, U. E. , & Boutin, S. (2013). Inferring parturition and neonate survival from movement patterns of female ungulates: A case study using woodland caribou. Ecology and Evolution, 3(12), 4149–4160. 10.1002/ece3.785 [DOI] [PMC free article] [PubMed] [Google Scholar]
- Dettki, H. , & Ericsson, G. (2008). Screening radiolocation datasets for movement strategies with time series segmentation. The Journal of Wildlife Management, 72(2), 535–542. 10.2193/2006-363 [DOI] [Google Scholar]
- Ditmer, M. A. , Vincent, J. B. , Werden, L. K. , Tanner, J. C. , Laske, T. G. , Iaizzo, P. A. , Garshelis, D. L. , & Fieberg, J. R. (2015). Bears show a physiological but limited behavioral response to unmanned aerial vehicles. Current Biology, 25(17), 2278–2283. 10.1016/j.cub.2015.07.024 [DOI] [PubMed] [Google Scholar]
- Donnelly, J. P. , Naugle, D. E. , Collins, D. P. , Dugger, B. D. , Allred, B. W. , Tack, J. D. , & Dreitz, V. J. (2019). Synchronizing conservation to seasonal wetland hydrology and waterbird migration in semi‐arid landscapes. Ecosphere, 10(6), e02758. 10.1002/ecs2.2758 [DOI] [Google Scholar]
- Edelhoff, H. , Signer, J. , & Balkenhol, N. (2016). Path segmentation for beginners: An overview of current methods for detecting changes in animal movement patterns. Movement Ecology, 4(1), 1–21. 10.1186/s40462-016-0086-5 [DOI] [PMC free article] [PubMed] [Google Scholar]
- Elliott, L. P. , & Brook, B. W. (2007). Revisiting chamberlin: Multiple working hypotheses for the 21st century. Bioscience, 57(7), 608–614. 10.1641/B570708 [DOI] [Google Scholar]
- Ely, C. R. , & Meixell, B. W. (2016). Demographic outcomes of diverse migration strategies assessed in a metapopulation of tundra swans. Movement Ecology, 4(1), 10. 10.1186/s40462-016-0075-8 [DOI] [PMC free article] [PubMed] [Google Scholar]
- Erdman, C. , & Emerson, J. W. (2007). Bcp: An R package for performing a bayesian analysis of change point problems. Journal of Statistical Software, 23(1, 1), 1–13. 10.18637/jss.v023.i03 [DOI] [Google Scholar]
- Evans, T. J. , Young, R. C. , Watson, H. , Olsson, O. , & Åkesson, S. (2020). Effects of back‐mounted biologgers on condition, diving and flight performance in a breeding seabird. Journal of Avian Biology, 51(11), 1–17. 10.1111/jav.02509 [DOI] [Google Scholar]
- Flack, A. , Fiedler, W. , Blas, J. , Pokrovsky, I. , Kaatz, M. , Mitropolsky, M. , Aghababyan, K. , Fakriadis, I. , Makrigianni, E. , Jerzak, L. , Azafzaf, H. , Feltrup‐Azafzaf, C. , Rotics, S. , Mokotjomela, T. M. , Nathan, R. , & Wikelski, M. (2016). Costs of migratory decisions: A comparison across eight white stork populations. Science Advances, 2(1), e1500931. 10.1126/sciadv.1500931 [DOI] [PMC free article] [PubMed] [Google Scholar]
- Gabry, J. , Simpson, D. , Vehtari, A. , Betancourt, M. , & Gelman, A. (2019). Visualization in Bayesian workflow. Journal of the Royal Statistical Society: Series A (Statistics in Society), 182(2), 389–402. 10.1111/rssa.12378 [DOI] [Google Scholar]
- Gelman, A. , Carlin, J. B. , Stern, H. S. , & Rubin, D. B. (1995). Bayesian data analysis. Chapman and Hall/CRC. 10.1201/9780429258411 [DOI] [Google Scholar]
- Gelman, A. , Hwang, J. , & Vehtari, A. (2014). Understanding predictive information criteria for Bayesian models. Statistics and Computing, 24(6), 997–1016. 10.1007/s11222-013-9416-2 [DOI] [Google Scholar]
- Gelman, A. , Meng, X.‐L. , & Stern, H. (1996). Posterior predictive assessment of model fitness via realized discrepancies. Statistica Sinica, 6(4), 733–760. http://www.jstor.org/stable/24306036 [Google Scholar]
- Gelman, A. , & Shalizi, C. R. (2013). Philosophy and the practice of Bayesian statistics. British Journal of Mathematical and Statistical Psychology, 66(1), 8–38. 10.1111/j.2044-8317.2011.02037.x [DOI] [PMC free article] [PubMed] [Google Scholar]
- Ghalambor, C. K. , & Martin, T. E. (2001). Fecundity‐survival trade‐offs and parental risk‐taking in birds. Science, 292(5516), 494–497. 10.1126/science.1059379 [DOI] [PubMed] [Google Scholar]
- Girard, I. , Ouellet, J.‐P. , Courtois, R. , Dussault, C. , & Breton, L. (2002). Effects of sampling effort based on gps telemetry on home‐range size estimations. The Journal of Wildlife Management, 66(4), 1290. 10.2307/3802962 [DOI] [Google Scholar]
- Giunchi, D. , Baldaccini, N. E. , Lenzoni, A. , Luschi, P. , Sorrenti, M. , Cerritelli, G. , & Vanni, L. (2019). Spring migratory routes and stopover duration of satellite‐tracked Eurasian Teals Anas crecca wintering in Italy. Ibis, 161(1), 117–130. 10.1111/ibi.12602 [DOI] [Google Scholar]
- Glennie, R. , Adam, T. , Leos‐Barajas, V. , Michelot, T. , Photopoulou, T. , & McClintock, B. T. (2022). Hidden Markov models: Pitfalls and opportunities in ecology. Methods in Ecology and Evolution, 1–14. 10.1111/2041-210X.13801 [DOI] [Google Scholar]
- Gurarie, E. , Andrews, R. D. , & Laidre, K. L. (2009). A novel method for identifying behavioural changes in animal movement data. Ecology Letters, 12(5), 395–408. 10.1111/j.1461-0248.2009.01293.x [DOI] [PubMed] [Google Scholar]
- Gurarie, E. , Fleming, C. H. , Fagan, W. F. , Laidre, K. L. , Hernández‐Pliego, J. , & Ovaskainen, O. (2017). Correlated velocity models as a fundamental unit of animal movement: Synthesis and applications. Movement Ecology, 5, 13. 10.1186/s40462-017-0103-3 [DOI] [PMC free article] [PubMed] [Google Scholar]
- Hamilton, C. D. , Kovacs, K. M. , Ims, R. A. , Aars, J. , & Lydersen, C. (2017). An Arctic predator‐prey system in flux: Climate change impacts on coastal space use by polar bears and ringed seals. Journal of Animal Ecology, 86(5), 1054–1064. 10.1111/1365-2656.12685 [DOI] [PubMed] [Google Scholar]
- Hartman, C. A. , & Oring, L. W. (2006). An inexpensive method for remotely monitoring nest activity. Journal of Field Ornithology, 77(4), 418–424. 10.1111/j.1557-9263.2006.00073.x [DOI] [Google Scholar]
- Hebblewhite, M. , & Haydon, D. T. (2010). Distinguishing technology from biology: A critical review of the use of GPS telemetry data in ecology. Philosophical Transactions of the Royal Society B: Biological Sciences, 365(1550), 2303–2312. 10.1098/rstb.2010.0087 [DOI] [PMC free article] [PubMed] [Google Scholar]
- Hewson, C. M. , Thorup, K. , Pearce‐Higgins, J. W. , & Atkinson, P. W. (2016). Population decline is linked to migration route in the Common Cuckoo. Nature Communications, 7(1, 1), 12296. 10.1038/ncomms12296 [DOI] [PMC free article] [PubMed] [Google Scholar]
- Hobbs, N. T. , & Hooten, M. B. (2015). Bayesian models: A statistical primer for ecologists (1st ed.). Princeton University Press. [Google Scholar]
- Hodgson, J. C. , Mott, R. , Baylis, S. M. , Pham, T. T. , Wotherspoon, S. , Kilpatrick, A. D. , Segaran, R. R. , Reid, I. , Terauds, A. , & Koh, L. P. (2018). Drones count wildlife more accurately and precisely than humans. Methods in Ecology and Evolution, 9(5), 1160–1167. 10.1111/2041-210X.12974 [DOI] [Google Scholar]
- Hooten, M. B. , & Hobbs, N. T. (2015). A guide to Bayesian model selection for ecologists. Ecological Monographs, 85(1), 3–28. 10.1890/14-0661.1 [DOI] [Google Scholar]
- James, N. A. , & Matteson, D. S. (2014). Ecp: An R package for nonparametric multiple change point analysis of multivariate data. Journal of Statistical Software, 62(7), 1–25. 10.18637/jss.v062.i07 [DOI] [Google Scholar]
- Jonsen, I. , Myers, R. , & James, M. (2007). Identifying leatherback turtle foraging behaviour from satellite telemetry using a switching state‐space model. Marine Ecology Progress Series, 337, 255–264. 10.3354/meps337255 [DOI] [Google Scholar]
- Jung, T. S. , Konkolics, S. M. , Kukka, P. M. , Majchrzak, Y. N. , Menzies, A. K. , Oakley, M. P. , Peers, M. J. L. , & Studd, E. K. (2019). Short‐term effect of helicopter‐based capture on movements of a social ungulate. The Journal of Wildlife Management, 83(4), 830–837. 10.1002/jwmg.21640 [DOI] [Google Scholar]
- Kass, R. E. , & Raftery, A. E. (1995). Bayes factors. Journal of the American Statistical Association, 90(430), 773–795. 10.1080/01621459.1995.10476572 [DOI] [Google Scholar]
- Kays, R. , Crofoot, M. C. , Jetz, W. , & Wikelski, M. (2015). Terrestrial animal tracking as an eye on life and planet. Science, 348(6240), aaa2478. 10.1126/science.aaa2478 [DOI] [PubMed] [Google Scholar]
- Killick, R. , & Eckley, I. A. (2014). Changepoint: An R package for changepoint analysis. Journal of Statistical Software, 58(3), 1–19. 10.18637/jss.v058.i03 [DOI] [Google Scholar]
- Killick, R. , Fearnhead, P. , & Eckley, I. A. (2012). Optimal detection of changepoints with a linear computational cost. Journal of the American Statistical Association, 107(500), 1590–1598. 10.1080/01621459.2012.737745 [DOI] [Google Scholar]
- Koczur, L. , Ballard, B. , & Green, M. (2017). Survival of adult reddish egrets Egretta rufescens marked with satellite transmitters. Endangered Species Research, 34, 103–107. 10.3354/esr00846 [DOI] [Google Scholar]
- Kölzsch, A. , Neefjes, M. , Barkway, J. , Müskens, G. J. D. M. , van Langevelde, F. , de Boer, W. F. , Prins, H. H. T. , Cresswell, B. H. , & Nolet, B. A. (2016). Neckband or backpack? Differences in tag design and their effects on GPS/accelerometer tracking results in large waterbirds. Animal Biotelemetry, 4(1), 13. 10.1186/s40317-016-0104-9 [DOI] [Google Scholar]
- Kramer, G. R. , Andersen, D. E. , Buehler, D. A. , Wood, P. B. , Peterson, S. M. , Lehman, J. A. , Aldinger, K. R. , Bulluck, L. P. , Harding, S. , Jones, J. A. , Loegering, J. P. , Smalling, C. , Vallender, R. , & Streby, H. M. (2018). Population trends in Vermivora warblers are linked to strong migratory connectivity. Proceedings of the National Academy of Sciences of the United States of America, 115(14), E3192–E3200. 10.1073/pnas.1718985115 [DOI] [PMC free article] [PubMed] [Google Scholar]
- Lameris, T. K. , & Kleyheeg, E. (2017). Reduction in adverse effects of tracking devices on waterfowl requires better measuring and reporting. Animal Biotelemetry, 5(1), 24. 10.1186/s40317-017-0139-6 [DOI] [Google Scholar]
- Lameris, T. K. , van der Jeugd, H. P. , Eichhorn, G. , Dokter, A. M. , Bouten, W. , Boom, M. P. , Litvin, K. E. , Ens, B. J. , & Nolet, B. A. (2018). Arctic geese tune migration to a warming climate but still suffer from a phenological mismatch. Current Biology, 28(15), 2467–2473.e4. 10.1016/j.cub.2018.05.077 [DOI] [PubMed] [Google Scholar]
- Lavielle, M. (2005). Using penalized contrasts for the change‐point problem. Signal Processing, 85(8), 1501–1510. 10.1016/j.sigpro.2005.01.012 [DOI] [Google Scholar]
- Lebreton, J.‐D. , Burnham, K. P. , Clobert, J. , & Anderson, D. R. (1992). Modeling survival and testing biological hypotheses using marked animals: A unified approach with case studies. Ecological Monographs, 62(1), 67–118. 10.2307/2937171 [DOI] [Google Scholar]
- Lent, P. (1974). Mother‐infant relationships in ungulates. In Ther behaviour of ungulatesLent, P. C. 1974. Mother‐infant relationships in ungulates. Pp. 14–55 in V. Geist and F. Walther, eds. The behaviour of ungulates and its relationship to management (pp. 14–55). International Union for the Conservation of Nature and Natural Rsources. [Google Scholar]
- Linchant, J. , Lisein, J. , Semeki, J. , Lejeune, P. , & Vermeulen, C. (2015). Are unmanned aircraft systems (UASs) the future of wildlife monitoring? A review of accomplishments and challenges. Mammal Review, 45(4), 239–252. 10.1111/mam.12046 [DOI] [Google Scholar]
- Lindeløv, J. K. (2020). Mcp: An R package for regression with multiple change points. OSF Preprints. 10.31219/osf.io/fzqxv [DOI] [Google Scholar]
- Long, R. A. , Kie, J. G. , Bowyer, R. T. , & Hurley, M. A. (2009). Resource selection and movements by female mule deer odocoileus hemionus: Effects of reproductive stage. Wildlife Biology, 15(3), 288–298. 10.2981/09-003 [DOI] [Google Scholar]
- McEvoy, J. F. , Hall, G. P. , & McDonald, P. G. (2016). Evaluation of unmanned aerial vehicle shape, flight path and camera type for waterfowl surveys: Disturbance effects and species recognition. PeerJ, 4, e1831. 10.7717/peerj.1831 [DOI] [PMC free article] [PubMed] [Google Scholar]
- McGraw, A. M. , Terry, J. , & Moen, R. (2014). Pre‐parturition movement patterns and birth site characteristics of moose in northeast minnesota. Alces: A Journal Devoted to the Biology and Management of Moose, 50, 93–103. https://www.alcesjournal.org/alces/index.php/alces/article/view/126 [Google Scholar]
- Millspaugh, J. J. , & Washburn, B. E. (2004). Use of fecal glucocorticoid metabolite measures in conservation biology research: Considerations for application and interpretation. General and Comparative Endocrinology, 138(3), 189–199. 10.1016/j.ygcen.2004.07.002 [DOI] [PubMed] [Google Scholar]
- Mohr, A. S. , Ewanyk, J. , Hardy, O. , Windsor, J. , Zulliger, E. , Hilson, C. , Gunther, M. S. , & Bean, W. T. (2022). A multi‐metric movement model for identifying elk parturition events. Wildlife Society Bulletin, 46(1), e1256. 10.1002/wsb.1256 [DOI] [Google Scholar]
- Moller, A. P. , Rubolini, D. , & Lehikoinen, E. (2008). Populations of migratory bird species that did not show a phenological response to climate change are declining. Proceedings of the National Academy of Sciences of the United States of America, 105(42), 16195–16200. 10.1073/pnas.0803825105 [DOI] [PMC free article] [PubMed] [Google Scholar]
- Montgomerie, R. D. , & Weatherhead, P. J. (1988). Risks and rewards of nest defence by parent birds. The Quarterly Review of Biology, 63(2), 167–187. 10.1086/415838 [DOI] [Google Scholar]
- Morelle, K. , Bunnefeld, N. , Lejeune, P. , & Oswald, S. A. (2017). From animal tracks to fine‐scale movement modes: A straightforward approach for identifying multiple spatial movement patterns. Methods in Ecology and Evolution, 8(11), 1488–1498. 10.1111/2041-210X.12787 [DOI] [Google Scholar]
- Muggeo, V. M. R. (2003). Estimating regression models with unknown break‐points. Statistics in Medicine, 22(19), 3055–3071. 10.1002/sim.1545 [DOI] [PubMed] [Google Scholar]
- Muggeo, V. M. R. (2008). Segmented: An R package to fit regression models with broken‐line relationships. R News, 8(1), 20–25. [Google Scholar]
- Mulero‐Pázmány, M. , Jenni‐Eiermann, S. , Strebel, N. , Sattler, T. , Negro, J. J. , & Tablado, Z. (2017). Unmanned aircraft systems as a new source of disturbance for wildlife: A systematic review. PLoS ONE, 12(6), e0178448. 10.1371/journal.pone.0178448 [DOI] [PMC free article] [PubMed] [Google Scholar]
- Newman, S. H. , Iverson, S. A. , Takekawa, J. Y. , Gilbert, M. , Prosser, D. J. , Batbayar, N. , Natsagdorj, T. , & Douglas, D. C. (2009). Migration of whooper swans and outbreaks of highly pathogenic avian influenza H5N1 virus in Eastern Asia. PLoS One, 4(5), e5729. 10.1371/journal.pone.0005729 [DOI] [PMC free article] [PubMed] [Google Scholar]
- Newton, I. (2010). The migration ecology of birds. Elsevier. http://books.google.com?id=BndIbshDWTgC [Google Scholar]
- Nicholson, K. L. , Warren, M. J. , Rostan, C. , Månsson, J. , Paragi, T. F. , & Sand, H. (2019). Using fine‐scale movement patterns to infer ungulate parturition. Ecological Indicators, 101, 22–30. 10.1016/j.ecolind.2019.01.004 [DOI] [Google Scholar]
- Nolet, B. A. , Schreven, K. H. T. , Boom, M. P. , & Lameris, T. K. (2020). Contrasting effects of the onset of spring on reproductive success of Arctic‐nesting geese. The Auk, 137(1), ukz063. 10.1093/auk/ukz063 [DOI] [Google Scholar]
- Nygård, T. , Jacobsen, K.‐O. , Johnsen, T. V. , & Systad, G. H. (2016). Dispersal and survival of juvenile golden eagles (Aquila Chrysaetos) from Finnmark, Northern Norway. Journal of Raptor Research, 50(2), 144–160. 10.3356/rapt-50-02-144-160.1 [DOI] [Google Scholar]
- Obermoller, T. R. , Delgiudice, G. D. , & Severud, W. J. (2019). Maternal behavior indicates survival and cause‐specific mortality of moose calves. The Journal of Wildlife Management, 83(4), 790–800. 10.1002/jwmg.21658 [DOI] [Google Scholar]
- Patterson, T. A. , Parton, A. , Langrock, R. , Blackwell, P. G. , Thomas, L. , & King, R. (2017). Statistical modelling of individual animal movement: An overview of key methods and a discussion of practical challenges. AStA Advances in Statistical Analysis, 101(4), 399–438. 10.1007/s10182-017-0302-7 [DOI] [Google Scholar]
- Patterson, T. A. , Thomas, L. , Wilcox, C. , Ovaskainen, O. , & Matthiopoulos, J. (2008). State–space models of individual animal movement. Trends in Ecology & Evolution, 23(2), 87–94. 10.1016/j.tree.2007.10.009 [DOI] [PubMed] [Google Scholar]
- Peterson, M. E. , Anderson, C. R. , Alldredge, M. W. , & Doherty, P. F. (2018). Using maternal mule deer movements to estimate timing of parturition and assist fawn captures. Wildlife Society Bulletin, 42(4), 616–621. 10.1002/wsb.935 [DOI] [Google Scholar]
- Picardi, S. , Coates, P. , Kolar, J. , O'Neil, S. , Mathews, S. , & Dahlgren, D. (2022). Behavioural state‐dependent habitat selection and implications for animal translocations. Journal of Applied Ecology, 59(2), 624–635. 10.1111/1365-2664.14080 [DOI] [Google Scholar]
- Picardi, S. , Ranc, N. , Smith, B. J. , Coates, P. S. , Mathews, S. R. , & Dahlgren, D. K. (2021). Individual variation in temporal dynamics of post‐release habitat selection. Frontiers in Conservation Science, 2, 1–8. 10.3389/fcosc.2021.703906 [DOI] [Google Scholar]
- Rachlow, J. L. , Peter, R. M. , Shipley, L. A. , & Johnson, T. R. (2014). Sub‐lethal effects of capture and collaring on wildlife: Experimental and field evidence. Wildlife Society Bulletin, 38(3), 458–465. 10.1002/wsb.444 [DOI] [Google Scholar]
- Ralls, K. , Kranz, K. , & Lundrigan, B. (1986). Mother‐young relationships in captive ungulates: Variability and clustering. Animal Behaviour, 34, 134–145. 10.1016/0003-3472(86)90015-1 [DOI] [Google Scholar]
- Rotics, S. , Kaatz, M. , Resheff, Y. S. , Feldman Turjeman, S. , Zurell, D. , Sapir, N. , Eggers, U. , Flack, A. , Fiedler, W. , Jeltsch, F. , Wikelski, M. , & Nathan, R. (2016). The challenges of the first migration: Movement and behavior of juvenile versus adult white storks with insights regarding juvenile mortality. Journal of Animal Ecology, 85, 938–947. 10.1111/1365-2656.12525 [DOI] [PubMed] [Google Scholar]
- Rotics, S. , Turjeman, S. , Kaatz, M. , Resheff, Y. S. , Zurell, D. , Sapir, N. , Eggers, U. , Fiedler, W. , Flack, A. , Jeltsch, F. , Wikelski, M. , & Nathan, R. (2017). Wintering in Europe instead of Africa enhances juvenile survival in a long‐distance migrant. Animal Behaviour, 126, 79–88. 10.1016/j.anbehav.2017.01.016 [DOI] [Google Scholar]
- Rushing, C. S. , Hostetler, J. A. , Sillett, T. S. , Marra, P. P. , Rotenberg, J. A. , & Ryder, T. B. (2017). Spatial and temporal drivers of avian population dynamics across the annual cycle. Ecology, 98(11), 2837–2850. 10.1002/ecy.1967 [DOI] [PubMed] [Google Scholar]
- Schreven, K. H. T. , Stolz, C. , Madsen, J. , & Nolet, B. A. (2021). Nesting attempts and success of Arctic‐breeding geese can be derived with high precision from accelerometry and GPS‐tracking. Animal Biotelemetry, 9(1), 25. 10.1186/s40317-021-00249-9 [DOI] [Google Scholar]
- Senzaki, M. , Barber, J. R. , Phillips, J. N. , Carter, N. H. , Cooper, C. B. , Ditmer, M. A. , Fristrup, K. M. , McClure, C. J. W. , Mennitt, D. J. , Tyrrell, L. P. , Vukomanovic, J. , Wilson, A. A. , & Francis, C. D. (2020). Sensory pollutants alter bird phenology and fitness across a continent. Nature, 587(7835, 7835), 605–609. 10.1038/s41586-020-2903-7 [DOI] [PubMed] [Google Scholar]
- Sergio, F. , Tanferna, A. , Blas, J. , Blanco, G. , & Hiraldo, F. (2019). Reliable methods for identifying animal deaths in gps ‐ and satellite‐tracking data: Review, testing, and calibration. Journal of Applied Ecology, 56(3), 562–572. 10.1111/1365-2664.13294 [DOI] [Google Scholar]
- Severud, W. J. , Giudice, G. D. , Obermoller, T. R. , Enright, T. A. , Wright, R. G. , & Forester, J. D. (2015). Using GPS collars to determine parturition and cause‐specific mortality of moose calves. Wildlife Society Bulletin, 39(3), 616–625. 10.1002/wsb.558 [DOI] [Google Scholar]
- Seymour, A. C. , Dale, J. , Hammill, M. , Halpin, P. N. , & Johnston, D. W. (2017). Automated detection and enumeration of marine wildlife using unmanned aircraft systems (UAS) and thermal imagery. Scientific Reports, 7(1, 1), 45127. 10.1038/srep45127 [DOI] [PMC free article] [PubMed] [Google Scholar]
- Shannon, G. , McKenna, M. F. , Angeloni, L. M. , Crooks, K. R. , Fristrup, K. M. , Brown, E. , Warner, K. A. , Nelson, M. D. , White, C. , Briggs, J. , McFarland, S. , & Wittemyer, G. (2016). A synthesis of two decades of research documenting the effects of noise on wildlife. Biological Reviews, 91(4), 982–1005. 10.1111/brv.12207 [DOI] [PubMed] [Google Scholar]
- Sillett, T. S. , & Holmes, R. T. (2002). Variation in survivorship of a migratory songbird throughout its annual cycle. Journal of Animal Ecology, 71(2), 296–308. 10.1046/j.1365-2656.2002.00599.x [DOI] [Google Scholar]
- Soriano‐Redondo, A. , Acácio, M. , Franco, A. M. A. , Martins, B. H. , Moreira, F. , Rogerson, K. , & Catry, I. (2020). Testing alternative methods for estimation of bird migration phenology from GPS tracking data. Ibis, 162(2), 581–588. 10.1111/ibi.12809 [DOI] [Google Scholar]
- Spitz, D. B. , Hebblewhite, M. , & Stephenson, T. R. (2017). ‘MigrateR’: Extending model‐driven methods for classifying and quantifying animal movement behavior. Ecography, 40(6), 788–799. 10.1111/ecog.02587 [DOI] [Google Scholar]
- Stabach, J. A. , Cunningham, S. A. , Connette, G. , Mota, J. L. , Reed, D. , Byron, M. , Songer, M. , Wacher, T. , Mertes, K. , Brown, J. L. , Comizzoli, P. , Newby, J. , Monfort, S. , & Leimgruber, P. (2020). Short‐term effects of GPS collars on the activity, behavior, and adrenal response of scimitar‐horned oryx (Oryx dammah). PLoS ONE, 15(2), e0221843. 10.1371/journal.pone.0221843 [DOI] [PMC free article] [PubMed] [Google Scholar]
- Stephens, D. A. (1994). Bayesian retrospective multiple‐changepoint identification. Journal of the Royal Statistical Society: Series C (Applied Statistics), 43(1), 159–178. 10.2307/2986119 [DOI] [Google Scholar]
- Sutti, F. , & Strong, A. M. (2014). Temperature loggers decrease costs of determining bird nest survival: Temperature loggers and nest monitoring. Wildlife Society Bulletin, 38(4), 831–836. 10.1002/wsb.473 [DOI] [Google Scholar]
- Takekawa, J. Y. , Newman, S. H. , Xiao, X. , Prosser, D. J. , Spragens, K. A. , Palm, E. C. , Yan, B. , Li, T. , Lei, F. , Zhao, D. , Douglas, D. C. , Muzaffar, S. B. , & Ji, W. (2010). Migration of waterfowl in the East Asian flyway and spatial relationship to HPAI H5N1 outbreaks. Avian Diseases, 54, 466–476. 10.1637/8914-043009-Reg.1 [DOI] [PMC free article] [PubMed] [Google Scholar]
- Thompson, D. P. , Crouse, J. A. , McDonough, T. J. , Barboza, P. S. , & Jaques, S. (2020). Acute thermal and stress response in moose to chemical immobilization. The Journal of Wildlife Management, 84(6), 1051–1062. 10.1002/jwmg.21871 [DOI] [Google Scholar]
- Thurber, B. G. , Roy, C. , & Zimmerling, J. R. (2020). Long‐term changes in the autumn migration phenology of dabbling ducks in southern Ontario and implications for waterfowl management. Wildlife Biology, 2020(2), 1–11. 10.2981/wlb.00668 [DOI] [Google Scholar]
- Thurfjell, H. , Spong, G. , & Ericsson, G. (2013). Effects of hunting on wild boar Sus scrofa behaviour. Wildlife Biology, 19(1), 87–93. 10.2981/12-027 [DOI] [Google Scholar]
- Tomkiewicz, S. M. , Fuller, M. R. , Kie, J. G. , & Bates, K. K. (2010). Global positioning system and associated technologies in animal behaviour and ecological research. Philosophical Transactions of the Royal Society B: Biological Sciences, 365(1550), 2163–2176. 10.1098/rstb.2010.0090 [DOI] [PMC free article] [PubMed] [Google Scholar]
- Toms, J. , & Lesperance, M. (2003). Piecewise regression: A tool for identifying ecological thresholds. Ecology, 84(8), 2034–2041. 10.1890/02-0472 [DOI] [Google Scholar]
- Toms, J. , & Villard, M.‐A. (2015). Threshold detection: Matching statistical methodology to ecological questions and conservation planning objectives. Avian Conservation and Ecology, 10(1). 10.5751/ACE-00715-100102 [DOI] [Google Scholar]
- Vas, E. , Lescroël, A. , Duriez, O. , Boguszewski, G. , & Grémillet, D. (2015). Approaching birds with drones: First experiments and ethical guidelines. Biology Letters, 11(2), 20140754. 10.1098/rsbl.2014.0754 [DOI] [PMC free article] [PubMed] [Google Scholar]
- Vehtari, A. , Gelman, A. , & Gabry, J. (2017). Practical Bayesian model evaluation using leave‐one‐out cross‐validation and WAIC. Statistics and Computing, 27(5), 1413–1432. 10.1007/s11222-016-9696-4 [DOI] [Google Scholar]
- Verdinelli, I. , & Wasserman, L. (1995). Computing Bayes factors using a generalization of the Savage‐Dickey density ratio. Journal of the American Statistical Association, 90(430), 614–618. 10.1080/01621459.1995.10476554 [DOI] [Google Scholar]
- Wagenmakers, E.‐J. , Lodewyckx, T. , Kuriyal, H. , & Grasman, R. (2010). Bayesian hypothesis testing for psychologists: A tutorial on the Savage–Dickey method. Cognitive Psychology, 60(3), 158–189. 10.1016/j.cogpsych.2009.12.001 [DOI] [PubMed] [Google Scholar]
- Watts, A. C. , Perry, J. H. , Smith, S. E. , Burgess, M. A. , Wilkinson, B. E. , Szantoi, Z. , Ifju, P. G. , & Percival, H. F. (2010). Small unmanned aircraft systems for low‐altitude aerial surveys. The Journal of Wildlife Management, 74(7), 1614–1619. 10.1111/j.1937-2817.2010.tb01292.x [DOI] [Google Scholar]
- Wilmers, C. C. , Nickel, B. , Bryce, C. M. , Smith, J. A. , Wheat, R. E. , & Yovovich, V. (2015). The golden age of bio‐logging: How animal‐borne sensors are advancing the frontiers of ecology. Ecology, 96(7), 1741–1753. 10.1890/14-1401.1 [DOI] [PubMed] [Google Scholar]
- Wilson, R. P. , White, C. R. , Quintana, F. , Halsey, L. G. , Liebsch, N. , Martin, G. R. , & Butler, P. J. (2006). Moving towards acceleration for estimates of activity‐specific metabolic rate in free‐living animals: The case of the cormorant. Journal of Animal Ecology, 75(5), 1081–1090. 10.1111/j.1365-2656.2006.01127.x [DOI] [PubMed] [Google Scholar]
- Wolfson, D. (2018). Migratory ecology and movement patterns of mid‐continent and eastern sandhill cranes . http://conservancy.umn.edu/handle/11299/200122
- Wolfson, D. , Fieberg, J. , Lawrence, J. S. , Cooper, T. R. , & Andersen, D. E. (2017a). Range overlap between mid‐continent and Eastern sandhill cranes revealed by GPS‐tracking. Wildlife Society Bulletin, 41(3), 489–498. 10.1002/wsb.799 [DOI] [Google Scholar]
- Wolfson, D. , Fieberg, J. R. , Lawrence, J. S. , Cooper, T. R. , & Andersen, D. E. (2017b). Data, R code, and output supporting: range overlap between mid‐continent and eastern sandhill cranes revealed by GPS‐tracking. Retrieved from the Data Repository for the University of Minnesota. http://conservancy.umn.edu/handle/11299/188290
- Wolfson, D. W. , Andersen, D. E. , & Fieberg, J. R. (2022). Data and R code supporting: Using Piecewise Regression to Identify Biological Phenomena in Biotelemetry Datasets. Retrieved from the Data Repository for the University of Minnesota. 10.13020/qbha-bs48 [DOI] [PMC free article] [PubMed]
- Youngflesh, C. (2018). MCMCvis:tools to visualize, manipulate, and summarize MCMC output. Journal of Open Source Software, 3(24), 640. [Google Scholar]
- Zangmeister, J. L. , Haussmann, M. F. , Cerchiara, J. , & Mauck, R. A. (2009). Incubation failure and nest abandonment by Leach's Storm‐Petrels detected using PIT tags and temperature loggers. Journal of Field Ornithology, 80(4), 373–379. 10.1111/j.1557-9263.2009.00243.x [DOI] [Google Scholar]
- Zeileis, A. , Leisch, F. , Hornik, K. , & Kleiber, C. (2002). Strucchange: An R package for testing for structural change in linear regression models. Journal of Statistical Software, 7(2), 1–38. 10.18637/jss.v007.i02 [DOI] [Google Scholar]
Associated Data
This section collects any data citations, data availability statements, or supplementary materials included in this article.
Data Availability Statement
All code and data are publicly available in the Data Repository for University of Minnesota, https://doi.org/10.13020/qbha‐bs48 (Wolfson et al., 2022).