

Abstract
Objective
To assess whether baseline pulmonary artery diameter (PAD), obtained from noncontrast nongated computed tomography (NCCT), can be associated with coronavirus disease 2019 (COVID-19) outcomes.
Patients and Methods
This is a retrospective study of patients hospitalized with COVID-19 admitted to Hôtel-Dieu de France university hospital (Beirut, Lebanon) between March 1, 2020 and March 1, 2021. Pulmonary artery diameter was measured at baseline NCCT. Various outcomes were assessed, including hospital length of stay, intensive care unit admission, invasive mechanical ventilation, mortality, and Post–COVID-19 Functional Status scale at discharge and at 2-month follow-up.
Results
Four hundred sixty-five patients underwent baseline NCCT, including 315 men (67.7%) with a mean age of 63.7±16 years. Baseline PAD was higher in critically ill patients admitted to the intensive care unit (mean difference, 0.8 mm; 95% CI, 0.4-1.59 mm) and those receiving invasive mechanical ventilation (mean difference, 1.1 mm; 95% CI, 0.11-2.04 mm). Pulmonary artery diameter at baseline correlated significantly with hospital length of stay (r=0.130; P=.005), discharge status (r=0.117; P=.023), and with Post–COVID-19 Functional Status scale at 2-month follow-up (r=0.121; P=.021). Moreover, multivariable logistic regression showed that a PAD of 24.5 mm and above independently predicted in-hospital all-cause mortality remained unaffected in patients with COVID-19 (odds ratio, 2.07; 95% CI, 1.05-4.09).
Conclusion
Baseline PAD measurement using NCCT can be a useful prognostic parameter. Its measurement can help to identify early severe cases and adapt the initial management of patients hospitalized with COVID-19.
Abbreviations and Acronyms: COVID-19, coronavirus disease; NCCT, noncontrast nongated computed tomography; NEWS2, National Early Warning Score 2; PAD, pulmonary artery diameter; PCFS, Post–COVID-19 Functional Status; SARS-Cov-2, severe acute respiratory syndrome coronavirus 2
On March 11, 2020, the World Health Organization declared the coronavirus disease 2019 (COVID-19)1 a pandemic amid an alarming increase in the spread and severity of the disease.2 Although a minority of patients infected with severe acute respiratory syndrome coronavirus 2 (SARS-Cov-2) experience severe symptoms and require hospitalization, the outcomes for these patients may be devastating and often life-threatening. As of April 15, 2022, the COVID-19 pandemic is responsible for more than 6.1 million deaths around the world.3 As a result, the impact of this dramatic death toll on health care systems and economies around the world has made it a priority to identify prognostic risk factors to detect patients with poor prognosis and adapt an aggressive treatment plan.4 Multiple risk factors for severe COVID-19 have been identified, including older age,5 male sex,6 history of lung and/or cardiovascular diseases,7 diabetes,8 and immunosuppression.9 Noncontrast nongated computed tomography (NCCT) may be performed to assess lung involvement in patients hospitalized with infectious pneumonia10 and has also reported an added value in the early identification and management of severe COVID-19 cases.11 Pulmonary artery dilation is associated with poor prognosis in various lung diseases, including cystic fibrosis,12, 13, 14, chronic obstructive pulmonary disease,15, 16 and interstitial lung fibrosis.17 An association between the pulmonary artery diameter (PAD) on NCCT and COVID-19 severity was first reported by Yildiz et al in January 2021,18 and since then, a few reports have pointed to its potential prognostic utility. This study aimed to investigate the prognostic value of baseline PAD in short- and mid-term outcomes in patients hospitalized with COVID-19.
Patients and Methods
Study Design
We conducted a retrospective study that included severe patients with COVID-19, admitted between March 2020 and March 2021 to Hôtel-Dieu de France, one of the largest tertiary care centers in the capital of Lebanon, Beirut. The patients were admitted to dedicated wards of the departments of internal medicine, infectious diseases, and pulmonology and critical care. Adult patients (≥18 years old) with positive real-time reverse transcriptase polymerase chain reaction for COVID-19 and a baseline NCCT were included. Patients aged less than 18 years, without a baseline NCCT at admission, as well as pregnant patients, and nonhospitalized patients were excluded.
PAD Measurement
The measurement of the pulmonary artery was made on a dedicated workstation through which a radiologist identified the axial CT image that depicted the widest diameter of the pulmonary artery, perpendicular to the long axis of the vessel, near the midpoint between the base of the pulmonary trunk and the end of the right pulmonary artery (Figure). Each scan was interpreted by 2 independent radiologists with no prior knowledge of patient history.
Figure.
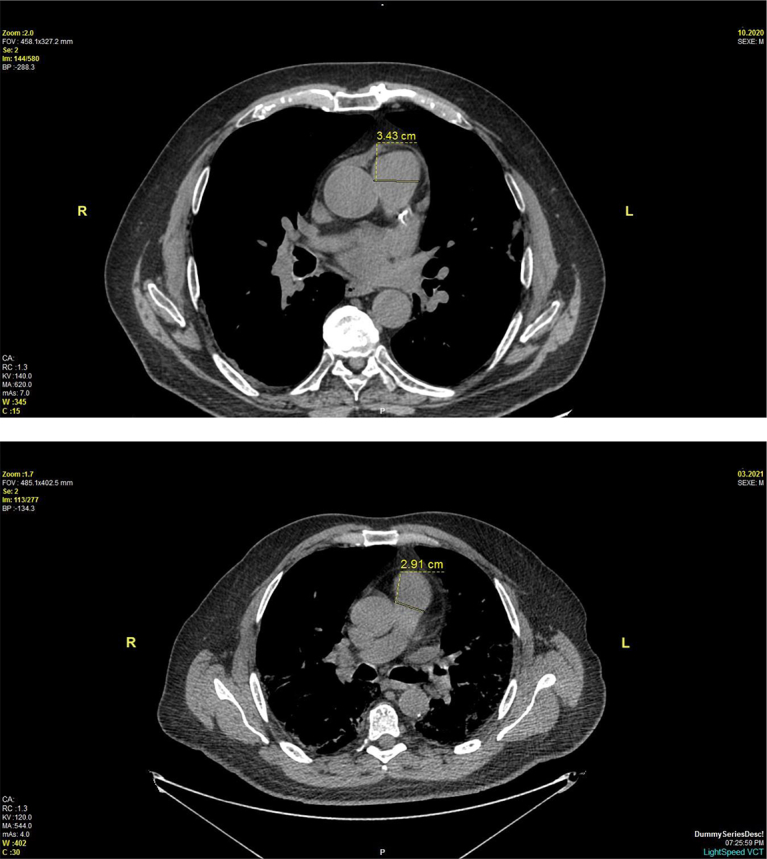
Measurement of pulmonary artery diameter using noncontrast nongated computed tomography.
Data Collection
Various clinical outcomes were measured including hospital length of stay, admission to the intensive care unit (ICU), use of invasive mechanical ventilation, in-hospital mortality (COVID-19 related or all-cause mortality), the Post–COVID-19 Functional Status (PCFS) scale19 at discharge and 2-month follow-up, and patients’ status at discharge and 2-month follow-up. Patients’ clinical data and National Early Warning Score 2 (NEWS2)20 were obtained from the hospital’s electronic medical records.
Statistical Analyses
Categorical variables were presented as numbers and percentages, with their 95% CIs. Quantitative data with a skewed distribution (QQ plots, Shapiro–Wilk test) are presented as the mean ± SD. Ordinal data and quantitative data with asymmetric distribution are presented as the median with its interquartile range (quartile 1-quartile 3) and range.
For the ordinal outcomes (NEWS2, PCFS at M0 and M2 and the functional state at discharge) and outcomes with asymmetric distribution (length of stay), correlation with PAD was done using the Spearman coefficient. Its 95% CI was constructed by bootstrapping on 10,000 random samples. For the binary outcomes, the average PAD was compared between the 2 categories by using the independent t test. For multicategory outcomes (including death from COVID-19), an analysis of variance was performed. Receiver operator characteristic type analysis was conducted to determine the PAD threshold with maximum sensitivity and specificity (Youden index) to detect the above-defined binary outcomes. The positive predictive value and negative predictive value of the found threshold were calculated. All the independent variables were then compared between the 2 subgroups formed by the PAD threshold, using the Chi2 test (corrected by Fisher exact test where appropriate), the Mann-Whitney test, or the t test. For binary variables, a crude odds ratio (unadjusted) was calculated with its 95% CI. To adjust the odds ratio between all-mortality and PAD cutoff, all the independent variables with a univariate P value of ≤.10 were entered in a multivariate logistic regression model for all-cause mortality. The model’s R2, Hosmer-Lemeshow statistic, analog of cook’s distances, and studentized ranges were calculated. The C statistic for the model was also calculated.
All the calculations were performed according to a prespecified statistical analysis plan, using IBM SPSS software (IBM Corp. Released 2021. IBM SPSS Statistics for Windows, Version 28.0, IBM Corp) and Python (Python Software Foundation. Python Language Reference version 3.4). The statistical code and the deidentified data are available on justified request from crc@usj.edu.lb.
Study Approval
The present work was approved by the Ethical Committee of the Saint Joseph University of Beirut, Lebanon (CEHDF letter). Protocols were carried out in accordance with the “Good Clinical Practice” described in the “Helsinki Declaration” (October 2013) and following the “International Ethical Guidelines for Biomedical Research Involving Human Subjects” developed by the Council for International Organizations of Medical Sciences in collaboration with the World Health Organization.
Results
Baseline Characteristics and Outcomes
Between March 2020 and March 2021, 556 patients were hospitalized at Hôtel-Dieu de France university hospital; 89 patients did not have a baseline NCCT and were excluded from the study. Overall, 465 patients were included, and their demographic and clinical characteristics are shown in Table 1. The male patients were 315 (67.7%), with a mean (SD) age of 64 years (16 years). Most patients (264 [56.8%]) had a history of hypertension, the most frequent cardiovascular risk factor in the studied population. The mean baseline PAD was 26.7 mm (3.8 mm) (Table 1). In addition, 44.3% of patients had a NEWS2 score between 0 and 4, which indicates low clinical risk, whereas 55.7% of patients had a medium-to-high clinical risk. The median hospital length of stay (interquartile range) was 9 days (5-16 days). Although 110 patients (23.7%) were admitted to the ICU on median 3 days after admission, 63% of them were put on invasive mechanical ventilation for a median of 7 days (3-12 days) following their hospital admission. Table 1 also details the laboratory, and imaging characteristics of the subjects enrolled in the study.
Table 1.
Baseline Characteristics of the Subjects Enrolled in the Study
| Variable | Statistic | Valid N | Result | |
|---|---|---|---|---|
| Age (y) | m±sd, min-max | 465 | 63.7±16 | 16-96 |
| Female gender | n(%), 95% CI | 150 (32.3) | 28.1%-36.6% | |
| O Blood type | n(%), 95% CI | 152 (38.1) | 33.4%-42.9% | |
| A Blood type | n(%), 95% CI | 174 (43.6) | 38.8%-48.5% | |
| B Blood type | n(%), 95% CI | 51 (12.8) | 9.8%-16.3% | |
| AB Blood type | n(%), 95% CI | 22 (5.5) | 3.6%-8.1% | |
| Negative Rhesus antigen | n(%), 95% CI | 37 (9.3) | 6.7%-12.4% | |
| Direct admission to ICU | n(%), 95% CI | 48 (10.3) | 7.8%-13.3% | |
| Day symptoms started | m±sd, min-max | 449 | −6.7±5.2 | −30 to 26 |
| 1st CT value | m±sd, min-max | 261 | 22.5±5.6 | 8-37 |
| Weight (kg) | m±sd, min-max | 437 | 81.2±16.6 | 36-150 |
| Hypertension | n(%), 95% CI | 264 (56.8) | 52.2%-61.2% | |
| Diabetes mellitus | n(%), 95% CI | 135 (29) | 25%-33.3% | |
| Immunosuppresion | n(%), 95% CI | 47 (10.1) | 7.6%-13.1% | |
| Cardiovascular disease | n(%), 95% CI | 124 (26.7) | 22.8%-30.8% | |
| Chronic renal failure | n(%), 95% CI | 74 (15.9) | 12.8%-19.4% | |
| Lung Disease | n(%), 95% CI | 93 (20.5) | 17%-24.4% | |
| Smoker | n(%), 95% CI | 114 (25.2) | 21.3%-29.3% | |
| ICU transfer day | Med (Q1-Q3), min-max | 111 | 3 (1-7) | 1-20 |
| GGO (%) @ baseline NCCT | m±sd, min-max | 465 | 25.2±18.3 | 0-90 |
| PAD @ baseline NCCT (mm) | m±sd, min-max | 465 | 26.7±3.8 | 18-50 |
| Leucocytes (/cm3) | Med (Q1-Q3), min-max | 465 | 7000 (5200-10,000) | 920-65, 400 |
| Neutrophiles (/cm3) | Med (Q1-Q3), min-max | 465 | 5370 (3590-8050) | 230-56, 520 |
| Lymphocytes (/cm3) | Med (Q1-Q3), min-max | 465 | 830 (560-1250) | 99-56, 240 |
| Ferritine (μg/L) | Med (Q1-Q3), min-max | 452 | 746.5 (378-1328.5) | 10-35, 493 |
| LDH (U/L) | Med (Q1-Q3), min-max | 449 | 334 (251-436) | 130-997 |
| D-dimers (ng/L) | Med (Q1-Q3), min-max | 452 | 0.9 (0.47-1.7) | 0.2-483 |
| CRP (mg/L) | Med (Q1-Q3), min-max | 464 | 87.8 (36-149.5) | 2-941 |
| Procalcitonine (ng/L) | Med (Q1-Q3), min-max | 427 | 0.2 (0.08-0.5) | 0-366 |
| HDL cholesterol (mmol/L) | Med (Q1-Q3), min-max | 107 | 1.2 (0.94-1.4) | 0.3-5.4 |
| LDL cholesterol (mmol/L) | Med (Q1-Q3), min-max | 108 | 2.9 (2.165-3.5) | 0.8-6.7 |
| Triglycerides (mmo/L) | Med (Q1-Q3), min-max | 318 | 1.8 (1.32-2.5) | 0.4-7.8 |
| Serum Creatinin (μmol/L) | Med (Q1-Q3), min-max | 454 | 78 (62-108) | 11.5-1149 |
| Baseline O2 needs | ||||
| No O2 | n(%), 95% CI | 126 (27.1) | 23.2%-31.3% | |
| O2 < 4 L/min | n(%), 95% CI | 121 (26) | 22.2%-30.1% | |
| O2 4-8 L/min | n(%), 95% CI | 135 (29) | 25%-33.3% | |
| HCM/Optiflow | n(%), 95% CI | 83 (17.8) | 14.6%-21.5% | |
| NEWS2 score | Med (Q1-Q3), min-max | 465 | 5 (3-6) | 0-12 |
Categorical data are presented as frequencies, percentages and their 95% CIs (n[%], 95%CI). Continuous data not departing from normality assumptions are presented as mean and its SD (m±SD), min and max. Continuous data departing from normality assumptions are presented as median and its interquartile range, min and max (Med [Q1-Q3], min-max).
CRP, C-reactive protein; CT, cycle threshold; GGO, ground glass opacities; HCM, high concentration oxygen mask; ICU, intensive care unit; LDH, lactodehydrogenase; NCCT, noncontrast nongated computed tomography; NEWS2, National Early Warning Score 2; PAD, pulmonary artery diameter.
Of the 465 admitted patients, 379 (81.5%) patients were discharged. At discharge, 272 (71.8%) patients did not require any supplemental oxygen, and at 2-month follow-up, 333 patients (91.2%) were completely autonomous on the respiratory level. At discharge, 108 (27.3%) patients had a PCFS score of 3 and above and needed a supervised rehabilitation in a specialized center. At 2-month follow-up, 30 patients (5.2%) still required supervised rehabilitation in a specialized center.
Measure of Association Between Baseline PAD and In-Hospital Outcomes
In univariate analysis, the baseline PAD showed a weak correlation with most continuous and ordinal in-hospital and 2-month outcomes, that is, hospital length of stay, PCFS status at 2-month following discharge from hospital, and immediate and late (ie, 2-month) discharge status (Table 2). The correlation with NEWS2 score and PCFS at hospital discharge was not substantial. Larger mean PAD was associated with all-cause mortality (effect size, 0.256), intubation (effect size, 0.285), and a PCFS score of 3 and above at 2-month (effect size, 0.409), as shown in Table 3.
Table 2.
Correlation of Pulmonary Artery Diameter With In-Hospital and 2-Month Continuous and Ordinal Outcomes
| Variable | Spearman rho | P value | N | 95% CI |
|---|---|---|---|---|
| NEWS2 score | 0.069 | .138 | 465 | −0.022 to 0.159 |
| Length of stay | 0.130 | .005 | 465 | 0.037 to 0.222 |
| PCFS @ discharge | 0.084 | .108 | 368a | −0.022 to 0.187 |
| PCFS @ 2-month | 0.121 | .021 | 365a | 0.016-0.221 |
| Discharge status | 0.117 | .023 | 375a | 0.018-0.212 |
| 2-month postdischarge status | 0.128 | .014 | 362a | 0.034-0.220 |
95% CIs for Spearman rho were built by bootstrapping based on 10,000 bootstrap samples. NEWS2, National Early Warning Score 2; PCFS, Post–COVID-19 Functional Status scale.
Valid sample size is slightly less than the number of survivors (n=379) because of missing data.
Table 3.
Variation of Pulmonary Artery Diameter According to Categorical Outcomes
| Group | Categories | Group size | PAD at baseline NCCT (mm) (m±SD) | Effect size | P value |
|---|---|---|---|---|---|
| Mortality | No | 379 | 26.5±3.7 | 0.011 | .072 |
| COVID-19–related | 74 | 27.4±4.1 | |||
| not COVID-19–related | 12 | 28.3±4.1 | |||
| All-cause mortality | No | 379 | 26.5±3.7 | 0.256 | .033 |
| Yes | 86 | 27.5±4.1 | |||
| ICU Admission | No | 355 | 26.5±3.7 | 0.205 | .061 |
| Yes | 110 | 27.3±3.9 | |||
| Invasive mechanical ventilation | No | 395 | 26.5±3.8 | 0.285 | .028 |
| Yes | 70 | 27.6±3.9 | |||
| PCFS at dischargea | PCFS 0-2 | 265 | 26.4±3.7 | 0.090 | .441 |
| PCFS 3-4 | 103 | 26.7±3.8 | |||
| PCFS at 2-montha | PCFS 0-2 | 335 | 26.4±3.6 | 0.409 | .032 |
| PCFS 3-4 | 30 | 27.9±4.5 |
ICU, Intensive care unit; PAD, pulmonary artery diameter; PCFS, Post–COVID-19 Functional Status scale.P values correspond to analysis of variance and Student t test. The used effect sizes are Cohen’s d for the t test and eta squared for analysis of variance test.
The group sizes are slightly less than the number of survivors due to missing data.
Evaluation of Baseline PAD Measurement as a Screening Test for Increased Risk of Mortality
A receiver operator characteristic analysis was performed and showed an area under the curve of 0.575 (95% CI, 0.507-0.643) with the cutoff 24.5 mm yielding 81.4% sensitivity and 32.7% specificity. The unadjusted odds ratio between PAD of 24.5 mm and above and all-cause mortality was 2.13 (95% CI, 1.19-3.81), PAD of 24.5 mm and above was also associated with increased weight, arterial hypertension, chronic renal failure, increased serum creatinine level, more extensive ground glass opacities, endotracheal intubation, and increased length of stay, as shown in Table 4.
Table 4.
Comparison of 2 Groups Defined by the 24 mm Pulmonary Artery Diameter Cutoff
| . | PA<24.5 mm | PA≥24.5 mm | Test | P value |
|---|---|---|---|---|
| Age | 62±17 | 65±16 | t | .112 |
| Female gender | 51 (36.4%) | 99 (30.5%) | Chi2 | .234 |
| Blood type | ||||
| O | 42 (30%) | 110 (33.8%) | Chi2 | .367 |
| A | 61 (43.6%) | 113 (34.8%) | ||
| B | 11 (7.9%) | 40 (12.3%) | ||
| AB | 7 (5%) | 15 (4.6%) | ||
| UNK | 19 (13.6%) | 47 (14.5%) | ||
| Negative Rhesus antigen | 12 (9.9%) | 25 (9%) | Chi2 | .851 |
| Direct admission to ICU | 10 (7.1%) | 38 (11.7%) | Chi2 | .183 |
| Weight | 76±14 | 83±17 | t | <.001 |
| Hypertension | 70 (50%) | 194 (59.7%) | Chi2 | .066 |
| Diabetes mellitus | 34 (24.3%) | 101 (31.1%) | Chi2 | .149 |
| Immunosuppression | 13 (9.3%) | 34 (10.5%) | Chi2 | .741 |
| Cardiovascular disease | 30 (21.4%) | 94 (28.9%) | Chi2 | .109 |
| Chronic renal failure | 8 (5.7%) | 66 (20.3%) | Chi2 | <.001 |
| Lung Disease | 28 (20.6%) | 65 (20.5%) | Chi2 | .999 |
| Smoker | 30 (22.1%) | 84 (26.5%) | Chi2 | .346 |
| Ground glass opacities (%) | 21±16 | 27±19 | t | <.001 |
| Lobar condensation | 9 (6.4%) | 29 (8.9%) | Chi2 | .462 |
| Pulmonary embolism | 0 (0%) | 3 (0.9%) | F | .557 |
| Leucocytes | 6850 (5200-10,450) | 7100 (5200-10,000) | MWU | .904 |
| Neutrophiles | 5165 (3625-7965) | 5430 (3590-8050) | MWU | .746 |
| Lymphocytes | 870 (565-1280) | 810 (540-1210) | MWU | .295 |
| Ferritin | 774 (456-1321) | 732 (350.5-1328.5) | MWU | .682 |
| LDH | 318 (249-432) | 336 (252-438) | MWU | .459 |
| D-dimers | 0.77 (0.44-2.1) | 0.88 (0.48-1.67) | MWU | .61 |
| CRP | 76 (27-156) | 94 (41.9-149) | MWU | .104 |
| Procalcitonin | 0.17 (0.07-0.33) | 0.18 (0.09-0.48) | MWU | .193 |
| HDL | 1.13099 (0.86-1.42) | 1.17 (0.99-1.34) | MWU | .715 |
| LDL | 3.17 (2.21-3.56868) | 2.79 (2.07-3.46) | MWU | .236 |
| Triglycerides | 1.78 (1.25-2.46) | 1.78 (1.34-2.48) | MWU | .469 |
| Serum Creatinin | 68.5 (54-90.5) | 81 (65-116) | MWU | <.001 |
| Oxygen (O2) needs at baseline | ||||
| No O2 | 46 (32.9%) | 80 (24.6%) | MWU | .313 |
| O2 < 4 L/min | 29 (20.7%) | 92 (28.3%) | ||
| O2 4-8 L/min | 42 (30%) | 93 (28.6%) | ||
| Optiflow | 23 (16.4%) | 60 (18.5%) | ||
| NEWS2 score | 5 (2-6) | 5 (3-6) | MWU | .307 |
| Length of stay | 8.5 (5-14) | 10 (6-18) | MWU | .028 |
| ICU transfer | 26 (18.6%) | 84 (25.8%) | Chi2 | .097 |
| Intubation | 11 (7.9%) | 59 (18.2%) | Chi2 | .004 |
| Intubation day | 8 (3-13) | 6 (2-11) | MWU | .621 |
| PCFS at discharge class 3-4 | 28 (23.0%) | 75 (30.5%) | Chi2 | .140 |
| PCFS at 2-Month class 3-4 | 6 (5.0%) | 24 (9.8%) | Chi2 | .155 |
Chi2, Chi squared test; F, Fisher exact test; ICU, Intensive care unit; LDH, lactodehydrogenase; MWU, Mann-Whitney U test; PAD, pulmonary artery diameter; PCFS, Post–COVID-19 Functional Status scale; t, independent samples t test.Categorical data are presented as frequencies and percentages. Continuous data not departing from normality assumptions are presented as mean ± SD. Continuous data departing from normality assumptions are presented as median and its interquartile range.
Multivariable Logistic Regression Analysis
Using multivariable logistic regression, the adjusted odds ratio between PAD of 24.5 mm and above and all-cause mortality remained unaffected (multivariate OR, 2.07; 95%, CI 1.05-4.09). Pulmonary artery diameter of 24.5 mm and above was associated with all-cause mortality independently of hypertension, weight, chronic renal failure, cardiovascular disease, C-reactive protein, and ground glass opacities on CT-scan (Table 5). The model’s C statistic was 0.750 (95% CI, 0.689-0.811), improving on univariate area under the curve.
Table 5.
Multivariable Logistic Regression to Adjust the Odds Ratio Between PA Diameter ≥24.5 mm and All-Cause Mortality, Accounting for all Baseline Factors With a Univariate P value≤.10
| Factor | Bêta | SE(Bêta) | Wald | df | P value | OR | 95% CI |
|---|---|---|---|---|---|---|---|
| Hypertension | 0.649 | 0.321 | 4.088 | 1 | .043 | 1.913 | 1.020-3.588 |
| Weight | −0.016 | 0.009 | 3.631 | 1 | .057 | 0.984 | 0.967-1.000 |
| Chronic renal failure | 0.968 | 0.330 | 8.591 | 1 | .003 | 2.634 | 1.378-5.032 |
| Cardiovascular disease | 0.774 | 0.301 | 6.630 | 1 | .010 | 2.169 | 1.203-3.909 |
| PA diameter ≥ 24.5 mm | 0.727 | 0.348 | 4.371 | 1 | .037 | 2.068 | 1.047-4.087 |
| CRP | 0.002 | 0.001 | 1.873 | 1 | .171 | 1.002 | 0.999-1.004 |
| Ground glass opacities (%) | 0.014 | 0.008 | 3.593 | 1 | .058 | 1.014 | 1.000-1.029 |
| Constant | −2.248 | 0.763 | 8.687 | 1 | .003 | 0.106 |
CRP, C-reactive protein; PA, pulmonary artery.
Omnibus Test of Model Coefficients: P<.001.
−2 Log likelihood = 351.63.
Nagelkerke R Square = 0.196.
Hosmer-Lemeshow statistic: 6.49; P=.592.
Discussion
This retrospective study conducted at the Hôtel-Dieu of France, one of the largest tertiary centers and one of the main treatment centers for COVID-19 in Lebanon, suggests that a PAD of more than 24.5 mm, measured by NCCT at admission, is an independent risk factor for predicting mortality in patients hospitalized with COVID-19, with 81.4% sensitivity and 32.7% specificity, and can be of great help as a screening tool. These results are consistent with published results by Zhu et al21, and Esposito et al22 reporting that pulmonary artery enlargement predicts overall survival in patients with SARS-CoV-2. Although a higher cutoff for PAD could have been considered (taking into account normal PAD values in other populations), it would be less sensitive albeit more specific, a combination not optimal for screening purposes.
The NEWS2 Score is a validated scale for predicting clinical risk of mortality and life-threatening outcomes in patients with COVID-19.23 Although on admission more than half the patients had a NEWS2 score indicating medium-to-high clinical risk for deterioration, the NEWS2 score was not correlated with PAD, suggesting that PAD enlargement could convey a risk not captured by NEWS2, because PAD was correlated hospital length of stay and was larger in patients requiring invasive mechanical ventilation.
Severe forms of COVID-19 can be complicated by an inflammatory response and a cytokine storm with leucopenia,24 an elevation of D-dimer,25 lactodehydrogenase,26 C-reactive protein (CRP),26 ferritin,27 interleukin (IL) 6,28 and pro-calcitonin.29,30 This storm of inflammatory cytokines leads to endothelial and epithelial dysfunction,31 which can lead to an increase in pulmonary vascular resistance,32 a dilation of the pulmonary vascular bed including the pulmonary artery. The early secretion of high levels of inflammatory cytokines (IL-6, IL-10, and tumor necrosis factor α)33 is responsible for the development of acute respiratory distress syndrome and pulmonary hypertension in patients with SARS-CoV-2.34,35 The current study corroborates the existing literature22,36 in that higher levels of IL-6, C-reactive protein, lactodehydrogenase, and D-dimers were found in patients requiring admission to the ICU, supporting the hypothesis that COVID-19–related pulmonary hypertension is induced by a thrombo-inflammatory syndrome.37
To the best of our knowledge, this is the first study to evaluate the relationship between the diameter of the pulmonary artery on admission and the PCFS and respiratory status on discharge and at 2-month follow-up in patients hospitalized with COVID-19. The alveolar–capillary insult leading to the development of acute respiratory distress syndrome and acute pulmonary hypertension can lead to debilitating and persistent symptoms (such as fatigue and dyspnea) 6–8 months after infection.38,39 Thus, PAD measurement can be a quick and easy tool to guide and adapt effective treatment and rehabilitation strategies for patients hospitalized with COVID-19.
This work has some limitations. Patients with a history of pulmonary hypertension or chronic lung disease were not excluded. Second, we did not have any knowledge about patients’ PAD before their hospitalization. Third, right ventricular function and pulmonary arterial pressure were not estimated by right heart catheterization, echocardiography and point-of-care ultrasound. Fourth, the Horowitz index for Lung Function (P/F ratio) to assess lung function is unavailable at baseline. In addition, the measurement of the pulmonary artery by NCCT is affected by “heart rate, acoustic window, operator experience”40 and the presence of relevant lung disease.41 Although to our knowledge this is one of the largest studies regarding PAD and COVID-19 outcomes to date, it is retrospective and involves a single hospital with a Caucasian population, so it needs to be confirmed in other studies including the same and different ethnicities. Another caveat is that baseline characteristics of the patients were not combined and summarized in clinical scoring tools beyond the NEWS2 score, which could have been used to correlate the scoring tools with PA diameter and added to the multivariate model.
Conclusion
The measurement of the pulmonary artery by NCCT on hospitalization is an independent risk factor for in-hospital mortality that can help identify severe cases and be a useful prognostic parameter of patients with COVID-19 as it is associated with overall survival and adapt rehabilitation strategies after discharge.
Potential Competing Interests
The authors report no competing interests.
Acknowledgments
This work would not have been possible without the unwavering support of our visionary and humanistic administration, namely the Company of Jesus, and all the medical and nursing staff. This policy was at the service of humans and for humans in the image of our noblest principles. M.R. and G.S.: Conception and design of the study; G.S.: Analysis and interpretation of data; A.I., M.R., M.A., F.F., S.H., A.K., N.A.: Acquisition of data, drafting the article and revising it critically for important intellectual content; M.R.: Final approval of the version to be submitted. The Research and Ethics committee of Hôtel-Dieu de France and the Saint Joseph University of Beirut, Faculty of Medicine, approved this study.
Footnotes
Grant Support: This research did not receive any specific grant from funding agencies in the public, commercial, or not-for-profit sectors.
Data Previously Presented: The data in this paper have been published as an abstract in the European Respiratory Journal.
References
- 1.Zhu N., Zhang D., Wang W., et al. A novel coronavirus from patients with pneumonia in China, 2019. N Engl J Med. 2020;382(8):727–733. doi: 10.1056/NEJMoa2001017. [DOI] [PMC free article] [PubMed] [Google Scholar]
- 2.Anon . 11 March 2020. WHO Director-General’s opening remarks at the media briefing on COVID-19.https://www.who.int/docs/default-source/coronaviruse/transcripts/who-audio-emergencies-coronavirus-press-conference-full-and-final-11mar2020.pdf Accessed August 11, 2022. [Google Scholar]
- 3.Anon. COVID-19 Dashboard by the Center for Systems Science and Engineering (CSSE) at Johns Hopkins University (JHU). Johns Hopkins Coronavirus Resource Center. Accessed August 11, 2022. https://ccp.jhu.edu/kap-covid/?gclid=CjwKCAjw0dKXBhBPEiwA2bmObW2oCu9s2HbHfvZAfYH-SeMkc-lPWCPDI71ZNWp0Edqlme90xGhWJBoCyaIQAvD_BwE
- 4.Richardson S., Hirsch J.S., Narasimhan M., Crawford J.M., McGinn T., Davidson K.W., the Northwell COVID-19 Research Consortium Presenting characteristics, comorbidities, and outcomes among 5700 patients hospitalized with COVID-19 in the New York City Area. JAMA. 2020;323(20):2052–2059. doi: 10.1001/jama.2020.6775. [DOI] [PMC free article] [PubMed] [Google Scholar]
- 5.Wynants L., Van Calster B., Collins G.S., et al. Prediction models for diagnosis and prognosis of covid-19: systematic review and critical appraisal. BMJ. 2020;369:m1328. doi: 10.1136/bmj.m1328. [DOI] [PMC free article] [PubMed] [Google Scholar]
- 6.Grasselli G., Greco M., Zanella A., et al. Risk factors associated with mortality among patients with Covid-19 in intensive care units in Lombardy, Italy. JAMA Intern Med. 2020;180(10):1345–1355. doi: 10.1001/jamainternmed.2020.3539. [DOI] [PMC free article] [PubMed] [Google Scholar]
- 7.Peckham H., de Gruijter N.M., Raine C., et al. Male sex identified by global COVID-19 meta-analysis as a risk factor for death and ITU admission. Nat Commun. 2020;11(1):6317. doi: 10.1038/s41467-020-19741-6. [DOI] [PMC free article] [PubMed] [Google Scholar]
- 8.Gao Y.D., Ding M., Dong X., et al. Risk factors for severe and critically ill COVID-19 patients: a review. Allergy. 2021;76(2):428–455. doi: 10.1111/all.14657. [DOI] [PubMed] [Google Scholar]
- 9.Vasbinder A., Anderson E., Shadid H., et al. Inflammation, hyperglycemia, and adverse outcomes in individuals with diabetes mellitus hospitalized for COVID-19. Diabetes Care. 2022;45(3):692–700. doi: 10.2337/dc21-2102. [DOI] [PMC free article] [PubMed] [Google Scholar]
- 10.Liu C., Zhao Y., Okwan-Duodu D., Basho R., Cui X. COVID-19 in cancer patients: risk, clinical features, and management. Cancer Biol Med. 2020;17(3):519–527. doi: 10.20892/j.issn.2095-3941.2020.0289. [DOI] [PMC free article] [PubMed] [Google Scholar]
- 11.Koo H.J., Lim S., Choe J., Choi S.H., Sung H., Do K.H. Radiographic and CT features of viral pneumonia. Radiographics. 2018;38(3):719–739. doi: 10.1148/rg.2018170048. [DOI] [PubMed] [Google Scholar]
- 12.Xu B., Xing Y., Peng J., et al. Chest CT for detecting COVID-19: a systematic review and meta-analysis of diagnostic accuracy. Eur Radiol. 2020;30(10):5720–5727. doi: 10.1007/s00330-020-06934-2. [DOI] [PMC free article] [PubMed] [Google Scholar]
- 13.Zouk A.N., Gulati S., Xing D., Wille K.M., Rowe S.M., Wells J.M. Pulmonary artery enlargement is associated with pulmonary hypertension and decreased survival in severe cystic fibrosis: a cohort study. PloS One. 2020;15(2):e0229173. doi: 10.1371/journal.pone.0229173. [DOI] [PMC free article] [PubMed] [Google Scholar]
- 14.Obaidat B., Yazdani D., Wikenheiser-Brokamp K.A., Gupta N. Diffuse cystic lung diseases. Respir Care. 2020;65(1):111–126. doi: 10.4187/respcare.07117. [DOI] [PubMed] [Google Scholar]
- 15.Cuttica M.J., Bhatt S.P., Rosenberg S.R., et al. Pulmonary artery to aorta ratio is associated with cardiac structure and functional changes in mild-to-moderate COPD. Int J Chron Obstruct Pulmon Dis. 2017;12:1439–1446. doi: 10.2147/COPD.S131413. [DOI] [PMC free article] [PubMed] [Google Scholar]
- 16.Wells J.M., Washko G.R., Han M.K., et al. Pulmonary arterial enlargement and acute exacerbations of COPD. N Engl J Med. 2012;367(10):913–921. doi: 10.1056/NEJMoa1203830. [DOI] [PMC free article] [PubMed] [Google Scholar]
- 17.Kogo M., Otsuka K., Morimoto T., Nagata K., Nakagawa A., Tomii K. Pulmonary artery enlargement predicts poor outcome during acute exacerbations of fibrotic interstitial lung disease. Respirology. 2019;24(8):777–782. doi: 10.1111/resp.13504. [DOI] [PubMed] [Google Scholar]
- 18.Yildiz M., Yadigar S., Yildiz B.Ş., et al. Evaluation of the relationship between COVID-19 pneumonia severity and pulmonary artery diameter measurement. Herz. 2021;46(1):56–62. doi: 10.1007/s00059-020-05014-x. [DOI] [PMC free article] [PubMed] [Google Scholar]
- 19.Klok F.A., Boon G.J.A.M., Barco S., et al. The Post-COVID-19 Functional Status scale: a tool to measure functional status over time after COVID-19. Eur Respir J. 2020;56(1):2001494. doi: 10.1183/13993003.01494-2020. [DOI] [PMC free article] [PubMed] [Google Scholar]
- 20.Smith G.B., Redfern O.C., Pimentel M.A., et al. The National Early Warning Score 2 (NEWS2) Clin Med (Lond) 2019;19(3):260. doi: 10.7861/clinmedicine.19-3-260. [DOI] [PMC free article] [PubMed] [Google Scholar]
- 21.Zhu Q.Q., Gong T., Huang G.Q., et al. Pulmonary artery trunk enlargement on admission as a predictor of mortality in in-hospital patients with COVID-19. Jpn J Radiol. 2021;39(6):589–597. doi: 10.1007/s11604-021-01094-9. [DOI] [PMC free article] [PubMed] [Google Scholar]
- 22.Esposito A., Palmisano A., Toselli M., et al. Chest CT-derived pulmonary artery enlargement at the admission predicts overall survival in COVID-19 patients: insight from 1461 consecutive patients in Italy. Eur Radiol. 2021;31(6):4031–4041. doi: 10.1007/s00330-020-07622-x. [DOI] [PMC free article] [PubMed] [Google Scholar]
- 23.Myrstad M., Ihle-Hansen H., Tveita A.A., et al. National Early Warning Score 2 (NEWS2) on admission predicts severe disease and in-hospital mortality from Covid-19—a prospective cohort study. Scand J Trauma Resusc Emerg Med. 2020;28(1):1–8. doi: 10.1186/s13049-020-00764-3. [DOI] [PMC free article] [PubMed] [Google Scholar]
- 24.Terpos E., Ntanasis-Stathopoulos I., Elalamy I., et al. Hematological findings and complications of COVID-19. Am J Hematol. 2020;95(7):834–847. doi: 10.1002/ajh.25829. [DOI] [PMC free article] [PubMed] [Google Scholar]
- 25.Yu H.H., Qin C., Chen M., Wang W., Tian D.S. D-dimer level is associated with the severity of COVID-19. Thromb Res. 2020;195:219–225. doi: 10.1016/j.thromres.2020.07.047. [DOI] [PMC free article] [PubMed] [Google Scholar]
- 26.Izcovich A., Ragusa M.A., Tortosa F., et al. Prognostic factors for severity and mortality in patients infected with COVID-19: a systematic review. PloS One. 2020;15(11):e0241955. doi: 10.1371/journal.pone.0241955. [DOI] [PMC free article] [PubMed] [Google Scholar]
- 27.Velavan T.P., Meyer C.G. Mild versus severe COVID-19: laboratory markers. Int J Infect Dis. 2020;95:304–307. doi: 10.1016/j.ijid.2020.04.061. [DOI] [PMC free article] [PubMed] [Google Scholar]
- 28.Han H., Ma Q., Li C., et al. Profiling serum cytokines in COVID-19 patients reveals IL-6 and IL-10 are disease severity predictors. Emerg Microbes Infect. 2020;9(1):1123–1130. doi: 10.1080/22221751.2020.1770129. [DOI] [PMC free article] [PubMed] [Google Scholar]
- 29.Zhou F., Yu T., Du R., et al. Clinical course and risk factors for mortality of adult inpatients with COVID-19 in Wuhan, China: a retrospective cohort study. Lancet. 2020;395(10229):1054–1062. doi: 10.1016/S0140-6736(20)30566-3. [DOI] [PMC free article] [PubMed] [Google Scholar]
- 30.Lippi G., Plebani M. Laboratory abnormalities in patients with COVID-2019 infection. Clin Chem Lab Med. 2020;58(7):1131–1134. doi: 10.1515/cclm-2020-0198. [DOI] [PubMed] [Google Scholar]
- 31.Matthay M.A., Zemans R.L. The acute respiratory distress syndrome: pathogenesis and treatment. Annu Rev Pathol. 2011;6:147–163. doi: 10.1146/annurev-pathol-011110-130158. [DOI] [PMC free article] [PubMed] [Google Scholar]
- 32.Simonneau G., Montani D., Celermajer D.S., et al. Haemodynamic definitions and updated clinical classification of pulmonary hypertension. Eur Respir J. 2019;53(1):1801913. doi: 10.1183/13993003.01913-2018. [DOI] [PMC free article] [PubMed] [Google Scholar]
- 33.Tisoncik J.R., Korth M.J., Simmons C.P., Farrar J., Martin T.R., Katze M.G. Into the eye of the cytokine storm. Microbiol Mol Biol Rev. 2012;76(1):16–32. doi: 10.1128/MMBR.05015-11. [DOI] [PMC free article] [PubMed] [Google Scholar]
- 34.Potus F., Mai V., Lebret M., et al. Novel insights on the pulmonary vascular consequences of COVID-19. Am J Physiol Lung Cell Mol Physiol. 2020;319(2):L277–L288. doi: 10.1152/ajplung.00195.2020. [DOI] [PMC free article] [PubMed] [Google Scholar]
- 35.Barbosa L.C., Gonçalves T.L., de Araujo L.P., de Oliveira Rosario L.V., Ferrer V.P. Endothelial cells and SARS-CoV-2: an intimate relationship. Vascul Pharmacol. 2021;137:106829. doi: 10.1016/j.vph.2021.106829. [DOI] [PMC free article] [PubMed] [Google Scholar]
- 36.Brenner S.K., Azam T.U., Parrillo J.E., et al. Right ventricular dysfunction in critically ill patients with COVID-19. Am J Cardiol. 2022;168:176–178. doi: 10.1016/j.amjcard.2022.01.004. [DOI] [PMC free article] [PubMed] [Google Scholar]
- 37.Ciceri F., Beretta L., Scandroglio A.M., et al. Microvascular COVID-19 lung vessels obstructive thromboinflammatory syndrome (MicroCLOTS): an atypical acute respiratory distress syndrome working hypothesis. Crit Care Resusc. 2020;22(2):95–97. doi: 10.51893/2020.2.pov2. [DOI] [PMC free article] [PubMed] [Google Scholar]
- 38.Mehandru S., Merad M. Pathological sequelae of long-haul COVID. Nat Immunol. 2022;23(2):194–202. doi: 10.1038/s41590-021-01104-y. [DOI] [PMC free article] [PubMed] [Google Scholar]
- 39.Phetsouphanh C., Darley D.R., Wilson D.B., et al. Immunological dysfunction persists for 8 months following initial mild-to-moderate SARS-CoV-2 infection. Nat Immunol. 2022;23(2):210–216. doi: 10.1038/s41590-021-01113-x. [DOI] [PubMed] [Google Scholar]
- 40.Janda S., Shahidi N., Gin K., Swiston J. Diagnostic accuracy of echocardiography for pulmonary hypertension: a systematic review and meta-analysis. Heart. 2011;97(8):612–622. doi: 10.1136/hrt.2010.212084. [DOI] [PubMed] [Google Scholar]
- 41.Li Y., Li H., Zhu S., et al. Prognostic value of right ventricular longitudinal strain in patients with COVID-19. JACC Cardiovasc Imaging. 2020;13(11):2287–2299. doi: 10.1016/j.jcmg.2020.04.014. [DOI] [PMC free article] [PubMed] [Google Scholar]