

Abstract
OBJECTIVE:
Academic medicine diversity is important for addressing health disparities and training the next generation. A recent study highlighted the lack of diversity among pediatric trainees over time. However, trends in US pediatric faculty diversity have not been clearly illuminated. The aim of this study is to evaluate pediatric faculty diversity trends and compare racial/ethnic representation between pediatric faculty and the US population.
METHODS:
Repeat cross-sectional study of the Association of American Medical Colleges Faculty Roster of pediatric faculty from 2000 to 2020. Trends in sex, race, ethnicity, and rank were compared with the Cochran-Armitage test. Data on faculty race/ethnicity were compared with the general and child population by using US Census Bureau data.
RESULTS:
Trends in underrepresented in medicine (URiM) faculty representation significantly increased at all ranks: professor (+3.5%, P < .0001), associate professor (+3.0%, P = .0001), and assistant professor (+2.5%, P = .0001). URiM male representation remained unchanged (P = .14), whereas significantly increased trends occurred in URiM female representation (+3.4%, P < .0001). African American/Black males significantly decreased representation at associate (−0.4%, P = .04) and assistant professor levels (−0.6%, P < .0001), and American Indian/Alaska Native males significantly decreased representation at the assistant professor rank (−0.1%, P < .0001). The percentage of URiM pediatric faculty representation was considerably lower compared with 2020 US overall and longitudinal child population representation.
CONCLUSION:
The stagnation of URiM male representation and lack of faculty diversity reflective of the US population may have a critical impact on the ability to recruit/retain a diverse pediatric workforce and promote equitable care.
Diversity of the health care workforce is critical for the provision of culturally effective care that could improve health outcomes, increase access to care, and enhances the pool of medically trained policymakers and health care leaders.1 The racial and ethnic demographics of children living in the United States are rapidly changing. According to the most recent report from the US Census Bureau, the proportion of children from diverse racial and ethnic minority groups, including American Indian/Alaska, Asian, Black, Hispanic, and Native Hawaiian/other Pacific Islander is increasing,2 which is important for pediatricians to recognize given the numerous disparities in health outcomes associated with a child’s race and/or ethnicity.3 The etiologies for the observed disparities in health outcomes among children are complex and, in part, are due to historical and current oppressive structures and policies. Reducing these disparities will require multiple strategies, one of which is a more racially and ethnically diverse pediatric workforce, as suggested by the Association of American Medical Colleges (AAMC) Diversity 3.0 Initiative.4
Workforce diversity has been increasingly emphasized in academic medicine, especially regarding the recruitment and retention of physicians underrepresented in medicine (URiM). Despite the evidence supporting a more diverse workforce,5–11 the diversity of the physician workforce does not reflect the racial and ethnic diversity of the United States. According to the AAMC, 5.0% and 5.8% of all active physicians identify as African American/Black and Hispanic/Latino, respectively.12 These statistics decrease to 3.6% and 3.2% of medical school faculty identifying as African American/Black and Hispanic/Latino, respectively.13 In addition, a recent study revealed declines in the racial and ethnic (Black and Hispanic) composition of clinical academic faculty representation relative to the overall population.14 Within academic medicine, racial and ethnic diversity is critical in preparing medical students and residents to practice within racially and ethnically heterogeneous populations and for promoting biomedical research to address disparities in health access and outcomes in underresourced communities.1
Previous studies within pediatrics evaluating the racial and ethnic diversity of the academic pathway have produced mixed results. A recent study revealed that the representation of pediatric trainees identifying as URiM did not improve significantly over a 12-year period.15 Within academic pediatrics, a study using data from the Academic Pediatric Association (APA) found that membership increased among child health professionals who identified as URiM.16 Yet, a cross-sectional study of racial and ethnic diversity among departments of pediatrics across the country revealed that diversity was poor overall and decreased as academic rank increased.17 However, trends in the diversity of pediatric faculty have not been clearly illuminated, nor has there been an exploration of the nuances in faculty diversity from a pediatric perspective.
Our aims with this study are to (1) evaluate trends over time from 2000 to 2020 in the diversity of pediatric faculty, (2) compare racial and ethnic representation between pediatric faculty and the overall US population in 2020, and (3) compare URiM faculty trends with a racially and ethnically concordant patient population.
METHODS
Design
We performed a repeat cross-sectional study of race, ethnicity, sex, and rank of pediatric faculty using AAMC Faculty Rosters from 2000 to 2020. The AAMC Medical Minority Applicant Registry defines URiM as self-identification as African American/Black, Hispanic, American Indian/Alaska Native, or Native Hawaiian/Pacific Islander.18 This report follows the Strengthening the Reporting of Observational Studies in Epidemiology reporting guideline for cross-sectional studies. This study was considered exempt from human subject research by the Wake Forest University Health Sciences Institutional Review Board.
Data Sources
The AAMC initiated the Faculty Roster in 1966 to collect information on the characteristics of full-time faculty members at US medical schools accredited by the Liaison Committee on Medical Education.19 On the basis of data collected by the AAMC Faculty Roster Survey, race and ethnicity in this study were defined as non-Hispanic African American/Black, referred to as African American/Black, non-Hispanic Native American/Alaska Native, referred to as Native American/Alaska Native, non-Hispanic Native Hawaiian/Pacific Islander, referred to as Native American/Pacific Islander, and Hispanic or Latino (of any race, including multirace, Hispanic), referred to as Hispanic. The non-Hispanic Asian, non-Hispanic White, non-Hispanic multiracial, and non-Hispanic other categories were included in the totals but not separately characterized. We obtained 2020 US population data from the US Census Bureau.20 We obtained revised US Census Bureau pediatric population estimates from 2000 to 2020 from the KIDS COUNT Data Center.21 The racial and ethnic categories used throughout this article reflect those reported in the original data sources.
Statistical Analysis
Results were analyzed by using descriptive statistics. The inclusion of racial and ethnic groups in the URiM category was based on the AAMC definition of URiM. Therefore, multiracial and “other” race and ethnicity categories were not included in the URiM category. Because the unknown race category could not be further characterized, it was excluded from analyses. URiM proportions (number of URiM faculty/total number of faculty) were calculated for all years (2000–2020) by race, ethnicity, sex, and rank; the Clopper-Pearson exact binomial method was used to calculate 95% confidence intervals. To determine if there was a significant trend in URiM representation over time, proportions (URiM/total) were compared by race and ethnicity, sex, and rank with the Cochran-Armitage test from all years, 2000 to 2020. Results were considered statistically significant at a 2-tailed P value <.05. SAS (version 9.4, Cary, NC) was used for all analyses.
RESULTS
Trends in Faculty Diversity Over Time
A total of 367 863 pediatric faculty members were included. Overall, the unknown race and ethnicity category accounted for 9417 (2.6%) of pediatric faculty; the non-Hispanic multiracial category accounted for 7470 (2.0%) of pediatric faculty.
Between 2000 and 2020, the total number of pediatric faculty increased from 9510 (2000) to 17 033 (2020). Significantly increased trends occurred in URiM faculty representation at all ranks: professor (4.2% in 2000 to 7.7% in 2020, P < .0001), associate professor (7.4% in 2000 to 10.4% in 2020, P < .0001), and assistant professor (11.3% in 2000 to 13.9% in 2020, P < .0001) (Table 1; Fig 1).
TABLE 1.
Trends in URiM Faculty by Sex and Rank, 2000–2020
| Sex | Rank | 2000 (%) | 95% CI | 2020 (%) | 95% CI | Cochran-Armitage Trend Test P value |
|---|---|---|---|---|---|---|
| Combined | Professor | 4.22 | 3.45–5.11 | 7.72 | 6.94–8.56 | <.0001 |
| Assoc Prof | 7.41 | 6.42–8.49 | 10.45 | 9.63–11.31 | <.0001 | |
| Asst Prof | 11.37 | 10.48–12.30 | 13.91 | 13.28–14.56 | <.0001 | |
| Combined | 8.5 | 7.94–9.07 | 11.8 | 11.36–12.24 | <.0001 | |
| Male | Professor | 2.96 | 2.31–3.72 | 4.03 | 3.46–4.66 | 0.0026 |
| Assoc Prof | 4.05 | 3.32–4.89 | 3.99 | 3.48–4.56 | 0.27 | |
| Asst Prof | 4.61 | 4.02–5.26 | 3.98 | 3.63–4.35 | 0.0001 | |
| Combined | 4.05 | 3.66–4.46 | 3.99 | 3.73–4.27 | 0.14 | |
| Female | Professor | 1.27 | 0.86–1.80 | 3.7 | 3.15–4.31 | <.0001 |
| Assoc Prof | 3.35 | 2.69–4.12 | 6.45 | 5.80–7.16 | <.0001 | |
| Asst Prof | 6.71 | 6.00–7.47 | 9.93 | 9.39–10.49 | <.0001 | |
| Combined | 4.45 | 4.04–4.88 | 7.8 | 7.44–8.18 | <.0001 |
Assoc Prof, Associate Professor; Asst Prof, Assistant Professor; CI, confidence interval.
FIGURE 1.
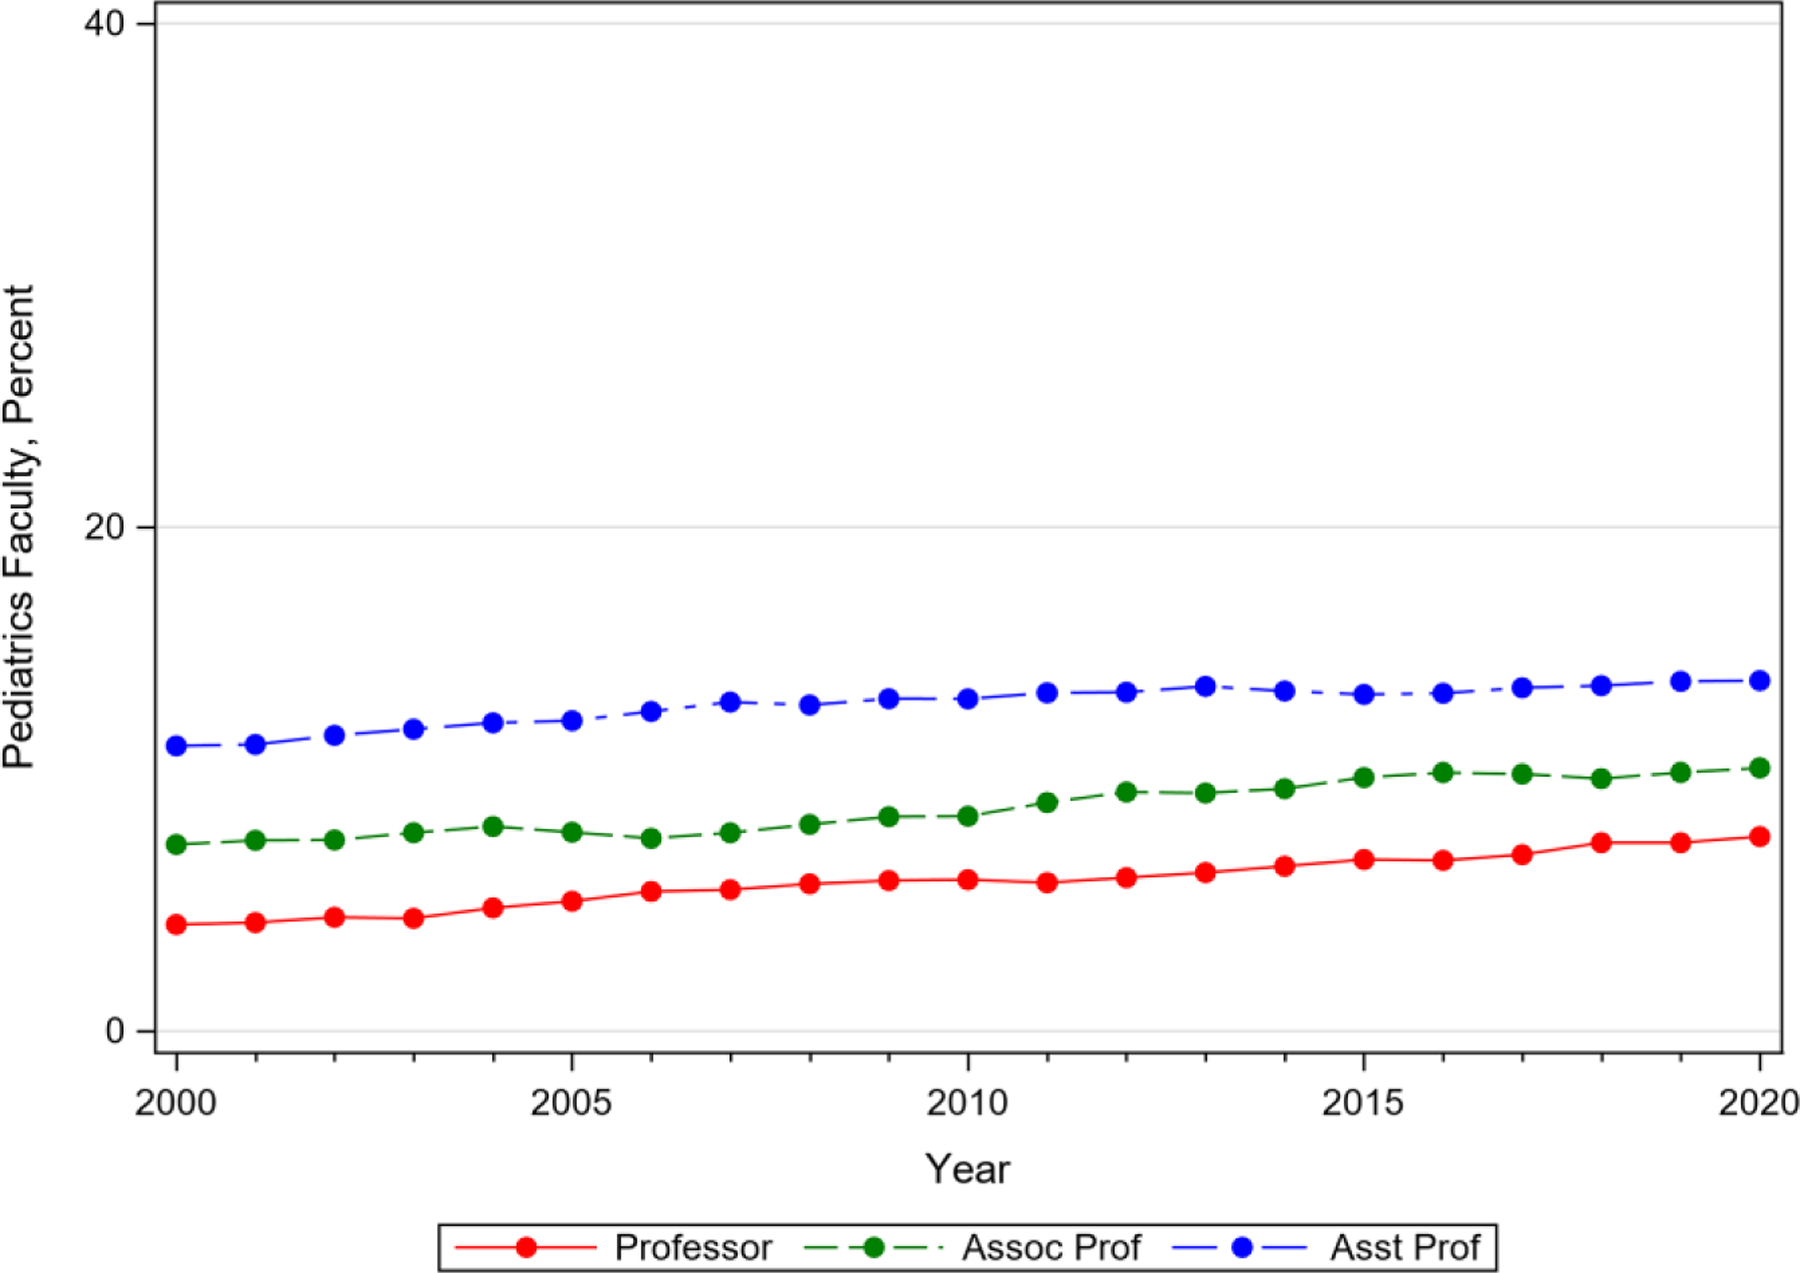
Trends in pediatric faculty by rank and URiM status, 2000–2020.
Abbreviations: Assoc Prof, Associate Professor; Asst Prof, Assistant Professor; URM, Underrepresented in Medicine
URiM male representation remained unchanged over time at all ranks (4.0% in 2000 to 4.0% in 2020, P = .14), whereas a significantly increased trend occurred in URiM female representation at all ranks (4.4% in 2000 to 7.8% in 2020, P < .0001) (Table 1; Fig 2). Among the different URiM groups, female faculty significantly increased representation at all ranks except for American Indian/Alaska Native professors and assistant professors.
FIGURE 2.
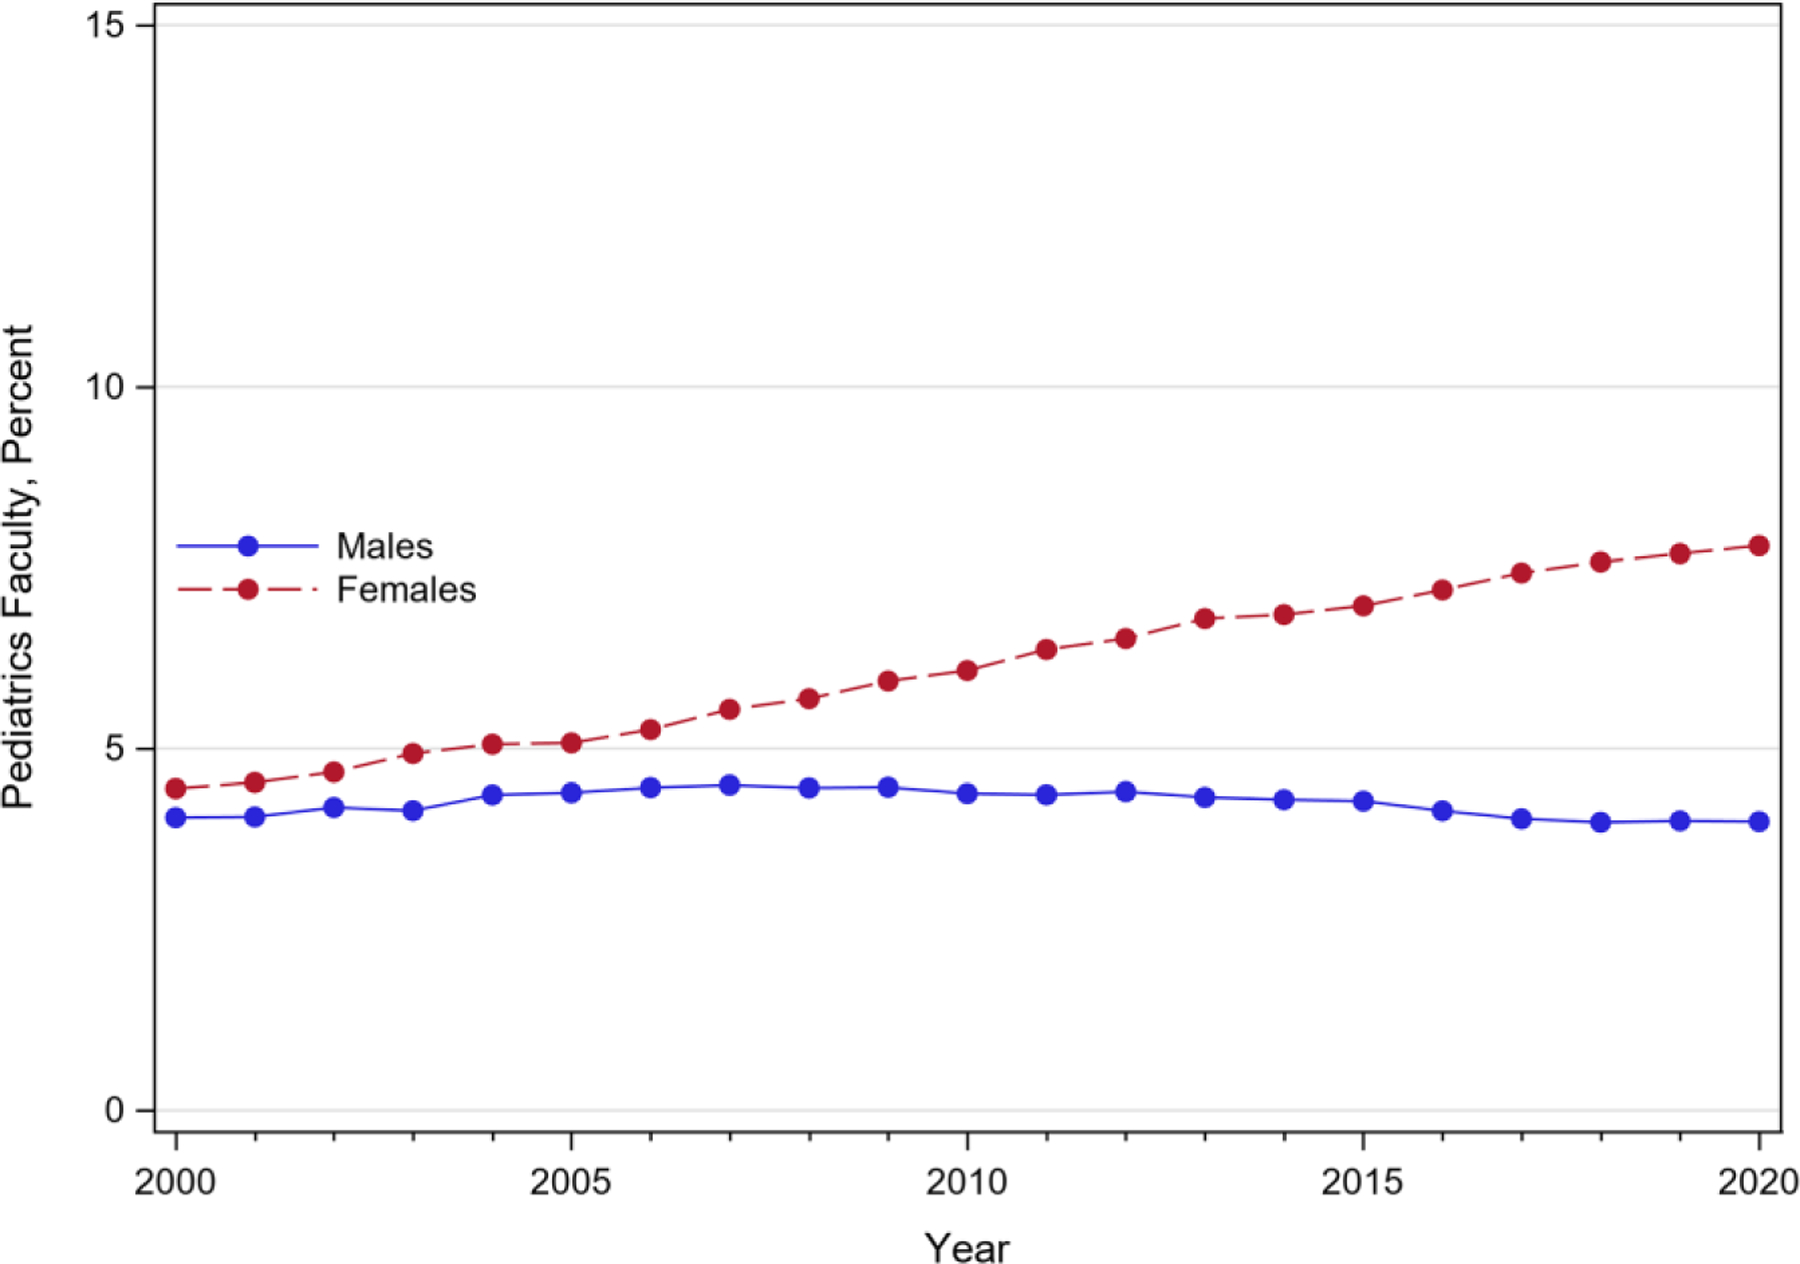
Trends in URiM faculty by sex, 2000–2020.
American Indian/Alaska Native males significantly decreased representation at the assistant professor rank (0.17% in 2000 to 0.04% in 2020, P < .0001). African American/Black males significantly decreased representation at the associate (1.4% in 2000 to 1.0% in 2020, P = .04) and assistant professor ranks (1.6% in 2000 to 1.0% in 2020, P < .0001), and significantly decreased representation across all ranks (1.32% in 2000 to 1.04% in 2020, P < .0001). Hispanic males significantly increased representation at the professor rank (2.15% in 2000 to 2.76% in 2020, P = .05); and Native Hawaiian/Pacific Islander males significantly increased representation at the professor rank (0% in 2000 to 0.05% in 2020, P = .001) (Table 2).
TABLE 2.
Trends in URiM Faculty by Race, Ethnicity and Sex, 2000–2020
| Race/Ethnicity | Sex | Rank | 2000 (%) | 95% CI | 2020 (%) | 95% CI | Cochran-Armitage Trend Test P value |
|---|---|---|---|---|---|---|---|
| American Indian or Alaskan Native | Male | Professor | 0.09 | 0.03–0.24 | 0.08 | 0.01–0.30 | 0.261 |
| Assoc Prof | 0.08 | 0.01–0.28 | 0.12 | 0.04–0.25 | 0.0594 | ||
| Asst Prof | 0.17 | 0.07–0.34 | 0.04 | 0.01–0.10 | <.0001 | ||
| Female | Professor | 0.04 | 0–0.23 | 0.09 | 0.03–0.24 | 0.0002 | |
| Assoc Prof | 0 | 0–0.14 | 0.1 | 0.03–0.23 | <.0001 | ||
| Asst Prof | 0.02 | 0–0.12 | 0.1 | 0.05–0.17 | 0.0361 | ||
| Combined | Professor | 0.12 | 0.03–0.36 | 0.19 | 0.08–0.37 | 0.7433 | |
| Assoc Prof | 0.08 | 0.01–0.28 | 0.21 | 0.11–0.38 | <.0001 | ||
| Asst Prof | 0.19 | 0.09–0.36 | 0.14 | 0.08–0.23 | 0.0982 | ||
| Male | All | 0.12 | 0.06–0.22 | 0.07 | 0.04–0.12 | 0.0022 | |
| Female | All | 0.02 | 0–0.12 | 0.1 | 0.05–0.17 | <.0001 | |
| Combined | All | 0.14 | 0.08–0.24 | 0.17 | 0.12–0.23 | 0.2564 | |
| Black or African American | Male | Professor | 0.71 | 0.41–1.13 | 1.12 | 0.83–1.49 | 0.0001 |
| Assoc Prof | 1.39 | 0.97–1.91 | 1.01 | 0.75–1.32 | 0.0412 | ||
| Asst Prof | 1.6 | 1.26–2.01 | 1.03 | 0.86–1.23 | <.0001 | ||
| Female | Professor | 0.37 | 0.17–0.71 | 1.31 | 0.99–1.70 | <.0001 | |
| Assoc Prof | 1.46 | 1.04–2.00 | 2.79 | 2.36–3.28 | <.0001 | ||
| Asst Prof | 3.14 | 2.66–3.68 | 4.41 | 1.05–4.81 | <.0001 | ||
| Combined | Professor | 1.08 | 0.71–1.58 | 2.43 | 1.99–2.94 | <.0001 | |
| Assoc Prof | 2.85 | 2.24–3.56 | 3.8 | 3.29–4.36 | <.0001 | ||
| Asst Prof | 4.75 | 4.15–5.4 | 5.45 | 5.04–5.88 | 0.3035 | ||
| Male | All | 1.32 | 1.1–1.57 | 1.04 | 0.91–1.19 | <.0001 | |
| Female | All | 2 | 1.73–2.3 | 3.38 | 3.14–3.64 | <.0001 | |
| Combined | All | 3.33 | 2.98–3.7 | 4.43 | 4.15–4.71 | <.0001 | |
| Hispanic | Male | Professor | 2.15 | 1.61–2.82 | 2.76 | 2.29–3.3 | 0.0463 |
| Assoc Prof | 2.57 | 2.0–3.26 | 2.87 | 2.43–3.36 | 0.078 | ||
| Asst Prof | 2.8 | 2.34–3.32 | 2.88 | 2.58–3.20 | 0.5423 | ||
| Female | Professor | 0.84 | 0.52–1.30 | 2.27 | 1.84–2.76 | <.0001 | |
| Assoc Prof | 1.87 | 1.38–2.473 | 3.47 | 2.99–4.01 | <.0001 | ||
| Asst Prof | 3.47 | 2.96–4.04 | 5.38 | 4.97–5.80 | <.0001 | ||
| Combined | Professor | 3 | 2.35–3.77 | 5.03 | 4.40–5.73 | <.0001 | |
| Assoc Prof | 4.44 | 3.68–5.32 | 6.34 | 5.69–7.04 | 0.0026 | ||
| Asst Prof | 6.27 | 5.58–7.01 | 8.26 | 7.76–8.77 | <.0001 | ||
| Male | All | 2.58 | 2.27–2.91 | 2.85 | 2.63–3.09 | 0.15 | |
| Female | All | 2.39 | 2.09–2.71 | 4.27 | 4.0–4.56 | <.0001 | |
| Combined | All | 4.96 | 5.54–5.42 | 7.13 | 6.78–7.48 | <.0001 | |
| Native Hawaiian or Pacific Islander | Male | Professor | 0 | 0–0.15 | 0.05 | 0–0.11 | 0.0013 |
| Assoc Prof | 0 | 0–0.14 | 0 | 0–0.07 | 0.6957 | ||
| Asst Prof | 0 | 0–0.08 | 0.03 | 0.01–0.08 | 0.6996 | ||
| Female | Professor | 0 | 0–0.15 | 0.02 | 0–0.13 | 0.1316 | |
| Assoc Prof | 0 | 0–0.14 | 0.1 | 0.03–0.23 | <.0001 | ||
| Asst Prof | 0 | 0–0.08 | 0.04 | 0.01–0.10 | 0.201 | ||
| Combined | Professor | 0 | 0–0.15 | 0.07 | 0.01–0.21 | 0.0004 | |
| Assoc Prof | 0 | 0–0.14 | 0.1 | 0.03–0.23 | <.0001 | ||
| Asst Prof | 0 | 0–0.08 | 0.07 | 0.03–0.14 | 0.3568 | ||
| Male | All | 0 | 0–0.04 | 0.02 | 0.01–0.06 | 0.2561 | |
| Female | All | 0 | 0–0.04 | 0.05 | 0.03–0.09 | 0.0007 | |
| Combined | All | 0 | 0–0.04 | 0.08 | 0.04–0.12 | 0.0005 |
Assoc Prof, Associate Professor; Asst Prof, Assistant Professor; CI, confidence interval.
US Population Comparison
In 2020, URiM pediatric faculty representation was considerably lower compared with representation in the 2020 US population: African American/Black, 4.4% versus 12.1%, American Indian/Alaska Native, 0.2% versus 1.1%, Native Hawaiian/Pacific Islander, 0.08% versus 0.2%, Hispanic, 7.1% versus 18.7% (Fig 3). Between 2000 and 2020, URiM pediatric faculty representation did not reflect the changing demographic profile of the US population of racially and ethnically concordant (Fig 4).
FIGURE 3.
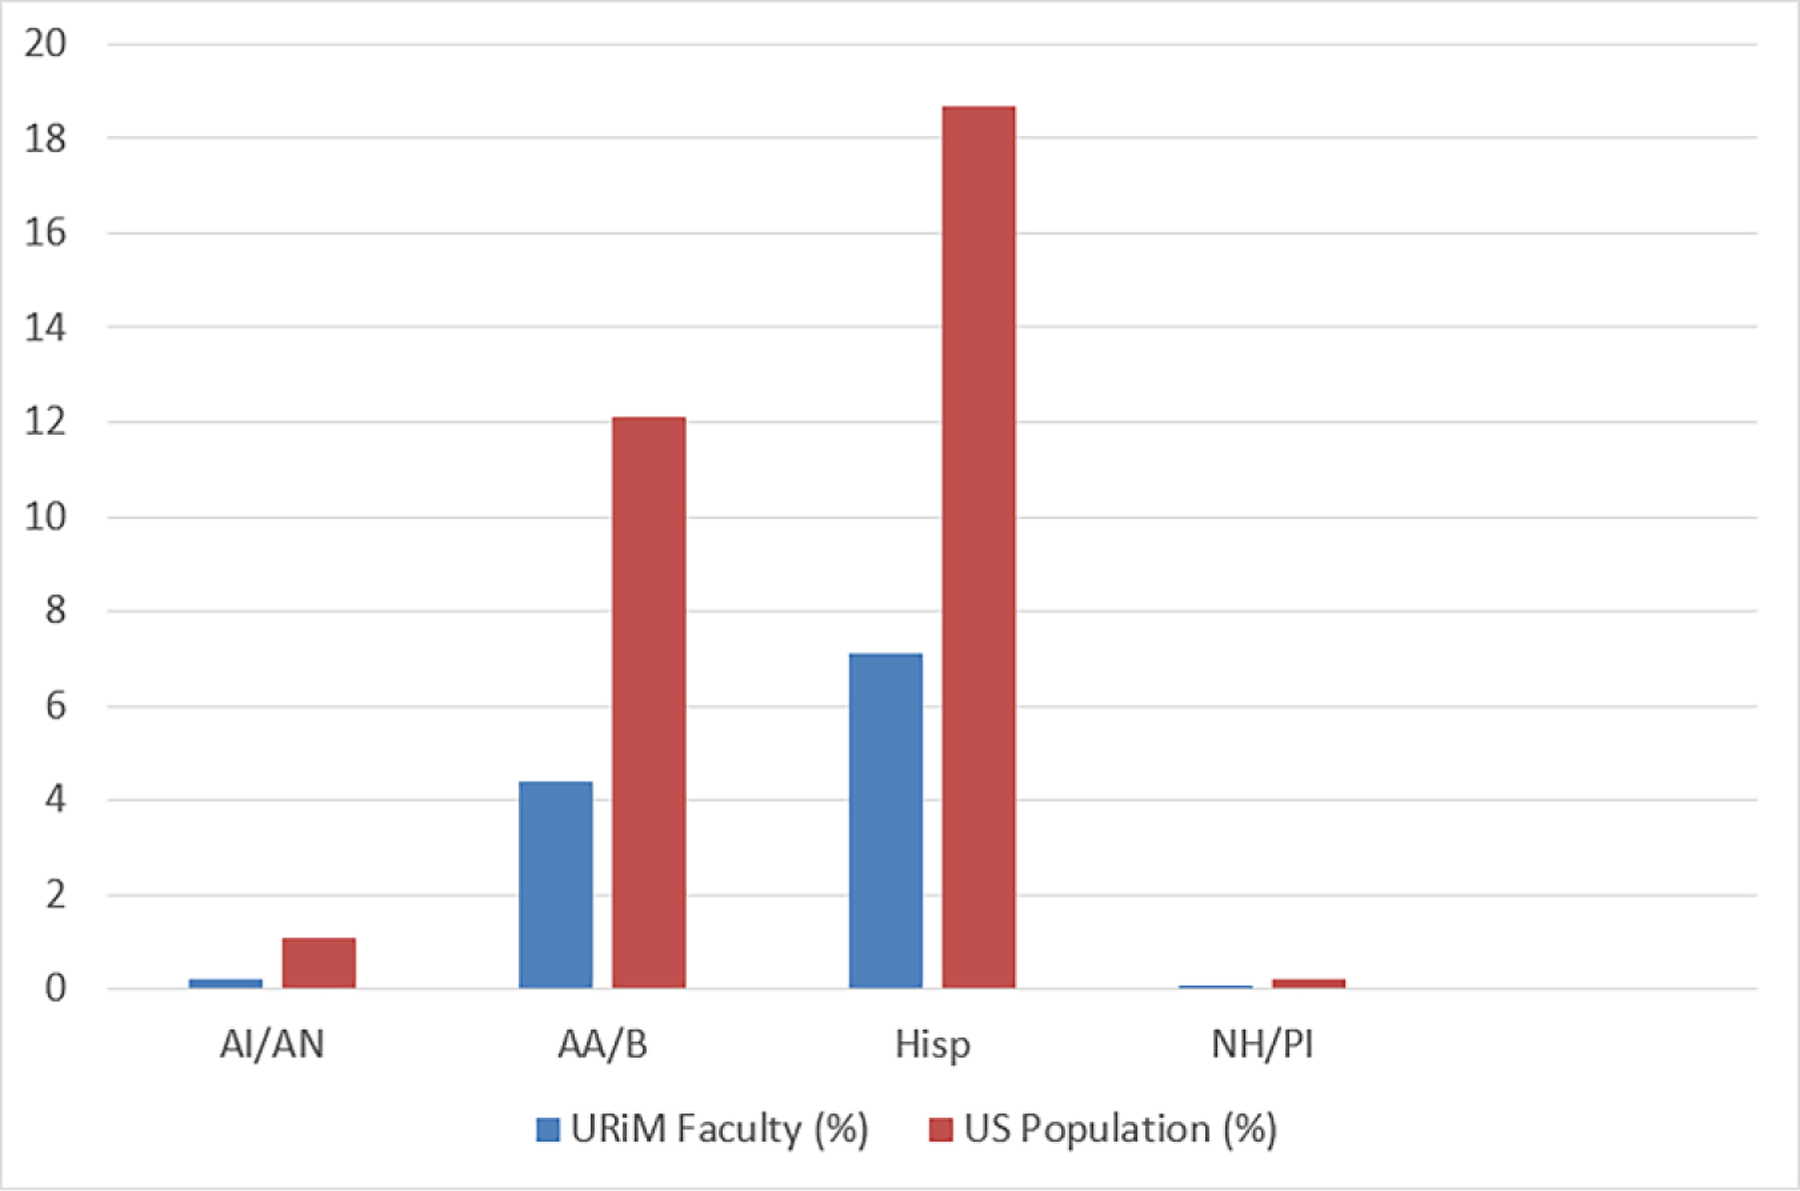
Percentage of URiM faculty representation compared with US population representation, 2020.
Abbreviations: AA, African American; AI, American Indian; AN, Alaska Native; Hisp, Hispanic; NH, Native Hawaiian; PI, Pacific Islander; URiM, underrepresented in medicine.
FIGURE 4.
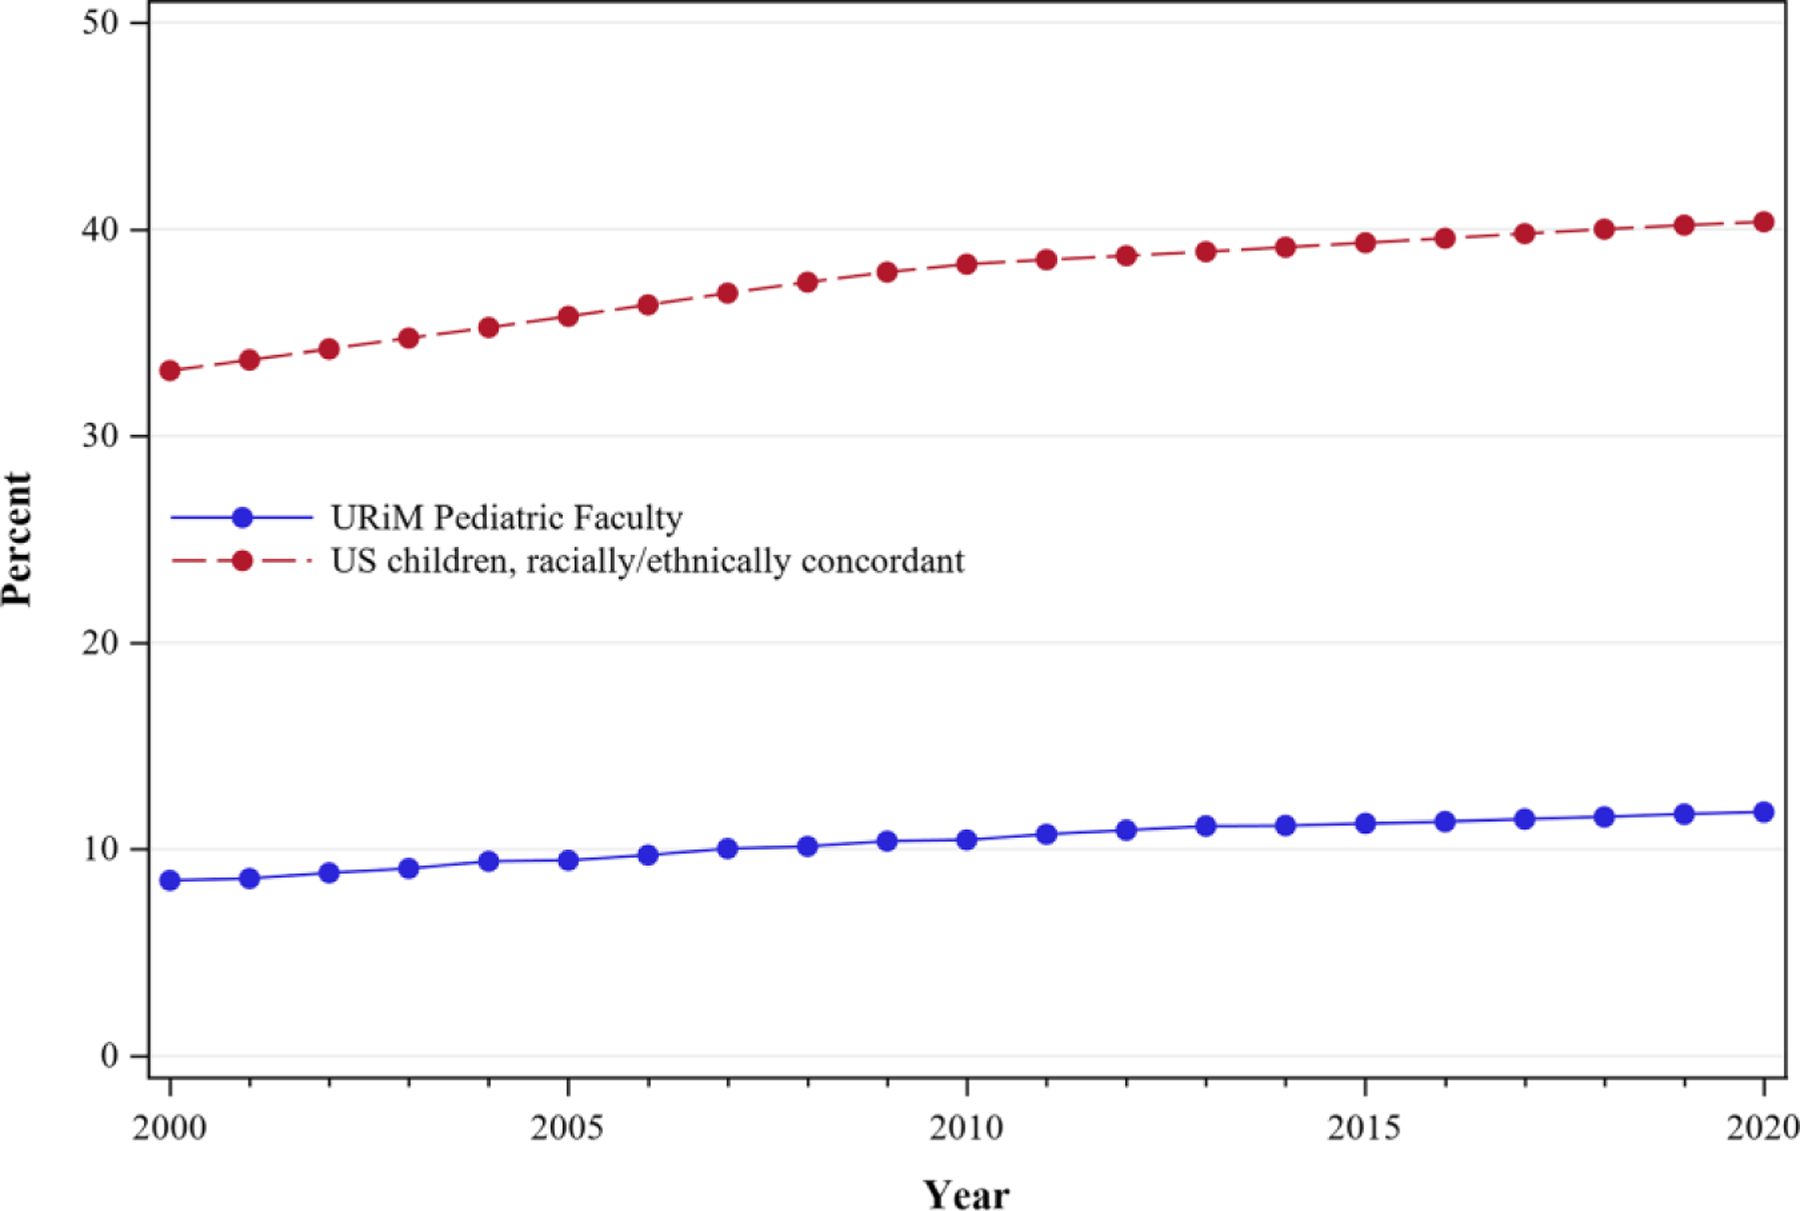
Percentage of URiM faculty representation compared with US population for racially/ethnically concordant children, 2000–2020.
DISCUSSION
This repeat cross-sectional study of US pediatric faculty from 2000 to 2020 provides a specialty-specific examination of the trends in racial, ethnic, and sex diversity by rank in departments of pediatrics. This analysis advances the field by highlighting the progress that has been in increasing the diversity within pediatric departments, but also identifying areas in which reinforcement of the pipeline is needed. Overall, our study suggested an increase in representation of individuals identifying as URiM; however, a more nuanced examination revealed that the improvements in representation were driven primarily by individuals identifying as female. Representation of individuals who identified as URiM male did not increase and for certain groups, decreased in representation. In addition, URiM pediatric faculty did not reflect the racial and ethnic diversity of the 2020 US overall population or the changing child demographic between 2000 and 2020.
Understanding the source of the increase in representation of URiM pediatric faculty will need additional investigation, especially because the AAMC data does not delineate between clinical and nonclinical pediatric faculty. It is unclear what group is driving the increase. Previous work examining URiM pediatric trainee trends revealed significantly increased representation trends among certain specialties.15 Similarly, an examination of the pediatric subspecialty workforce by Rimsza et al found that most subspecialists are academic faculty, and the percentage of women and those from “minority groups” increased over time.22 Another possibility is that female URiM pediatricians are increasingly entering the academic workforce beyond training due to a desire to teach, mentor, and other lifestyle factors.23–26
The decrease in representation of URiM males suggests the pathway of URiM males entering academic pediatrics may be especially vulnerable and require targeted attention. The pathway into academic medicine begins long before entering medical school. Boys and young men of color and, particularly, Black boys and young men are disproportionately impacted by racialized educational environments. Starting in primary school, Black boys are subjected to higher rates of disciplinary actions compared with White-identifying peers.27–29 As they advance to secondary school, Black adolescents and young men are subject to increased policing, and the disciplinary consequences grow in scale and impact.30–32 A downstream consequence is that Black men enroll in higher education and graduate at lower rates than Black women.33 In addition, there has been a decreasing trend of applications and matriculation rates of Black males to medical school that has only modestly shifted in the past few years.34 When Black males do enter academic medicine, they have the highest rates of not being promoted and leaving academic medicine among all racial, ethnic, and gender groups at the assistant professor level and the second-highest rate at the associate professor level.35
Although the field of pediatrics is limited in its scope to influence the academic pathway before medical school entry, there may be opportunities for pediatricians to engage URiM medical students, especially URiM male medical students, about pediatrics as a career. Mentorship is a known factor that is important to the success of URiM medical students, trainees, and faculty.25,36,37 Although effective mentorship can occur between racially and/or ethnically discordant mentors and mentees, the literature suggests concordant mentor and mentee relationships are actively sought out by URiM trainees because of shared lived experiences and having a mentor “who looks like you.”38 URiM faculty mentors strongly influence URiM trainees’ career decisions to pursue academic careers.25,36,39,40 The lack of URiM faculty may make it hard to envision a career in academics. For men, finding a mentor who shares the same sex, race, and ethnicity can be a significant challenge in pediatric medicine in which 72.4% of trainees and 63.8% of practicing US pediatricians identify as women.41–43 This has the potential to limit the potential viability of pediatrics as a career for Black men because of a lack of mentors.
Studies focused specifically on URiM academic pediatric faculty highlight additional barriers to advancement, such as implicit bias and racial discrimination by peers and patients, lack of community, and feelings of isolation.44,45 The paucity of diversity in the academic pediatric workforce may impede efforts to create more equitable health care environments for the rapidly diversifying patient populations. Additionally, faculty diversity is an important factor in enriching the learning environment for all trainees, and even more so for those who identify as URiM.46 Recommendations from the American Academy of Pediatrics Policy Statement, Enhancing Pediatric Workforce Diversity and Providing Culturally Effective Pediatric Care: Implications for Practice, Education, and Policy Making, emphasize the need for institutional commitment to advancing diversity, especially in leadership roles.47 Tracking the hiring and promotion of URiM faculty will help academic medical centers better understand gaps, opportunities for change, and strategic planning. URiM faculty should be included on all faculty search and hiring committees.48 Structured programs that pair URiM faculty with peer and senior mentors can be beneficial.25,38 The role of sponsorship has been highlighted as a means of combating the multitude of barriers that lead to attrition among URiM faculty.49–52 Other recommendations include more robust upstream efforts through mentorship partnerships with medical student organizations like the Student National Medical Association and the Latino Medical Student Association, and URiM-specific programs for URiM trainees and early career faculty, such as the APA New Century Scholars and APA Research in Academic Pediatrics Initiative on Diversity scholars program.53–55
There are several limitations to this study that should be acknowledged. First, the authors of this study relied on data obtained from the AAMC Faculty Roster for which medical schools provided faculty sex, race, and ethnicity; therefore, we were unable to verify whether these data were self-reported or based on secondary data. In addition, not all faculty are necessarily pediatricians, a level of granularity unavailable in the AAMC Roster; as such, we were unable to measure nonphysician faculty, and different approaches may be necessary to enhance nonphysician diversity. The AAMC Faculty Roster is limited to full-time faculty, so we are unable to evaluate whether increases in representation were due to shifts in part-time versus full-time appointments. Moreover, the non-Hispanic multiracial and unknown categories may have undercounted the URiM population, but these categories were a small percentage of the overall sample. Additionally, we recognize there is a spectrum of gender identities that were not captured in the AAMC Faculty Roster, which may require targeted diversity and inclusion efforts. Finally, in the absence of individual-level data, our analysis does not allow us to measure factors associated with changes in observed rates, so a causal relationship cannot be established.
We recommend that future data be disaggregated, institution-specific, and provide race, ethnicity, sex, and rank information, including hiring and promotion details. Academic medical institutions already collect these data voluntarily as part of their accreditation process.56,57 These data should be publicly available to visualize trends. Dashboards could highlight institutions successful at the recruitment and retention of diverse faculty, allowing for programmatic sharing and potential innovation. It may also encourage accountability.
CONCLUSION
In the past 20 years, the percentage of URiM pediatric academic faculty significantly increased but was primarily driven by the increase in URiM female representation, whereas male URiM representation remained stagnant and even decreased in African American/Black males. The percentage of URiM faculty representation was considerably lower in comparison with the overall US representation and US population of racially and ethnically concordant children. The stagnation of URiM male representation and lack of faculty diversity reflective of the US population may have a critical impact on the field of pediatrics’ ability to recruit and retain a diverse workforce and promote equitable care. Academic centers should examine their recruitment and hiring practices to identify and root out areas of potential bias. Retention efforts should focus on early and specific mentorship, deliberate sponsorship, an awareness of the multiple challenges experienced by URiM faculty, and regular progress monitoring through dashboards and faculty climate surveys.
Supplementary Material
WHAT’S KNOWN ON THIS SUBJECT:
Workforce diversity is increasingly emphasized in academic medicine. A recent study revealed minimal improvements over time in the proportions of underrepresented in medicine (URiM) pediatric trainees; however, studies assessing the diversity of pediatric faculty trends are limited.
WHAT THIS STUDY ADDS:
Using cross-sectional data from 2000 to 2020, we found that trends in URiM proportions increased for women, remained unchanged for men, and decreased for African American/Black men. The percentage of URiM pediatric faculty representation was considerably lower compared with United States population representation.
FUNDING:
This work was supported by the grant number UL1TR001420 from the National Center for Advancing Translational Science of the National Institutes of Health (NIH). The NIH had no role in the design and conduct of the study. The content is solely the responsibility of the authors and does not necessarily represent the official views of the NIH. Funded by the National Institutes of Health (NIH).
ABBREVIATIONS
- AA
African American
- AAMC
Association of American Medical College
- AI
American Indian
- AN
Alaska Native
- APA
Academic Pediatric Association
- NH
Native Hawaiian
- Hisp
Hispanic
- URiM
underrepresented in medicine
- US
United States
Footnotes
CONFLICT OF INTEREST DISCLOSURES: The authors have indicated they have no potential conflicts of interest relevant to this article to disclose.
REFERENCES
- 1.Cohen JJ, Gabriel BA, Terrell C. The case for diversity in the health care workforce. Health Aff (Millwood). 2002;21(5):90–102 [DOI] [PubMed] [Google Scholar]
- 2.Vespa J, Medina L, Armstrong DM. Demographic Turning Points for United States: Population Projections for 2020 to 2060. Washington, DC: US Census Bureau; 2020 [Google Scholar]
- 3.Flores G; Committee On Pediatric Research. Technical report–racial and ethnic disparities in the health and health care of children. Pediatrics. 2010;125(4):e979–e1020 [DOI] [PubMed] [Google Scholar]
- 4.Nivet MA. Commentary: diversity 3.0: a necessary systems upgrade. Acad Med 2011;86(12):1487–1489 [DOI] [PubMed] [Google Scholar]
- 5.Thornton RL, Powe NR, Roter D, Cooper LA. Patient-physician social concordance, medical visit communication and patients’ perceptions of health care quality. Patient Educ Couns 2011;85(3):e201–e208 [DOI] [PMC free article] [PubMed] [Google Scholar]
- 6.Saha S, Komaromy M, Koepsell TD, Bindman AB. Patient-physician racial concordance and the perceived quality and use of health care. Arch Intern Med 1999;159(9):997–1004 [DOI] [PubMed] [Google Scholar]
- 7.Shen MJ, Peterson EB, Costas-Muñiz R, et al. The effects of race and racial concordance on patient-physician communication: a systematic review of the literature. J Racial Ethn Health Disparities. 2018;5(1):117–140 [DOI] [PMC free article] [PubMed] [Google Scholar]
- 8.Traylor AH, Schmittdiel JA, Uratsu CS, Mangione CM, Subramanian U. Adherence to cardiovascular disease medications: does patient-provider race/ethnicity and language concordance matter? J Gen Intern Med 2010;25(11):1172–1177 [DOI] [PMC free article] [PubMed] [Google Scholar]
- 9.Greenwood BN, Hardeman RR, Huang L, Sojourner A. Physician-patient racial concordance and disparities in birthing mortality for newborns. Proc Natl Acad Sci USA 2020;117(35):21194–21200 [DOI] [PMC free article] [PubMed] [Google Scholar]
- 10.Komaromy M, Grumbach K, Drake M, et al. The role of black and Hispanic physicians in providing health care for underserved populations. N EnglJ Med 1996;334(20):1305–1310 [DOI] [PubMed] [Google Scholar]
- 11.Moy E, Bartman BA. Physician race and care of minority and medically indigent patients. JAMA 1995;273(19):1515–1520 [PubMed] [Google Scholar]
- 12.Association of American Medical Colleges. Figure 18. Percentages of all active physicians by race/ethnicity, 2018. Diversity in medicine: facts and figures 2019. Available at: https://www.aamc.org/data-reports/workforce/interactive-data/figure-18-percentage-all-active-physicians-race/ethnicity-2018. Accessed August 26, 2021
- 13.Association of American Medical Colleges. Figure 15. Percentage of full-time U.S. medical school faculty by race/ethnicity, 2018. Diversity in medicine: facts and figures 2019. Available at: https://www.aamc.org/data-reports/workforce/interactive-data/figure-15-percentage-full-time-us-medical-school-faculty-race/ethnicity-2018. Accessed August 26, 2021
- 14.Lett E, Orji WU, Sebro R. Declining racial and ethnic representation in clinical academic medicine: a longitudinal study of 16 US medical specialties. PLoS One. 2018;13(11):e0207274. [DOI] [PMC free article] [PubMed] [Google Scholar]
- 15.Montez K, Omoruyi EA, McNeal-Trice K, et al. Trends in race/ethnicity of pediatric residents and fellows: 2007–2019. Pediatrics. 2021;148(1):e2020026666. [DOI] [PMC free article] [PubMed] [Google Scholar]
- 16.Orr CJ, Ritter V, Turner L, et al. Membership trends in the Academic Pediatric Association from 2009 to 2018. Acad Pediatr 2020;20(6):816–822 [DOI] [PubMed] [Google Scholar]
- 17.Mendoza FS, Walker LR, Stoll BJ, et al. Diversity and inclusion training in pediatric departments. Pediatrics. 2015;135(4): 707–713 [DOI] [PMC free article] [PubMed] [Google Scholar]
- 18.Association of American Medical Colleges. Medical minority applicant registry (MedMAR). Available at: https://students-residents.aamc.org/choosing-medical-career/article/medical-minority-applicant-registry-med-mar. Accessed March 6, 2020
- 19.Association of American Medical Col leges. Faculty roster: US medical school faculty report. Available at: https://www.aamc.org/data-reports/faculty-institutions/faculty-roster. Accessed August 26, 2021
- 20.Jones N, Marks R, Ramirez R, Rios-Vargas M; United States Census Bureau. 2020 census illuminates racial and ethnic composition of the country. Available at: https://www.census.gov/library/stories/2021/08/improved-race-ethnicity-measures-reveal-united-states-populationmuch-more-multiracial.html. Accessed September 12, 2021
- 21.Kids Count Data Center. Child population by race in the United States. Available at: https://datacenter.kidscount.org/data/tables/103-child-population-by-race#detailed. Accessed June 27, 2022
- 22.Rimsza ME, Ruch-Ross HS, Clemens CJ, Moskowitz WB, Mulvey HJ. Workforce trends and analysis of selected pediatric subspecialties in the United States. Acad Pediatr 2018;18(7):805–812 [DOI] [PubMed] [Google Scholar]
- 23.Edmunds LD, Ovseiko PV, Shepperd S, et al. Why do women choose or reject careers in academic medicine? A nar rative review of empirical evidence. Lancet 2016;388(10062):2948–2958 [DOI] [PubMed] [Google Scholar]
- 24.Borges NJ, Navarro AM, Grover A, Hoban JD. How, when, and why do physicians choose careers in academic medicine? A literature review. Acad Med 2010;85(4):680–686 [DOI] [PubMed] [Google Scholar]
- 25.Dixon G, Kind T, Wright J, Stewart N, Sims A, Barber A. Factors that influence the choice of academic pediatrics by underrepresented minorities. Pediatrics. 2019;144(2):e20182759. [DOI] [PubMed] [Google Scholar]
- 26.Brown AJ, Swinyard W, Ogle J. Women in academic medicine: a report of focus groups and questionnaires, with conjoint analysis. J Womens Health (Larchmt). 2003;12(10):999–1008 [DOI] [PubMed] [Google Scholar]
- 27.The Civil Rights Project. Advancement Project. Opportunities Suspended: The Devastating Consequences of Zero Tolerance and School Discipline Projects. Los Angeles, CA: University of California Los Angeles; 2000 [Google Scholar]
- 28.American Academy of Pediatrics Committee on School Health. Out-of-school suspension and expulsion. Pediatrics. 2003;112(5):1206–1209 [DOI] [PubMed] [Google Scholar]
- 29.National Center for Education Statistics. Indicator 15: retention, suspension, and explusion. Status and trends in the education of racial and ethnic groups. Available at: https://nces.ed.gov/programs/raceindicators/indicator_rda.asp. Accessed October 27, 2021
- 30.Farkas K, Duarte CD, Ahern J. Injuries to children and adolescents by law enforcement: an analysis of California emergency department visits and hospitalizations, 2005–2017. JAMA Pediatr 2022;176(1):89–91 [DOI] [PMC free article] [PubMed] [Google Scholar]
- 31.Heard-Garis N, Johnson TJ, Hardeman R. The harmful effects of policing-from the neighborhood to the hospital. JAMA Pediatr 2022;176(1):23–25 [DOI] [PubMed] [Google Scholar]
- 32.Owen MC, Wallace SB; COMMITTEE ON ADOLESCENCE. Advocacy and collaborative health care for justice-involved youth. Pediatrics. 2020;146(1):e20201755. [DOI] [PubMed] [Google Scholar]
- 33.Palmer RT, Davis RJ, Moore JL, Hilton AA. A nation at risk: increasing college participation and persistence among African American males to stimulate U.S. global competitiveness. J Afr Am Males Educ 2010;1(2):105–124 [Google Scholar]
- 34.Association of American Medical Colleges. Altering the Course: Black Males in Medicine. Washington, DC: AAMC; 2015 [Google Scholar]
- 35.Dandar VM, Lautenberger DM. Exploring Faculty Salary Equity at U.S. Medical Schools by Gender and Race/Ethnicity. Washington, DC: Association of American Medical Colleges; 2021 [Google Scholar]
- 36.Dixon G, Kind T, Wright J, Stewart N, Sims A, Barber A. Factors that influence underrepresented in medicine (UIM) medical students to pursue a career in academic pediatrics. J Natl Med Assoc 2021;113(1):95–101 [DOI] [PubMed] [Google Scholar]
- 37.Bonifacino E, Ufomata EO, Farkas AH, Turner R, Corbelli JA. Mentorship of underrepresented physicians and trainees in academic medicine: a systematic review. J Gen Intern Med 2021;36(4):1023–1034 [DOI] [PMC free article] [PubMed] [Google Scholar]
- 38.Orr CJ, McLaurin-Jiang S, Jamison SD. Diversity of mentorship to increase diversity in academic pediatrics. Pediatrics. 2021;147(4):e20193286. [DOI] [PubMed] [Google Scholar]
- 39.Umoren RA, Frintner MP. Do mentors matter in graduating pediatrics residents’ career choices? Acad Pediatr 2014;14(4):348–352 [DOI] [PubMed] [Google Scholar]
- 40.Doucet H, Shah MK, Cummings TL, Kahn MJ. Comparison of internal medicine, pediatric, and medicine/pediatrics applicants and factors influencing career choices. South Med J 1999;92(3): 296–299 [DOI] [PubMed] [Google Scholar]
- 41.Association of American Medical Colleges. Physician specialty data report: ACGME residents and fellows by sex and specialty, 2019. Available at: https://www.aamc.org/data-reports/interactive-data/acgme-residents-and-fellows-sex-and-specialty-2019. Accessed October 28, 2021
- 42.Association of American Medical Colleges. Table 12. Practice specialty, females by race/ethnicity, 2018. Diversity in medicine: facts and figures 2019. Available at: https://www.aamc.org/data-reports/workforce/data/table-12-practice-specialty-females-race/ethnicity-2018. Accessed January 2, 2021
- 43.Association of American Medical Colleges. Table 13. Practice specialty, males by race/ethnicity, 2018. Diversity in medicine: facts and figures 2019. Available at: https://www.aamc.org/data-reports/workforce/data/table-13-practice-specialty-males-race/ethnicity-2018. Accessed January 2, 2021
- 44.Johnson TJ, Ellison AM, Dalembert G, et al. Implicit bias in pediatric academic medicine. J Natl Med Assoc 2017;109(3):156–163 [DOI] [PMC free article] [PubMed] [Google Scholar]
- 45.Nfonoyim B, Martin A, Ellison A, Wright JL, Johnson TJ. Experiences of under-represented faculty in pediatric emergency medicine. Acad Emerg Med 2021;28(9):982–992 [DOI] [PubMed] [Google Scholar]
- 46.Smedley BD, Stith AY, Colburn L, Evans CH, Institute of Medicine, Association of American Medical Colleges, et al. The Right Thing to Do, The Smart Thing to Do: Enhancing Diversity in the Health Professions. Washington, DC: National Academy Press; 2001 [PubMed] [Google Scholar]
- 47.Committee on pediatric workforce. Enhancing pediatric workforce diversity and providing culturally effective pediatric care: implications for practice, education, and policy making. Pediatrics. 2013;132(4):e1105–e1116 [DOI] [PubMed] [Google Scholar]
- 48.Walker LR, Stapleton FB. Pediatric faculty diversity: a new landscape for academic pediatrics in the 21st century. JAMA Pediatr 2013;167(11):989–990 [DOI] [PubMed] [Google Scholar]
- 49.Raphael JL. The role of sponsorship in achieving workforce diversity in academic pediatrics. Pediatrics. 2019;144(2):e20191532. [DOI] [PubMed] [Google Scholar]
- 50.Robles J, Anim T, Wusu MH, et al. An approach to faculty development for underrepresented minorities in medicine. South Med J 2021;114(9):579–582 [DOI] [PMC free article] [PubMed] [Google Scholar]
- 51.Rodríguez JE, Campbell KM, Mouratidis RW. Where are the rest of us? Improving representation of minority faculty in academic medicine. South Med J 2014;107(12):739–744 [DOI] [PubMed] [Google Scholar]
- 52.Campbell KM, Hudson BD, Tumin D. Releasing the net to promote minority faculty success in academic medicine. J Racial Ethn Health Disparities. 2020;7(2):202–206 [DOI] [PubMed] [Google Scholar]
- 53.Pachter LM, Kodjo C. New century scholars: a mentorship program to increase workforce diversity in academic pediatrics. Acad Med 2015;90(7):881–887 [DOI] [PubMed] [Google Scholar]
- 54.Flores G, Mendoza FS, DeBaun MR, et al. Keys to academic success for under-represented minority young investigators: recommendations from the Research in Academic Pediatrics Initiative on Diversity (RAPID) national advisory committee. Int J Equity Health. 2019;18(1):93. [DOI] [PMC free article] [PubMed] [Google Scholar]
- 55.Vinci RJ, Degnon L, Devaskar SU. Pediatrics 2025: the AMSPDC workforce initiative. J Pediatr 2021;237:5–8.e1 [DOI] [PubMed] [Google Scholar]
- 56.Education LCoM. LCME consensus statement related to satisfaction with element 3.3, diversity/pipeline programs and partnerships. Available at: https://lcme.org/wp-content/uploads/filebase/white_papers/lcme-consensus-statement-with-intro-element3-3.doc. Accessed April 13, 2022
- 57.Education LCoM. Functions and Structure of a Medical School:</References> [Google Scholar]
Associated Data
This section collects any data citations, data availability statements, or supplementary materials included in this article.