

Abstract
Abstract
The formulation by Starling of The Law of the Heart states that ‘the [mechanical] energy of contraction, however measured, is a function of the length of the muscle fibre’. Starling later also stated that ‘the oxygen consumption of the isolated heart … is determined by its diastolic volume, and therefore by the initial length of its muscular fibres’. This phrasing has motivated us to extend Starling's Law of the Heart to include consideration of the efficiency of contraction. In this study, we assessed both mechanical efficiency and crossbridge efficiency by studying the heat output of isolated rat ventricular trabeculae performing force–length work‐loops over ranges of preload and afterload. The combination of preload and afterload allowed us, using our modelling frameworks for the end‐systolic zone and the heat–force zone, to simulate cases by recreating physiologically feasible loading conditions. We found that across all cases examined, both work output and change of enthalpy increased with initial muscle length; hence it can only be that the former increases more than the latter to yield increased mechanical efficiency. In contrast, crossbridge efficiency increased with initial muscle length in cases where the extent of muscle shortening varied greatly with preload. We conclude that the efficiency of cardiac contraction increases with increasing initial muscle length and preload. An implication of our conclusion is that the length‐dependent activation mechanism underlying the cellular basis of Starling's Law of the Heart is an energetically favourable process that increases the efficiency of cardiac contraction.

Key points
Ernest Starling in 1914 formulated the Law of the Heart to describe the mechanical property of cardiac muscle whereby force of contraction increases with muscle length.
He subsequently, in 1927, showed that the oxygen consumption of the heart is also a function of the length of the muscle fibre, but left the field unclear as to whether cardiac efficiency follows the same dependence.
A century later, the field has gained an improved understanding of the factors, including the distinct effects of preload and afterload, that affect cardiac efficiency. This understanding presents an opportunity for us to investigate the elusive length‐dependence of cardiac efficiency.
We found that, by simulating physiologically feasible loading conditions using a mechano‐energetics framework, cardiac efficiency increased with initial muscle length.
A broader physiological importance of our findings is that the underlying cellular basis of Starling's Law of the Heart is an energetically favourable process that yields increased efficiency.
Keywords: cardiac energetics, force–length relation, Frank–Starling mechanism, mechanical efficiency
Abstract figure legend When the length of cardiac muscle is increased from L 1 to L 2, the muscle produces greater mechanical force. This is the Law of the Heart, formulated by Ernest Starling over a century ago. We studied the energetics consequences of the length‐dependent increase of force. We found that mechanical work output (the area of the force–length work‐loop) and change of enthalpy (i.e. energy expenditure) both increase with increasing length. The former increases more than the latter, leading to increasing efficiency of contraction with increasing length.
Introduction
In his paper with Patterson and Piper in 1914, Starling stated that ‘The law of the heart is therefore the same as that of skeletal muscle, namely that the mechanical energy set free on passage from the resting to the contracted state depends … on the length of the muscle fibres’ (Patterson et al., 1914). In his Linacre Lecture presented in 1915, Starling chose a more general phrasing: ‘The law of the heart is thus the same as the law of muscular tissue generally, that the energy of contraction, however measured, is a function of the length of the muscle fibre’ (Starling, 1918). Starling deduced this law based on his own experiments, establishing the relation between ventricular output and venous pressure (Patterson & Starling, 1914) and the relation between ventricular force and volume (Starling, 1918). Starling acknowledged that the formulation of the law was founded on prior studies by Blix (1893) in tabulating the relation between force and length of skeletal muscles and by Frank (1899) in examining the relation between ventricular pressure and volume of the heart. It is broadly received that Starling's Law, or now more commonly the Frank–Starling Law of the Heart, is the observation describing the intrinsic mechanical property of the heart whereby muscle force increases with initial length, which goes pari passu with ventricular output increasing with venous pressure. The latter relation is referred as the Frank–Starling function curve.
What has been less well received is that Starling's Law of the Heart has an energetics root. We source two pieces of evidence in support of this contention. First, Starling proposed to measure heat production of muscle. In his Linacre Lecture, Starling acknowledged the findings of Blix (1893) and of Evans and Hill (1914) in isometrically contracting skeletal muscles that the total energy in the form of heat increases to a maximum with increasing initial muscle length. In fact, it was the proposal of Starling that suggested to A. V. Hill the measurement of heat, published in Evans and Hill (1914). Second, Starling measured work output and oxygen consumption, and quantified mechanical efficiency. He documented from his own experiments and presented in his Linacre Lecture that ‘any increase in the work of the heart … is attended by a corresponding augmentation of the total chemical changes’, the total chemical energy of which was measured as oxygen consumption. He tabulated only two numerical values of the efficiency of the heart and showed that efficiency was near doubled by an increase of venous pressure at a constant arterial resistance (Starling, 1918). In the same year, Evans and Matsuoka (1915) showed a direct correspondence between oxygen usage and venous pressure, but obtained instead lower efficiency in cases where the work was high. These discrepant results were complicated by the observation that work (Evans & Matsuoka, 1915) and hence efficiency (Evans, 1918), can as well be altered by a change of arterial pressure (i.e. afterload). However, Starling, in collaboration with Visscher (Starling & Visscher, 1927), did not take the opportunity to use his simultaneous measurements of work and oxygen consumption to plot efficiency against venous pressure, to test whether efficiency is a function of diastolic volume at both constant and varying arterial pressures. Instead, he stated, in Starling and Visscher (1927), that ‘the energy set free per unit length … is only correct if we insert the word “mechanical” before “energy set free”. Probably a more correct definition … would be the mechanical efficiency of the muscle fibre, i.e. the relation of the mechanical energy to the total energy liberated’.
The conclusion reached by Starling and Visscher (1927) was that ‘the oxygen consumption of the isolated heart … is determined by its diastolic volume, and therefore by the initial length of its muscular fibres’. The field then discussed acceptance (Clark & White, 1928; Decherd & Visscher, 1933; Hemingway & Fee, 1927) or rejection (Stella, 1931) of that conclusion. The rejection was based on the finding that at the same diastolic volume, there was an optimal arterial resistance (i.e. afterload) against which the ventricle contracts at which efficiency reached its maximum, leading to an alternative conclusion that fibre length after the moment of stimulation had a much smaller effect and, instead, work represented the preponderant determinant of oxygen consumption (Stella, 1931). The alternative conclusion conforms to the ‘Fenn effect’ that skeletal muscle liberates more energy in contraction when it does work than when contracting isometrically, and that ‘extra energy’, termed the ‘heat of shortening’ (Hill, 1938), is roughly equal to the work done, which is itself afterload dependent (Fenn, 1924). Energy consumed in performing work is thus determined not only by preload, as was deduced by Starling & Visscher (1927), but also by afterload. It has since been well appreciated that ventricular mechanical performance (Sonnenblick & Downing, 1963; Weber et al., 1974) and myocardial energetics (Whalen, 1961) are functions of both preload and afterload.
Around the same time as the publication of Starling and Visscher (1927), resting metabolism was realised to be contributing a significant portion of the oxygen consumption of the contracting heart, amounting to some 30% (Clark & White, 1928). Resting metabolism was, on the other hand, found to increase upon stretching of muscle, first demonstrated by Feng using skeletal muscle (Feng, 1932), and some 30 years elapsed before the ‘Feng effect’ was demonstrated to exist in cardiac muscle where basal oxygen consumption (Cranefield & Greenspan, 1960; Lee, 1960; Whalen, 1960) and basal heat production (Gibbs et al., 1967; Loiselle, 1982; Loiselle, 1985; Loiselle & Gibbs, 1983) increased with stretch. Given the concurrent increase of total metabolism and resting metabolism with increasing muscle length, the field was left in a curious state concerning the elusive relation between preload and the supra‐basal efficiency of contraction.
In the 1950s, it was argued that work output, rather than stroke volume or cardiac output, neither of which has units of energy, should have been used as the measure of ‘the energy of contraction’. Thus, in re‐presenting the Frank–Starling curve where the dependent variable is stroke volume or cardiac output, both work (Sarnoff, 1955; Sarnoff & Berglund, 1954; Sonnenblick & Downing, 1963) and oxygen consumption (Bünger et al., 1979; Neely et al., 1967) have also been plotted against preload, along with a parametric plot to show that oxygen consumption increases linearly with work (Coleman et al., 1969; Krukenkamp et al., 1988). However, none of these papers has plotted efficiency as a function of preload. In the 1980s, linearisation of the Frank–Starling curve was considered by plotting work against end‐diastolic volume (Glower et al., 1985; Krukenkamp et al., 1988) or muscle segment length (Glower et al., 1985). The field, however, became centred on the effects of afterload on the energy and work of the heart at only a single preload (Watters et al., 1989). The same analysis was also applied to ventricular tissue preparations where the effects of afterload on the supra‐basal efficiency was investigated only at a single preload, typically the muscle length that optimises developed force (Han et al., 2014; Kiriazis & Gibbs, 1995; Loiselle, 1979; Pham, Han et al., 2017). The relation between supra‐basal efficiency and preload, and whether it is a positive function (Han et al., 2013) remains uncertain.
Likewise, it has not been determined whether crossbridge efficiency, the denominator of which consists of solely the energy expenditure by crossbridges, changes with preload or muscle length. Since the 2000s, the key contributor to the mechanisms underlying the Frank–Starling Law has been centred on the myofilament proteins involving length‐dependent activation through the recruitment of crossbridges (Fukuda et al., 2009; Kawai & Jin, 2021; Kobirumaki‐Shimozawa et al., 2014; Sequeira & van der Velden, 2015; Sequeira & van der Velden, 2017; Shiels & White, 2008). Mechanisms underlying the length‐dependent activation of muscle are thus germane to the assessment of the length dependence of crossbridge efficiency.
The aim of the present study is to test whether cardiac efficiency is a function of the length of the muscle fibre – something that Starling could have reported on given that he had measured work, oxygen consumption and efficiency, subsequent to the formulation of the Law. It could be that, at that time, Starling was unable to draw conclusions regarding the length dependence of cardiac efficiency given uncertainties regarding the Fenn effect (i.e. heat of shortening), the Feng effect (i.e. length dependence of basal metabolism), and the intricate coupling effect between afterload and preload on work and oxygen consumption – all of which are described above. A century later after the formulation of Starling's Law of the Heart, the field has gained an increased understanding of these factors, including the identification of length‐dependent activation mechanisms. This knowledge presents an opportunity for us to assess the dependence of both mechanical efficiency and crossbridge efficiency on initial muscle length and preload. We did so by employing our recently published framework establishing the cardiac ‘end‐systolic zone’ on the force–length plane (Han, Pham et al., 2019) and its equivalent energetics zone on the heat–force plane that reflects the ‘heat of shortening’ (Tran et al., 2020). The contribution of basal heat to efficiency was eliminated by our use of isolated ventricular tissues where measured heat output is supra‐basal. Using that framework, we performed simulations by prescribing preload and afterload (independently or in concert) to recreate experimental loading conditions, which allowed us to explore the dependence of supra‐basal efficiency and crossbridge efficiency on initial muscle length or preload.
Methods
Ethical approval
Male Wistar rats (9–10 weeks of age and weighed 250–350 g) were anaesthetised with isoflurane (1000 IU kg−1), followed by cervical dislocation and cardiectomy. This procedure was approved under ethics R2006 by the Animal Ethics Committee of The University of Auckland. Rats were obtained from the Vernon Jansen Unit of The University of Auckland, where they had been reared in cages in a room (22°C) on a 12‐h light–dark cycle and had ad lib access to food (standard chow) and water.
Muscle preparation
The excised heart was plunged into cold (4°C) Tyrode solution, and within 10 s, Langendorff‐perfused with Tyrode solution containing 20 mmol L−1 2,3‐butanedione monoxime at room temperature (22°C). The Tyrode solution contained (in mmol L−1): 130 NaCl, 6 KCl, 1 MgCl2, 0.5 NaH2PO4, 0.3 CaCl2, 10 HEPES, 10 glucose, adjusted using Tris to pH 7.4, and bubbled with 100 % oxygen. The heart was completely submerged in the same Tyrode solution in a dissection dish. Trabeculae were dissected from the left ventricle. A trabecula was then transferred to a microcalorimeter (Taberner et al., 2011; Taberner et al., 2018) and superfused with oxygenated Tyrode solution with a higher concentration of CaCl2 at 1.5 mmol L−1. The rate of flow of Tyrode superfusate was electronically maintained at 0.5 μL s−1 to provide adequate oxygenation to the muscle (Han et al., 2011) while maximising the thermal signal‐to‐noise ratio of the microcalorimeter (Johnston et al., 2015; Taberner et al., 2018).
In the measurement chamber of the microcalorimeter, the trabecula was mounted, at slack length, between two platinum hooks. The upstream hook was connected to a length controller motor, and the downstream hook was connected to a force transducer. The mounted trabecula can be stimulated to contract isometrically or to perform work‐loops using our control systems. The description of both our isomeric and work‐loop control systems has been detailed elsewhere (Taberner et al., 2011; Taberner et al., 2019). Briefly, isometric contractions are achieved by using the upstream length controller motor to compensate only for tiny deflections of the downstream force transducer, thereby maintaining muscle length constant during contractions. In our work‐loop control mode, on elicitation of a muscle twitch, isometric force is allowed to develop to a user‐selected, constant afterload. The length controller then transitions to isotonic mode, which shortens the muscle in a manner that maintains a constant afterload until the muscle can no longer sustain the prescribed afterload without re‐lengthening. At this point, the length controller transitions back to isometric mode to allow the muscle to relax, thereby achieving isometric relaxation. The muscle is then re‐stretched by the length controller back to its initial length.
Two arrays of thermopiles, located exterior to the measurement chamber upstream and downstream of the trabecula, measured the temperature of the flowing superfusate. A pair of platinum electrodes, located proximal to the measurement chamber, provided stimulation. The trabecula was initially stimulated at 2 Hz until a steady state of force developed, and then incrementally stretched to reach the optimal length (L o) for achieving maximal developed force. The entire calorimeter system was then enclosed within an insulated hood to diminish external optical and thermal disturbances. The temperature within the enclosure was maintained at 37°C by temperature controllers located on the top and at the bottom of the calorimeter measurement unit, and by a controller located on the optical table on which the entire calorimeter system was mounted.
Experimental protocol
Experiments commenced typically 1 h later by which time a stable thermal environment within the enclosure had been attained. The stimulus frequency was then increased to 4 Hz, and the trabecula was required to perform two contraction protocols. The first protocol was designated the ‘afterloaded work‐loop contraction protocol’, which involved a series of work‐loop contractions at six different afterloads where each bout of afterloaded work‐loops was interspersed with isometric contractions. Six afterloads were chosen to encompass the range from maximal at isometric contraction to minimal in the vicinity of passive force. Steady states of work‐loop and heat output were reached within 2 min per bout. This protocol was performed at three initial lengths (end‐diastolic lengths): L o, 0.95 L o and 0.90 L o.
In the second protocol, designated the ‘preloaded isometric contraction protocol’, the trabecula contracted isometrically at six different lengths, ranging from L o to L min (which was around 0.75 L o) where measured developed force reached a minimum. Stimulation was halted between each length change step to allow measurement of the baseline of heat from the muscle in its quiescent state. From these six data points that were used to establish a heat–force relation, the y‐intercept provides the measure of activation heat. Activation heat represents the energy expenditure arising from cycling of Ca2+. It is independent of active force and, hence, is a constant on the heat–force plane, the magnitude of which is estimated from the y‐intercept of the isometric heat–force relation, as we have confirmed using an inhibitor (blebbistatin) that specifically blocks cross‐bridge activity (Pham, Tran et al., 2017). This protocol allowed partitioning of heat output into that arising from crossbridge cycling and that arising from Ca2+ cycling, and thereby allowed separation between mechanical efficiency and crossbridge efficiency.
Determination of measured active heat
Upon completion of each experiment, stimulation was halted, leaving the trabecula quiescent in the measurement chamber. This facilitated quantification of two artefactual sources of active heat measurement. First, the heat artefact arising from the change of basal rate of heat output as a result of change of muscle length during active work‐loop contractions, which accounted for the Feng effect (Garrett et al., 2021), was quantified. This measurement was conducted by electronically oscillating the quiescent trabecula between L o and the minimal length. Second, the trabecula was then re‐located further downstream of the measurement chamber distal to the thermopile arrays. In the absence of the trabecula between the two thermopile arrays, the heat artefact resulting from electrical stimulation was quantified. The rate of supra‐basal, active muscle heat production was then corrected retrospectively by subtraction of both sources of heat artifact.
Geometric measurement of trabeculae
A total of 15 trabeculae were studied. The geometry of each trabecula was measured at L o using a microscopic graticule from both the top view and the perpendicular view via a 45° mirror located exterior to the measurement chamber. Muscle cross‐sectional area was assumed to approximate an ellipse. The average cross‐sectional area, expressed as mean ± standard deviation, was 0.073 ± 0.033 mm2 (average top diameter of 295 ± 63 μm, and perpendicular diameter of 301 ± 75 μm), and the average length was 3.30 ± 0.48 mm.
Quantifications of measured variables
Mechano‐energetics data were analysed using custom‐written code within the MATLAB interface (The MathWorks, Natick, MA, USA). Muscle force was converted to stress by dividing by cross‐sectional area. Muscle length was expressed relative to the optimal muscle length (i.e. L/L o). A stress–length work‐loop has four distinct phases: isometric contraction, isotonic shortening, isometric relaxation and isotonic re‐lengthening (Taberner et al., 2011). Afterload was defined as the stress at which the muscle transitioned from the isometric contraction phase to the isotonic shortening phase. Preload was defined as the diastolic stress at the initial length. The width of the loop represented the extent of muscle shortening. The area within the loop quantified the mechanical work performed by the muscle. Rate of heat output was converted to heat density by dividing by stimulus frequency (4 Hz) and muscle volume. Change of enthalpy equated the sum of work and suprabasal heat output; the latter was partitioned into activation heat and crossbridge heat. Mechanical efficiency was calculated as the ratio of work to change of enthalpy and was thus expressed as a percentage. Crossbridge efficiency was defined as the ratio of work to the sum of work and crossbridge heat.
Simulation of work‐loop cases
Using mechano‐energetics data obtained from the protocols described above, we constructed a geometrical model that enabled simulation of work‐loops at any combination of preload and afterload. Briefly, the two experimental protocols described above, namely the ‘afterloaded work‐loop contraction protocol’ and the ‘preloaded isometric contraction protocol’, allowed the establishment of the cardiac ‘end‐systolic zone’ on the stress–length plane. This zone contains the end‐systolic points for any combination of preloaded and afterloaded work‐loops within the range of muscle length from L min to L o (Han, Pham et al., 2019). Thus, for any given preload (or initial muscle length) and afterload, the resulting end‐systolic point on the end‐systolic zone was located, from which mechanical work output (the area of the force–length work‐loop) was calculated. Simultaneous measurements of heat allowed the establishment of the zone on the heat–stress plane – the energetics equivalent of the end‐systolic zone; that is, any end‐systolic points on the stress–length plane have equivalent unique points on the heat–stress plane (Tran et al., 2020). From the equivalent heat–stress plane, the heat output equivalent to the work‐loop with the end‐systolic point was located. Together, these two frameworks form the geometric model. Using this model, mechanical efficiency and crossbridge efficiency for a work‐loop were calculated for any given combination of preload and afterload.
Using this framework, we investigated the effects of initial muscle length and preload on mechanical efficiency and crossbridge efficiency. We have chosen to plot output variables as functions of both initial muscle length and preload following the study of Glower et al. (1985), which demonstrated that by plotting work against end‐diastolic ventricular segment length instead of against end‐diastolic pressure (preload), the curved relation becomes linear. We simulated six scenarios where an increase in preload (and initial muscle length) is associated with different combinations of afterloads. They represent a set of physiologically feasible loading conditions, achievable experimentally using isolated cardiac preparations, which allow us to examine the effect of preload (and initial muscle length) on mechanical efficiency.
Case 1 was a scenario in which muscles perform work‐loops at afterloads that produced no active stress at the initial length. That is, upon stimulation, the muscle was immediately allowed to shorten against the afterload, which was set to match the passive force, i.e. there was no isometric contraction phase of the work‐loop. This represents isotonic contractions where the end‐systolic stress–length relation is the lower boundary of the end‐systolic zone.
Case 2 was a scenario in which afterload values were chosen such that muscles perform work‐loops with a fixed width. The extent of shortening of muscles (equivalent to stroke volume) is therefore the same for all work‐loops. This scenario of constant stroke volume with increasing initial length (or diastolic volume) has been reported in hearts in vivo and ex vivo (Kijtawornrat et al., 2014; Kuehne et al., 2005; Suga et al., 1973) and illustrated graphically (de Tombe et al., 2010; Westerhof et al., 2019).
Case 3 was a scenario in which the contraction‐mode dependence of cardiac end‐systolic stress–length relations appear to be contraction‐mode independent. This replicates the experimental conditions of high afterloads (i.e. high relative to the isometric force or isovolumic pressure) studied by several groups (Burkhoff et al., 1991; Suga & Sagawa, 1974).
Case 4 was a scenario in which the work‐loops were prescribed afterloads that produce peak mechanical efficiency. This represents the notion put forward by several experimental and theoretical studies that the heart operates at peak mechanical efficiency (Asanoi et al., 1989; Burkhoff & Sagawa, 1986; de Tombe et al., 1993).
Case 5 was a scenario in which the afterload was held constant with increasing preload, as had been seen experimentally (Abraham & Mao, 2015; Abraham et al., 2016; Pacher et al., 2008; Suga et al., 1973) and illustrated schematically (Elzinga & Westerhof, 1979; Ross, 1983; Solaro, 2011; Walley, 2016). In this case, while the afterload value was held constant, the relative afterload decreases non‐linearly with increasing initial muscle length.
Case 6 is the same as Case 5 except that afterload values were chosen such that relative afterload decreases linearly with increasing initial muscle length.
Statistical analyses
Stress and heat were plotted as functions of relative muscle length, and fitted using polynomial regression. The regression lines were averaged, and the differences among regression lines were tested, using the Random Coefficient Model within Proc Mixed implemented within the SAS software interface (SAS Institute, Cary, NC, USA). Statistical significance of a difference was declared when P < 0.05. Numerical values are expressed, unless otherwise stated, as means ± standard errors.
Results
Mode dependence of cardiac contraction
The end‐systolic stress–length relation (ESSLR) arising from afterloaded work‐loop contractions was obtained at each of the initial (end‐diastolic) lengths of L o, 0.95 L o and 0.90 L o. Each work‐loop ESSLR (WL1, WL2 and WL3) fell below the ESSLR obtained from isometric contractions (Fig. 1A ). The lower the initial length, the closer the work‐loop ESSLR to that of the isometric contractions. Contraction mode dependency yielded the defined ‘cardiac end‐systolic zone’ (Fig. 1B , shaded area). The end‐systolic zone is bounded by three distinct stress–length relations: the upper boundary by the isometric ESSLR, the right‐hand boundary by the work‐loop ESSLR at L o, and the lower boundary by work‐loop contractions of afterloads coincident with the prevailing level of the passive stress (i.e. isotonic shortening at zero active stress) at various preloads. A zone equivalent to the end‐systolic zone on the stress–length plane was obtained on the heat–stress plane, which contains the three work‐loop heat–stress relations where the isometric heat–stress relation serves as the lower boundary. Average relations from all 15 trabeculae are shown in Fig. 1C where, in the insets, the three average self‐normalised relations on the stress–length plane, and their equivalent on the heat–stress plane, were not significantly different from one another (on the stress–length plane, P = 0.625 and P = 0.423, respectively, for comparing the self‐normalised relation at L o with that at 0.95 L o, and that at 0.90 L o with the average of those at L o and 0.95 L o; on the heat–stress plane, P = 0.115 and P = 0.774, respectively, for comparing the self‐normalised relation at L o with that at 0.95 L o, and that at 0.90 L o with the average of those at L o and 0.95 L o). On average, the 15 trabeculae contracting isometrically at their L o developed a peak systolic stress of 51.4 ± 4.2 kPa and a peak passive (diastolic) stress of 14.5 ± 1.3 kPa. Peak heat output averaged 7.14 ± 0.94 kJ m−3. Activation heat, estimated from the y‐intercept of the isometric heat–stress relation, averaged 1.50 ± 0.21 kJ m−3 (Fig. 1C ).
Figure 1. The cardiac end‐systolic zone and its energetics equivalent.
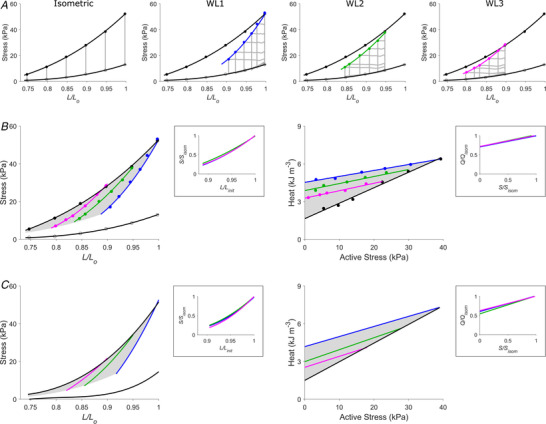
A, steady‐state stress–length relations from a representative trabecula undergoing isometric contractions at six lengths and work‐loop (WL) contractions of various afterloads at three preloads. WL1 (blue), WL2 (green) and WL3 (magenta) denote initial muscle lengths (end‐diastolic lengths; L/L o) of 1, 0.95 and 0.90, respectively. On the left panel, the isometric end‐systolic stress–length relation (upper black line) and the passive stress–length relation (lower black line) were obtained by fitting to the end‐systolic points (circles) of the six isometric contractions (grey lines). These two relations were transcribed to the three right panels to demonstrate contraction mode dependency where the isometric end‐systolic stress–length relation falls above the three preloaded work‐loop end‐systolic stress–length relations (WL1, WL2 and WL3). B, all isometric and work‐loop stress–length relations in panel A have been superimposed to illustrate the end‐systolic zone (shaded area on the stress–length domain; right panel) and its energetics equivalent on the heat–stress domain (shaded area, left panel). Points on the end‐systolic zone map to its energetic equivalent on the heat–stress zone (shaded area on the heat–length domain). The end‐systolic zone contains end‐systolic points at all values of L/L o from the minimal length (0.75) to the optimal length (L o), which have been interpolated using the self‐normalised work‐loop stress–length relations in the inset. The three self‐normalised relations in the insets between end‐systolic stress (S) and length (L) and between heat (Q) and active stress (S) have been normalised to their isometric values (subscripted as ‘isom’ to denote isometric, and ‘init’ to denote initial length). C, average relations from all 15 trabeculae. The three average self‐normalised relations in each inset were not significantly different from one another.
Dependence of energetics variables on afterload and preload
In line with the three work‐loop ESSLRs in Fig. 1A , each obtained from a range of afterloads, energetics variables are plotted as functions of afterload on the left panels in Fig. 2. Each of work, mechanical efficiency and crossbridge efficiency demonstrated a curvilinear dependence on afterload, from which peak values can be ascertained. Curved relations of work, mechanical efficiency and crossbridge efficiency to afterload were each obtained at three initial lengths (L o, 0.95 L o and 0.90 L o), from which peak values could be computed. In contrast, when plotted against preload (Fig. 2, right‐hand panels), the relationship between energetics variables and preload is determined by the selection of afterload. For example, judicious combinations of afterload may produce a series of work‐loops where mechanical efficiency (Fig. 2C ) appears to be either dependent (continuous line) or independent (broken line) of preload.
Figure 2. Energetic variables plotted against afterload and preload.
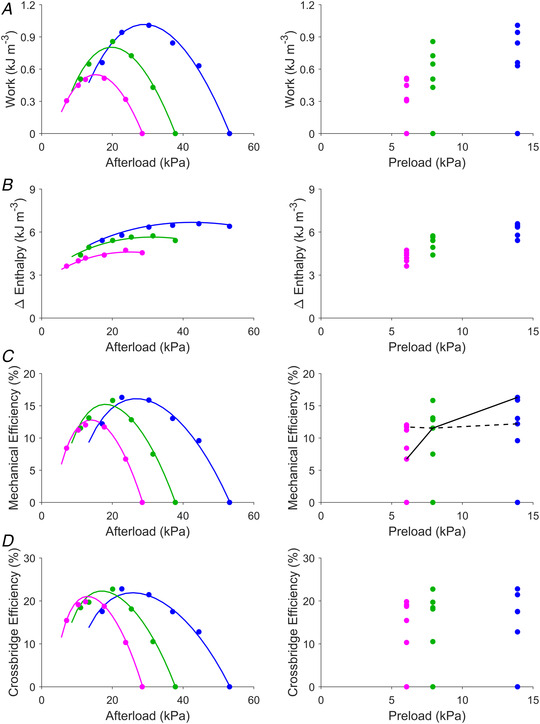
Data are from the same representative trabecula as in Fig. 1A and B ; the same colour coding applies to denote the work‐loop end‐systolic points at the three initial lengths: L/L o of 1 (blue), 0.95 (green) and 0.90 (magenta). Work (the area of the work‐loop) (A), change of enthalpy (the sum of work and heat) (B), mechanical efficiency (the ratio of work to enthalpy change) (C), and crossbridge efficiency (the ratio of work to crossbridge enthalpy change) (D) are plotted as functions of afterload (left panels) and preload (right panels). In the left‐hand panels, the coloured lines were computed using the preloaded work‐loop end‐systolic relations at each of the three initial lengths and superimposed on the plots. On the right‐hand side of panel C, lines are drawn to illustrate the independence (broken line) and the positive dependence (continuous line) of mechanical efficiency on preload. This demonstrates that the efficiency–preload relation is contingent on the selection of afterload.
Dependence of efficiency on initial length and preload
In simulating all six cases (detailed in Methods), we simulated work‐loops by prescribing preloads and afterloads to interpolate end‐systolic points using our end‐systolic zone framework (Han, Pham et al., 2019) and their equivalent heat–stress points (Tran et al., 2020). In all cases, a series of work‐loops have been simulated with initial muscle length as the independent variable (panels A of Figs 3, 4, 5, 6, 7, 8). Each end‐systolic point in panel A of Figs 3, 4, 5, 6, 7, 8 (left‐hand side) is mapped to a corresponding heat–stress point on the right hand side of the figure.
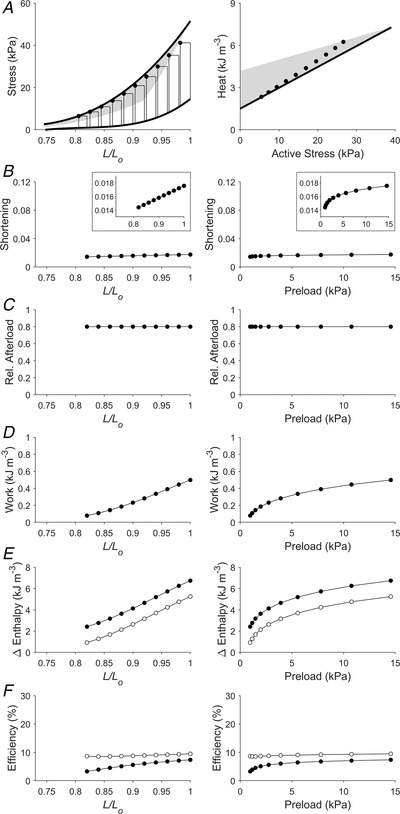
Figure 3. Simulated work‐loop contractions under isotonic afterloaded conditions (Case 1).
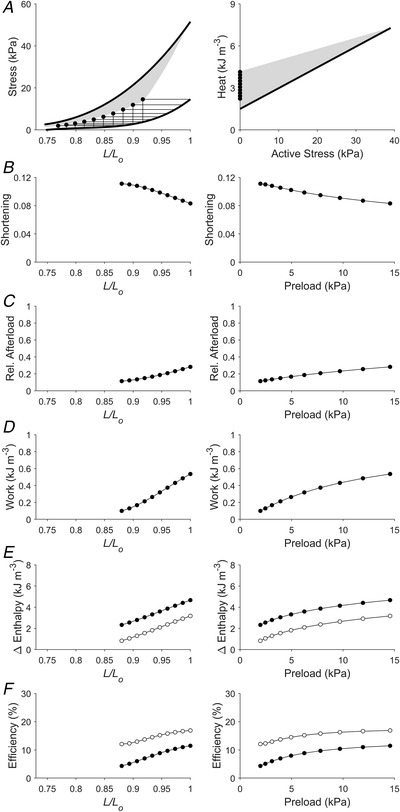
In panel A, isometric stress–length relations and the end‐systolic zone (shaded) have been transcribed from Fig. 1C . A total of 10 work‐loops were simulated over a range of initial lengths to replicate a scenario of 10 preloaded zero‐active stress isotonic contractions. Shortening (the width of the work‐loop) (B), afterload (relative to the isometric stress at the prescribed initial length) (C), work (the area of the work‐loop) (D), change of enthalpy (the sum of work and heat) (E) and efficiency (the ratio of work to enthalpy) (F) have been plotted as functions of relative length (left panels) and preload (right panels). In panel E, filled circles denote mechanical enthalpy change (the heat component contains both thermal expenditure of activation processes and crossbridge cycling), open circles denote crossbridge enthalpy change. In panel F, filled circles denote mechanical efficiency, open circles denote crossbridge efficiency.
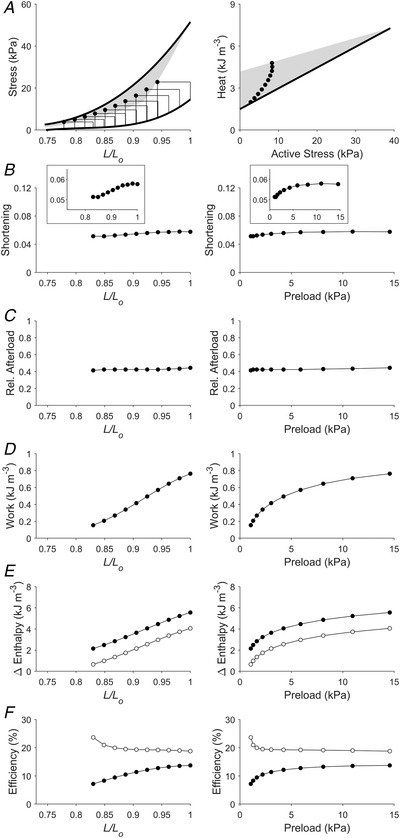
Figure 4. Simulated work‐loops of the same width at various initial lengths (Case 2).
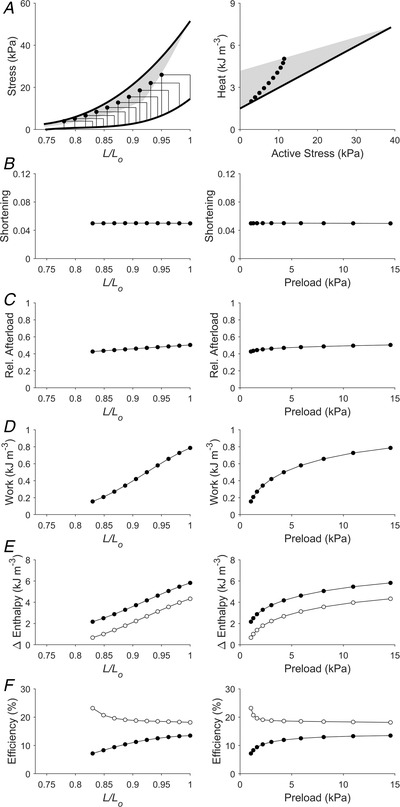
Plotting convention is the same as in Fig 3. Presented here is a scenario that replicates 10 work‐loops with the same width over a range of initial lengths. For each work‐loop, afterloads were chosen such that the extent of shortening was the same for all work‐loops, as illustrated in panel B. In panel E, filled circles denote mechanical enthalpy change, open circles denote crossbridge enthalpy change. In panel F, filled circles denote mechanical efficiency, open circles denote crossbridge efficiency.
Figure 5. Simulated work‐loops at various preloads at a constant, high relative afterload (Case 3).
Plotting convention is the same as in Fig. 3. Presented here is a scenario of 10 work‐loops at various preloads where the relative afterload is set to be 0.8 of the isometric stress at each initial length (or preload). Each inset in panel B shows a reduced ordinate range for a zoom‐in plot of the relation. In panel E, filled circles denote mechanical enthalpy change, open circles denote crossbridge enthalpy change. In panel F, filled circles denote mechanical efficiency, open circles denote crossbridge efficiency.
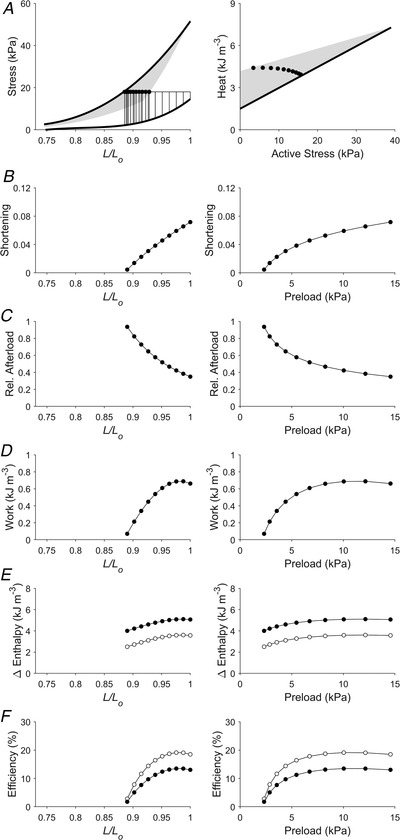
Figure 6. Simulated work‐loops at preloads and afterloads that produced peak mechanical efficiency (Case 4).
Plotting convention is the same as in Fig. 3. Presented here is a scenario that replicates work‐loops at various preloads. For each preload, the afterload was set at a value that produces peak mechanical efficiency. Each inset in panel B shows a reduced ordinate range for a zoom‐in plot of the relation. In panel E, filled circles denote mechanical enthalpy change, open circles denote crossbridge enthalpy change. In panel F, filled circles denote mechanical efficiency, open circles denote crossbridge efficiency.
Figure 7. Simulated work‐loops at various preloads but at a constant afterload (Case 5).
Plotting convention is the same as in Fig. 3. Presented here is a scenario that replicates 10 work‐loops of different initial muscle lengths each clamped at the absolute afterload of 18 kPa. Muscle would have shortened to various end‐systolic lengths, as illustrated in panel B. In panel E, filled circles denote mechanical enthalpy change, open circles denote crossbridge enthalpy change. In panel F, filled circles denote mechanical efficiency, open circles denote crossbridge efficiency.
Figure 8. Simulated work‐loops with increasing preloads but decreasing relative afterloads (Case 6).
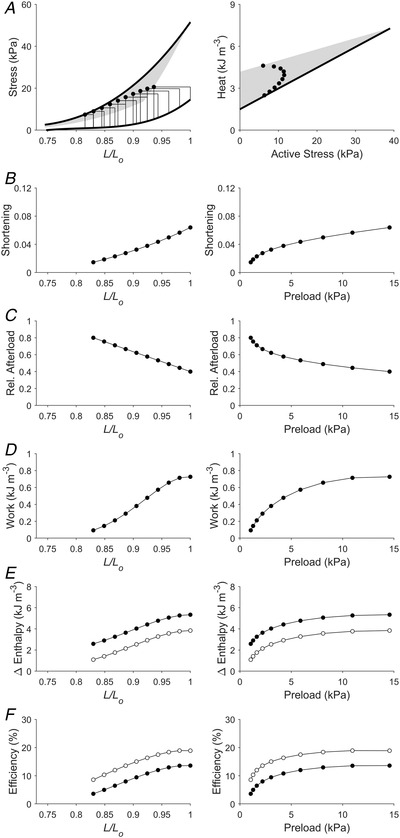
Plotting convention is the same as in Fig. 3. Presented here is a scenario that replicates work‐loops with increasing preloads but decreasing relative afterloads. This scenario is different from that in Fig. 7 because the relative afterload here is decreasing linearly with initial length (panel C), which is brought about by the end‐systolic stress (absolute afterload) increasing monotonically with initial length (panel A). In panel E, filled circles denote mechanical enthalpy change, open circles denote crossbridge enthalpy change. In panel F, filled circles denote mechanical efficiency, open circles denote crossbridge efficiency.
The Frank–Starling function curve plots stroke volume against diastolic volume or preload; in our experiments using isolated trabeculae, we plotted extent of muscle shortening against initial length and preload (panels B and C of Figs 3, 4, 5, 6, 7, 8). We found that the Frank–Starling function curve could be negative (Case 1 in Fig. 3), independent of preload (Case 2 in Fig. 4), mildly positive (Cases 3 and 4 in Figs 5 and 6, respectively) and strongly positive (Cases 5 and 6 in Figs 7 and 8, respectively). Accordingly, the relative afterload, quantified as a fraction of afterload with respect to the isometric stress at the same preload, was a positive function, an independent function, or a negative function of initial length (panels D) or preload (panels E of Figs 3, 4, 5, 6, 7, 8). Each of these cases highlights a feature (as detailed in Methods) where the series of 10 preloaded work‐loops were all at zero active stress (isotonic contraction) (Fig. 3), had the same width (Fig. 4), were at constant relative afterloads (Fig. 5), yielded the peak mechanical efficiency (Fig. 6), were fixed at a constant afterload (Fig. 7), and demonstrated relative afterload decreasing linearly with increasing initial length (Fig. 8). In all cases, both work and enthalpy output were positive functions of initial length and preload (panels F–I). Mechanical efficiency increased monotonically with initial muscle length and preload (panels J and K). Crossbridge efficiency mimicked the positive relation between mechanical efficiency and initial length for Cases 1, 5 and 6 but not for Cases 2–4.
Dependence of change of enthalpy and efficiency on work
As detailed in the Introduction, in testing the statement made by Starling that ‘any increase in the work of the heart … is attended by a corresponding augmentation of the total chemical changes’ (Starling, 1918), Starling (Starling & Visscher, 1927) and others (Coleman et al., 1969; Krukenkamp et al., 1988) plotted oxygen consumption as a function of work to demonstrate their linear dependency. In Fig. 9, we plot the change of enthalpy as well as both mechanical efficiency and crossbridge efficiency as functions of work for all six cases depicted in Figs 3, 4, 5, 6, 7, 8. Both change of enthalpy and mechanical efficiency increased with increasing work. In contrast, crossbridge efficiency decreased (Fig. 9D and H ), mildly increased (Fig. 9F ), or otherwise increased with increasing work.
Figure 9. Enthalpy and efficiency as functions of work.
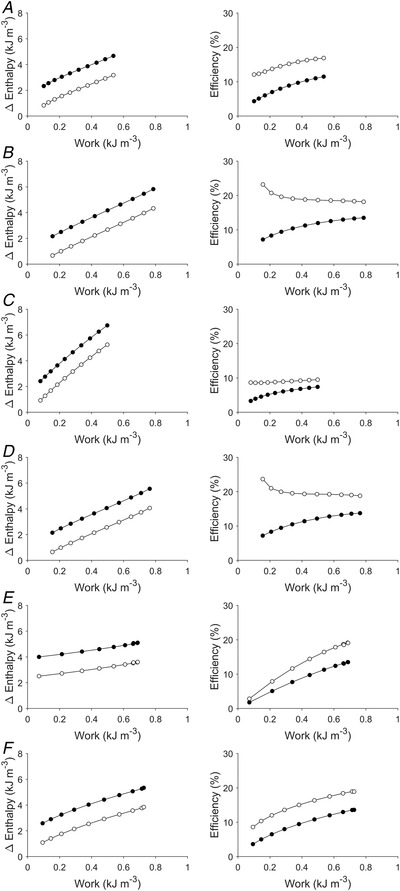
For each of the simulated Cases 1–6 in Figs 3, 4, 5, 6, 7, 8, enthalpy change (filled circles: mechanical enthalpy change; open circles: crossbridge enthalpy change) and efficiency (filled circles: mechanical efficiency; open circles: crossbridge efficiency) are plotted as functions of work: A, Case 1; B, Case 2; C, Case 3; D, Case 4; E, Case 5; and F, Case 6.
Discussion
The present study examines the dependence of cardiac efficiency on initial muscle length and preload. The motivation arose from Starling's phrasing that ‘the energy set free per unit length … is only correct if we insert the word “mechanical” before “energy set free”. Probably a more correct definition … would be the mechanical efficiency of the muscle fibre, i.e. the relation of the mechanical energy to the total energy liberated’ (Starling & Visscher, 1927), and his suggestion that cardiac efficiency could increase with venous pressure (Starling, 1918). By studying isolated cardiac trabeculae, and by using our ‘end‐systolic zone’ and ‘heat–stress zone’ frameworks (Han, Pham et al., 2019; Tran et al., 2020), the present study has examined cardiac efficiency in terms of both supra‐basal (mechanical) efficiency and crossbridge efficiency, thereby capturing the ‘Fenn effect’ while eliminating the confounding ‘Feng effect’. In our simulations of all six physiologically feasible cases, where both work output and change of enthalpy increased with muscle length and preload, mechanical efficiency also increased. Crossbridge efficiency also increased with muscle length under conditions where extent of shortening varies greatly with preload (i.e. the Frank–Starling function curve).
Frank versus Starling
The formulation of the Law of the Heart by Starling differs from the conclusion of Frank (1899) in one essential detail (Bing, 1952; O'Rourke, 1984). Frank established that the stroke volume of the heart increases with increasing diastolic filling pressure. Thus, dependent variables, specifically stroke volume, have been plotted against end‐diastolic pressure. In contrast, Starling perceived that the initial volume of the ventricle is the main determinant for the amount of energy set free during contraction. Thus, end‐diastolic volume, instead of end‐diastolic pressure, should appear on the abscissa. In modern times, the Frank–Starling function curve has come to be displayed as a plot of stroke volume (or cardiac output) against end‐diastolic pressure (i.e. consistent with Frank's assertion), the abscissa of which does not align with Starling's insistence on the importance of the end‐diastolic volume (or ‘the length of the muscle fibre’). In the current analysis, we present both independent variables where energetics variables are plotted against either initial muscle length or preload. The relationship between initial muscle length and preload is a monotonically increasing function where, when L/L o is greater than 0.85, preload increases sharply (Fig. 1) – the classical cardiac passive stress–length relation. Thus, when dependent variables (stroke volume, muscle shortening) are plotted against preload instead of L/L o, they tend to produce a non‐linear response that saturates at high preloads. This is particularly exemplified in our data for the plot of shortening as a function of preload (panels B in Figs 3, 4, 5, 6, 7, 8).
Preload dependence of ‘the energy of contraction’
Frank–Starling curves plot stroke volume or cardiac output as functions of preload. Numerous representations of the curve have been proposed to substitute dependent variables that have units of energy. Thus, both work (Sarnoff, 1955; Sarnoff & Berglund, 1954; Sonnenblick & Downing, 1963) and oxygen consumption (Bünger et al., 1979; Neely et al., 1967) have been plotted against preload. We illustrate these plotting conventions in Figs 3, 4, 5, 6, 7, 8 (in particular, panels B plot the extent of shortening, i.e. the Frank–Starling curve). Our analyses, from simulating a range of conditions, show the merit of plotting energy variables against preload and reveal that both work and change of enthalpy increase with preload, regardless of whether the dependence of the extent of shortening on preload (the Frank–Starling curve (panel B)) is negative (Fig. 3), independent (Fig. 4), mildly positive (Figs 5 and 6) or strongly positive (Figs 7 and 8).
The increase of work with preload appears to be ‘linearised’ when work is plotted against initial muscle length, in line with the concept of ‘preload recruitable stroke work’. The concept was, first introduced by Glower et al. (1985) following their observations in the whole‐heart setting, that both global ventricular stroke work and regional segment stroke work are linear functions of end‐diastolic volume and end‐diastolic segment length, respectively. The slope of the relation was suggested to reflect ventricular contractility (Glower et al., 1985). The linearity of the relation between work and end‐diastolic volume has been supported by subsequent experiments in canine (Krukenkamp et al., 1988) and ovine (Sela & Landesberg, 2009) hearts in situ and in patients in vivo (Feneley et al., 1992) with the end‐diastolic volume acutely varied by vena caval occlusion. We demonstrate that the concept prevails in isolated trabeculae. We also demonstrate that the increment of work with initial muscle length is associated with increasing mechanical efficiency (Fig. 9).
The cardio‐dynamic condition for the linearity between work and end‐diastolic volume has been theorised to arise from a simultaneous increase of the end‐systolic pressure and the arterial afterload in maintaining the stroke volume relatively constant with increasing end‐diastolic volume (Takaoka et al., 1995). Our simulation in Fig. 4 of constant shortening illustrates such a cardio‐dynamic mechanism. Both the end‐systolic force and the afterload do simultaneously increase (Fig. 4A ). However, the maintenance of stroke volume or shortening with increasing end‐diastolic volume or length means that the Frank–Starling curve is flat (Fig. 4B ). Similar dissociation between the Frank–Starling curve and the linear work–length relation can also be obtained under cases simulated in Figs 5 and 6. In particular, results shown in Fig. 6 are interesting inasmuch that if the heart operates at peak mechanical efficiency, as has been suggested (Asanoi et al., 1989; Burkhoff & Sagawa, 1986; de Tombe et al., 1993), then the relative afterload for each work‐loop remains reasonably constant, and the Frank–Starling curve is only mildly positive.
Thus, our findings allow us to comment on the use of Frank–Starling curves; caution in the interpretation of these curves is warranted since their direction is dependent on the loading conditions. If both isometric and work‐loop contractions can be performed on the same muscle, then work‐loops where the relative afterload decreases with muscle length (or preload) must be selected for the Frank–Starling curve to be positive (Figs 7 and 8).
Distinct definitions of cardiac efficiency
Given that Starling's Law of the Heart considers active contraction, it is appropriate to assess mechanical efficiency and crossbridge efficiency in the present study because neither index contains basal metabolism. Using our end‐systolic zone framework, we can illustrate that work‐loops (panels A of Figs 3, 4, 5, 6, 7, 8) and the dependence of supra‐basal efficiency (both mechanical and crossbridge efficiency) on preload can be assessed in the context of relative afterload. If efficiency is to be calculated from whole‐heart measurements, then measured oxygen consumption would contain a contribution from basal metabolism (i.e. ‘total efficiency’, where ‘total’ denotes the sum of supra‐basal and basal metabolic processes). As detailed in the Introduction, in the heart, basal oxygen consumption accounts for some 30% of the total oxygen consumption and increases with increasing diastolic volume following stretch (the ‘Feng effect’). To our knowledge, only a single research group has explicitly plotted total efficiency as a function of preload (Goo et al., 2014a, 2014b), plots of which we reproduce in Fig. 10F . In those studies, rat working hearts were subjected to a range of preloads (5–20 mmHg) at a fixed afterload of 75 mmHg. Total efficiency was found to increase only mildly with preload. From earlier studies reporting work and oxygen consumption but not total efficiency, we are able to digitise their data, either from graphs or in tables, in order to calculate and explicitly plot total efficiency as a function of preload or diastolic volume (Fig. 10 A–E). Total efficiency seems to increase somewhat mildly with preload or diastolic volume. But when afterload is varied, either by fixing it to a low or high value, or having it greatly varied (2‐ to 4‐fold), the dependence of total efficiency on preload can be distorted.
Figure 10. Digitised literature data on total efficiency.
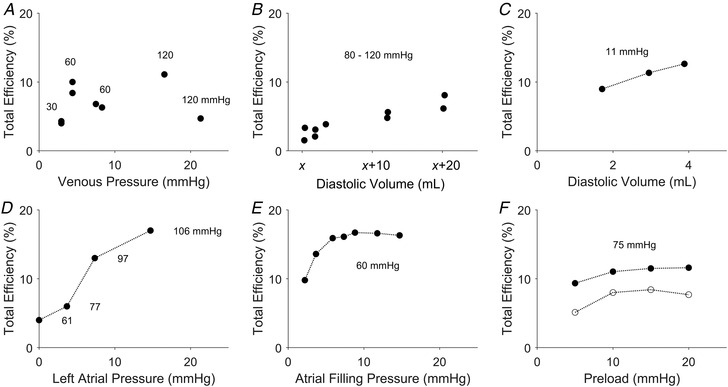
In each panel, the label of the abscissa retains the original label by the authors. The units of the abscissa have been converted from mmH2O to mmHg, or changed from ‘c.c.’ to ‘ml’. The pressure values labelled in each panel are the afterloads. The panels are presented in chronological order of publication. A, data of Evans & Matsuoka (1915) from a dog heart at 35°C. Data of both total efficiency and venous pressure were tabulated from ‘EXP. 15’. The experiment was performed over a range of arterial pressures (in units of mmHg), which are indicated in the vicinity of the data points. B, total efficiency was calculated from digitising the plots of work and oxygen consumption as functions of diastolic volume, as presented in Figs 5 and 6 of Starling & Visscher (1927). The experiment was conducted on a dog heart with the ‘outputs ranged from 200–1200 c.c. per min., and the pressures from 80–120 mm. Hg’. Diastolic volume was expressed as x + known values, where x represents ‘the lowest value of the volume during the experiment, which is impossible to measure when a cardiometer is used’. C, total efficiency was calculated from digitising the data presented in Fig. 4 of Stella (1931) on work and total energy. The experiment was performed on a tortoise heart at 13°C and at a constant arterial resistance of 15 cmH2O (11 mmHg, as indicated on the plot). D, data were plotted from Table 2 of Neely et al. (1967). The experiments were performed on isolated rat working hearts perfused with buffer containing exogenous glucose at 37°C. With increasing left atrial pressure (preload), the aortic pressure (afterload) increased from 61 to 106 mmHg, as has been indicated in the plot. E, data were plotted from Table 2 of Bünger et al. (1979). The experiments were performed at 38°C on isolated perfused working hearts of the guinea pig maintained at a developed systolic pressure of 60 mmHg. F, data were digitised from Fig. 5C of Goo et al. (2014b) plotting measurements from isolated rat working hearts at 37°C (open circles), and from Fig. 2F of Goo et al. (2014a) from similar measurements at 32°C (filled circles). In both sets of experiments, the hearts contracted against a fixed afterload of 75 mmHg.
In their attempt to link efficiency to the Frank–Starling effect, a different metric of ‘efficiency’ was quantified by Holmes et al. (2002). These authors studied isometrically contracting papillary muscles and quantified ‘efficiency.’ They concluded that ‘efficiency depend(s) on muscle length’. Given that isometrically contracting muscles perform no external work, mechanical efficiency is zero. We must point out that Holmes et al. (2002) quantified ‘efficiency’ as the inverse slope of the relation between oxygen consumption and ‘force–length area’ – the concept of which was based on Suga's formulation of the so‐called ‘pressure–volume area’, where ‘efficiency’ is constant and independent of the mode of contraction (Suga, 1990). For this reason, Suga's ‘efficiency’ is also called ‘isoefficiency’. Suga even exploited his ‘pressure–volume area’ concept to derive mechanical efficiency as a function of preload and afterload (Suga et al., 1985). We have recently provided further evidence (Loiselle et al., 2021) that so‐called ‘Suga's efficiency’ is thermodynamically flawed given the physiological untenability of Suga's ‘potential energy’ term (Han, Taberner, Tran, Gao et al., 2012; Han, Taberner, Tran, Nickerson et al., 2012; Han, Tran et al., 2019).
Length‐ and preload‐dependent increase of mechanical efficiency
In all six simulated cases where muscle length and preload were increased, both work output and enthalpy change increased in tandem. These results are consistent with Starling's observation (Starling & Visscher, 1927), albeit Starling measured total oxygen consumption. In the present study, only the supra‐basal change of enthalpy was measured. Several studies have also previously reported positive dependence of work output on end‐diastolic volume (Glower et al., 1985; Krukenkamp et al., 1988) or muscle segment length (Glower et al., 1985) or with preload (Sarnoff, 1955; Sarnoff & Berglund, 1954; Sonnenblick & Downing, 1963). Total oxygen consumption has also been shown to increase with preload (Bünger et al., 1979; Neely et al., 1967). In all six simulated cases, we found that the supra‐basal change of enthalpy increased rather linearly with work output, showing that an increase in work output done was accompanied by a concomitant increase in enthalpy change (Fig. 9). This result is again consistent with the observation of Starling (Starling & Visscher, 1927) and others (Coleman et al., 1969; Krukenkamp et al., 1988) that the total oxygen consumption increases approximately linearly with work output. Despite this linear dependence, our surprising findings are that mechanical efficiency is not independent of, but instead increases with, muscle length and preload (Figs 3, 4, 5, 6, 7, 8) and with work output (Fig. 9) for the six cases studied.
We herein discuss our analysis for such a length‐ or preload‐dependent increase of mechanical efficiency. The analysis requires differentiation between activation heat (Q A) and crossbridge heat (Q XB) which, together with work (W), sum to the change of active enthalpy (). Mechanical efficiency (εmech) is given by the ratio of work to the change of active enthalpy:
where W and Q XB are both functions of preload (p) and afterload (a), while Q A is a constant and independent of loading conditions (Pham, Tran et al., 2017). In the six cases examined, both the numerator (i.e. work output) and the denominator (i.e. change of active enthalpy) increase with muscle length or preload (panels D and E, Figs 3, 4, 5, 6, 7, 8). At lower preloads, the contribution of the constant, Q A, to mechanical efficiency is relatively large. But as preload increases, the relative contribution of decreases because of increases in W and Q XB. The effect of Q A effectively acting as an overhead for the energy expenditure of each work‐loop is reflected in a mechanical efficiency that increases with preload.
Length and preload dependency of crossbridge efficiency
Crossbridge efficiency is defined the same as mechanical efficiency except that . The above analysis would suggest that crossbridge efficiency is constant if both the numerator (W) and the denominator (W+ Q XB = change in crossbridge enthalpy) are both approximately linear functions of preload. This holds for Case 3 where relative afterload is high and constant for each work‐loop (Fig. 5). In the other cases where the numerator and denominator stray from linearity, crossbridge efficiency can increase (Figs 3, 7 and 8) or decrease (Figs 4 and 6) monotonically with increasing preload, depending on afterload. Whereas mechanical efficiency increases with increasing work output (Fig. 9), the dependence of crossbridge efficiency on work output is contingent on the loading conditions. The conditions are: (i) low initial lengths or preloads and (ii) when the active heat liberated comprises largely the activation heat (i.e. negligible crossbridge heat). When both of these conditions are met, the length dependence of crossbridge efficiency deviates from the length dependence of mechanical efficiency, as is evident in Figs 4 and 6, where crossbridge efficiency decreases with initial length (when <0.87 L/L o) and preload (when <3 kPa). When only one of these conditions is met, crossbridge efficiency increases with initial length and preload, as is evident in Fig. 7 where the first condition is met but the second one is not. This is demonstrated in Fig. 7A , where, when L/L o <0.87, the active heat comprises both activation heat and crossbridge heat. Hence, a parallel consideration of relative afterload is required when assessing the length and preload dependence of crossbridge efficiency. It is also worth noting that the crossbridge efficiency represents the theoretical maximum mechanical efficiency that can be attained by the muscle where the contribution of Q A to mechanical efficiency vanishes.
Length‐dependent activation
In the six cases examined, work output increases with increasing muscle length or preload, and is accompanied by a concomitant increase of enthalpy change, as discussed above. This finding leads us to consider the length‐dependent activation process, which forms the basis for the length‐dependent increase of force and, hence, work output, which, in turn, gives rise to increasing mechanical efficiency with increasing initial length and preload. The increase of work output arises from an increase of force and/or shortening via length‐dependent activation. This is replicated in our simulations under three conditions: (i) end‐systolic stress increases but muscle shortening is reasonably constant with increasing initial muscle length (Figs 4, 5, 6), (ii) end‐systolic stress is constant but shortening increases with initial length (Fig. 7), and (iii) end‐systolic stress and shortening are both increasing with initial length (Fig. 8). As force generation and shortening result from the interaction between crossbridges on the myosin filaments and their binding sites on the actin filaments, the molecular basis for the length‐dependent increase of force–length work output that underlies the Frank–Starling mechanism centres on the contractile apparatus. Myofilament length‐dependent activation forms the underlying mechanism (de Tombe et al., 2010) whereby an increase of muscle length leads to an increased number of recruitable crossbridges through cooperativity (Farman et al., 2010; Levy & Landesberg, 2006; Moss et al., 2004; Smith et al., 2009). Length‐dependent activation is accompanied by enhanced sensitivity of the myofilament to Ca2+ (Fabiato & Fabiato, 1978; Farman et al., 2010; Lakatta, 1987; Lee et al., 2010) and distinctive structural rearrangement of the thin and thick filaments (Ait‐Mou et al., 2016; Zhang et al., 2017). These involve the transition of the thin filament from the ‘off’ state to the ‘on’ state (Kobirumaki‐Shimozawa et al., 2014), the transition of the myosin heads from their reserve super‐relaxed state (Anderson et al., 2018; Campbell et al., 2018; Ma et al., 2021; Mann et al., 2020) in concert with the reduction of interfilament lattice spacing (Irving et al., 2000; Smith et al., 2009) and involve the signalling pathway linking mechanosensing in the thick filament with Ca2+‐activated sensitisation of the thin filament (Park‐Holohan et al., 2021). Phosphorylation of troponin I at the Ser23/24 sites (Wijnker et al., 2014) and phosphorylation of myosin‐binding protein‐C (Hanft et al., 2021; Kumar et al., 2015) are involved in the interfilament signal transmission. Length‐dependent activation occurs virtually instantaneously (Mateja & de Tombe, 2012), and is mediated by titin (Ait‐Mou et al., 2016; Fukuda et al., 2009; Kawai & Jin, 2021; Kobirumaki‐Shimozawa et al., 2014; Sequeira & van der Velden, 2015; Sequeira & van der Velden, 2017; Shiels & White, 2008). These cellular processes, which underlie the length‐dependent activation mechanism, increase work output and, given the stress independence of activation heat (acting as an overhead for the energy expenditure), also increase mechanical efficiency of contraction.
Conclusion
Starling's Law of the Heart is underlined by mechanical processes that synergistically promote the formation of a greater number of strong‐binding crossbridges. This synergy, termed length‐dependent activation, arises from the sum of increased myofilament sensitivity to Ca2+, crossbridge cooperativity, and titin‐mediated structural rearrangement and phosphorylation of the contractile protein networks. These mechanisms increase force of contraction, leading to increased mechanical work output, and concomitantly, increased energy expenditure. The present study measures heat liberation to assess the energetics axis of Starling's Law of the Heart, and concludes that length‐dependent activation in the recruitment of crossbridges is an energetically favourable mechanism that yields increased mechanical efficiency and crossbridge efficiency.
Additional information
Competing interests
The authors declare no competing interests.
Author contributions
J.‐C.H. designed the study, conducted the experiments, analysed the data, prepared the figure, and drafted the manuscript. A.T, D.L. and K.T. contributed to the conception of the work, and the acquisition, analysis and interpretation of data. All authors critically reviewed the manuscript. All authors have read and approved the final version of this manuscript and agree to be accountable for all aspects of the work in ensuring that questions related to the accuracy or integrity of any part of the work are appropriately investigated and resolved. All persons designated as authors qualify for authorship, and all those who qualify for authorship are listed.
Funding
The work was supported by Sir Charles Hercus Health Research Fellowships (20/011 and 21/116) from the Health Research Council of New Zealand (awarded to J.‐C.H. and K.T., respectively), Marsden Fast‐Start grants (UOA1504 and UOA1703) from the Royal Society of New Zealand (awarded to J.‐C.H. and K.T., respectively), and a James Cook Research Fellowship from the Royal Society of New Zealand (awarded to A.T.).
Supporting information
Statistical Summary Document
Peer Review History
Acknowledgements
Open access publishing facilitated by The University of Auckland, as part of the Wiley – The University of Auckland agreement via the Council of Australian University Librarians.
Biography
June‐Chiew Han is a senior research fellow at the Auckland Bioengineering Institute, The University of Auckland, following completion of a BE degree (in 2006) and a PhD in Bioengineering degree (in 2012, co‐supervised by Associate Professor Denis Loiselle) both from the same university. He was a post‐doc of Associate Professor Denis Loiselle, who enhanced his research independence and success. His research is on fundamental science, discovering new insights in the field of cardiac energetics, where his experimental work is complemented and facilitated by bioinstrumentation (with Professor Andrew Taberner) and mathematical modelling (with Dr Kenneth Tran).

Handling Editors: Bjorn Knollmann & Eleonora Grandi
The peer review history is available in the Supporting Information section of this article (https://doi.org/10.1113/JP283632#support‐information‐section).
Data availability statement
All data plotted in Figs 1 and 2, as well as the MATLAB scripts for generating Figs 3, 4, 5, 6, 7, 8, 9, will be made available upon request to the corresponding author.
References
- Abraham, D. , & Mao, L. (2015). Cardiac pressure‐volume loop analysis using conductance catheters in mice. Journal of Visualized Experiments, 17(103), 52942. [DOI] [PMC free article] [PubMed] [Google Scholar]
- Abraham, D. M. , Davis, R. T. , Warren, C. M. , Mao, L. , Wolska, B. M. , Solaro, R. J. , & Rockman, H. A. (2016). β‐Arrestin mediates the Frank‐Starling mechanism of cardiac contractility. Proceedings of the National Academy of Sciences, USA, 113(50), 14426–14431. [DOI] [PMC free article] [PubMed] [Google Scholar]
- Ait‐Mou, Y. , Hsu, K. , Farman, G. P. , Kumar, M. , Greaser, M. L. , Irving, T. C. , & Tombe, P. P. (2016). Titin strain contributes to the Frank‐Starling law of the heart by structural rearrangements of both thin‐ and thick‐filament proteins. Proceedings of the National Academy of Sciences, USA, 113(8), 2306–2311. [DOI] [PMC free article] [PubMed] [Google Scholar]
- Anderson, R. L. , Trivedi, D. V. , Sarkar, S. S. , Henze, M. , Ma, W. , Gong, H. , Rogers, C. S. , Gorham, J. M. , Wong, F. L. , Morck, M. M. , Seidman, J. G. , Ruppel, K. M. , Irving, T. C. , Cooke, R. , Green, E. M. , & Spudich, J. A. (2018). Deciphering the super relaxed state of human β‐cardiac myosin and the mode of action of mavacamten from myosin molecules to muscle fibers. Proceedings of the National Academy of Sciences, USA, 115(35), E8143‐E8152. [DOI] [PMC free article] [PubMed] [Google Scholar]
- Asanoi, H. , Sasayama, S. , & Kameyama, T. (1989). Ventriculoarterial coupling in normal and failing heart in humans. Circulation Research, 65(2), 483–493. [DOI] [PubMed] [Google Scholar]
- Bing, R. J. (1952). The regulation of the dynamic and metabolic function of the human heart. Acta medica Scandinavica Supplementum, 266, 223–228. [DOI] [PubMed] [Google Scholar]
- Blix, M. (1893). Die Länge und die Spannung des Muskels1. Skandinavisches Archiv Für Physiologie, 4(1), 399–409. [Google Scholar]
- Bünger, R. , Sommer, O. , Walter, G. , Stiegler, H. , & Gerlach, E. (1979). Functional and metabolic features of an isolated perfused guinea pig heart performing pressure‐volume work. Pflügers Archiv, 380(3), 259–266. [DOI] [PubMed] [Google Scholar]
- Burkhoff, D. , & Sagawa, K. (1986). Ventricular efficiency predicted by an analytical model. American Journal of Physiology, 250, R1021–R1027. [DOI] [PubMed] [Google Scholar]
- Burkhoff, D. , Tombe, P. P.d , Hunter, W. C. , & Kass, D. A. (1991). Contractile strength and mechanical efficiency of left ventricle are enhanced by physiological afterload. American Journal of Physiology. Heart and Circulatory Physiology, 260(2), H569–H578. [DOI] [PubMed] [Google Scholar]
- Campbell, K. S. , Janssen, P. M. L. , & Campbell, S. G. (2018). Force‐dependent recruitment from the myosin off state contributes to length‐dependent activation. Biophysical Journal, 115(3), 543–553. [DOI] [PMC free article] [PubMed] [Google Scholar]
- Clark, A. J. , & White, A. C. (1928). The oxygen consumption of the frog's heart: I. Journal of Physiology, 66(2), 185–202. [DOI] [PMC free article] [PubMed] [Google Scholar]
- Coleman, H. N. , Sonnenblick, E. H. , & Braunwald, E. (1969). Myocardial oxygen consumption associated with external work: The Fenn effect. American Journal of Physiology, 217(1), 291–296. [DOI] [PubMed] [Google Scholar]
- Cranefield, P. F. , & Greenspan, K. (1960). The rate of oxygen uptake of quiescent cardiac muscle. Journal of General Physiology, 44(2), 235–249. [DOI] [PMC free article] [PubMed] [Google Scholar]
- de Tombe, P. P. , Jones, S. , Burkhoff, D. , Hunter, W. C. , & Kass, D. A. (1993). Ventricular stroke work and efficiency both remain nearly optimal despite altered vascular loading. American Journal of Physiology. Heart and Circulatory Physiology, 264(6), H1817–H1824. [DOI] [PubMed] [Google Scholar]
- de Tombe, P. P. , Mateja, R. D. , Tachampa, K. , Ait Mou, Y. , Farman, G. P. , & Irving, T. C. (2010). Myofilament length dependent activation. Journal of Molecular and Cellular Cardiology, 48(5), 851–858. [DOI] [PMC free article] [PubMed] [Google Scholar]
- Decherd, G. , & Visscher, M. B. (1933). The relative importance of the performance of work and the initial fiber length in determining the magnitude of energy liberation in the heart. American Journal of Physiology, 103(2), 400–406. [Google Scholar]
- Elzinga, G. , & Westerhof, N. (1979). How to quantify pump function of the heart. The value of variables derived from measurements on isolated muscle. Circulation Research, 44(3), 303–308. [DOI] [PubMed] [Google Scholar]
- Evans, C. L. (1918). The velocity factor in cardiac work. Journal of Physiology, 52(1), 6–14. [DOI] [PMC free article] [PubMed] [Google Scholar]
- Evans, C. L. , & Hill, A. V. (1914). The relation of length to tension development and heat production on contraction in muscle. Journal of Physiology, 49(1–2), 10–16. [DOI] [PMC free article] [PubMed] [Google Scholar]
- Evans, C. L. , & Matsuoka, Y. (1915). The effect of various mechanical conditions on the gaseous metabolism and efficiency of the mammalian heart. Journal of Physiology, 49(5), 378–405. [DOI] [PMC free article] [PubMed] [Google Scholar]
- Fabiato, A. , & Fabiato, F. (1978). Myofilament‐generated tension oscillations during partial calcium activation and activation dependence of the sarcomere length‐tension relation of skinned cardiac cells. Journal of General Physiology, 72(5), 667–699. [DOI] [PMC free article] [PubMed] [Google Scholar]
- Farman, G. P. , Allen, E. J. , Schoenfelt, K. Q. , Backx, P. H. , & de Tombe, P. P. (2010). The role of thin filament cooperativity in cardiac length‐dependent calcium activation. Biophysical Journal, 99(9), 2978–2986. [DOI] [PMC free article] [PubMed] [Google Scholar]
- Feneley, M. P. , Skelton, T. N. , Kisslo, K. B. , Davis, J. W. , Bashore, T. M. , & Rankin, J. S. (1992). Comparison of preload recruitable stroke work, end‐systolic pressure‐volume and dPdtmax‐end‐diastolic volume relations as indexes of left ventricular contractile performance in patients undergoing routine cardiac catheterization. Journal of the American College of Cardiology, 19(7), 1522–1530. [DOI] [PubMed] [Google Scholar]
- Feng, T. P. (1932). The effect of length on the resting metabolism of muscle. Journal of Physiology, 74(4), 441–454. [DOI] [PMC free article] [PubMed] [Google Scholar]
- Fenn, W. O. (1924). The relation between the work performed and the energy liberated in muscular contraction. Journal of Physiology, 58(6), 373–395. [DOI] [PMC free article] [PubMed] [Google Scholar]
- Frank, O. (1899). Die Grundform des arteriellen Pulses. Zeitschrift fur Biologie, 37, 483–526. [DOI] [PubMed] [Google Scholar]
- Fukuda, N. , Terui, T. , Ohtsuki, I. , Ishiwata, S.i , & Kurihara, S. (2009). Titin and troponin: Central players in the Frank‐Starling mechanism of the heart. Current Cardiology Reviews, 5(2), 119–124. [DOI] [PMC free article] [PubMed] [Google Scholar]
- Garrett, A. S. , Loiselle, D. S. , Han, J.‐C. , & Taberner, A. J. (2021). Heat production in quiescent cardiac muscle is length, velocity and muscle dependent: Implications for active heat measurement. Experimental Physiology, 106(12), 2445–2456. [DOI] [PubMed] [Google Scholar]
- Gibbs, C. L. , Mommaerts, W. , & Ricchiuti, N. V. (1967). Energetics of cardiac contractions. Journal of Physiology, 191(1), 25–46. [DOI] [PMC free article] [PubMed] [Google Scholar]
- Glower, D. D. , Spratt, J. A. , Snow, N. D. , Kabas, J. S. , Davis, J. W. , Olsen, C. O. , Tyson, G. S. , Sabiston, D. C., Jr. , & Rankin, J. S. (1985). Linearity of the Frank‐Starling relationship in the intact heart: The concept of preload recruitable stroke work. Circulation, 71(5), 994–1009. [DOI] [PubMed] [Google Scholar]
- Goo, S. , Han, J.‐C. , Nisbet, L. A. , LeGrice, I. J. , Taberner, A. J. , & Loiselle, D. S. (2014a). Dietary pre‐exposure of rats to fish oil does not enhance myocardial efficiency of isolated working hearts or their left ventricular trabeculae. Journal of Physiology, 592(8), 1795–1808. [DOI] [PMC free article] [PubMed] [Google Scholar]
- Goo, S. , Han, J.‐C. , Nisbet, L. A. , LeGrice, I. J. , Taberner, A. J. , & Loiselle, D. S. (2014b). Dietary supplementation with either saturated or unsaturated fatty acids does not affect the mechanoenergetics of the isolated rat heart. Physiological Reports, 2(3), e00272. [DOI] [PMC free article] [PubMed] [Google Scholar]
- Han, J.‐C. , Pham, T. , Taberner, A. J. , Loiselle, D. S. , & Tran, K. (2019). Solving a century‐old conundrum underlying cardiac force‐length relations. American Journal of Physiology. Heart and Circulatory Physiology, 316(4), H781–H793. [DOI] [PubMed] [Google Scholar]
- Han, J.‐C. , Taberner, A. J. , Kirton, R. S. , Nielsen, P. M. F. , Archer, R. , Kim, N. , & Loiselle, D. S. (2011). Radius‐dependent decline of performance in isolated cardiac muscle does not reflect inadequacy of diffusive oxygen supply. American Journal of Physiology. Heart and Circulatory Physiology, 300(4), H1222–H1236. [DOI] [PubMed] [Google Scholar]
- Han, J.‐C. , Taberner, A. J. , Nielsen, P. M. F. , & Loiselle, D. S. (2013). Interventricular comparison of the energetics of contraction of trabeculae carneae isolated from the rat heart. Journal of Physiology, 591(3), 701–717. [DOI] [PMC free article] [PubMed] [Google Scholar]
- Han, J.‐C. , Taberner, A. J. , Tran, K. , Goo, S. , Nickerson, D. P. , Nash, M. P. , Nielsen, P. M. F. , Crampin, E. J. , & Loiselle, D. S. (2012). Comparison of the Gibbs and Suga formulations of cardiac energetics: the demise of “isoefficiency”. Journal of Applied Physiology, 113(7), 996–1003. [DOI] [PMC free article] [PubMed] [Google Scholar]
- Han, J.‐C. , Taberner, A. J. , Tran, K. , Nickerson, D. P. , Nash, M. P. , Nielsen, P. M. F. , Crampin, E. J. , & Loiselle, D. S. (2012). Relating components of pressure‐volume area in Suga's formulation of cardiac energetics to components of the stress‐time integral. Journal of Applied Physiology, 113(7), 988–995. [DOI] [PMC free article] [PubMed] [Google Scholar]
- Han, J.‐C. , Tran, K. , Nielsen, P. M. F. , Taberner, A. J. , & Loiselle, D. S. (2014). Streptozotocin‐induced diabetes prolongs twitch duration without affecting the efficiency of isolated ventricular trabeculae. Cardiovascular Diabetology, 13(1), 79. [DOI] [PMC free article] [PubMed] [Google Scholar]
- Han, J.‐C. , Tran, K. , Taberner, A. J. , Chapman, B. , & Loiselle, D. S. (2019). Chapter 23 ‐ cardiac energetics. In Zoladz J. A. (Eds.). Muscle and exercise physiology (pp. 505–539). Academic Press. [Google Scholar]
- Hanft, L. M. , Fitzsimons, D. P. , Hacker, T. A. , Moss, R. L. , & McDonald, K. S. (2021). Cardiac MyBP‐C phosphorylation regulates the Frank–Starling relationship in murine hearts. Journal of General Physiology, 153(7), e202012770. [DOI] [PMC free article] [PubMed] [Google Scholar]
- Hemingway, A. , & Fee, A. R. (1927). The relationship between the volume of the heart and its oxygen usage. Journal of Physiology, 63(3), 299–303. [DOI] [PMC free article] [PubMed] [Google Scholar]
- Hill, A. V. (1938). The heat of shortening and the dynamic constants of muscle. Proceedings of the Royal Society B, 126, 136–195. [Google Scholar]
- Holmes, J. W. , Hunlich, M. , & Hasenfuss, G. (2002). Energetics of the Frank‐Starling effect in rabbit myocardium: Economy and efficiency depend on muscle length. American Journal of Physiology. Heart and Circulatory Physiology, 283(1), H324–H330. [DOI] [PubMed] [Google Scholar]
- Irving, T. C. , Konhilas, J. , Perry, D. , Fischetti, R. , & de Tombe, P. P. (2000). Myofilament lattice spacing as a function of sarcomere length in isolated rat myocardium. American Journal of Physiology. Heart and Circulatory Physiology, 279(5), H2568‐H2573. [DOI] [PubMed] [Google Scholar]
- Johnston, C. M. , Han, J.‐C. , Ruddy, B. P. , Nielsen, P. M. F. , & Taberner, A. J. (2015). A high‐resolution thermoelectric‐module‐based calorimeter for measuring the energetics of isolated ventricular trabeculae at body temperature. American Journal of Physiology. Heart and Circulatory Physiology, 309(2), H318–H324. [DOI] [PubMed] [Google Scholar]
- Kawai, M. , & Jin, J. P. (2021). Mechanisms of Frank‐Starling law of the heart and stretch activation in striated muscles may have a common molecular origin. Journal of Muscle Research and Cell Motility, 42(2), 355–366. [DOI] [PMC free article] [PubMed] [Google Scholar]
- Kijtawornrat, A. , Ueyama, Y. , del Rio, C. , Sawangkoon, S. , Buranakarl, C. , Chaiyabutr, N. , & Hamlin, R. L. (2014). Test of the usefulness of a paradigm to identify potential cardiovascular liabilities of four test articles with varying pharmacological properties in anesthetized guinea pigs. Toxicological Sciences, 137(2), 458–468. [DOI] [PubMed] [Google Scholar]
- Kiriazis, H. , & Gibbs, C. L. (1995). Papillary muscles split in the presence of 2,3‐butanedione monoxime have a normal energetic and mechanical properties. American Journal of Physiology, 269, H1685‐H1694. [DOI] [PubMed] [Google Scholar]
- Kobirumaki‐Shimozawa, F. , Inoue, T. , Shintani, S. A. , Oyama, K. , Terui, T. , Minamisawa, S. , Ishiwata, S. , & Fukuda, N. (2014). Cardiac thin filament regulation and the Frank‐Starling mechanism. The Journal of Physiological Sciences, 64(4), 221–232. [DOI] [PMC free article] [PubMed] [Google Scholar]
- Krukenkamp, I. B. , Silverman, N. A. , Kollmorgen, T. A. , & Levitsky, S. (1988). Correlation between the linearized Frank‐Starling relationship and myocardial energetics in the ejecting heart. Effect of unprotected and protected global ischemia. Journal of Thoracic and Cardiovascular Surgery, 95(3), 455–464. [PubMed] [Google Scholar]
- Kuehne, T. , Gleason, B. K. , Saeed, M. , Turner, D. , Weil, J. , Teitel, D. F. , Higgins, C. B. , & Moore, P. (2005). Combined pulmonary stenosis and insufficiency preserves myocardial contractility in the developing heart of growing swine at midterm follow‐up. Journal of Applied Physiology, 99(4), 1422–1427. [DOI] [PubMed] [Google Scholar]
- Kumar, M. , Govindan, S. , Zhang, M. , Khairallah, R. J. , Martin, J. L. , Sadayappan, S. , & de Tombe, P. P. (2015). Cardiac Myosin‐binding Protein C and Troponin‐I Phosphorylation Independently modulate myofilament length‐dependent activation. Journal of Biological Chemistry, 290(49), 29241–29249. [DOI] [PMC free article] [PubMed] [Google Scholar]
- Lakatta, E. G. (1987). Starling's law of the heart is explained by an intimate interaction of muscle length and myofilament calcium activation. Journal of the American College of Cardiology, 10(5), 1157–1164. [DOI] [PubMed] [Google Scholar]
- Lee, E.‐J. , Peng, J. , Radke, M. , Gotthardt, M. , & Granzier, H. L. (2010). Calcium sensitivity and the Frank‐Starling mechanism of the heart are increased in titin N2B region‐deficient mice. Journal of Molecular and Cellular Cardiology, 49(3), 449–458. [DOI] [PMC free article] [PubMed] [Google Scholar]
- Lee, K. S. (1960). The relationship of the oxygen consumption to the contraction of the cat papillary muscle. Journal of Physiology, 151, 186–201. [PMC free article] [PubMed] [Google Scholar]
- Levy, C. , & Landesberg, A. (2006). Cross‐bridge dependent cooperativity determines the cardiac force‐length relationship. Journal of Molecular and Cellular Cardiology, 40(5), 639–647. [DOI] [PubMed] [Google Scholar]
- Loiselle, D. S. (1979). The effects of temperature on the energetics of rat papillary muscle. Pflügers Archiv, 379(2), 173–180. [DOI] [PubMed] [Google Scholar]
- Loiselle, D. S. (1982). Stretch‐induced increase in resting metabolism of isolated papillary muscle. Biophysical Journal, 38(2), 185–194. [DOI] [PMC free article] [PubMed] [Google Scholar]
- Loiselle, D. S. (1985). The rate of resting heat production of rat papillary muscle. Pflügers Archiv, 405(2), 155–162. [DOI] [PubMed] [Google Scholar]
- Loiselle, D. S. , & Gibbs, C. L. (1983). Factors affecting the metabolism of resting rabbit papillary muscle. Pflügers Archiv, 396(4), 285–291. [DOI] [PubMed] [Google Scholar]
- Loiselle, D. S. , Taberner, A. J. , Tran, K. , & Han, J.‐C. (2021). Thermodynamic inconsistency disproves the Suga‐Sagawa theory of cardiac energetics. Progress in Biophysics and Molecular Biology, 164, 81–91. [DOI] [PubMed] [Google Scholar]
- Ma, W. , Henze, M. , Anderson, R. L. , Gong, H. , Wong, F. L. , CLd R., & Irving, T. (2021). The super‐relaxed state and length dependent activation in porcine myocardium. Circulation Research, 129(6), 617–630. [DOI] [PMC free article] [PubMed] [Google Scholar]
- Mann, C. K. , Lee, L. C. , Campbell, K. S. , & Wenk, J. F. (2020). Force‐dependent recruitment from myosin OFF‐state increases end‐systolic pressure‐volume relationship in left ventricle. Biomechanics and Modeling in Mechanobiology, 19(6), 2683–2692. [DOI] [PMC free article] [PubMed] [Google Scholar]
- Mateja, R. D. , & de Tombe, P. P. (2012). Myofilament length‐dependent activation develops within 5 ms in guinea‐pig myocardium. Biophysical Journal, 103(1), L13‐L15. [DOI] [PMC free article] [PubMed] [Google Scholar]
- Moss, R. L. , Razumova, M. , & Fitzsimons, D. P. (2004). Myosin crossbridge activation of cardiac thin filaments. Circulation Research, 94(10), 1290–1300. [DOI] [PubMed] [Google Scholar]
- Neely, J. R. , Liebermeister, H. , Battersby, E. J. , & Morgan, H. E. (1967). Effect of pressure development on oxygen consumption by isolated rat heart. American Journal of Physiology, 212(4), 804–814. [DOI] [PubMed] [Google Scholar]
- O'Rourke, M. F. (1984). Starling's law of the heart: An appraisal 70 years on. Australian and New Zealand Journal of Medicine, 14(6), 879–887. [DOI] [PubMed] [Google Scholar]
- Pacher, P. , Nagayama, T. , Mukhopadhyay, P. , Batkai, S. , & Kass, D. A. (2008). Measurement of cardiac function using pressure‐volume conductance catheter technique in mice and rats. Nature Protocols, 3(9), 1422–1434. [DOI] [PMC free article] [PubMed] [Google Scholar]
- Park‐Holohan, S.‐J. , Brunello, E. , Kampourakis, T. , Rees, M. , Irving, M. , & Fusi, L. (2021). Stress‐dependent activation of myosin in the heart requires thin filament activation and thick filament mechanosensing. Proceedings of the National Academy of Sciences, USA, 118(16), e2023706118. [DOI] [PMC free article] [PubMed] [Google Scholar]
- Patterson, S. W. , Piper, H. , & Starling, E. H. (1914). The regulation of the heart beat. Journal of Physiology, 48(6), 465–513. [DOI] [PMC free article] [PubMed] [Google Scholar]
- Patterson, S. W. , & Starling, E. H. (1914). On the mechanical factors which determine the output of the ventricles. Journal of Physiology, 48(5), 357–379. [DOI] [PMC free article] [PubMed] [Google Scholar]
- Pham, T. , Han, J.‐C. , Taberner, A. , & Loiselle, D. (2017). Do right‐ventricular trabeculae gain energetic advantage from having a greater velocity of shortening? Journal of Physiology, 595(20), 6477–6488. [DOI] [PMC free article] [PubMed] [Google Scholar]
- Pham, T. , Tran, K. , Mellor, K. M. , Hickey, A. , Power, A. , Ward, M.‐L. , Taberner, A. , Han, J.‐C. , & Loiselle, D. (2017). Does the intercept of the heat–stress relation provide an accurate estimate of cardiac activation heat? Journal of Physiology, 595(14), 4725–4733. [DOI] [PMC free article] [PubMed] [Google Scholar]
- Ross, J. (1983). Cardiac function and myocardial contractility: A perspective. Journal of the American College of Cardiology, 1(1), 52–62. [DOI] [PubMed] [Google Scholar]
- Sarnoff, S. J. (1955). Myocardial contractility as described by ventricular function curves; observations on Starling's law of the heart. Physiological Reviews, 35(1), 107–122. [DOI] [PubMed] [Google Scholar]
- Sarnoff, S. J. , & Berglund, E. (1954). Ventricular function. I. Starling's law of the heart studied by means of simultaneous right and left ventricular function curves in the dog. Circulation, 9(5), 706–718. [DOI] [PubMed] [Google Scholar]
- Sela, G. , & Landesberg, A. (2009). The external work–pressure time integral relationships and the afterload dependence of Frank–Starling mechanism. Journal of Molecular and Cellular Cardiology, 47(4), 544–551. [DOI] [PubMed] [Google Scholar]
- Sequeira, V. , & van der Velden, J. (2015). Historical perspective on heart function: The Frank‐Starling Law. Biophysical Reviews, 7(4), 421–447. [DOI] [PMC free article] [PubMed] [Google Scholar]
- Sequeira, V. , & van der Velden, J. (2017). The Frank‐Starling Law: A jigsaw of titin proportions. Biophysical Reviews, 9(3), 259–267. [DOI] [PMC free article] [PubMed] [Google Scholar]
- Shiels, H. A. , & White, E. (2008). The Frank‐Starling mechanism in vertebrate cardiac myocytes. Journal of Experimental Biology, 211(13), 2005–2013. [DOI] [PubMed] [Google Scholar]
- Smith, L. , Tainter, C. , Regnier, M. , & Martyn, D. A. (2009). Cooperative cross‐bridge activation of thin filaments contributes to the Frank‐Starling mechanism in cardiac muscle. Biophysical Journal, 96(9), 3692–3702. [DOI] [PMC free article] [PubMed] [Google Scholar]
- Solaro, R. J. (2011). Regulation of Cardiac Contractility. Morgan & Claypool Life Sciences, San Rafael CA. [PubMed] [Google Scholar]
- Sonnenblick, E. H. , & Downing, S. E. (1963). Afterload as a primary determinant of ventricular performance. American Journal of Physiology, 204(4), 604–610. [DOI] [PubMed] [Google Scholar]
- Starling, E. H. (1918). The linacre lecture on the law of the heart given at cambridge, 1915. Nature, 101, 43–43. [Google Scholar]
- Starling, E. H. , & Visscher, M. B. (1927). The regulation of the energy output of the heart. Journal of Physiology, 62(3), 243–261. [DOI] [PMC free article] [PubMed] [Google Scholar]
- Stella, G. (1931). The oxygen consumption of the tortoise heart: Its dependence upon diastolic volume and on the mechanical conditions of systole. Journal of Physiology, 72(2), 247–264. [DOI] [PMC free article] [PubMed] [Google Scholar]
- Suga, H. (1990). Ventricular energetics. Physiological Reviews, 70(2), 247–277. [DOI] [PubMed] [Google Scholar]
- Suga, H. , Igarashi, Y. , Yamada, O. , & Goto, Y. (1985). Mechanical efficiency of the left ventricle as a function of preload, afterload, and contractility. Heart and Vessels, 1(1), 3–8. [DOI] [PubMed] [Google Scholar]
- Suga, H. , & Sagawa, K. (1974). Instantaneous pressure‐volume relationships and their ratio in the excised, supported canine left ventricle. Circulation Research, 35(1), 117–126. [DOI] [PubMed] [Google Scholar]
- Suga, H. , Sagawa, K. , & Shoukas, A. A. (1973). Load independence of the instantaneous pressure‐volume ratio of the canine left ventricle and effects of epinephrine and heart rate on the ratio. Circulation Research, 32(3), 314–322. [DOI] [PubMed] [Google Scholar]
- Taberner, A. J. , Han, J.‐C. , Loiselle, D. S. , & Nielsen, P. M. F. (2011). An innovative work‐loop calorimeter for in vitro measurement of the mechanics and energetics of working cardiac trabeculae Journal of Applied Physiology, 111(6), 1798–1803. [DOI] [PubMed] [Google Scholar]
- Taberner, A. J. , Johnston, C. M. , Pham, T. , Han, J.‐C. , Uddin, R. , Loiselle, D. S. , Ruddy, B. P. , & Nielsen, P. M. F. (2018). A flowthrough infusion calorimeter for measuring muscle energetics: Design and performance. Ieee Transactions on Instrumentation and Measurement, 67(7), 1690–1699. [Google Scholar]
- Taberner, A. J. , Nielsen, P. , Zgierski Johnston, C. , Anderson, A. , Cheuk, M. , Garrett, A. , Dowrick, J. , Lam Po Tang, E. , HajiRassouliha, A. , Ruddy, B. , Pham, T. , Tran, K. , Han, J.‐C. , & Loiselle D. (2019). A dynamometer for nature's engines. IEEE Transactions on Instrumentation and Measurement, 22(2), 10–16. [Google Scholar]
- Takaoka, H. , Suga, H. , Goto, Y. , Hata, K. , & Takeuchi, M. (1995). Cardiodynamic conditions for the linearity of preload recruitable stroke work. Heart and Vessels, 10(2), 57–68. [DOI] [PubMed] [Google Scholar]
- Tran, K. , Taberner, A. J. , Loiselle, D. S. , & Han, J.‐C. (2020). Energetics equivalent of the cardiac force‐length end‐systolic zone: Implications for contractility and economy of contraction. Frontiers in Physiology, 10. [DOI] [PMC free article] [PubMed] [Google Scholar]
- Walley, K. R. (2016). Left ventricular function: Time‐varying elastance and left ventricular aortic coupling. Critical Care, 20(1), 270. [DOI] [PMC free article] [PubMed] [Google Scholar]
- Watters, T. , Wikman‐Coffelt, J. , Wu, S. , James, T. L. , Sievers, R. , & Parmley, W. W. (1989). Effects of perfusion pressure on energy and work of isolated rat hearts. Hypertension, 13(5), 480–488. [DOI] [PubMed] [Google Scholar]
- Weber, K. T. , Janicki, J. S. , Reeves, R. C. , Hefner, L. L. , & Reeves, T. J. (1974). Determinants of stroke volume in the isolated canine heart. Journal of Applied Physiology, 37(5), 742–747. [DOI] [PubMed] [Google Scholar]
- Westerhof, N. , Stergiopulos, N. , Noble, M. I. M. , & Westerhof, B. E. (2019). Snapshots of Hemodynamics: An Aid for Clinical Research and Graduate Education. Springer Nature. [Google Scholar]
- Whalen, W. J. (1960). Some factors influencing O2 consumption of isolated heart muscle. American Journal of Physiology, 198(6), 1153–1156. [DOI] [PubMed] [Google Scholar]
- Whalen, W. J. (1961). The relation of work and oxygen consumption in isolated strips of cat and rat myocardium. Journal of Physiology, 157(1), 1–17. [DOI] [PMC free article] [PubMed] [Google Scholar]
- Wijnker, P. J. , Sequeira, V. , Foster, D. B. , Li, Y. , Dos Remedios, C. G. , Murphy, A. M. , Stienen, G. J. , & van der Velden, J. (2014). Length‐dependent activation is modulated by cardiac troponin I bisphosphorylation at Ser23 and Ser24 but not by Thr143 phosphorylation. American Journal of Physiology. Heart and Circulatory Physiology, 306(8), H1171‐H1181. [DOI] [PMC free article] [PubMed] [Google Scholar]
- Zhang, X. , Kampourakis, T. , Yan, Z. , Sevrieva, I. , Irving, M. , & Sun, Y. B. (2017). Distinct contributions of the thin and thick filaments to length‐dependent activation in heart muscle. eLife, 6, e24081. [DOI] [PMC free article] [PubMed] [Google Scholar]
Associated Data
This section collects any data citations, data availability statements, or supplementary materials included in this article.
Supplementary Materials
Statistical Summary Document
Peer Review History
Data Availability Statement
All data plotted in Figs 1 and 2, as well as the MATLAB scripts for generating Figs 3, 4, 5, 6, 7, 8, 9, will be made available upon request to the corresponding author.