

Abstract
Objective
To perform an in vitro characterization of surgical aortic valves (SAVs) and transcatheter aortic valves (TAVs) to highlight the development of the flow dynamics depending on the type of valve implanted and assess the basic differences in the light of flow turbulence and its effect on blood damage likelihood and hemodynamic parameters that shed light on valve performance.
Methods
A Starr–Edwards ball and cage valve of internal diameter 22 mm, a 23-mm Medtronic Hancock II SAV, a 23-mm St Jude Trifecta SAV, a 23-mm St Jude SJM (mechanical valve) SAV, a 26-mm Medtronic Evolut TAV, and a 26-mm Edwards SAPIEN 3 TAV were assessed in a pulse duplicator under physiological conditions. Particle image velocimetry was performed for each valve. Pressure gradient and effective orifice area (EOA) along with velocity flow field, Reynolds shear stress (RSS), and viscous shear stress (VSS) were calculated.
Results
The SJM mechanical valve exhibited the greatest EOA (1.96 ± 0.02 cm2), showing superiority of efficiency compared with the same-size Trifecta (1.87 ± 0.07 cm2) and Hancock II (1.05 ± 0.01 cm2) (P < .0001). The TAVs show close EOAs (2.10 ± 0.06 cm2 with Evolut and 2.06 ± 0.03 cm2 with SAPIEN 3; P < .0001). The flow characteristics and behavior downstream of the valves differed depending on the valve type, design, and size. The greater the RSS and VSS the more turbulent the downstream flow. Hancock II displays the greatest range of RSS and VSS magnitudes compared with the same-size Trifecta and SJM. The Evolut displays the greatest range of RSS and VSS compared with the SAPIEN 3.
Conclusions
The results of this study shed light on numerous advancements in the design of aortic valve replacement prosthesis and the subsequent hemodynamic variations. Future surgical and transcatheter valve designs should aim at not only concentrating on hemodynamic parameters but also at optimizing downstream flow properties.
Key Words: surgical aortic valves, transcatheter aortic valve replacement, blood damage, turbulence, ball and cage
Abbreviations and Acronyms: AV, aortic valve; EOA, effective orifice area; ID, internal diameter; PIV, particle image velocimetry; RSS, Reynolds shear stress; SAV, surgical aortic valve; SAVR, surgical aortic valve replacement; SJM, St Jude Medical; TAV, transcatheter aortic valve; VSS, viscous shear stress
Graphical abstract
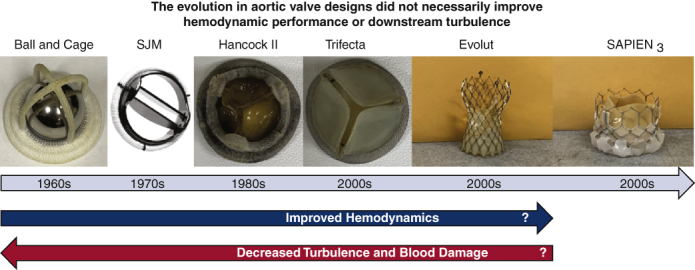
The evolution in aortic valve designs did not necessarily improve hemodynamic performance or downstream turbulence.

The quest for the perfect aortic valve for replacement surgeries is still ongoing.
Central Message.
The evolution in aortic valve designs contributed to significant changes in hemodynamics and flow properties downstream of the valves.
Perspective.
The advancements in the design of aortic valve prostheses over the past 60 years intended to improve the hemodynamics and reduce the turbulence and the blood damage downstream of the valve and while the design changed, the challenges remained warranting future iterations targeting these specific issues to improving patient care.
See Commentary on page 57.
Aortic valve (AV)-replacement procedures were introduced in the 1960s and have dramatically improved the outcomes of patients with AV disease.1 Surgical aortic valve (SAV) replacement (SAVR) procedures consist of replacing the diseased native AV with a surgical prosthesis. While SAVR introduced many improvements for this disease process, it also introduced several complications, including thromboembolic and anticoagulation-related events.2 To reduce the impact of these associated complications, the design of the valves was drastically changed. The first generations of SAVs consisted of mechanical valves. In particular, the ball and cage valve was the first concept introduced and in 1962, the Starr–Edwards ball valves were commercially introduced.3 The ball was a central occluder that caused some obstruction to the blood stream, leading to compromised hemodynamics.4 This was naturally more significant with patients with narrow aortic roots.3 The wake regions downstream of the ball were believed to be the cause for the thrombogenicity of the valve.5 To attempt to correct that, several mechanical valve designs were introduced, such as the bileaflet valve design around 1977, that are currently still used worldwide. The use of mechanical valves is most prominent in younger patients in the Western world and in areas with a greater burden of rheumatic heart disease. These valves are made of 2 semicircular leaflets leading to 3 orifices that the forward jet can exit from: 2 peripheral jets and 1 central jet. Compared with the ball and cage valve, the resistance to flow and thromboembolic complications was comparably minimal.3 Despite that, lifelong anticoagulation is standard of care after implantation, and bleeding risks are significant in some patients.6 In an attempt to avoid lifelong anticoagulation and to mimic the trileaflet anatomy of the native AV, prosthetic SAVs with biological (tissue) leaflets were presented.1 In most, porcine or pericardial biological leaflets were fixed with glutaraldehyde and mounted on a metallic or polymer supporting stent.7 These bioprosthetic surgical valves eliminated the need for long-term anticoagulation. First-generation bioprosthetic SAVs, despite the freedom from anticoagulation that they represented, had the drawback of limited durability, with an interval of 10 to 15 years.8,9
Transcatheter approaches for replacement of the AV for severe aortic stenosis initially emerged as an alternative to SAVR in patients deemed high-to-extreme risk for surgery.10 Transcatheter aortic valves (TAVs), similar to bioprosthetic SAVs, are made of fixed pericardial and porcine leaflets. TAV valve designs vary by those that are intra-annular or supra-annular and those that are balloon- or self-expandable. Like surgical tissue valves, TAV also do not require long-term anticoagulation. While the durability of TAVs is similar to SAVs, other relevant considerations between TAVR and SAVR include coronary access, residual gradient, valvular regurgitation, patient–prosthesis mismatch, and thrombus formation.11, 12, 13, 14
The objective of this study was to perform an in vitro characterization of selected surgical and transcatheter valves that represent early to current valve designs. The goal was to evaluate and understand the post-implant resulting flow and overall turbulence levels (RSS and VSS) for these prostheses and their potential relevance to blood damage, as summarized in Figure 1.
Figure 1.

Image summarizing the objective of this study that is to perform an in vitro characterization of selected surgical and transcatheter valves that represent early to current valve designs to evaluate and understand the postimplant resulting flow and overall turbulence levels for these prostheses, and their potential relevance to blood damage. SJM, St Jude Medical.
Methods
Valve Selection and Hemodynamic Parameter Assessment
Four surgical and 2 TAVs were selected for hemodynamic assessment in this study: a 22-mm internal diameter (ID) Starr-Edwards mechanical ball and cage valve (Edwards Lifesciences, Irvine, Calif) (Figure 2, A), a 23-mm Hancock II (Medtronic) of porcine leaflets sutured inside the stent bioprosthesis and of true ID of 19 mm (Figure 2, B), a 23-mm Trifecta (Abbott Laboratories) of pericardial leaflets sutured outside the stent bioprosthesis and of true ID of 21 mm (Figure 2, C), a 23-mm St Jude Medical (SJM) Masters Series (Abbott Laboratories) mechanical prosthesis of ID 18.6 mm (Figure 2, D), a 26-mm Medtronic Evolut transcatheter prosthesis of porcine pericardial leaflets (Figure 2, E), and a 26-mm Edwards SAPIEN 3 (Edwards Lifesciences) transcatheter prosthesis of pericardial leaflets (Figure 2, F). The true ID refers to the true ID of the valve when the leaflets are mounted.7 For valves with leaflets sutured inside the stent, the true ID is smaller than the stent ID.7 Because a 26-mm Evolut is suitable for implantation in annuli of diameters reaching up to 23 mm, the ID of the Evolut was considered 23 mm, unlike the SAPIEN 3, for which the ID was considered 26 mm.
Figure 2.

Images of the valves. A, Starr Edwards Ball and Cage. B, Medtronic Hancock II. C, St Jude Trifecta. D, Masters Series St Jude Mechanical Valve. E, Medtronic Evolut. F, Edwards SAPIEN 3. These valves were selected in this study for downstream flow and flow properties assessment. This study focuses on understanding the major differences among these valves from the earliest designs to the ones currently available.
The 6 valves were evaluated under pulsatile flow conditions produced by a left heart simulator in vitro setup yielding physiological flow and pressure curves as described in previous publications.15,16 The working fluid in this study was a blood analog mixture of water and glycerin (99% pure glycerin) with a density of 1060 kg/m3 and a kinematic viscosity of 3.5 cSt. The cardiac output was set to be 5 L/min, heart rate was set to 60 bpm, and aortic pressure were set at 120/80 mm Hg. Fifty-one consecutive cardiac cycles of aortic pressure, ventricular pressure, and flow rate data were recorded at a sampling rate of 100 Hz. The mean transvalvular pressure gradient was defined as the average of positive pressure difference between the ventricular and aortic pressure curves during forward flow.
The effective orifice area (EOA) was computed using the Gorlin's equation:
| (1) |
Where Qrms represents the root mean square AV flow (cm3/s) over the positive differential pressure period and pressure gradient (mm Hg) is the mean pressure difference (measured during the positive differential pressure period).
Particle Image Velocimetry (PIV)
For PIV experiments, the working fluid in the left heart simulator was seeded with fluorescent PMMA-Rhodamine B particles with average diameters of ∼10 μm. The velocity field downstream of the valves was measured using high spatial and temporal resolution PIV. This involved illuminating the flow region using a laser sheet created by a pulsed Nd:YLF single cavity diode pumped solid-state laser coupled with external spherical and cylindrical lenses while acquiring high-speed images of the fluorescent particles within the region of interest. Time-resolved PIV images were acquired with a resulting spatial and temporal resolutions of 0.0296 mm/pixel and 500 Hz, respectively. Phase-locked measurements were recorded for 3 phases of the cardiac cycle, covering acceleration, peak systole, and deceleration, repetitively, 250 times with a spatial resolution of 0.0296 mm/pixel. Refraction was corrected using a calibration in DaVis PIV software (DaVis 7.2, LaVision). Velocity vectors were calculated using adaptive cross-correlation algorithms. Further details of PIV measurements can be found in previous publications.17, 18, 19 Using the velocity measurements from PIV, vorticity dynamics were evaluated. Regions of high vorticity along the axis perpendicular to the plane indicate both shear and rotation of the fluid particles. Vorticity was computed using the following equation:
| (2) |
Where ωz is the vorticity component with units of s−1 and Vx and Vy are the x and y components of the velocity vector with units of m/s. The x and y directions are axial and lateral, respectively, with the z direction being out of measurement plane.
Instantaneous viscous shear stress (VSS)
| (3) |
Where τ is in Pa and μ is the dynamic viscosity in N.s/m2.
Reynolds shear stress (RSS)
RSS has been widely correlated to turbulence and platelet activation.20,21 It is a statistical quantity that evaluates the transport of fluctuating momentum by fluctuating velocity components.22
| (4) |
Where ρ is the blood density and u′ and v′ are the instantaneous velocity fluctuations in the x and y directions, respectively.
In turbulent flows, Ge and colleagues22 highlighted the definitions and relations of RSS and VSS with the turbulence engendered. The VSS measures the viscous shear force per unit area experienced by a fluid element; hence, it measures the strength of the “real” physical force exerted on blood cells, whereas the RSS is a statistical quantity that has no direct link to any physical forces. Thus, the Reynolds stress is a pseudo-stress like term but not a “real” quantity.23,24
Statistics
Statistical analysis was performed using JMP Pro, version 15.0.0 (SAS Institute). All data are presented as mean ± standard deviation. For data following a normal distribution (based on the Kolmogorov–Smirnov test with P > .05), analysis of variance followed by the Tukey multiple comparison test between each pair was performed. Analyses were performed with 51 replicates for pressure gradient and EOA.
Probability density functions of the RSS and VSS Stress distributions were calculated and plotted. To evaluate the velocities, VSS and RSS obtained quantitatively, and the probability distribution of each of these quantities were computed and plotted as described in previous articles.15,16,25 The probability density function or PDF displays all the values (all the range) of a certain parameter distributed over a certain region of interest and gives the relative or differential likelihood (frequency) of any parameter. The area under the PDF curve is always equal to 1 and therefore can also be considered as a normalized histogram.
Results
This study sought to evaluate the flow and hemodynamic characteristics of each of the 6 valves. No comparisons among the hemodynamic parameters or flow characteristics downstream the valves were made unless the valves have the size.
Hemodynamic Parameters
The pressure gradient and the EOA obtained with the ball and cage were found to be 7.98 ± 0.11 mm Hg and 1.88 ± 0.03 cm2, respectively. The Hancock II showed the greatest pressure gradient (20.2 ± 0.42 mm Hg) and lowest EOA (1.05 ± 0.01 mm Hg) compared with the SJM (5.4 ± 0.06 mm Hg and 1.96 ± 0.02 cm2) (P < .0001 for both pressure gradient and EOA) and Trifecta (7.80 ± 0.35 mm Hg and 1.87 ± 0.07 cm2; P < .0001) of the same size. The Evolut and SAPIEN 3 showed close values of pressure gradient and EOA (8.03 ± 0.38 mm Hg and 2.10 ± 0.06 cm2 vs 8.29 ± 0.21 mm Hg and 2.06 ± 0.03 cm2, respectively; P < .0001). Table 1 summarizes these results. Tables E1 and E2 show the statistical comparisons and significant differences between each valve.
Table 1.
Transvalvular pressure gradients ΔP and effective orifice areas (EOAs)
| Valve type | Pressure gradient ΔP, mm Hg | EOA, cm2 |
|---|---|---|
| Ball and cage | 7.98 ± 0.11 | 1.88 ± 0.03 |
| Hancock II | 20.2 ± 0.42 | 1.05 ± 0.01 |
| Trifecta | 7.80 ± 0.35 | 1.87 ± 0.07 |
| SJM | 5.4 ± 0.06 | 1.96 ± 0.02 |
| Evolut | 8.03 ± 0.38 | 2.10 ± 0.06 |
| SAPIEN 3 | 8.29 ± 0.21 | 2.06 ± 0.03 |
The SJM showed the lowest ΔP and highest EOA compared with the Trifecta and the Hancock II (of the same size). The Evolut and SAPIEN 3 showed close ΔP and EOA results. SJM, St Jude Medical.
Flow Field Characteristics
A flow velocity field is one manner of representing the properties of the fluid flow upstream and downstream the valves.15,18,19 The red and blue traces shown in Figure 3 represent shear layers, with red and blue being counterclockwise and clockwise vorticity generated, respectively. Vorticity provides information on the local rotation of the blood. The greater the magnitudes of RSS and the instantaneous VSS, the greater the turbulence in the downstream field. These regional differences in shear stress have been correlated with regional differences in blood damage.17, 18, 19,25
Figure 3.

Phase-averaged velocity vectors and vorticity contours at different phases in the cardiac cycle of the various valves. The types of valves dictate the flow patterns downstream of each valve and the magnitude of the resulting jet velocity. The vectors denote the velocity, their length relative to each other represents their respective magnitude, and the contour represents the local spinning of the fluid. As the valves open, shear layers (shown in red and blue patches) form. The way these shear layers form and their intensity depend greatly on the way the valve is designed (ball-and-cage, trileaflet, bileaflet and with a long stent) and the size of the orifice. SJM, St Jude Medical.
Ball and Cage
The flow through the ball and cage valve crosses the annulus around the ball and results in a circumferential jet, as shown in Figure 3 and Video 1. A stagnant and reverse flow region of low velocity (–0.007 m/s), as shown in Figure 4, A, in the wake downstream of the ball is formed during acceleration and peak systole phases (Figure 3). The Y direction is highlighted in Figure 3 for guidance. To summarize, it corresponds to the vertical direction of the 2-dimensional plane of the flow field.
Figure 4.

Velocity component profiles of the different valves at peak systole at the Y location that corresponds to the exit from leaflets (A) Vx and (B) Vy. Different velocity profiles are obtained with the valves depending on the design and the size of the orifice. The Evolut TAV shows a greater velocity compared with the SAPIEN 3 of the same size, the Trifecta shows the lowest velocity compared with the SJM and the Hancock II. Hancock II and Evolut are characterized by more fluctuation compared to the Trifecta and SAPIEN 3, respectively. It is important to note that SAPIEN 3 is usually selected for larger annuli compared with the Evolut. SJM, St Jude Medical.
The jet velocity magnitudes in the peripheral regions reach around 1.9 m/s during peak systole as shown in Figure 5 at the exit of the leaflets from each valve. The velocity in the central jet at the exit and at the tip of the ball reaches 0 m/s. While Figure 4 shows the velocity components (that highlight the direction of the flow, eg, negative if the flow is backwards), Figure 5 shows the magnitude.
Figure 5.

Velocity profiles of the different valves at peak systole at the Y location that corresponds to the exit from leaflets tips. In this figure, the overall magnitude of the velocity is shown. The Evolut yields higher velocity magnitude compared to the SAPIEN 3 of the same size. It is important to note that SAPIEN 3 is usually selected for larger annuli compared to the Evolut. The Trifecta shows the lowest velocity magnitude compared with SJM and Hancock II. SJM, St Jude Medical.
Hancock II and Trifecta
The Hancock II and Trifecta valves are bioprosthetic surgical valves with porcine and pericardial leaflets, respectively. The leaflets of the Hancock II are sutured inside the stent whereas the leaflets of the Trifecta are sutured outside the stent (Figure 2). In both prostheses, the jet passes through the annulus and exists through one orifice. The shear layer reaches the tip of the fully open leaflet, it is forced to separate and continue as a free shear layer.26 Flow separation occurs when the fluid particles adjacent to the body deviate from the contour of the body, contrary to flow attachment which means that the fluid particles move parallel to the body wall.27 After the first part of acceleration, the shear layers break down and become unsteady. During the deceleration all large-scale coherent flow features disappear. More coherent and less unsteady shear layers are present with the Trifecta compared with those downstream the Hancock. The velocity in the central jet at the exit and at the tip of the leaflets reaches 3.1 m/s with the Hancock II SAV and 1.8 m/s with the Trifecta, as shown in Figure 5. The fluctuations in Vy with Trifecta are small ranging between–0.15 and 0.05 m/s while Hancock II exhibits the highest Vy fluctuations ranging between 0 and 0.7 m/s, as shown in Figure 4, B. The flow downstream of the Hancock II and Trifecta valves is shown in Videos 2 and 3, respectively.
St Jude Medical
The SJM mechanical valve is a bileaflet mechanical valve. Once the flow crosses the annulus, it exits through 3 orifices, 2 peripheral and 1 central. During acceleration, the starting vortex clearly appears near the sinuses' regions (Figure 3). During peak, the jets are streamlined, and the shear layers are coherent throughout the phase until deceleration starts. The flow downstream of SJM is shown in Video 4.
The velocity of the peripheral and the central jets is almost equal reaching around 2 m/s as shown in Figure 5 during peak systole. The velocity fluctuation in the Y-direction is the smallest of the valves compared, ranging between –0.1 and 0.1 m/s (Figure 4, B) leading to close values of velocities between the velocity magnitude and Vx (Figures 4, A, and 5).
Evolut and SAPIEN 3
The Evolut and SAPIEN 3 valves are self- and balloon-expandable TAVs made of porcine and bovine pericardial leaflets, respectively. The flow downstream of the Evolut and the SAPIEN 3 is shown in Videos 5 and 6. Figure 3 shows the evolution of the jet through these valves. Once the flow passes through the annulus, during acceleration, shear layers form showing clear starting vortices for both valves. Throughout the cardiac cycle, SAPIEN 3 valve shows more stable shear layers particularly during peak systole. The velocity downstream the Evolut valve reaches about 3.6 m/s, whereas that for SAPIEN 3 reaches around 2.8 m/s. The fluctuations in Vy are more significant with the Evolut, ranging between –0.34 and 0.29 m/s, whereas with SAPIEN 3, Vy fluctuates between –0.18 and 0.14 m/s, as shown in Figure 4, B.
Reynolds Shear Stress (RSS)
As previously mentioned, the greater the RSS, the greater the turbulence in the downstream field. These phenomena correlate with a greater incidence of blood damage and platelet activation.20,22
The distribution of the RSS during phases of transvalvular flow is shown in Figure 6 and contours follow those of the velocity fields specifically highlighted in shear layers (Figure 3) and the velocity fluctuations in both components x and y (Figure 4). While qualitatively, the Trifecta and SJM show the lowest distribution of RSS magnitude, the Hancock II and Evolut valves show some of the highest RSS magnitudes. The ball and cage valve RSS contours are highest around the ball and smallest downstream the ball.
Figure 6.

Principal Reynolds shear stresses (RSS) at different phases in the cardiac cycle for the different valves. The greater the turbulent stresses, the greater the turbulence and therefore the greater the losses. Elevated turbulent stresses indicate a suboptimal valve performance and correlate with a greater blood damage potential. The Evolut shows greater turbulent stresses compared with the SAPIEN 3 and the SJM shows lower RSS compared with the Trifecta and the Hancock II. SJM, St Jude Medical.
Quantitatively, as shown in Figure 7, A, the Hancock II valve displays the highest range of RSS magnitude, reaching about 418 Pa in comparison with the SJM (69.4 Pa) and Trifecta (114 Pa). The ball and cage valve shows an RSS magnitude, reaching 275.5 Pa. The Evolut TAV shows RSS magnitudes reaching 266 Pa downstream of the stent whereas the SAPIEN 3 shows RSS magnitudes reaching up to 190 Pa.
Figure 7.

A, Principal Reynolds shear stresses (RSS) probability density function (PDF) at peak systole phase for the different valves and B, instantaneous viscous shear stresses probability density function throughout the cardiac cycle for the different valves. The probability density function or PDF displays all the values (all the range) of a certain parameter distributed over a certain region of interest and gives the relative or differential likelihood (frequency) of any parameter. The area under the PDF curve is always equal to 1 and therefore can also be considered as a normalized histogram. Complementing the results of Figure 5, the Evolut shows greater turbulent stresses compared with the SAPIEN 3 and the SJM shows lower RSS compared with the Trifecta and the Hancock II. SJM, St Jude Medical.
Instantaneous VSS
As previously mentioned, the greater the instantaneous VSS, the greater the turbulence in the downstream field which correlates with a greater incidence of blood damage. Figure 7, B, shows the probability density function of the instantaneous VSS distribution throughout the cardiac cycle for the 6 different valves. The Trifecta shows the smallest VSS magnitudes (<10 Pa) compared with the SJM (between 12.5 and 15 Pa) and the Hancock II (17.5 Pa). The Evolut and SAPIEN 3 are characterized by instantaneous VSS range less than 10 Pa. The ball-and-cage valve is characterized by VSS ranging between 12.5 and 15 Pa.
Discussion
In this study, the hemodynamics and flow characteristics of different generations of AVs are assessed starting from the historic ball and cage surgical AV to newer transcatheter prostheses. Our principal novel findings include (1) an assessment of the hemodynamic parameters that dictate the valve performance; Hancock II displays the largest pressure gradient compared with a same-size Trifecta and SJM and the Evolut and SAPIEN 3 are characterized by close pressure gradient and EOA magnitudes. (2) Different downstream flow patterns and velocities were observed with each valve. The greater the RSS and VSS the more turbulent the downstream flow is. Hancock II displays the greatest range of RSS and VSS magnitudes reaching about 418 Pa and 17.5 Pa, respectively. These findings are important, as future surgical and transcatheter valve designs will not need to achieve hemodynamic benchmarks, but optimally they will minimize features that lead to early structural valve deterioration and damage to blood components.
Hemodynamic Parameters
The SJM mechanical valve exhibits the highest EOA, showing superiority of efficiency compared with the same size Trifecta and Hancock II. This result is supported by previous work.5 It is interesting to note that SJM has the lowest true ID (18.6 mm) among all other valves yet exhibits the highest ratio of EOA to true ID.19 The true ID in stented surgical valves is defined as the stent ID minus the space taken by the leaflets.7 In particular, comparing the ID of SJM (18.6 mm) with that of the Hancock II (19 mm), the normalized EOA is 2 times greater for SJM. Despite the excellent hemodynamics of the SJM, the surgical use of mechanical valves in general is decreasing in the U.S. due to concerns about lifelong anticoagulation.
The Evolut TAV, despite its diameter of 26 mm and its suitability for annuli of diameters up to 23 mm, showed the second lowest normalized EOA after Hancock II SAV within the bioprosthetic valves. Although characterized by totally different IDs (23 mm vs 19 mm), the commonality between these 2 valves is the porcine nature of their leaflets (Evolut leaflets are made of porcine pericardium while those of the Hancock II are made of porcine leaflets). Thinner leaflets (fixed porcine pericardium or fixed porcine AV leaflet) may lead to more flutter. The flutter of the leaflet can cause flow disturbances that enhance turbulence which leads to increased pressure gradients and reduced EOA. In addition, compared with pericardial tissue, studies have shown that porcine leaflets in prosthetic valves yield lower EOAs and performance indices.5 These properties may be less apparent with thicker bovine pericardium.
The Trifecta has leaflets sutured around the stent post compared to the Hancock II with the leaflets sutured on the inside, which allows for an extra 2 mm in the true ID at a given valve size as highlighted in Bapat and colleagues.7 One would hypothesize that the transcatheter valves may yield better ratios than surgical valves, however the data of this study shows that this is not necessarily applicable.
Downstream Flow Characteristics and Blood Damage Relationship
With respect to flow characteristics, each valve displays a unique flow pattern. Although diseased heart valves have been replaced by various prostheses for more than 6 decades, thromboembolic complications and blood damage have always been challenges.4,12,28,29 Subsequent generations of heart valves have sought to minimize these complications. Because valve thrombosis and blood damage are closely related to blood flow characteristics downstream of the implanted valves, and because once the clotting process is triggered (eg, by blood contact with the foreign surfaces such as a prosthetic valve), thrombosis is most likely to occur in low-flow regions characterized by longer particle/cell residence times or at bifurcations,30,31 it is therefore important to characterize these flow characteristics among common commercially available valves. Thresholds for RSS (≥100 Pa6) and instantaneous VSS (≥10 Pa22) have been proposed, above which likelihood for platelet activation may occur.6,20,22
With the ball-and-cage valve, the stagnant and reverse flow at the center downstream of the ball and cage valve is associated with a high risk of thrombus formation.5 This design and resulting hemodynamics confer relatively elevated levels of RSS and VSS and a greater incidence of thrombosis compared with other mechanical valves has been observed.32,33 Bileaflet mechanical valves, specifically the SJM, are still widely used in non-Western continents.34 While SJM is characterized by one of the lowest ranges of RSS, it has an elevated VSS range.
Bioprosthetic valves were introduced as an anticoagulation-free alternative for mechanical valves. The design of the bioprostheses and the nature of their leaflets influence valve function and hemodynamics, as well as blood damage level. Hancock II valve (23 mm) shows a greater magnitude range of VSS and RSS compared with Trifecta of the same size. The y component of the velocity shows a high level of fluctuations with Hancock II (22.6% of the magnitude vs 8.3% with the Trifecta). Various studies35,36 reported a greater incidence of clinical thrombosis obtained with stented porcine leaflet valves compared with stented pericardial valves. In a study by Abdel-Wahab and colleagues,35 of 23 patients with leaflet thrombosis, 14 had stented porcine valves whereas 6 had stented pericardial valves. In another study by Brown and colleagues,36 the incidence of developing thrombus with porcine valves was 0.55% compared with 0% incidence with stented pericardial valves. In particular, there was a greater rate of thrombosis with Hancock II compared with Trifecta valves. Moreover, the Hancock II valve may have a characteristic flutter of the porcine leaflets that is more significant compared with pericardial ones that may induce more unsteadiness and enhances the resulting turbulence downstream. Various studies highlighted that bovine pericardium valves can have flutter mean frequencies and amplitudes that are lower than porcine leaflets.37,38
With TAVs, thrombus is still clinically observed and can be of major consequence.12,13 This in vitro study shows that the Evolut and SAPIEN 3 valves have the lowest instantaneous VSS ranges but not necessarily the lowest RSS ranges. Studies have demonstrated that crimping the valves, whether balloon- or self-expandable, may lead to traumatic leaflet injury that could predispose to thrombus formation.14,39 In addition, and as previously explained, the nature of the leaflets influences the resulting hemodynamics and turbulence characteristics and may underlie differences in blood damage. Several studies have highlighted that the flutter of leaflets was more pronounced with the Evolut27,40 compared with the SAPIEN.41 Whether this leads to earlier structural degeneration remains to be investigated.
Clinical Correlation
Comparison With Clinical Echocardiographic Data
In a publication by Powell and colleagues,42 a patient with a Starr–Edwards ball-and-cage valve was assessed. The velocity was found to be 3.5 m/s and the pressure gradient 18 mm Hg. In an in vivo study43 in whom 52 patients had 23 mm SJM mechanical valves (similar to the size adopted in this study), the average gradients were 14 ± 5 mm Hg. Peak velocities reached 2.5 ± 0.4 m/s, which were close to those obtained in this study (2.0 m/s). In another in vivo study44 in which 10 patients were implanted with 23 mm SJM, the transvalvular flow velocities were 2.38 ± 0.4 m/s postoperatively, which also compared well with our results. In a study involving 53 patients who were implanted with 23-mm Trifecta valves,45 the mean systolic pressure gradients were 6.9 ± 2.3 mm Hg, which were comparable with the ones obtained in this study. The mean EOA was 2.3 ± 0.5 cm2, which was greater than the one found in our study. In another study46 in which patients with 23-mm Trifecta were studied, the mean gradients were 11 mm Hg, which is greater than the one obtained in this study. In a study by Borger and colleagues, in which 57 patients with implanted Hancock II valves were studied, the mean EOA was found to be 1.2 cm2 with 23 mm valve size. The EOA obtained in this study was found to be 1.05 cm2.47 In another clinical study, 23 mm Hancock II bioprostheses yielded an average pressure gradient of 15.4 mm Hg. The value obtained in this study is 20.2 mm Hg.48 With the TAVs, a study comparing the clinical hemodynamic outcomes of Edwards SAPIEN and Evolut showed that the mean gradients were 13.2 ± 4.7 mm Hg and 7.7 ± 3.9 mm Hg, respectively. The value compared well with the gradient obtained in this study with the Evolut; however, this study shows a lower average gradient for the SAPIEN.49 In another clinical study, the average pressure gradient obtained with 23 mm SAPIEN 3 was found to be 9.7 ± 7.5 mm Hg, which is a close value to the one obtained in this study.50
Comparison With 4D Flow Data
A study by Oechtering and colleagues51 used 4D flow to check for the hemodynamics of several surgical valves, of which a Trifecta 21. The velocity obtained there was ∼1.5 m/s and the chamber used was made of silicone with larger dimensions than the ones we used for this experiment. However, the peak velocity magnitude is close to the one obtained in this study. In a case study by Johnson and colleagues,52 where a 23-mm ON-X mechanical valve was used, the velocity reached around 3 m/s. In this study, the velocity obtained with SJM was around 2 m/s.
Relationship With Thromboembolism Rate
The rate of thromboembolism with the Hancock II valve was found to be 1.20%/year based on a study by David and colleagues.53 For SJM, it was estimated that the incidence of thromboembolic events was 0.75 per 100 patient-years as per Hering and colleagues54 based on 2024 patients. Based on the results from the Surgical Replacement and Transcatheter Aortic Valve Implantation (SURTAVI) trial, the percentage of stroke events after TAVR was found to be 4.1% (±0.7). Within 1 year, these percentages increased.55, 56, 57 In a study of 178 patients with Trifecta, it was observed that complications in less than 6 months included 1 thromboembolic event, 1 major bleeding, and 3 endocarditis incidences. After 6 months, 2 thromboembolic events and 2 endocarditis were registered.58 Thromboembolism was detected and documented with all these valves. The turbulent stresses also show elevated levels correlating with blood damage, which may have consequences on thromboembolic events for each of these valve types.
Relationship With Durability Data
The Hancock II was found in this study to have the highest pressure gradient and lowest EOA compared to the other valves of the same size (Trifecta and SJM). The values obtained were close to those in vivo. The elevated pressure gradient and small EOA correlate with elevated turbulence level. Several clinical studies examining patients with Hancock II implants verified that the Hancock II in patients <60 years of age is associated with excellent durability during the first decade, however, it is also associated with increased structural valve degeneration during the second decade.53,59
Limitations
In this study, 6 valves of different sizes were studied. There are a lot of other valves that exist that haven't been included in this study, so the overall picture is limited to the valves included in the present study. The analysis was also performed in a rigid idealized aortic chamber model. The PIV experiments were 2-dimensional experiments. Despite that, important information about the flow behavior with different valves was obtained. While the current study sought to assess the level of total shear stress (turbulent and viscous) that occurs in a dynamic simulator in the presence of these 6 valves, it did not account for the exposure time that platelets require to start the platelet-activation process. We also acknowledge the limitations associated with correlating valve performance in clinical studies with those seen in in vitro studies.
Conclusions
In this study, the hemodynamic and flow characteristics of 6 surgical and transcatheter valves were assessed in vitro. The results of this study sheds light on the advancements in the design of AV prostheses over the past 60 years. While the challenges of blood damage still plague surgical and transcatheter valve designs as summarized in Figure 8, future iterations targeting these specific issues is critical to improving patient care. A video (Video 7) summarizing the message and importance of the study is provided.
Figure 8.

The evolution in aortic valve designs did not necessarily improve hemodynamic performance or downstream turbulence. SJM, St Jude Medical; EOA, effective orifice area.
Conflict of Interest Statement
Dr Dasi reports having patent applications filed on novel polymeric valves, vortex generators, and superhydrophobic/omniphobic surfaces. Dr Crestanello reports having grants from Medtronic, Boston Scientific, and St Jude in addition to being part of the Medtronic advisory board. Dr Thourani reports to research or an advisor for Abbott Vascular, Boston Scientific, Edwards Lifesciences, Gore Vascular, JenaValve, and Medtronic Corporation. Drs Hatoum and Dasi report having filed patent applications on computational predictive modeling of thrombosis in heart valves and on a Novel Implantable Vascular Shunt with Real-Time Precise Flow Control. All other authors reported no conflicts of interest.
The Journal policy requires editors and reviewers to disclose conflicts of interest and to decline handling or reviewing manuscripts for which they may have a conflict of interest. The editors and reviewers of this article have no conflicts of interest.
Footnotes
The research done was partly supported by National Institutes of Health (NIH), United States under Award Number R01HL119824.
Appendix 1
Table E1.
Statistical pairwise comparison of the pressure gradient measurements among each pair of valves
| Valve 1 | Valve 2 | P value |
|---|---|---|
| Hancock II | SJM | <.0001 |
| Hancock II | Evolut | <.0001 |
| Hancock II | Ball and cage | <.0001 |
| Hancock II | Trifecta | <.0001 |
| Hancock II | SAPIEN 3 | <.0001 |
| SAPIEN 3 | SJM | <.0001 |
| Trifecta | SJM | <.0001 |
| Ball and cage | SJM | <.0001 |
| Evolut | SJM | <.0001 |
| SAPIEN 3 | Evolut | <.0001 |
| SAPIEN 3 | Ball and cage | <.0001 |
| SAPIEN 3 | Trifecta | <.0001 |
| Trifecta | Evolut | .0559 |
| Trifecta | Evolut | .1748 |
| Trifecta | Ball and cage | .2994 |
| Ball and cage | Evolut | .9998 |
SJM, St Jude Medical.
Table E2.
Statistical pairwise comparison of the effective orifice area measurements among each pair of valves
| Valve 1 | Valve 2 | P value |
|---|---|---|
| Hancock II | SJM | <.0001 |
| Hancock II | Evolut | <.0001 |
| Hancock II | Ball and cage | <.0001 |
| Hancock II | Trifecta | <.0001 |
| Hancock II | SAPIEN 3 | <.0001 |
| SAPIEN 3 | SJM | <.0001 |
| Trifecta | SJM | <.0001 |
| Ball and cage | SJM | <.0001 |
| Evolut | SJM | <.0001 |
| SAPIEN 3 | Evolut | <.0001 |
| SAPIEN 3 | Ball and cage | <.0001 |
| SAPIEN 3 | Trifecta | <.0001 |
| Trifecta | Evolut | <.0001 |
| Trifecta | Evolut | <.0001 |
| Trifecta | Ball and cage | <.0001 |
| Ball and cage | Evolut | <.0001 |
SJM, St Jude Medical.
Supplementary Data
Ensemble averaged velocity vectors and vorticity contours for the ball and cage surgical valve. Video available at: https://www.jtcvs.org/article/S2666-2736(22)00029-8/fulltext.
Ensemble averaged velocity vectors and vorticity contours for the Hancock II surgical valve. Video available at: https://www.jtcvs.org/article/S2666-2736(22)00029-8/fulltext.
Ensemble averaged velocity vectors and vorticity contours for the Trifecta surgical valve. Video available at: https://www.jtcvs.org/article/S2666-2736(22)00029-8/fulltext.
Ensemble averaged velocity vectors and vorticity contours for the SJM surgical valve. Video available at: https://www.jtcvs.org/article/S2666-2736(22)00029-8/fulltext.
Ensemble averaged velocity vectors and vorticity contours for the Evolut transcatheter valve. Video available at: https://www.jtcvs.org/article/S2666-2736(22)00029-8/fulltext.
Ensemble averaged velocity vectors and vorticity contours for the SAPIEN 3 transcatheter valve. Video available at: https://www.jtcvs.org/article/S2666-2736(22)00029-8/fulltext.
Video summarizing the message and importance of the study. Video available at: https://www.jtcvs.org/article/S2666-2736(22)00029-8/fulltext.
References
- 1.Pibarot P., Dumesnil J.G. Prosthetic heart valves: selection of the optimal prosthesis and long-term management. Circulation. 2009;119:1034–1048. doi: 10.1161/CIRCULATIONAHA.108.778886. [DOI] [PubMed] [Google Scholar]
- 2.Kontos G.J., Jr., Schaff H.V. Thrombotic occlusion of a prosthetic heart valve: diagnosis and management. Mayo Clin Proc. 1985;60:118–122. doi: 10.1016/s0025-6196(12)60297-3. [DOI] [PubMed] [Google Scholar]
- 3.Morse D., Steiner R.M., Fernandez J. Springer Science & Business Media; 2012. Guide to Prosthetic Cardiac Valves. [Google Scholar]
- 4.Chandran K., Khalighi B., Chen C.-J. Experimental study of physiological pulsatile flow past valve prostheses in a model of human aorta—I. Caged ball valves. J Biomech. 1985;18:763–772. doi: 10.1016/0021-9290(85)90051-x. [DOI] [PubMed] [Google Scholar]
- 5.Yoganathan A.P., He Z., Casey Jones S. Fluid mechanics of heart valves. J Annu Rev Biomed Eng. 2004;6:331–362. doi: 10.1146/annurev.bioeng.6.040803.140111. [DOI] [PubMed] [Google Scholar]
- 6.Dasi L.P., Simon H.A., Sucosky P., Yoganathan A.P. Fluid mechanics of artificial heart valves. J Clin Exp Pharmacol Physiol. 2009;36:225–237. doi: 10.1111/j.1440-1681.2008.05099.x. [DOI] [PMC free article] [PubMed] [Google Scholar]
- 7.Bapat V.N., Attia R., Thomas M. Effect of valve design on the stent internal diameter of a bioprosthetic valve: a concept of true internal diameter and its implications for the valve-in-valve procedure. JACC Cardiovasc Interv. 2014;7:115–127. doi: 10.1016/j.jcin.2013.10.012. [DOI] [PubMed] [Google Scholar]
- 8.Capodanno D., Petronio A.S., Prendergast B., Eltchaninoff H., Vahanian A., Modine T., et al. Standardized definitions of structural deterioration and valve failure in assessing long-term durability of transcatheter and surgical aortic bioprosthetic valves: a consensus statement from the European Association of Percutaneous Cardiovascular Interventions (EAPCI) endorsed by the European Society of Cardiology (ESC) and the European Association for Cardio-Thoracic Surgery (EACTS) J Eur Heart J. 2017;38:3382–3390. doi: 10.1093/eurheartj/ehx303. [DOI] [PubMed] [Google Scholar]
- 9.Rodriguez-Gabella T., Voisine P., Puri R., Pibarot P., Rodés-Cabau J. Aortic bioprosthetic valve durability: incidence, mechanisms, predictors, and management of surgical and transcatheter valve degeneration. J Am Coll Cardiol. 2017;70:1013–1028. doi: 10.1016/j.jacc.2017.07.715. [DOI] [PubMed] [Google Scholar]
- 10.Webb J.G., Altwegg L., Boone R.H., Cheung A., Ye J., Lichtenstein S., et al. Transcatheter aortic valve implantation. Circulation. 2009;119:3009–3016. doi: 10.1161/CIRCULATIONAHA.108.837807. [DOI] [PubMed] [Google Scholar]
- 11.Gurvitch R., Wood D., Tay E., Leipsic J., Ye J., Lichtenstein S., et al. Transcatheter aortic valve implantation: durability of clinical and hemodynamic outcomes beyond 3 years in a large patient cohort. Circulation. 2010;122:1319–1327. doi: 10.1161/CIRCULATIONAHA.110.948877. [DOI] [PubMed] [Google Scholar]
- 12.Chakravarty T., Søndergaard L., Friedman J., De Backer O., Berman D., Kofoed K.F., et al. Subclinical leaflet thrombosis in surgical and transcatheter bioprosthetic aortic valves: an observational study. Lancet. 2017;389:2383–2392. doi: 10.1016/S0140-6736(17)30757-2. [DOI] [PubMed] [Google Scholar]
- 13.Makkar R.R., Fontana G., Jilaihawi H., Chakravarty T., Kofoed K.F., De Backer O., et al. Possible subclinical leaflet thrombosis in bioprosthetic aortic valves. N Engl J Med. 2015;373:2015–2024. doi: 10.1056/NEJMoa1509233. [DOI] [PubMed] [Google Scholar]
- 14.Dasi L.P., Hatoum H., Kheradvar A., Zareian R., Alavi S.H., Sun W., et al. On the mechanics of transcatheter aortic valve replacement. Ann Biomed Eng. 2017;45:310–331. doi: 10.1007/s10439-016-1759-3. [DOI] [PMC free article] [PubMed] [Google Scholar]
- 15.Hatoum H., Maureira P., Lilly S., Dasi L.P. Impact of leaflet laceration on transcatheter aortic valve-in-valve washout: BASILICA to solve neosinus and sinus stasis. JACC Cardiovasc Interv. 2019;12:1229–1237. doi: 10.1016/j.jcin.2019.04.013. [DOI] [PMC free article] [PubMed] [Google Scholar]
- 16.Hatoum H., Dasi L.P. Reduction of pressure gradient and turbulence using vortex generators in prosthetic heart valves. Ann Biomed Eng. 2019;47:85–96. doi: 10.1007/s10439-018-02128-6. [DOI] [PMC free article] [PubMed] [Google Scholar]
- 17.Hatoum H., Girault E., Heim F., Dasi L.P. In-vitro characterization of self-expandable textile transcatheter aortic valves. J Mech Behav Biomed Mater. 2020;103:103559. doi: 10.1016/j.jmbbm.2019.103559. [DOI] [PMC free article] [PubMed] [Google Scholar]
- 18.Hatoum H., Lilly S., Maureira P., Crestanello J., Dasi L.P. The hemodynamics of transcatheter aortic valves in transcatheter aortic valves. J Thorac Cardiovasc Surg. 2021;161:565–576.e2. doi: 10.1016/j.jtcvs.2019.09.174. [DOI] [PMC free article] [PubMed] [Google Scholar]
- 19.Hatoum H., Gooden S., Heitkemper M., Blum K.M., Zakko J., Bocks M., et al. Fetal transcatheter trileaflet heart valve hemodynamics: implications of scaling on valve mechanics and turbulence. Ann Biomed Eng. 2020;48:1683–1693. doi: 10.1007/s10439-020-02475-3. [DOI] [PMC free article] [PubMed] [Google Scholar]
- 20.Giersiepen M., Wurzinger L., Opitz R., Reul H. Estimation of shear stress-related blood damage in heart valve prostheses—in vitro comparison of 25 aortic valves. Int J Artif Organs. 1990;13:300–306. [PubMed] [Google Scholar]
- 21.Nygaard H., Giersiepen M., Hasenkam J., Reul H., Paulsen P., Rovsing P., et al. Two-dimensional color-mapping of turbulent shear stress distribution downstream of two aortic bioprosthetic valves in vitro. J Biomech. 1992;25:437–440. doi: 10.1016/0021-9290(92)90262-y. [DOI] [PubMed] [Google Scholar]
- 22.Ge L., Dasi L.P., Sotiropoulos F., Yoganathan A.P. Characterization of hemodynamic forces induced by mechanical heart valves: Reynolds vs. viscous stresses. Ann Biomed Eng. 2008;36:276–297. doi: 10.1007/s10439-007-9411-x. [DOI] [PubMed] [Google Scholar]
- 23.Davidson P.A. Oxford University Press; 2015. Turbulence: An Introduction for Scientists and Engineers. [Google Scholar]
- 24.Fazle H.A. In: Cardiovascular Flow Dynamics. Hwang N.H.C., Norman N.A., editors. University Park Press; 1977. Mechanics of pulsatile flows of relevance to the cardiovascular system. [Google Scholar]
- 25.Hatoum H., Maureira P., Dasi L.P. A turbulence in vitro assessment of On-X and St Jude Medical prostheses. J Thorac Cardiovasc Surg. 2020;159:88–97. doi: 10.1016/j.jtcvs.2019.02.046. [DOI] [PMC free article] [PubMed] [Google Scholar]
- 26.Peacock J.A. An in vitro study of the onset of turbulence in the sinus of Valsalva. Circ Res. 1990;67:448–460. doi: 10.1161/01.res.67.2.448. [DOI] [PubMed] [Google Scholar]
- 27.Hatoum H., Dollery J., Lilly S.M., Crestanello J.A., Dasi L.P. Effect of severe bioprosthetic valve tissue ingrowth and inflow calcification on valve-in-valve performance. J Biomech. 2018;74:171–179. doi: 10.1016/j.jbiomech.2018.04.039. [DOI] [PMC free article] [PubMed] [Google Scholar]
- 28.Edmunds L.H., Jr. Thromboembolic complications of current cardiac valvular prostheses. Ann Thorac Surg. 1982;34:96–106. doi: 10.1016/s0003-4975(10)60862-4. [DOI] [PubMed] [Google Scholar]
- 29.Johnson S., Stroud M.R., Kratz J.M., Bradley S.M., Crawford F.A., Jr., Ikonomidis J.S. Thirty-year experience with a bileaflet mechanical valve prosthesis. J Thorac Cardiovasc Surg. 2019;157:213–222. doi: 10.1016/j.jtcvs.2018.09.002. [DOI] [PubMed] [Google Scholar]
- 30.Gorbet M.B., Sefton M.V. Biomaterial-associated thrombosis: roles of coagulation factors, complement, platelets and leukocytes. Biomaterials. 2004;25:5681–5703. doi: 10.1016/j.biomaterials.2004.01.023. [DOI] [PubMed] [Google Scholar]
- 31.Rayz V., Boussel L., Ge L., Leach J., Martin A., Lawton M., et al. Flow residence time and regions of intraluminal thrombus deposition in intracranial aneurysms. Ann Biomed Eng. 2010;38:3058–3069. doi: 10.1007/s10439-010-0065-8. [DOI] [PMC free article] [PubMed] [Google Scholar]
- 32.Sun J.C., Davidson M.J., Lamy A., Eikelboom J.W. Antithrombotic management of patients with prosthetic heart valves: current evidence and future trends. Lancet. 2009;374:565–576. doi: 10.1016/S0140-6736(09)60780-7. [DOI] [PubMed] [Google Scholar]
- 33.Lim W.Y., Lloyd G., Bhattacharyya S. Mechanical and surgical bioprosthetic valve thrombosis. J Heart. 2017;103:1934–1941. doi: 10.1136/heartjnl-2017-311856. [DOI] [PubMed] [Google Scholar]
- 34.Chang B.-C., Lim S.H., Kim D.K., Seo J.Y., Cho S.Y., Shim W.H., et al. Long-term results with St. Jude Medical and CarboMedics prosthetic heart valves. J Heart Valve Dis. 2001;10:185–194. discussion 95. [PubMed] [Google Scholar]
- 35.Abdel-Wahab M., Simonato M., Latib A., Goleski P.J., Allali A., Kaur J., et al. Clinical valve thrombosis after transcatheter aortic valve-in-valve implantation. Circ Cardiovasc Interv. 2018;11:e006730. doi: 10.1161/CIRCINTERVENTIONS.118.006730. [DOI] [PubMed] [Google Scholar]
- 36.Brown M.L., Park S.J., Sundt T.M., Schaff H.V. Early thrombosis risk in patients with biologic valves in the aortic position. J Thorac Cardiovasc Surg. 2012;144:108–111. doi: 10.1016/j.jtcvs.2011.05.032. [DOI] [PubMed] [Google Scholar]
- 37.Rainer W.G., Christopher R.A., Sadler T.R., Jr., Hilgenberg A.D. Dynamic behavior of prosthetic aortic tissue valves as viewed by high-speed cinematography. Ann Thorac Surg. 1979;28:274–280. doi: 10.1016/s0003-4975(10)63120-7. [DOI] [PubMed] [Google Scholar]
- 38.Avelar AHdF., Canestri J.A., Bim C., Silva M.G., Huebner R., Pinotti M. Quantification and analysis of leaflet flutter on biological prosthetic cardiac valves. J Artif Organs. 2017;41:835–844. doi: 10.1111/aor.12856. [DOI] [PubMed] [Google Scholar]
- 39.Amahzoune B., Bruneval P., Allam B., Lafont A., Fabiani J.-N., Zegdi R. Traumatic leaflet injury during the use of percutaneous valves: a comparative study of balloon-and self-expandable valved stents. Eur J Cardiothorac Surg. 2013;43:488–493. doi: 10.1093/ejcts/ezs359. [DOI] [PubMed] [Google Scholar]
- 40.Hatoum H., Dollery J., Lilly S.M., Crestanello J.A., Dasi L.P. Implantation depth and rotational orientation effect on valve-in-valve hemodynamics and sinus flow. Ann Thorac Surg. 2018;106:70–78. doi: 10.1016/j.athoracsur.2018.01.070. [DOI] [PMC free article] [PubMed] [Google Scholar]
- 41.Hatoum H., Moore B.L., Dasi L.P. On the significance of systolic flow waveform on aortic valve energy loss. Ann Biomed Eng. 2018;46:2102–2111. doi: 10.1007/s10439-018-2102-y. [DOI] [PMC free article] [PubMed] [Google Scholar]
- 42.Powell S., Choxi R., Gunda S., Jovin I.S. A 43-year-old functional Starr-Edwards ball and cage mechanical aortic valve. Gen Thorac Cardiovasc Surg. 2021;69:97–99. doi: 10.1007/s11748-020-01383-6. [DOI] [PubMed] [Google Scholar]
- 43.Perin E.C., Jin B.-S., de Castro C.M., Ferguson J.J., Hall R.J. Doppler echocardiography in 180 normally functioning St. Jude Medical aortic valve prostheses: early and late postoperative assessments. Chest. 1991;100:988–990. doi: 10.1378/chest.100.4.988. [DOI] [PubMed] [Google Scholar]
- 44.Walther T., Falk V., Tigges R., Krüger M., Langebartels G., Diegeler A., et al. Comparison of On-X and SJM HP bileaflet aortic valves. J Heart Valve Dis. 2000;9:403–407. [PubMed] [Google Scholar]
- 45.Permanyer E., Estigarribia A.-J., Ysasi A., Herrero E., Semper O., Llorens R. St. Jude Medical Trifecta™ aortic valve perioperative performance in 200 patients. Int Cardiovasc Thorac Surg. 2013;17:669–672. doi: 10.1093/icvts/ivt270. [DOI] [PMC free article] [PubMed] [Google Scholar]
- 46.Dell'Aquila A.M., Schlarb D., Schneider S.R., Sindermann J.R., Hoffmeier A., Kaleschke G., et al. Clinical and echocardiographic outcomes after implantation of the Trifecta aortic bioprosthesis: an initial single-centre experience. Interact Cardiovasc Thorac Surg. 2013;16:112–115. doi: 10.1093/icvts/ivs460. [DOI] [PMC free article] [PubMed] [Google Scholar]
- 47.Borger M.A., Nette A.F., Maganti M., Feindel C.M. Carpentier-Edwards Perimount Magna valve versus Medtronic Hancock II: a matched hemodynamic comparison. Ann Thorac Surg. 2007;83:2054–2058. doi: 10.1016/j.athoracsur.2007.02.062. [DOI] [PubMed] [Google Scholar]
- 48.Chan V., Kulik A., Tran A., Hendry P., Masters R., Mesana T.G., et al. Long-term clinical and hemodynamic performance of the Hancock II versus the Perimount aortic bioprostheses. Circulation. 2010;122(11_suppl_1):S10–S16. doi: 10.1161/CIRCULATIONAHA.109.928085. [DOI] [PubMed] [Google Scholar]
- 49.Ring M., Jin R., Parrish R., Curtis B., Forrester M., Reynolds B., et al. Comparison of echocardiographic outcomes following transcatheter aortic valve replacement with Edwards s3 23 mm versus Medtronic Evolut 26 mm valves. J Am Coll Cardiol. 2020;75(11_suppl_1):1266. [Google Scholar]
- 50.Costa G., Buccheri S., Barbanti M., Picci A., Todaro D., Di Simone E., et al. Outcomes of three different new generation transcatheter aortic valve prostheses. Catheter Cardiovasc Interv. 2020;95:398–407. doi: 10.1002/ccd.28524. [DOI] [PubMed] [Google Scholar]
- 51.Oechtering T.H., Sieren M., Schubert K., Schaller T., Scharfschwerdt M., Panagiotopoulos A., et al. In vitro 4D flow MRI evaluation of aortic valve replacements reveals disturbed flow distal to biological but not to mechanical valves. J Card Surg. 2019;34:1452–1457. doi: 10.1111/jocs.14253. [DOI] [PubMed] [Google Scholar]
- 52.Johnson E.M., Etemadi M., Malaisrie S.C., McCarthy P.M., Markl M., Barker A.J. Seismocardiography and 4D flow MRI reveal impact of aortic valve replacement on chest acceleration and aortic hemodynamics. J Card Surg. 2020;35:232–235. doi: 10.1111/jocs.14289. [DOI] [PMC free article] [PubMed] [Google Scholar]
- 53.David T.E., Armstrong S., Maganti M. Hancock II bioprosthesis for aortic valve replacement: the gold standard of bioprosthetic valves durability? Ann Thorac Surg. 2010;90:775–781. doi: 10.1016/j.athoracsur.2010.05.034. [DOI] [PubMed] [Google Scholar]
- 54.Hering D., Piper C., Bergemann R., Hillenbach C., Dahm M., Huth C., et al. Thromboembolic and bleeding complications following St. Jude Medical valve replacement: results of the German experience with low-intensity anticoagulation study. Chest. 2005;127:53–59. doi: 10.1378/chest.127.1.53. [DOI] [PubMed] [Google Scholar]
- 55.Ranasinghe M.P., Peter K., McFadyen J.D. Thromboembolic and bleeding complications in transcatheter aortic valve implantation: insights on mechanisms, prophylaxis and therapy. J Clin Med. 2019;8:280. doi: 10.3390/jcm8020280. [DOI] [PMC free article] [PubMed] [Google Scholar]
- 56.Adams D.H., Popma J.J., Reardon M.J., Yakubov S.J., Coselli J.S., Deeb G.M., et al. Transcatheter aortic-valve replacement with a self-expanding prosthesis. N Engl J Med. 2014;370:1790–1798. doi: 10.1056/NEJMoa1400590. [DOI] [PubMed] [Google Scholar]
- 57.Reardon M.J., Adams D.H., Kleiman N.S., Yakubov S.J., Coselli J.S., Deeb G.M., et al. 2-year outcomes in patients undergoing surgical or self-expanding transcatheter aortic valve replacement. J Am Coll Cardiol. 2015;66:113–121. doi: 10.1016/j.jacc.2015.05.017. [DOI] [PubMed] [Google Scholar]
- 58.Mariscalco G., Mariani S., Bichi S., Biondi A., Blasio A., Borsani P., et al. St. Jude Medical Trifecta aortic valve: results from a prospective regional multicentre registry. J Cardiothorac Surg. 2015;10:169. doi: 10.1186/s13019-015-0379-6. [DOI] [PMC free article] [PubMed] [Google Scholar]
- 59.Une D., Ruel M., David T.E. Twenty-year durability of the aortic Hancock II bioprosthesis in young patients: is it durable enough? Eur J Cardiothorac Surg. 2014;46:825–830. doi: 10.1093/ejcts/ezu014. [DOI] [PubMed] [Google Scholar]
Associated Data
This section collects any data citations, data availability statements, or supplementary materials included in this article.
Supplementary Materials
Ensemble averaged velocity vectors and vorticity contours for the ball and cage surgical valve. Video available at: https://www.jtcvs.org/article/S2666-2736(22)00029-8/fulltext.
Ensemble averaged velocity vectors and vorticity contours for the Hancock II surgical valve. Video available at: https://www.jtcvs.org/article/S2666-2736(22)00029-8/fulltext.
Ensemble averaged velocity vectors and vorticity contours for the Trifecta surgical valve. Video available at: https://www.jtcvs.org/article/S2666-2736(22)00029-8/fulltext.
Ensemble averaged velocity vectors and vorticity contours for the SJM surgical valve. Video available at: https://www.jtcvs.org/article/S2666-2736(22)00029-8/fulltext.
Ensemble averaged velocity vectors and vorticity contours for the Evolut transcatheter valve. Video available at: https://www.jtcvs.org/article/S2666-2736(22)00029-8/fulltext.
Ensemble averaged velocity vectors and vorticity contours for the SAPIEN 3 transcatheter valve. Video available at: https://www.jtcvs.org/article/S2666-2736(22)00029-8/fulltext.
Video summarizing the message and importance of the study. Video available at: https://www.jtcvs.org/article/S2666-2736(22)00029-8/fulltext.