

Abstract
Background
Eumycetoma is a neglected tropical disease. It is a chronic inflammatory subcutaneous infection characterised by painless swellings which produce grains. It is currently treated with a combination of itraconazole and surgery. In an ongoing clinical study, the efficacy of fosravuconazole, the prodrug of ravuconazole, is being investigated. For both itraconazole and ravuconazole, no clinical breakpoints or epidemiological cut‐off values (ECV) to guide treatment are currently available.
Objective
To determine tentative ECVs for itraconazole and ravuconazole in Madurella mycetomatis, the main causative agent of eumycetoma.
Materials and Methods
Minimal inhibitory concentrations (MICs) for itraconazole and ravuconazole were determined in 131 genetically diverse clinical M. mycetomatis isolates with the modified CLSI M38 broth microdilution method. The MIC distributions were established and used to determine ECVs with the ECOFFinder software. CYP51A sequences were sequenced to determine whether mutations occurred in this azole target gene, and comparisons were made between the different CYP51A variants and the MIC distributions.
Results
The MICs ranged from 0.008 to 1 mg/L for itraconazole and from 0.002 to 0.125 mg/L for ravuconazole. The M. mycetomatis ECV for itraconazole was 1 mg/L and for ravuconazole 0.064 mg/L. In the wild‐type population, two CYP51A variants were found for M. mycetomatis, which differed in one amino acid at position 499 (S499G). The MIC distributions for itraconazole and ravuconazole were similar between the two variants. No mutations linked to decreased susceptibility were found.
Conclusion
The proposed M. mycetomatis ECV for itraconazole is 1 mg/L and for ravuconazole 0.064 mg/L.
Keywords: azoles, CYP51A, epidemiological cut‐off values, eumycetoma, Madurella mycetomatis, mycetoma
1. INTRODUCTION
Mycetoma is a chronic granulomatous subcutaneous inflammatory disease characterised by massive tissue destruction, deformities and disabilities and can be fatal if not treated appropriately. 1 The clinical triad of painless subcutaneous masses, multiple sinuses and purulent and sero‐purulent discharge that contain grains is pathognomic of mycetoma. The causative agents are embedded within these grains. 2 Mycetoma can be caused by bacteria and fungi, with the filamentous fungus Madurella mycetomatis being by far the most common causative agent, reported in 42.9% (7076/16527) of all cases. 3
Fungal mycetoma is treated with a combination of antifungal therapy and surgery. The most common treatment regimen consists of 400 mg of itraconazole per day for six months, followed by surgical removal of the lesion and then 400 mg of itraconazole per day for six months. 4 Due to the limited efficacy and side effects associated with itraconazole, a single‐centre, comparative, randomised, double‐blind trial was started in 2017 to determine the efficacy of fosravuconazole the prodrug of ravuconazole, combined with surgery in patients with M. mycetomatis eumycetoma in Sudan (https://clinicaltrials.gov/ct2/show/NCT03086226). 5
Although many mycetoma patients have been treated with itraconazole, the responses differ from patient to patient and range from complete cure (8%, 1 out of 13) to partial response (69%, 8 out of 13), stable disease (23%, 3 out of 13) and massive recurrence (8%, 1 out of 13). 6 At the moment, there are no predictors of patient outcome established for mycetoma, although they are available for more common fungal infections such as candidiasis 7 and aspergillosis. 8 The most important indicator is the clinical breakpoint, with which the minimal inhibitory concentration (MIC) of the patient isolate can be used to predict the therapeutic response. Clinical breakpoints are usually established using a combination of in vitro, in vivo and clinical data, including the distribution of MICs, pharmacokinetic and pharmacodynamic (PK/PD) data from animal models and clinical outcome data. 9 Although a reference method for in vitro susceptibility testing has been described for M. mycetomatis, there are no clinical breakpoints set by either the European Committee on Antimicrobial Susceptibility Testing (EUCAST) or the Clinical and Laboratory Standards Institute (CLSI). When clinical breakpoints are unavailable, the establishment of epidemiological cut‐off values (ECVs) can provide a means to detect isolates with elevated MICs against antimicrobial agents. For determination of ECVs, the normal distribution of MICs in a collection of wild‐type isolates is needed. Typically, wild‐type (WT) isolates follow a log‐normal distribution and the upper end of that distribution is defined as the epidemiological cut‐off value (ECV or ECOFF). 9 Isolates with an MIC above the ECV are considered to be non‐wild‐type (non‐WT) isolates and to have a reduced susceptibility to the agent under evaluation due to acquired mutational or other resistance mechanisms. 10 While ECVs do not predict the clinical success of therapy, these endpoints could identify the isolates at risk for resistance to the therapy given. 10
Over the years, ECVs have been established for many fungi, but so far, none have been established for M. mycetomatis. The main reason for this was that there were not enough isolates available to determine MICs. We, therefore, collected a large number of clinical M. mycetomatis isolates and used them to propose ECVs for M. mycetomatis for itraconazole and ravuconazole using our M. mycetomatis in vitro antifungal susceptibility assay based on the Clinical and Laboratory Standards Institute (CLSI) guideline M38 11 , 12 and to assess whether variations in the azole target gene CYP51A 13 , 14 are associated with elevated MICs.
2. MATERIALS AND METHODS
2.1. Isolates
A total of 131 M. mycetomatis isolates obtained between 1999 to 2021 were included in this study (supplemental data). The majority of these isolates were obtained from individual cases of mycetoma from Sudan (n = 126), Algeria (n = 1), India (n = 1), Mali (n = 1), Peru (n = 1) and Somalia (n = 1). DNA was extracted using the modified ZR Fungal/Bacterial DNA MicroPrep™ kit (Zymo Research) as previously described. 15 The identity of the isolates was established by amplifying and sequencing the internally transcribed (ITS) spacer region as previously described. 16 , 17 , 18 , 19 , 20 The genetic diversity was determined by using the MmySTR typing assay according to the previously published protocol. 20
2.2. Amplification and sequencing of the CYP51A gene
To sequence the M. mycetomatis CYP51A gene, the gene was amplified by three different PCR primer pairs, which were designed based on reference sequence (LCTW02000059.1) using Primer3 4.1.0 software. The first primer pair consisted of primers CYP51A‐2019_Fw1‐CTAGAGACCGGACGCCAAG, 75 bp upstream of the start codon and CYP51A‐2019_Rv1‐GCACGGTTAGCCAAGCTATT and resulted in a 645 bp PCR product, spanning nucleotides 1–573 of the CYP51 gene. The second primer pair consisted of primers CYP51A‐2019_Fw2‐CGTGTGCGGTGTTGAAGG and CYP51A‐2019_Rv2‐TTGGCGAGATCCTCGTACTT and resulted in a 680 bp PCR product, spanning nucleotides 520–1199 of the CYP51A gene. The third primer pair consisted of primers CYP51A‐2019_Fw3‐GAGGAGCTCTACCAGGAGCA and CYP51A‐2019_Rv3‐GTCCCATCTTTGGTCGTCAT, which was 29 bp downstream of the stop codon and resulted in a 633 bp PCR product, spanning nucleotides 1126–1726 of the CYP51A gene. Each amplification reaction consisted of 12.5 μl of FastStart Master mix (Roche Diagnostics), 0.5 μm forward primer, 0.5 μm reverse primers, 8 μl of H2O and 20 ng of genomic DNA in a 25 μl reaction volume. The 40 cycle PCR conditions were as follows: initial denaturation at 95°C for 1 min, 30 s of denaturation at 95°C, 30 s annealing at 60°C and final extension of 5 min at 72°C. The PCR products were visualised on 1% Sphaero Q (Sphaero Q), agarose gel electrophoresis. The PCR products were then cleaned with ExoSap‐IT express kit (Thermofisher) as suggested by the manufacturer. Following amplification, visualisation and cleaning of the PCR product, a sequence reaction was performed using the BigDye Terminator v3.1 Cycle Sequencing Ready Reaction kit (Applied Biosystems) according to the manufacturer's instructions. The 11 μl sequencing reaction consisted of 1 μl of cleaned PCR product, 0.1 μl primer (50 μm), 1.5 μl buffer 5x sequencing buffer, 1 μl BigDye mix and 7.4 μl water. The 35 cycles sequencing reaction included denaturation at 96°C for 10 s, annealing at 50°C for 5 s and extension at 60°C for 4 min. The sequencing products were purified with sodium acetate/alcohol precipitation and sequenced on the ABI 3130 Genetic Analyser capillary sequencer according to the manufacturer's instructions. The sequences obtained were analysed using the Chromas software (Technelysium Pty Ltd). Furthermore, the sequences were translated to a protein sequence and then compared to the reference CYP51A protein sequence for M. mycetomatis from the MM55 reference isolate.
2.3. Prediction of the crystal structure of the M. mycetomatis CYP51A protein
Since there is no exact crystal structure available for the M. mycetomatis CYP51A protein, the 3D structure for CYP51A was built using the Swiss Modelling Homology Software. 21 First, we identified a suitable template (Aspergillus fumigatus CYP51A), followed by sequence alignment and model assembly and refinement. We used HOPE to compare the model structure for both variants based on a homologous structure of CYP51A from A. fumigatus. This was done using the Yasara & WHAT IF Twinset as described. 22 Structural information was obtained using information from WHAT IF web services, the Uniprot database and Reprof software. 22
2.4. Antifungal susceptibility testing
Minimum inhibitory concentrations were determined independently in triplicate using our previously reported modified CLSI‐based 2,3‐bis(2‐methoxy‐4‐nitro‐5‐sulfophenyl)‐5‐[(phenylamino)carbonyl]‐2H‐tetrazolium hydroxide (XTT) assay. 11 For M. mycetomatis, we had to modify the third edition of the CLSI M38 Reference Method for Broth Dilution Antifungal Susceptibility Testing of Filamentous Fungi, slightly to be able to perform in vitro susceptibility testing on hyphal fragments as M. mycetomatis does not sporulate. In short, fungal isolates were grown for two weeks in Sabouraud dextrose agar and transferred to RMPI 1640 medium (Lonza) supplemented with L‐glutamine (0.3 g/L) and 20 mmol/L morpholinepropanesulphonic acid (MOPS), sonicated for 10 s at 10 microns (Soniprep) and grown for seven days at 35°C with 5% carbon dioxide. After seven days, the mycelia were harvested by centrifuging for 5 min at 2500 g (Rotanta 46R). The fungal suspension was homogenised by sonicating for 10 s at 10 microns, and a fungal hyphal suspension with a transmission ranging between 68% and 72% (Novaspec II, Pharmacia Biotech) was prepared. One hundred microliters of the fungal suspension was transferred to a round bottom 96‐well plate, followed by the addition of 1 μl of the corresponding antifungal agent. The plate was incubated for seven days at 35°C with 5% carbon dioxide. Itraconazole was obtained from Janssen Pharmaceutica and ravuconazole from Eisai (Eisai Co., Ltd). Stock solutions of these agents were prepared in dimethyl sulfoxide (DMSO). For each antifungal agent, a twofold series was tested. For itraconazole, the concentrations ranged from 0.008 to 4 mg/L and for ravuconazole from 0.002 to 1 mg/L. After incubating the fungal suspension with the antifungal agents for one week, 100 μl of XTT was added to each well and incubated at 37°C for 2 h and at room temperature for 3 h to facilitate endpoint reading. One hundred microliters of the suspension was transferred to a flat bottom plate, and the plate was read at 450 nm. The MIC was considered to be the concentration that inhibited 80% or more of the fungal growth.
2.5. Statistical analysis
To calculate the ECV, the 2020 updated version of ECOFF finder (https://www.eucast.org/fileadmin/src/media/PDFs/EUCAST_files/MIC_distributions/ECOFFinder_XL_2010_v2.1_web_version.xlsm) was used. This Microsoft Excel® worksheet uses the iterative statistical method as described by Turnidge and associates. 23 The calculated ECV comprised >97.5% of the statistically modelled population. The differences in susceptibility between CYP51A variants were determined by comparing median MICs using the Mann–Whitney test.
3. RESULTS
3.1. Epidemiological cut‐off values (ECVs) for ravuconazole and itraconazole
To determine the ECV for Madurella mycetomatis for itraconazole and ravuconazole, 131 unique patient samples were included. They were identified as M. mycetomatis by sequencing the ITS regions and were genetically diverse, as 60 different genotypes were observed among the 131 M. mycetomatis isolates included in this study (Figure 1). The isolates had an overall low MIC for itraconazole and ravuconazole, with the MIC ranging from 0.008 to 1 mg/L for itraconazole and from 0.002 to 0.125 mg/L for ravuconazole (Table 1). The median MIC of itraconazole was 0.064 mg/L and that of ravuconazole was 0.008 mg/L. The MIC90 was 0.25 mg/L for itraconazole and 0.032 mg/L for ravuconazole. As calculated by the ECOFF finder, the proposed ECV was 1 mg/L for itraconazole and 0.064 mg/L for ravuconazole.
FIGURE 1.
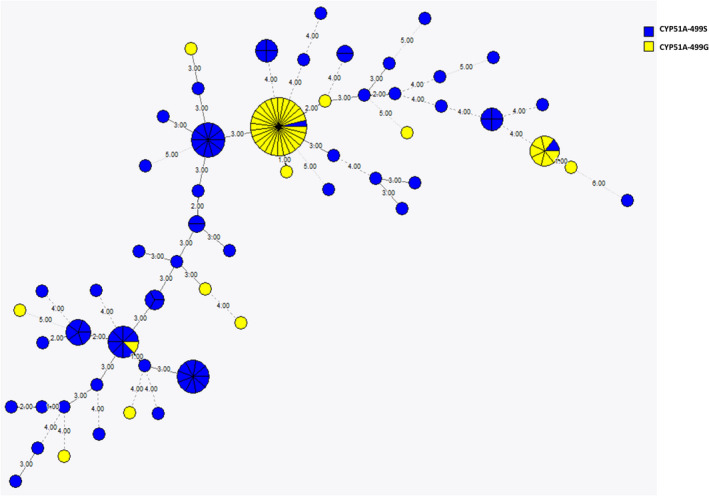
Minimum spanning tree showing 131 M. mycetomatis isolates obtained from unique patients. Each circle represents a genotype, and the size is directly proportional to the number of isolates within a genotype. The number and thickness of the lines between the circles are directly proportional to the differences in STR markers between genotypes. In total, 56 different genotypes are noted. With blue coloured circles indicate isolates which harbour the CYP51A‐499S variant. The yellow coloured circles indicate isolates which harbour the CYP51A‐499G genotype.
TABLE 1.
MIC distribution and ECVs of 131 M. mycetomatis isolates against itraconazole and ravuconazole
| No. of isolates tested | MIC50 (mg/L) | MIC90 (mg/L) | ECV 97.5% (mg/L) | No. of isolates with a MIC (mg/L) of | |||||||||||||||
|---|---|---|---|---|---|---|---|---|---|---|---|---|---|---|---|---|---|---|---|
| ≤0.002 | 0.004 | 0.008 | 0.016 | 0.032 | 0.064 | 0.125 | 0.25 | 0.5 | 1 | 2 | 4 | 8 | 16 | >16 | |||||
| Itraconazole | 131 | 0.064 | 0.25 | 1 | 0 | 0 | 13 | 19 | 27 | 24 | 21 | 16 | 10 | 1 | 0 | 0 | 0 | 0 | 0 |
| Ravuconazole | 131 | 0.008 | 0.032 | 0.064 | 26 | 21 | 33 | 29 | 16 | 4 | 2 | 0 | 0 | 0 | 0 | 0 | 0 | 0 | 0 |
3.2. Two CYP51A variants are present in the M. mycetomatis wild‐type (WT) population
To determine whether non‐WT M. mycetomatis isolates would harbour mutations in the CYP51 gene, the CYP51A gene of all isolates was sequenced. The M. mycetomatis CYP51A gene was 1726 bp and had two introns of 62 bp and 74 bp and 3 exons of 246, 198 and 1146 bp, as shown in Figure 2. Based on sequence comparison of the population, it was observed that, in total, five synonymous mutations were found in the population, as shown in Figure 3A. Four of the five mutations were within exons. Only C546A was located in an intron. Next to the synonymous mutations, a single nonsynonymous mutation was noted. This nonsynonymous mutation was found at nucleotide 1631, where either an A or G was present (Figure 3A). A serine was found at position 499 of the enzyme in 65% of the population, while in the remaining 35% of the population, a glycine was found (Figure 3B). The 499S genotype was found in 48 different genotypes and the 499G in 15 different genotypes. Small clusters of the 499G genotype were noted (Figure 1). In the non‐WT population, no additional nonsynonymous mutations were noted.
FIGURE 2.

Two CYP51A variants are available in the M. mycetomatis wild‐type (WT) population: The CYP51A (eburicol 14‐alpha‐demethylase) DNA sequence of Madurella mycetomatis. It is 1726 bp long and contains two introns of 62 and 74 bp, which are underlined and highlighted in yellow, with three exons of 246, 198 and 1146 bp. Based on sequence analysis, two variants of CYP51A are present in the population.
FIGURE 3.

Mutations in the M. mycetomatis wild‐type (WT) population: (A) There are five synonymous mutations in the population analysed (white bars) with one nonsynonymous mutation at position 1631 (dark‐grey bar). (B) Based on this mutation, sequence analysis reveals two variants of CYP51A present in the population; CYP51A‐499S, which is dominant in the population and CYP51A‐499G. Serine is present at position 499 in the CYP51A‐499S genotype, while glycine is present in the CYP51A‐499G genotype.
3.3. The CYP51A variants do not result in altered susceptibility towards azoles
In our CYP51A model, the enzyme is represented by the ribbons and the active azole site beside the haem structure is represented by ball‐and‐stick (Figure 4). Like the improved Aspergillus fumigatus CYP51A model, the M. mycetomatis CYP51A structure is accessible from the left cleft. Hence, based on the homology model of CYP51A, it was noted that amino acid 499 was not located in the predicted drug interaction site or binding pocket (the left cleft or the haem structure, respectively). To confirm that this variation did not influence the in vitro susceptibility of M. mycetomatis to the two azoles were tested, the MICs of the isolates with the CYP51A‐499S variant were compared to that of the CYP51A‐499G variant for both itraconazole and ravuconazole (Figure 4). The median MIC for itraconazole of the isolates with the CYP51‐499S variant was 0.064 mg/L (0.008 to mg/L), and that of the isolates with the CYP51‐499G variant was 0.032 mg/L (0.008–0.5 mg/L). The median MIC for ravuconazole was 0.008 mg/L for both the CYP51A‐499S variant (range 0.002–0.125 mg/L) and the CYP51A‐499G (range 0.002–0.125 mg/L) variant. No significant difference in susceptibility between the two variants of CYP51A for itraconazole or ravuconazole was noted (p = .82 and 0.87, respectively, [Mann–Whitney]).
FIGURE 4.

CYP51A variants do not alter susceptibility towards azoles. (A &B) Depiction of the protein structures of the two variants of the CYP51A of M. mycetomatis. The main protein structure in the two variants is represented by ribbons, while the haem group is shown as ball‐and‐stick. The position where the two variants differ (499) is highlighted by arrows; this is further from the haem group and hence unlikely to affect drug interaction. The CYP51A variants did not alter the susceptibility to either itraconazole (C) or ravuconazole (D). There was no significant difference (Mann–Whitney) between the two variants, with a median MIC of 0.064 mg/L and 0.032 mg/L for itraconazole (p = .82) and a similar median MIC (0.008 mg/L) for ravuconazole (p = .87).
4. DISCUSSION
This study determined ECVs for M. mycetomatis for the commonly used antifungal agent, itraconazole and the investigational drug ravuconazole. We demonstrated that there are two natural variants of the CYP51A target gene in wild‐type M. mycetomatis with equal susceptibility patterns for itraconazole and ravuconazole. No additional mutations were found in isolates with a MIC above the ECV.
By determining the in vitro susceptibility of M. mycetomatis against itraconazole and ravuconazole using the modified CLSI microdilution method, we confirmed itraconazole and ravuconazole inhibit the growth of M. mycetomatis in vitro. 11 , 24 , 25 We also confirmed that ravuconazole had a lower MIC90 in M. mycetomatis compared to itraconazole. 24 Compared to our previous study, with only 23 isolates analysed, the MIC50 and MIC90 in our study were one dilution step higher compared to those reported earlier. 24 , 26 This difference is most likely due to the larger sample size and not due to the more limited genomic diversity in our study, as the MIC50 and MIC90 were similar between the clonal isolates and the unique isolates. Using a large dataset, we could propose ECVs for itraconazole and ravuconazole for M. mycetomatis. To set an ECV, five simple rules must be followed. 23 First, ECVs can only be set for a single species. So molecular identification is essential for ECV calculations for fungi, which are not easily identified by morphological features. 19 , 27 Second, data should only be included from unique clinical isolates. Repeat isolates from a single episode of infection should be excluded. Third, MICs must have been determined using a reference method, preferably based on the CLSI or the EUCAST guidelines. Fourth, MICs must conform to the standard twofold dilution series based on powers of 2. Fifth, MICs should be accompanied by MICs within established ranges for quality control of the isolates obtained during the testing period. Furthermore, MIC data must preferably be generated by a minimum of three and preferably five independent and geographically distinct laboratories to allow for inter‐laboratory variation, and MICs should be available for at least 100 different isolates. 23 In this study, we were able to use molecularly identified isolates to ensure that the MICs obtained were indeed from M. mycetomatis. However, the MIC data were generated in only a single centre using isolates mainly from Sudan. This is a limitation of our study since ECVs should be determined in a multi‐centre study to ensure data are not skewed by a particular lot of reagents or by one scientist involved in MIC interpretation. 28 However, our data are the best that is currently possible since M. mycetomatis isolates from different geographical regions are not available, and MICs are not routinely determined in local laboratories. By proposing these ECVs, other laboratories may be more inclined to implement in vitro susceptibility testing in their routine work‐flow. This will allow us to update the currently proposed ECVs.
Despite these limitations, using the largest dataset available, we were able to propose ECVs for M. mycetomatis for itraconazole and ravuconazole. The proposed ECV for itraconazole was 1 mg/L for M. mycetomatis. This ECV is identical to that obtained for other filamentous fungi such as A. fumigatus, Aspergillus flavus and Aspergillus nidulans using the EUCAST method 8 and one dilution step lower than the ECV proposed for the sporotrichosis causative agents Sporothrix schenckii and Sporothrix braziliensis (2 mg/L) using the CLSI method. 10 This indicates that the susceptibility of the filamentous fungus M. mycetomatis towards itraconazole is comparable to these more common filamentous fungi. For A. fumigatus, A. flavus and A. nidulans, the ECV for itraconazole is identical to the established clinical breakpoint by the EUCAST. Isolates with a MIC ≤1 mg/L are considered susceptible to itraconazole, and isolates with a MIC >1 mg/L are considered resistant. 8 This indicates that for some filamentous fungi, the ECV are predictive for the clinical breakpoints.
The proposed ECVs were independent of the CYP51A variant present in the M. mycetomatis isolate. This study demonstrated that two natural variants of the CYP51A enzyme are present in the tested Sudanese M. mycetomatis isolates. In 65% of the population, a serine was present at position 499 of the enzyme, in the remaining 35% of the population, a glycine was found at that position. Since amino acid 499 is not located near the azole binding pocket of the enzyme, no difference in MIC distribution was noted between the two variants. Natural variance within the CYP51 enzyme is not unique for M. mycetomatis. It is also described in A. fumigatus, 29 , 30 with a clear association of the location of the mutation with the MIC. In Aspergillus fumigatus, mutations resulting in amino acid changes far from the interaction site did not result in elevated MICs, while mutations near or within the interaction site did. The elevated MICs for ravuconazole found in the two isolates with MICs greater than the ECV were not due to changes in the target enzyme since we did not find any nonsynonymous mutations in the M. mycetomatis population used in this study. However, other resistance mechanisms apart from the mutations in the CYP51A gene can also give a higher MIC, 31 for instance, in A. fumigatus, azole resistance was linked to mutations in the promotor region of the CYP51A gene, such as tandem repeats or transposable elements, resulting in enhanced expression of the CYP51A gene. 32 In addition, upregulation of efflux pumps such as ATP‐binding cassettes (ABC) transporters and major facilitator superfamily (MFS) transporters have been shown to play a role in azole resistance. 33 , 34 Furthermore, in Aspergillus and Candida species, other signalling pathways such as 3‐hydroxy‐3‐methyl‐glutaryl‐coenzyme A (HMG‐CoA) reductase pathway result in elevated MICs for itraconazole, isavuconazole, posaconazole and voriconazole. 35 , 36 , 37 Since there were no differences in amino acids in the CYP51A genes of the two M. mycetomatis isolates, which had MICs above the ECV for ravuconazole, one of the other resistance mechanisms could have been responsible for these elevated MICs.
In conclusion, we have demonstrated two different variants of CYP51A in the M. mycetomatis population, which do not differ in susceptibility to itraconazole and ravuconazole. Using the 131 independent clinical isolates data, we determined ECVs of itraconazole and ravuconazole for M. mycetomatis. These ECVs can help identify isolates that are more likely to be resistant to the treatment given and are a first step towards establishing clinical breakpoints in the future.
CONFLICT OF INTEREST
None to declare.
Supporting information
Table S1
ACKNOWLEDGEMENTS
DNDi thanks the Global Health Innovative Technology Fund (GHIT Fund), Japan, for its financial support for this work, and thanks UK AID, UK; Médecins sans Frontières (MSF) International; and the Swiss Agency for Development and Cooperation (SDC), Switzerland, for supporting its overall mission.
Nyuykonge B, Siddig EE, Mhmoud NA, et al. Epidemiological cut‐off values for itraconazole and ravuconazole for Madurella mycetomatis, the most common causative agent of mycetoma. Mycoses. 2022;65:1170‐1178. doi: 10.1111/myc.13509
DATA AVAILABILITY STATEMENT
The data that support the findings of this study are provided in a supplementary file and raw files are available upon request while all sequences have been deposited in GenBank and accession numbers included in the supplemental.
REFERENCES
- 1. Zijlstra EE, van de Sande WWJ, Welsh O, Mahgoub ES, Goodfellow M, Fahal AH. Mycetoma: a unique neglected tropical disease. Lancet Infect Dis. 2016;16(1):100‐112. [DOI] [PubMed] [Google Scholar]
- 2. Kloezen W, van Helvert‐van Poppel M, Fahal AH, van de Sande WW. A Madurella mycetomatis Grain Model in Galleria mellonella Larvae. PLoS Negl Trop Dis. 2015;9(7):e0003926. [DOI] [PMC free article] [PubMed] [Google Scholar]
- 3. van de Sande W, Fahal A, Ahmed SA, et al. Closing the mycetoma knowledge gap. Med Mycol. 2018;56(suppl_1):S153‐S164. [DOI] [PubMed] [Google Scholar]
- 4. Scolding PS, Fahal AH, Yotsu RR. Drug therapy for mycetoma. Chochrane Database Syst Rev. 2018;7:CD013082. [Google Scholar]
- 5. Elkheir LYM, Haroun R, Mohamed MA, Fahal AH. Madurella mycetomatis causing eumycetoma medical treatment: the challenges and prospects. PLoS Negl Trop Dis. 2020;14(8):e0008307. [DOI] [PMC free article] [PubMed] [Google Scholar]
- 6. Fahal AH, Rahman IA, El‐Hassan AM, Rahman ME, Zijlstra EE. The safety and efficacy of itraconazole for the treatment of patients with eumycetoma due to Madurella mycetomatis. Trans R Soc Trop Med Hyg. 2011;105(3):127‐132. [DOI] [PubMed] [Google Scholar]
- 7. Arendrup MC, Friberg N, Mares M, et al. How to interpret MICs of antifungal compounds according to the revised clinical breakpoints v. 10.0 European committee on antimicrobial susceptibility testing (EUCAST). Clin Microbiol Infect. 2020;26(11):1464‐1472. [DOI] [PubMed] [Google Scholar]
- 8. Guinea J. Updated EUCAST clinical breakpoints against Aspergillus, implications for the clinical microbiology laboratory. J Fungi (Basel). 2020;6(4):343. [DOI] [PMC free article] [PubMed] [Google Scholar]
- 9. Espinel‐Ingroff A, Turnidge J. The role of epidemiological cutoff values (ECVs/ECOFFs) in antifungal susceptibility testing and interpretation for uncommon yeasts and moulds. Rev Iberoam Micol. 2016;33(2):63‐75. [DOI] [PubMed] [Google Scholar]
- 10. Espinel‐Ingroff A, Abreu DPB, Almeida‐Paes R, et al. Multicenter, international study of MIC/MEC distributions for definition of epidemiological cutoff values for Sporothrix species identified by molecular methods. Antimicrob Agents Chemother. 2017;61(10):e01057‐17. [DOI] [PMC free article] [PubMed] [Google Scholar]
- 11. Ahmed AO, van de Sande WWJ, van Vianen W, et al. In vitro susceptibilities of Madurella mycetomatis to itraconazole and amphotericin B assessed by a modified NCCLS method and a viability‐based 2,3‐bis(2‐methoxy‐4‐nitro‐5‐sulfophenyl)‐5‐[(phenylamino)carbonyl]‐2H‐tetrazolium hydroxide (XTT) assay. Antimicrob Agents Chemother. 2004;48(7):2742‐2746. [DOI] [PMC free article] [PubMed] [Google Scholar]
- 12. CLSI , ed. M38 Reference Method for Broth Dilution Antifungal Susceptibility Testing of Filamentous Fungi. 3rd ed. CLSI; 2017. [Google Scholar]
- 13. Ghannoum MA, Rice LB. Antifungal agents: mode of action, mechanisms of resistance, and correlation of these mechanisms with bacterial resistance. Clin Microbiol Rev. 1999;12(4):501‐517. [DOI] [PMC free article] [PubMed] [Google Scholar]
- 14. Geißel B, Loiko V, Klugherz I, et al. Azole‐induced cell wall carbohydrate patches kill aspergillus fumigatus. Nat Commun. 2018;9(1):3098. [DOI] [PMC free article] [PubMed] [Google Scholar]
- 15. Ahmed SA, van de Sande WW, Desnos‐Ollivier M, Fahal AH, Mhmoud NA, de Hoog GS. Application of isothermal amplification techniques for identification of Madurella mycetomatis, the prevalent agent of human mycetoma. J Clin Microbiol. 2015;53(10):3280‐3285. [DOI] [PMC free article] [PubMed] [Google Scholar]
- 16. Lim W, Eadie K, Horst‐Kreft D, Ahmed SA, Fahal AH, van de Sande WWJ. VNTR confirms the heterogeneity of Madurella mycetomatis and is a promising typing tool for this mycetoma causing agent. Med Mycol. 2018;57:434‐440. [DOI] [PubMed] [Google Scholar]
- 17. Lim W, Siddig E, Eadie K, et al. The development of a novel diagnostic PCR for Madurella mycetomatis using a comparative genome approach. PLoS Negl Trop Dis. 2020;14(12):e0008897. [DOI] [PMC free article] [PubMed] [Google Scholar]
- 18. Ahmed SA, van de Sande WW, Stevens DA, et al. Revision of agents of black‐grain eumycetoma in the order Pleosporales. Persoonia. 2014;33:141‐154. [DOI] [PMC free article] [PubMed] [Google Scholar]
- 19. Nyuykonge B, Klaassen CHW, Zandijk WHA, et al. Diagnostic implications of mycetoma derived from Madurella pseudomycetomatis isolates from Mexico. J Eur Acad Dermatol Venereol. 2020;34:1828‐1834. [DOI] [PMC free article] [PubMed] [Google Scholar]
- 20. Nyuykonge B, Eadie K, Zandijk WHA, et al. A short‐tandem‐repeat assay (Mmy STR) for studying genetic variation in Madurella mycetomatis. J Clin Microbiol. 2021;59(3):e02331‐20. [DOI] [PMC free article] [PubMed] [Google Scholar]
- 21. Waterhouse A, Bertoni M, Bienert S, et al. SWISS‐MODEL: homology modelling of protein structures and complexes. Nucleic Acids Res. 2018;46(W1):W296‐W303. [DOI] [PMC free article] [PubMed] [Google Scholar]
- 22. Venselaar H, Te Beek TA, Kuipers RK, Hekkelman ML, Vriend G. Protein structure analysis of mutations causing inheritable diseases. An e‐science approach with life scientist friendly interfaces. BMC Bioinf. 2010;11:548. [DOI] [PMC free article] [PubMed] [Google Scholar]
- 23. Turnidge J, Kahlmeter G, Kronvall G. Statistical characterisation of bacterial wild‐type MIC value distributions and the determination of epidemiological cut‐off values. Clin Microbiol Infect. 2006;12(5):418‐425. [DOI] [PubMed] [Google Scholar]
- 24. Ahmed SA, Kloezen W, Duncanson F, et al. Madurella mycetomatis is highly susceptible to ravuconazole. PLoS Negl Trop Dis. 2014;8(6):e2942. [DOI] [PMC free article] [PubMed] [Google Scholar]
- 25. Ahmed SA, Kloezen W, Fahal AH, de Hoog GS, van de Sande WW. In vitro interaction of currently used azoles with terbinafine against Madurella mycetomatis. Antimicrob Agents Chemother. 2015;59(2):1373‐1374. [DOI] [PMC free article] [PubMed] [Google Scholar]
- 26. Lim W, Eadie K, Konings M, et al. Madurella mycetomatis, the main causative agent of eumycetoma, is highly susceptible to olorofim. J Antimicrob Chemother. 2020;75(4):936‐941. [DOI] [PMC free article] [PubMed] [Google Scholar]
- 27. Van de Sande WWJ, Fahal AH, Goodfellow M, Mahgoub el S, Welsh O, Zijlstra EE. Merits and pitfalls of the currently used diagnostic tools in mycetoma. PLoS Negl Trop Dis. 2014;8(7):e2918. [DOI] [PMC free article] [PubMed] [Google Scholar]
- 28. Espinel‐Ingroff A, Alvarez‐Fernandez M, Cantón E, et al. Multicenter study of epidemiological cutoff values and detection of resistance in Candida spp. to anidulafungin, caspofungin, and micafungin using the Sensititre YeastOne colorimetric method. Antimicrob Agents Chemother. 2015;59(11):6725‐6732. [DOI] [PMC free article] [PubMed] [Google Scholar]
- 29. Escribano P, Recio S, Peláez T, Bouza E, Guinea J. Aspergillus fumigatus strains with mutations in the cyp51A gene do not always show phenotypic resistance to itraconazole, voriconazole, or posaconazole. Antimicrob Agents Chemother. 2011;55(5):2460‐2462. [DOI] [PMC free article] [PubMed] [Google Scholar]
- 30. Talbot JJ, Frisvad JC, Meis JF, et al. Mutations, extrolite profiles, and antifungal susceptibility in clinical and environmental isolates of the aspergillus viridinutans species complex. Antimicrob Agents Chemother. 2019;63(11):e00632‐19. [DOI] [PMC free article] [PubMed] [Google Scholar]
- 31. Wei X, Chen P, Gao R, et al. Screening and characterization of a non‐cyp51A mutation in an aspergillus fumigatus cox10 strain conferring azole resistance. Antimicrob Agents Chemother. 2017;61(1):e02101‐16. [DOI] [PMC free article] [PubMed] [Google Scholar]
- 32. Lelièvre L, Groh M, Angebault C, Maherault AC, Didier E, Bougnoux ME. Azole resistant aspergillus fumigatus: an emerging problem. Med mal Infect. 2013;43(4):139‐145. [DOI] [PubMed] [Google Scholar]
- 33. Hagiwara D, Watanabe A, Kamei K, Goldman GH. Epidemiological and genomic landscape of azole resistance mechanisms in. Front Microbiol. 2016;7:1382. [DOI] [PMC free article] [PubMed] [Google Scholar]
- 34. Whaley SG, Berkow EL, Rybak JM, Nishimoto AT, Barker KS, Rogers PD. Azole antifungal resistance in Candida albicans and emerging non‐albicans Candida species. Front Microbiol. 2016;7:2173. [DOI] [PMC free article] [PubMed] [Google Scholar]
- 35. Cowen LE, Sanglard D, Howard SJ, Rogers PD, Perlin DS. Mechanisms of antifungal drug resistance. Cold Spring Harb Perspect Med. 2014;5(7):a019752. [DOI] [PMC free article] [PubMed] [Google Scholar]
- 36. Pérez‐Cantero A, López‐Fernández L, Guarro J, Capilla J. Azole resistance mechanisms in aspergillus: update and recent advances. Int J Antimicrob Agents. 2020;55(1):105807. [DOI] [PubMed] [Google Scholar]
- 37. Rybak JM, Ge W, Wiederhold NP, et al. Mutations in hmg1, challenging the paradigm of clinical triazole resistance in Aspergillus fumigatus. mBio. 2019;10:2, e00437‐19. [DOI] [PMC free article] [PubMed] [Google Scholar]
Associated Data
This section collects any data citations, data availability statements, or supplementary materials included in this article.
Supplementary Materials
Table S1
Data Availability Statement
The data that support the findings of this study are provided in a supplementary file and raw files are available upon request while all sequences have been deposited in GenBank and accession numbers included in the supplemental.