

Abstract
Objective:
To establish and validate a radiomics nomogram based on contrast-enhanced (CE)-MRI for predicting the efficacy of neoadjuvant chemotherapy (NAC) in human epidermal growth factor receptor 2 (HER2)-positive breast cancer with non-mass enhancement (NME).
Methods:
A cohort comprising 117 HER2-positive breast cancer patients showing NME on CE-MRI between January 2012 and December 2019 were retrospectively analysed in our study. Patients were classified as pathological complete respone (pCR) according to surgical specimens and axillary lymph nodes without invasive tumour cells. Clinicopathological data were recorded, and images were assessed by two radiologists. A total of 1130 radiomics features were extracted from the primary tumour and six radiomics features were selected by the maximal relevance and minimal redundancy and least absolute shrinkage and selection operator algorithms. Univariate logistic regression was used to screen meaningful clinical and imaging features. The rad-score and independent risk factors were incorporated to build a nomogram model. Calibration and receiver operator characteristic curves were used to confirm the performance of the nomogram in the training and testing cohorts. The clinical usefulness of the nomogram was evaluated by decision curve analysis.
Results:
The difference in the rad-score between the pCR and non-pCR groups was significant in the training and testing cohorts (p < 0.01). The nomogram model showed good calibration and discrimination, with AUCs of 0.900 and 0.810 in the training and testing cohorts. Decision curve analysis indicated that the radiomics-based model was superior in terms of patient clinical benefit.
Conclusion:
The MRI-based radiomics nomogram model could be used to pre-operatively predict the efficacy of NAC in HER2-positive breast cancer patients showing NME.
Advances in knowledge:
HER2-positive breast cancer showing segmental enhancement on CE-MRI was more likely to achieve pCR after NAC than regional enhancement and diffuse enhancement.
The MRI-based radiomics nomogram model could be used to pre-operatively predict the efficacy of NAC in HER2-positive breast cancer that showed NME.
Introduction
Human epidermal growth factor receptor 2 (HER2)-positive breast cancer is highly invasive, with increased recurrence and metastasis rates and poor prognosis. 1 Preoperative neoadjuvant chemotherapy (NAC) could reduce the tumour burden and provide unresectable patients with an opportunity to undergo surgery. The rate of pathological complete response (pCR) after NAC based on anti-HER2 therapy can be significantly improved. However, not all patients can benefit from NAC. Several studies 2,3 have reported that less than 35% of HER2-positive breast cancers are sensitive to NAC with trastuzumab. If patients with HER2-positive invasive breast cancer who are unsensitive to NAC could be identified earlier, unnecessary treatment could be prevented, and the change in treatment plan could be completed in a timely manner.
Radiomics is an image post-processing technology that obtains high-dimensional data from medical images, which are difficult to recognise by the naked eye. 4,5 Many researchers 6–9 reported that the effect of NAC in breast cancer could be predicted by radiomics, but all studies concentrated on breast cancer that showed masses on contrast-enhanced MRI (CE-MRI). To the best of our knowledge, few researchers have reported the role of radiomics in predicting the efficacy of NAC in breast cancers with non-mass enhancement (NME). Chen 10 et al reported that the oestrogen receptor (ER)/progesterone receptor (PR)-negative HER2-positive subtype was more frequent in the non-mass type than in the mass type. Gweon 11 et al concluded that HER2-positive invasive ductal carcinoma (IDC) was more frequently associated with NME. Therefore, the purpose of the current study was to investigate the value of the distribution of non-mass enhancement on CE-MRI images and radiomics in predicting the effect of NAC in HER2-positive breast cancer and to establish a nomogram to guide clinical treatment plans.
Methods and materials
Patients
This study was approved by the ethics committee of our hospital (Fudan University Shanghai Cancer Center), and the requirement for informed consent was waived. 377 HER2-positive breast cancer patients receiving NAC in our hospital between January 2012 and December 2019 were retrospectively analysed in our study. The inclusion criteria included the following: (i) patients had invasive HER2-positive breast cancer confirmed by pathology (≥T2); (ii) tumours showed NME on CE-MRI; (iii) patients underwent complete standard treatment (4–6 cycles of paclitaxel+carboplatin+herceptin (PCH), paclitaxel: 80 mg/m2, carboplatin: AUC = 2, herceptin was initially measured at 4 mg/kg ant maintained at 2 mg/kg; once a week, three times is a cycle of treatment and then patients underwent surgical treatment); (iv) patients did not undergo prior treatment before NAC; (v) patients underwent modified radical mastectomy or breast conservation within 1 month after NAC; and (vi) patients had available clinicopathological data. The exclusion criteria were as follows: (i) tumours showing a mass on CE-MRI (n = 235); (ii) patients with incomplete NAC (n = 15); (iii) patients who underwent surgery in another hospital or who did not undergo surgery (n = 4); and (iv) patients with poor MRI quality (n = 6). A total of 117 HER2-positive breast cancer patients who showed NME were enrolled in our study and were randomly divided into a training set and testing set at a ratio of 7:3.
Clinicopathological evaluations
The histopathological results of core needle biopsies or surgical specimens were determined according to the World Health Organisation guidelines and immunochemistry (IHC). The ER, PR, HER2, and Ki-67 expression statuses were assessed by a pathologist with 10 years of experience in breast pathology. The ER and PR statuses were evaluated as positive only when at least 1% of tumour cells showed nuclear staining. Tumours with HER2 scores of 3+ based on IHC were considered positive. In the cases of 2+ scores, HER2 gene amplification was determined by fluorescent in situ hybridisation. Ki-67 ≥30% was assessed as positive. Surgical specimens and axillary lymph nodes without invasive tumour cells after NAC were defined as pCR.
MRI and imaging analysis
Breast CE-MRI was performed before NAC on a MAGNETOM Skyra 3.0 T MRI system (Siemens Healthineers, Erlangen, Germany) using a dedicated 16-channel surface breast coil and a 1.5 T MRI scanner (Aurora Dedicated Breast MRI System; USA) using a dedicated 8-channel surface breast coil in the prone position. The 3.0 T CE-MRI protocol included: (a) a T 1 weighted fat-saturated pre-contrast sequence and (b) multiple (five phases) T 1 weighted fat-saturated post-contrast sequences. The scan parameters were as follows: repetition time/echo time (TR/TE) = 4.5/1.6 ms; matrix = 384×384; field of view (FOV) = 340 cm×340 cm; slice thickness = 1.5 mm; and 80 slices. The 1.5 T CE-MRI protocol included: (a) a T 1 weighted fat-saturated precontrast sequence and (b) multiple (three phases) T 1 weighted fat-saturated postcontrast sequences. The scan parameters were as follows: TR/TE = 29.0/4.8 ms; FOV = 36 cm×36 cm; matrix = 360×360; slice thickness = 1.5 mm; and 108 slices. All post-contrast sequences were obtained after intravenous administration of a 0.1 mmol/kg dose of Gd-DTPA (Magnevist; Bayer-Schering Pharma, Berlin, Germany). On a pixel-by-pixel basis, subtraction images were obtained by subtracting the pre-contrast images from the first post-contrast CE-MRI images.
All images were assessed by two radiologists with 9–16 years of experience in the diagnosis of breast tumours. Both radiologists reviewed a standard training set of 50 non-study cases demonstrating the distribution of NME at the beginning of our study. In the processing of evaluating imaging, they were blinded to the effect of NAC. The distribution of NME included focal enhancement, linear enhancement, regional enhancement, segmental enhancement, multiregional enhancement, and diffuse enhancement, which were evaluated on CE-MRI according to coronal and sagittal images. Variables (Kappa values > 0.75) were further analysed by univariable analysis. For categorial data, the radiologists reached a consensus after discussion when there was inconsistency.
ROI segmentation and radiomics feature extraction
First, all CE-MRI images were normalised by the u ± 3σ. Then, tumour regions of interest (ROIs) were manually drawn on each slice along the contour of the tumour on the subtraction image of the first post-contrast CE-MRI scan by two radiologists at the same time. A total of 1130 radiomics features were extracted in Python software (v. 3.7, https://www.python.org/), which included one shape-based feature, 18 histogram-based features, 22 grey-level co-occurrence matrix (GLCM)-based features, 16 run length matrix (RLM)-based features, 14 grey-level size zone matrix (GLSZM)-based features, 14 grey-level dependent matrix (GLDM)-based features and 1032 wavelet transform-based features. The interobserver reproducibility of ROI detection and radiomic feature extraction was measured by the interclass correlation coefficient (ICC). The ICC was defined as high (ICC ≥ 0.8), medium (0.8 > ICC ≥ 0.5), or low (ICC< 0.5). The ICC score for radiomics features was 0.848 ~ 0.998, which could indicate that those features reached satisfactory agreement.
Radiomics feature selection and rad-score calculation
Radiomics features were excluded by maximal relevance and minimal redundancy (mRMR) and least absolute shrinkage and selection operator (LASSO). First, redundant features were excluded by mRMR, and a total of 30 radiomics features remained. Second, the LASSO algorithm was used to select the optimal features, and six features were included finally. Last, the rad-score was calculated for each patient via optimal radiomics features weighted by their coefficients. Univariable analysis was used to compare the rad-score between the pCR and non-pCR groups in the training cohort, and it was validated in the testing cohort.
Nomogram development and evaluation
In the training cohort, clinical and MRI characteristics were analysed by univariable analysis. Then, the significant variables and rad-score were further analysed in multivariable analysis. Multiple stepwise reverse logistic regression was used to build an imaging-radiomics model, and the sensitivity, specificity, accuracy, area under the curve (AUC), positive-predictive value (PPV), and negative-predictive value (NPV) were calculated. Internal testing of the imaging-radiomics model was performed in the testing cohort. Finally, a nomogram based on the imaging-radiomics model was built. Calibration curves in the training and testing cohorts were created to evaluate the calibration of the nomogram using the Hosmer–Lemeshow goodness-of-fit test.
To evaluate the added value of the radiomics signature and the distribution of NME in predicting the effect of NAC in HER2-positive breast cancer, decision curves analysis was generated to evaluate the clinical utility by calculating the net benefits for a range of threshold probabilities.
Statistical analysis
Categorical variables are presented as the number and percentage, and continuous variables are presented as the mean ± SD or quartile. Categorical variables between the training set and testing set were compared with the χ2 test or Fisher’s test, and quantitative variables with the t test or Mann–Whitney U test. All statistical analyses were performed with R software (v. 3.60; http://www. r-project.org). p < 0.05 was considered statistically significant.
Results
Clinical characteristics and MRI characteristics
There were no differences in age, menopausal status, FGT, BPE, T stage, N stage, distribution of NME, Ki-67 index or rad-score between the training and testing cohorts (Table 1).
Table 1.
Patient characteristics between the training and testing cohorts
| Characteristics | Training cohort (n = 83) | Testing cohort (n = 34) | p value |
|---|---|---|---|
| Age | 47.5 ± 9.4 | 48.7 ±8.5 | 0.506 |
| Menopausal status | 0.469 | ||
| Pre-menopausal | 51 (61.44%) | 24 (70.58%) | |
| Post-menopausal | 32 (38.56%) | 10 (29.42%) | |
| FGT | 0.411 | ||
| Almost entirely fat | 28 (33.73%) | 9 (26.47%) | |
| Scattered | 19 (22.89%) | 8 (23.52%) | |
| Heterogeneous | 15(18.07%) | 7(20.58%) | |
| Extreme | 21(25.30%) | 10(29.43%) | |
| BPE | 0.591 | ||
| Minimal | 14 (16.87%) | 5 (14.70%) | |
| Mild | 47 (56.62%) | 18 (52.94%) | |
| Moderate | 14 (16.87%) | 7 (20.58%) | |
| Marked | 8 (9.64%) | 4 (11.78%) | |
| Pre-NAC T stage | 0.292 | ||
| T2 | 41 (49.39) | 13 (38.23%) | |
| T3 | 42 (51.61%) | 21 (61.76%) | |
| Pre-NAC N stage | 0.083 | ||
| N0 | 19 (22.89%) | 5 (14.7%) | |
| N1 | 46 (55.42%) | 17 (50.0%) | |
| N2 | 7 (8.44%) | 1 (2.9%) | |
| N3 | 11 (13.25%) | 11 (32.4%) | |
| Ki-67 | 0.293 | ||
| >30% | 65 (78.3%) | 23 (67.6%) | |
| ≤30% | 17 (21.7%) | 11 (32.4%) | |
| Distribution of NME | 0.770 | ||
| Segmental | 26 (31.32%) | 11 (32.35%) | |
| Regional | 44 (53.01%) | 16 (47.05%) | |
| Diffuse | 13 (15.67%) | 7 (20.60%) | |
| Rad-score | −0.200 (-0.500, 0.100) | −0.200 (-0.400, 0.100) | 0.741 |
NAC, neoadjuvant chemotherapy; NME, non-mass enhancement.
The distribution of NME included the following: segmental enhancement (Figure 1a), regional enhancement (Figure 1b), and diffuse enhancement (Figure 1c). The distribution of NME was significantly different between the pCR and non-pCR groups in the training and testing cohorts (Table 2).
Figure 1.

(a) A 51-year-old female showing segmental enhancement in the right breast; biopsy pathology: invasive breast cancer. (b) A 49-year-old female showing regional enhancement in the left breast; biopsy pathology: invasive breast cancer. (c) A 31-year-old female showing diffuse enhancement in the right breast; biopsy pathology: invasive breast cancer IHC: ER negative, PR negative, HER2 positive; surgical pathology: non-pCR. IHC, immunohistochemistry; pCR, pathological complete response; HER2, human epidermal growth factor receptor 2.
Table 2.
Univariate analysis of the pCR and non-pCR groups in the training cohort
| Characteristic | pCR (n = 38) | Non-pCR (n = 45) | p value |
|---|---|---|---|
| Age | 48.1 ± 8.7 | 46.9 ± 9.9 | 0.556 |
| Menopausal status | 0.700 | ||
| Pre-menopausal | 22 (57.9%) | 29 (64.4%) | |
| Post-menopausal | 16 (42.1%) | 16 (36.6%) | |
| FGT | 0.411 | ||
| Almost entirely fat or scattered | 17 (63.2%) | 25 (55.6%) | |
| Heterogeneous or extreme | 14 (36.8%) | 20 (44.4%) | |
| BPE | 0.632 | ||
| Minimal or mild | 24 (63.2%) | 25 (55.6%) | |
| Moderate or marked | 14 (36.8%) | 20 (44.4%) | |
| Pre-NAC T stage | 0.087 | ||
| T2 | 18 (47.4%) | 23 (51.1%) | |
| T3 | 12 (31.6%) | 19 (42.2%) | |
| T4 | 8 (21.0%) | 3 (6.7%) | |
| Pre-NAC N stage | 0.083 | ||
| N0 | 9 (23.7%) | 10 (22.2%) | |
| N1 | 22 (57.9%) | 24 (53.3%) | |
| N2 | 3 (7.9%) | 4 (8.9%) | |
| N3 | 4 (10.5%) | 7 (15.6%) | |
| Ki-67 | 0.293 | ||
| >30% | 24 (63.2%) | 29 (64.4%) | |
| ≤30% | 14 (36.8%) | 16 (35.6%) | |
| Distribution of NME | <0.001 | ||
| Segmental | 22 (57.9%) | 4 (8.9%) | |
| Regional | 15 (39.5%) | 29 (64.4%) | |
| Diffuse | 1 (2.6%) | 12 (26.7%) | |
| Rad-score | 0 (-0.200, 0.300) | −0.4 (-0.700,–0.100) | <0.001 |
NAC, neoadjuvant chemotherapy; NME, non-mass enhancement.
Radiomics signature
After the LASSO regression model (Figure 2a), 6 potential predictors were selected from 1130 radiomics features (Figure 2b). The rad-score was calculated by using the following formula:
Figure 2.

Radiomics feature selection by using mRMR and LASSO. (a) Tuning parameter (λ) selection in the LASSO model used tenfold cross-validation via minimum criteria. The LASSO coefficient profiles of the 30 radiomics features. (b) A coefficient profile plot was produced against the log (I) sequence, and six features were chosen. LASSO, least absolute shrinkage and selection operator; mRMR, maximal relevance and minimal redundancy.
Rad-score = −0.175+0.194*wavelet LHH first-order Mean + −0.277*wavelet HHH GLSZM Size Zone Non-Uniformity Normalised + 0.016*wavelet HHH GLCM MCC+−0.234*wavelet HLL GLDM Large Dependence High Grey Level Emphasis+0.138*wavelet HLH GLCM Correlation+−0.046*wavelet HLL first order Kurtosis
The rad-score between the pCR and non-pCR groups was significantly different in the training cohort (p < 0.001). The rad-score of the pCR group was higher than that of the non-pCR group in the training cohort, and this was validated in the testing cohort.
Development of the imaging model, radiomics-based model and imaging-radiomics model
The imaging model was built according to the distribution of NME. The AUCs of the distribution of NME in predicting pCR in HER2-positive invasive breast cancer after NAC were 0.750 [95% confidence interval (CI): 0.700–0.870] and 0.730 (95% CI: 0.580–0.890) in the training and testing cohorts, respectively (Table 3).
Table 3.
Performance of the three models in predicting the efficacy of NAC in HER2-positive breast cancer
| Model | AUC | 95% CI | Accuracy | Sensitivity | Specificity | PPV | NPV |
|---|---|---|---|---|---|---|---|
| Imaging model a | 0.750 | 0.700–0.870 | 0.750 | 0.570 | 0.910 | 0.840 | 0.710 |
| Imaging model b | 0.730 | 0.580–0.890 | 0.700 | 0.530 | 0.840 | 0.720 | 0.690 |
| Radiomics model a | 0.800 | 0.710–0.890 | 0.750 | 0.840 | 0.670 | 0.680 | 0.830 |
| Radiomics model b | 0.780 | 0.620–0.930 | 0.710 | 0.860 | 0.580 | 0.610 | 0.840 |
| Imaging-radiomics model a | 0.900 | 0.830–0.970 | 0.840 | 0.760 | 0.910 | 0.880 | 0.820 |
| Imaging-radiomics model b | 0.810 | 0.770–0.960 | 0.780 | 0.700 | 0.920 | 0.930 | 0.830 |
AUC, area under the curve; HER2, human epidermal growth factor receptor 2; NAC, neoadjuvant chemotherapy; NPV, negative-predictive vale; PPV, positive-predictive vale; pCR, pathological complete response.
Training cohort.
Testing cohort.
The radiomics-based model was built based on the rad-score. The AUCs of the rad-score in predicting pCR in HER2-positive breast cancer with NAC were 0.800 (95% CI: 0.710–0.890) in the training cohort and 0.780 (95% CI: 0.620–0.930) in the testing cohort (Table 3).
The distribution of NME and rad-score were independent predictors in predicting pCR in HER2-positive invasive breast cancer after NAC and were used to build an imaging-radiomics model. The AUCs of the imaging-radiomics model in predicting pCR in HER2-positive breast cancer with NAC were 0.900 (95% CI: 0.830–0.970) and 0.810 (95% CI: 0.770–0.960) in the training and testing cohorts, respectively.
Nomogram based on the imaging-radiomics model
The nomogram and calibration curves based on the imaging-radiomics model are shown in Figures 3 and 4. The decision curve analyses (DCAs) based on the models, including the imaging and imaging-radiomics models, are depicted in Figure 5. The imaging-radiomics model gained the most clinical utility for all of the threshold probabilities.
Figure 3.
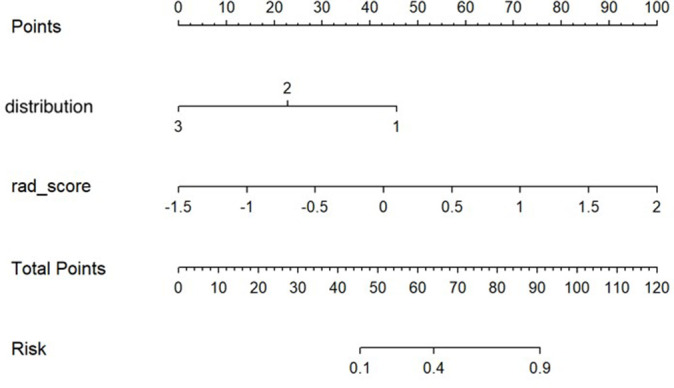
The developed imaging-radiomics nomogram for predicting the efficacy of NAC in HER2-positive breast cancer that showed non-mass enhancement. For distribution, 1 represents segmental enhancement, 2 represents regional enhancement, and 3 represents diffuse enhancement. By calculating the scores of each point and locating it on the total score scale, the estimated probability of pCR can be assessed. HER2, human epidermal growth factor receptor 2; NAC, neoadjuvant chemotherapy; pCR, pathological complete response.
Figure 4.

Calibration curves of the prediction nomogram in the training (a) and testing (b) sets. Calibration curves depict the calibration of the nomogram according to the agreement between the probability of the incidence of pCR and the actual observation. The black line represents the ideal estimation, and the red line represents the apparent prediction of the nomogram. The closer the red line is to the ideal black line, the better the prediction ability of the nomogram. pCR, pathological complete response
Figure 5.

DCAs for the imaging and combined imaging-radiomics models. The grey line represents the assumption that all patients have breast cancer. The black line represents the assumption that none of the patients have breast cancer. The blue line represents the imaging model. The red line represents the imaging-radiomics model. Across the various threshold probabilities, the imaging-radiomics curve shows a maximised net benefit compared with the imaging model for the individual performance. DCA, decision-curve analysis.
Discussion
The prognosis of HER2-positive breast cancer can be improved by anti-HER2 treatment, but some patients could not achieve pCR after NAC. 2 In our study, the nomogram based on the imaging-radiomics model could preoperatively predict the efficacy of NAC in HER2-positive breast cancer patients who showed NME, which was validated in the testing cohort.
The distribution patterns of non-mass breast cancer may be closely related to its aggressiveness. 12,13 In our study, NME showed three types: segmental enhancement, regional enhancement and diffuse enhancement. It is difficult to perform surgery and/or breast-conserving surgery in breast cancer patients with the above three types of NME because of poorly defined boundaries. Therefore, patients with these lesions are more likely to be treated with NAC, which can potentially convert inoperable breast cancer to resectable breast cancer or convert mastectomy to breast-conserving surgery. 14 In our study, we confirmed that HER2-positive breast cancers that showed segmental enhancement on CE-MRI were more likely to achieve pCR after NAC than breast cancers with regional enhancement and diffuse enhancement [odds ratio (OR) = 48.56, 95% CI: 3.74–63.05]. Our result may be supported by the following research. Some literatures 10,15–17 reported that NME was more likely to be associated with ductal carcinoma in situ (DCIS), and NME in DCIS accounted for 60–81%. In addition, linear or segmental enhancement are the most common types in DCIS. 16 Hence, segmental enhancement is more likely to be DCIS than regional and diffuse enhancement. In our study, specimens and axillary lymph nodes without invasive tumour cells after NAC were defined as pCR. In summary, these could be considered as the reason why segmental enhancement was more likely to be related to pCR than regional and diffuse enhancement.
Some studies 8,18 have demonstrated that radiomics based on CE-MRI is a powerful tool to predict the efficacy of NAC in breast cancer. In our study, six features associated with pCR were chosen, including two first-order feature, two GLCM features, one GLDM feature and one GLSZM feature. The selected features were all wavelet features that reflect tumour heterogeneity that could not be recognised by the naked eye. The rad-score based on those features in the pCR group was higher than that in the non-pCR group, which was confirmed in the testing cohort. This result indicated that HER2-positive breast cancer patients with higher rad-scores more easily achieved pCR after NAC. In our study, the AUC values of the rad-score were 0.800 in the training cohort and 0.780 in the testing cohort.
The performance of the imaging-radiomics model that combined the distribution of NME and the rad-score improved the predictive efficacy of NAC in HER2-positive breast cancer, with AUC values of 0.900 and 0.810 in the training and testing cohorts, respectively. In addition, the distribution of NME and the rad-score could be obtained by a non-invasive method and could be easily acceptable in the clinic. Moreover, a nomogram based on the imaging-radiomics model was developed and validated. Logistic models can be visualised by nomograms, which have been used widely in clinics. 19–21 According to the nomogram, there was a positive correlation between the rad-score and the efficacy of NAC. Finally, the imaging-radiomics model had more net benefits than the rad-score only in the DCA. Therefore, it may have great potential to guide clinical treatment. We recommend that patients who are described as having a segmental distribution of NME and a higher rad-score should undergo NAC because these patients could attain better treatment efficacy. We believe that the clinical use of this nomogram can not only prevent unnecessary treatment for patients who are not sensitive to NAC but could also be helpful to guide the adjustment of the treatment plan.
The current study had several limitations. First, our study was single-centre and retrospective in design, and prospective and multicentre studies are needed to verify our results. Second, ROIs were drawn manually, which may limit the promotion of the research results. ROIs could be segmented using artificial intelligence with the cooperation of the engineering team to reduce the influence of subjective factors.
Conclusions
The nomogram based on the imaging-radiomics model could be used to pre-operatively predict the efficacy of NAC and may guide clinicians in making personal treatment decisions for HER2-positive breast cancer patients who show NME.
Footnotes
Acknowledgements: The authors of this manuscript declare no relationships with any companies, whose products or services may be related to the subject matter of the article.
Funding: This study has received funding by Sky imaging research fund of China international medical foundation (Z-2014-07-2003-06), Clinical Research Plan of SHDC (SHDC2020CR2008A), National Natural Science Foundation of China (NSFC 82071878), Shanghai Anticancer Association FLIGHT PROJECT (SACA-AX-201903), Shanghai Science and Technology Foundation (19DZ1930502), Shanghai Science and Technology Innovation Action Plan Medical Innovation Research Project(21Y11910200).
Contributor Information
Qin Li, Email: liqincelery@163.com.
Yan Huang, Email: huangyan3629@163.com.
Qin Xiao, Email: xrayctmrixiao@163.com.
Shaofeng Duan, Email: 18910063803@163.com.
Simin Wang, Email: 19111230013@fudan.edu.cn.
Jianwei Li, Email: ljwdoctor@163.com.
Qingliang Niu, Email: qingliangniu@126.com.
Yajia Gu, Email: guyajia@126.com.
REFERENCES
- 1. Perez EA, Suman VJ, Davidson NE, Martino S, Kaufman PA, Lingle WL, et al. HER2 testing by local, central, and reference laboratories in specimens from the north central cancer treatment group N9831 intergroup adjuvant trial. J Clin Oncol 2006; 24: 3032–38. doi: 10.1200/JCO.2005.03.4744 [DOI] [PubMed] [Google Scholar]
- 2. Vu T, Claret FX. Trastuzumab: updated mechanisms of action and resistance in breast cancer. Front Oncol 2012; 2: 62. doi: 10.3389/fonc.2012.00062 [DOI] [PMC free article] [PubMed] [Google Scholar]
- 3. Nahta R, Yu D, Hung MC, Hortobagyi GN, Esteva FJ. Mechanisms of disease: understanding resistance to HER2-targeted therapy in human breast cancer. Nat Clin Pract Oncol 2006; 3: 269–80. doi: 10.1038/ncponc0509 [DOI] [PubMed] [Google Scholar]
- 4. Gillies RJ, Kinahan PE, Hricak H. Radiomics: images are more than pictures, they are data. Radiology 2016; 278: 563–77. doi: 10.1148/radiol.2015151169 [DOI] [PMC free article] [PubMed] [Google Scholar]
- 5. Liu Z, Li Z, Qu J, Zhang R, Zhou X, Li L, et al. Radiomics of multiparametric MRI for pretreatment prediction of pathologic complete response to neoadjuvant chemotherapy in breast cancer: A multicenter study. Clin Cancer Res 2019; 25: 3538–347. doi: 10.1158/1078-0432.CCR-18-3190 [DOI] [PubMed] [Google Scholar]
- 6. Parikh J, Selmi M, Charles-Edwards G, Glendenning J, Ganeshan B, Verma H, et al. Changes in primary breast cancer heterogeneity may augment midtreatment MR imaging assessment of response to neoadjuvant chemotherapy. Radiology 2014; 272: 100–112. doi: 10.1148/radiol.14130569 [DOI] [PubMed] [Google Scholar]
- 7. Braman NM, Etesami M, Prasanna P, Dubchuk C, Gilmore H, Tiwari P, et al. Intratumoral and peritumoral radiomics for the pretreatment prediction of pathological complete response to neoadjuvant chemotherapy based on breast DCE-MRI. Breast Cancer Res 2017; 19: 57. doi: 10.1186/s13058-017-0846-1 [DOI] [PMC free article] [PubMed] [Google Scholar]
- 8. Fan M, Wu G, Cheng H, Zhang J, Shao G, Li L. Radiomic analysis of DCE-MRI for prediction of response to neoadjuvant chemotherapy in breast cancer patients. Eur J Radiol 2017; 94: 140–47. doi: 10.1016/j.ejrad.2017.06.019 [DOI] [PubMed] [Google Scholar]
- 9. Cain EH, Saha A, Harowicz MR, Marks JR, Marcom PK, Mazurowski MA. Multivariate machine learning models for prediction of pathologic response to neoadjuvant therapy in breast cancer using MRI features: a study using an independent validation set. Breast Cancer Res Treat 2019; 173: 455–63. doi: 10.1007/s10549-018-4990-9 [DOI] [PMC free article] [PubMed] [Google Scholar]
- 10. Jeon-Hor C, Hyeon-Man B. Estrogen receptor and breast MR imaging features: a correlation study. J Magn Reson Imaging 2008; 27(4): 825–33. doi: 10.1002/jmri.21330 [DOI] [PMC free article] [PubMed] [Google Scholar]
- 11. Gweon HM, Jeong J, Son EJ, Youk JH, Kim JA. The clinical significance of accompanying NME on preoperative MR imaging in breast cancer patients. PLoS One 2017; 12(5). doi: 10.1371/journal.pone.0178445 [DOI] [PMC free article] [PubMed] [Google Scholar]
- 12. Lee SM, Nam KJ, Choo KS, Kim JY, Jeong DW, Kim HY, et al. Patterns of malignant non-mass enhancement on 3-T breast MRI help predict invasiveness: using the BI-RADS lexicon fifth edition. Acta Radiol 2018; 59: 1292–99. doi: 10.1177/0284185118759139 [DOI] [PubMed] [Google Scholar]
- 13. Machida Y, Shimauchi A, Tozaki M, Kuroki Y, Yoshida T, Fukuma E. Descriptors of malignant non-mass enhancement of breast MRI: their correlation to the presence of invasion. Acad Radiol 2016; 23: 687–95. doi: 10.1016/j.acra.2016.01.014 [DOI] [PubMed] [Google Scholar]
- 14. Jansen SA, Shimauchi A, Zak L, Fan X, Karczmar GS, Newstead GM. The diverse pathology and kinetics of mass, nonmass, and focus enhancement on MR imaging of the breast. J Magn Reson Imaging 2011; 33: 1382–89. doi: 10.1002/jmri.22567 [DOI] [PMC free article] [PubMed] [Google Scholar]
- 15. Jansen SA, Newstead GM, Abe H, Shimauchi A, Schmidt RA, Karczmar GS. Pure ductal carcinoma in situ: kinetic and morphologic MR characteristics compared with mammographic appearance and nuclear grade. Radiology 2007; 245: 684–91. doi: 10.1148/radiol.2453062061 [DOI] [PubMed] [Google Scholar]
- 16. Rosen EL, Smith-Foley SA, DeMartini WB, Eby PR, Peacock S, Lehman CD. BI-RADS MRI enhancement characteristics of ductal carcinoma in situ. Breast J 2007; 13: 545–50. doi: 10.1111/j.1524-4741.2007.00513.x [DOI] [PubMed] [Google Scholar]
- 17. Chan S, Chen J-H, Agrawal G, Lin M, Mehta RS, Carpenter PM, et al. Characterization of pure ductal carcinoma in situ on dynamic contrast-enhanced MR imaging: do nonhigh grade and high grade show different imaging features? J Oncol 2010; 2010. doi: 10.1155/2010/431341 [DOI] [PMC free article] [PubMed] [Google Scholar]
- 18. Chamming’s F, Ueno Y, Ferré R, Kao E, Jannot A-S, Chong J, et al. Features from computerized texture analysis of breast cancers at pretreatment MR imaging are associated with response to neoadjuvant chemotherapy. Radiology 2018; 286: 412–20. doi: 10.1148/radiol.2017170143 [DOI] [PubMed] [Google Scholar]
- 19. Balachandran VP, Gonen M, Smith JJ, DeMatteo RP. Nomograms in oncology: more than meets the eye. Lancet Oncol 2015; 16: e173–80. doi: 10.1016/S1470-2045(14)71116-7 [DOI] [PMC free article] [PubMed] [Google Scholar]
- 20. van den Bergh RCN, Roobol MJ, Wolters T, van Leeuwen PJ, Schröder FH. The prostate cancer prevention trial and european randomized study of screening for prostate cancer risk calculators indicating a positive prostate biopsy: a comparison. BJU Int 2008; 102: 1068–73. doi: 10.1111/j.1464-410X.2008.07940.x [DOI] [PubMed] [Google Scholar]
- 21. Han L, Zhu Y, Liu Z, Yu T, He C, Jiang W, et al. Radiomic nomogram for prediction of axillary lymph node metastasis in breast cancer. Eur Radiol 2019; 29: 3820–29. doi: 10.1007/s00330-018-5981-2 [DOI] [PubMed] [Google Scholar]