

Abstract
The mouse digit tip amputation model is an excellent model of bone regeneration, but its size and shape present an obstacle for biomechanical testing. As a result, assessing the structural quality of the regenerated bone in this model has focused on mineral density and bone architecture analysis. Here we describe an image-processing based method for assessment of mechanical properties in the regenerated digit by using micro-computed tomography mineral density data to calculate spatially discrete Young’s modulus values throughout the entire distal third phalange. Further, we validate this method through comparison to nanoindentation-measured values for Young’s modulus. Application to a set of regenerated and unamputated digits shows that regenerated bone has a lower Young’s modulus compared to the uninjured digit, with a similar trend for experimental hardness values. Importantly, this method heightens the utility of the digit regeneration model, allows for more impactful treatment evaluation using the model, and introduces an analysis platform that can be used for other bones that do not conform to a standard long-bone model.
Keywords: Young’s modulus, Micro-computed tomography, Digit regeneration, Nanoindentation, Bone
1. Introduction
Animal models are frequently used to investigate treatments to improve bone quality. Biomechanical fortitude of the bone is integral to bone quality. Assessing this is particularly difficult for mouse bone models that are unsuitable for long-bone testing methods or unusually small. A need exists for improved quantification of bone quality before and after treatment.
The mouse digit amputation model has been a valuable model in studying bone regeneration and healing (Borgens, 1982; Brockes and Kumar, 2005; Bryant et al., 2002; Douglas, 1972; Fernando et al., 2011; Han et al., 2008; Illingworth, 1974; Said et al., 2004; Simkin et al., 2015; Singer et al., 1987). In this model, the distal one third of the third phalangeal element (P3) is amputated. Following amputation, the digit regenerates bone via direct ossification.
Regeneration in the digit is typically evaluated using micro-computed tomography (μCT) techniques, focusing on length changes (Dawson et al., 2017), trabecular spacing, trabecular thickness, and volumetric change (Busse et al., 2019; Fernando et al., 2011; Sammarco et al., 2015; Sammarco et al., 2014; Simkin et al., 2017). This approach has enabled valuable insight into how the regrown bone is formed under the regenerative process, though links to mechanical properties and performance are lacking.
Comparison of μCT-derived volumetric bone mineral density (vBMD) to mechanical testing may provide data that better quantifies and predicts bone mechanical properties. Relationships linking BMD to bone mechanical properties have been previously developed for methods joining computed tomography to finite elements (qCT-FE), and utilized across a variety of bone studies (Knowles et al., 2016). While several similar approaches have been developed to evaluate bone, to date none have been used to address bone mechanical properties in the mouse model of skeletal regeneration.
Nanoindentation is a mechanical testing method that allows single-point physical measurement of mechanical properties at the nanometer scale. This method has been advantageous for testing geometry similar to mouse digits and used to compare elasticity and mineralization in osteogenesis imperfecta mice, strain-dependence and viscoelastic behavior in mouse calvaria and tibia, effect of preparation, and spatial heterogeneity of properties (Hoffler et al., 2005; Maruyama et al., 2015; Mora-Macias et al., 2017; Pepe et al., 2020; Rodriguez-Florez et al., 2013; Vanleene et al., 2012).
Presented here, a combination of μCT image processing and mineral density-to-Young’s modulus correlation relationships are used to calculate the Young’s modulus of regenerated and uninjured mouse digits. Further, we validate these calculations using values measured through nanoindentation experiments. This approach allows for a new and improved comparative evaluation of the structural and mechanical quality of regenerated and uninjured bone and broadens the utility of the digit regeneration model.
2. Materials and method
2.1. Overview
Unamputated (UA) and regenerated (D42) distal third phalange (P3) digits were collected on day 42 as described previously (Busse et al., 2019; Sammarco et al., 2014), one per mouse with N = 6 total mice (N = 3 (UA) and N = 3 (D42)). Digits were imaged using μCT scanning, followed by subsequent nanoindentation.
2.2. Ethics statement
All experiments were performed in accordance with the standard operating procedures approved by the Institutional Animal Care and Use Committee of Tulane University School of Medicine.
2.3. Amputations and animal handling
Adult 6-month-old male and female CD1 wild type mice were purchased from Charles River (Wilmington, MA). Mice were amputated as described previously (Busse et al., 2019; Sammarco et al., 2014) and digits were collected at day 42 for analysis.
2.4. Micro-computed tomography
Ex-vivo μCT images were acquired using a Bruker SkySkan 1172 (Bruker, Kontich, Belgium) as described previously (Hoffseth et al., 2021a), with parameters detailed in the Appendix A.
2.5. Density-Young’s Modulus calculation
Young’s modulus values were calculated from vBMD values as measured by μCT using established density-elasticity relationships utilized in qCT-FE (Knowles et al., 2016). Calculation of vBMD was performed as described previously in semi-automated analysis of distal third phalange BMD (Hoffseth et al., 2021b), where calibrated μCT images of each digit were processed and reconstructed using Python (Rossum, 1995). A schematic is shown in Fig. 1. Voxels (L = 3 pixels) were used for each representative data point to reduce computation time without loss of digit characteristics. Proximal and distal bone regions were defined by distance along the proximodistal axis, partitioned by the amputation site.
Fig. 1.

Image processing and spatial analysis on bone data from μCT image stacks offers a path to predicting mechanical properties and regenerated bone quality.
Four density-modulus relationships were selected from literature (Eberle et al., 2013a, b; Edwards et al., 2013; Nishiyama et al., 2013), chosen for their reported experimental validation (femur for (1), (2), (4), and tibia for (3)) and listing of densitometric and scan settings. Bone was assumed isotropic.
| (1) |
| (2) |
| (3) |
| (4) |
Digits were 3D rendered using Python scripting and Mayavi mlab (Ramachandran and Varoquaux, 2011) to visualize the spatial distribution of Young’s modulus values.
2.6. Nanoindentation measurements
Nanoindentation tests were performed by the Mayo Clinic Biomechanics Core (Rochester, MN) as described previously (Hoffseth et al., 2021a). Young’s modulus and hardness values were produced using the Oliver-Pharr model (Oliver and Pharr, 2011).
Indentations were made at 8 sites (5 distal, 3 proximal) in 2 × 2 arrays with 15 μm spacing (total N = 32) on dry digit samples embedded in polymethyl methacrylate. Sites were near to the sagittal plane intersection as possible, barring length-scale polishing limitations and local site geometry.
2.7. Statistics
Numerical and experimental results were analyzed using two-way ANOVA models for bone location (proximal or distal) and amputation status (UA or D42). To account for repeated measurements at each nanoindentation site and greater variability in measurements between mice than among measurements for the same mouse, random effects were incorporated using the R package nlme (Pinheiro, 2021). Statistical significance was assessed by testing the set of relevant contrasts (UA proximal vs distal, D42 proximal vs distal, and UA distal vs D42 distal) with adjustment for multiple comparisons using the R package mult-comp (Hothorn et al., 2008). Numerically calculated Young’s modulus values were reduced to 1000 values per digit and location via random sampling. Local polynomial regression curves were fit to the full set of calculated Young’s modulus values for each digit as a function of location using the R function “loess” with span parameter set to 0.33.
3. Results
Values for E (Young’s modulus) were determined through numerical calculation and validated through nanoindentation for all 6 digits, with subdivision into two categories, D42 and UA. Experimental nanoindentation measurement of E returned 32 measurements total for each digit in regionally specific locations (proximal and distal) to validate and compare with numerical values. Experimental E and H (hardness) values were compared between the proximal and distal areas of the bone and between the unamputated and regenerated sample groups, seen in both Fig. 2 and Table 1. H values may be found in the Appendix A. Experimental E and H values showed no significant difference between the proximal and distal areas of the unamputated digit, however in a regenerated digit the E values were lower in the distal regenerated bone than in the proximal uninjured stump (p < 0.001, 95 % CI [0.93, 3.78]), and similar for H (p < 0.001, 95 % CI [0.05, 0.18]). A comparison between groups shows that the E values for the distal region in regenerated bone are also significantly lower than those in an unamputated digit (p < 0.001, 95 % CI [−2.95, −1.02]), with similar trend for H (p < 0.001, 95 % CI [−0.15, −0.06]).
Fig. 2.

Comparison of calculated Young’s modulus values from all four μCT density-modulus relationships (Eq. (1), Eq. (2), Eq. (3), Eq. (4), respectively) with those measured by nanoindentation experiment (NI), for mean values of A) whole UA digits (N = 3); B) UA proximal regions (N = 3); C) UA distal regions (N = 3); D) whole D42 digits (N = 3); E) D42 proximal regions (N = 3); and F) D42 distal regions (N = 3). Error bars indicate standard deviation. Eq. (4) shows best overall agreement with experimentally measured values.
Table 1.
Mean Young’s modulus values for whole digits. Values from μCT calculations (density-modulus relation (4)) and nanoindentation experiments, with standard deviation in parenthesis and sample numbers N.
| Young’s Modulus, GPa |
||||
|---|---|---|---|---|
| Sample | Calculated | N | Experiment | N |
| D42 233 | 15.789 (2.799) | 109,671 | 16.612 (3.103) | 32 |
| D42 234 | 16.067 (2.915) | 87,763 | 15.496 (2.559) | 32 |
| D42 235 | 14.959 (2.647) | 115,338 | 15.829 (2.235) | 32 |
| UA 233 | 16.634 (2.738) | 97,903 | 16.453 (2.242) | 32 |
| UA 234 | 17.447 (3.046) | 96,547 | 15.263 (1.994) | 32 |
| UA 235 | 17.224 (2.718) | 115,164 | 18.354 (2.476) | 32 |
Numerically calculated E values (Eqs. (1)–(4)) were compared to nanoindentation-derived values, (Fig. 2). Calculated average E values for whole digits are displayed in Table 1, compared to those from experimental measurement. The hydroxyapatite-to-ash density relationship (Eq. (4)) showed the best agreement across all digit groups with an average error of 5.3 % (Distal/Proximal for UA/D42), for given imaging and experimental parameters, and was thus used for further analysis.
Numerically calculated E values identified spatial changes that nanoindentation results did not. Analysis identified an increase in the E values in the distal end of the unamputated digit (p < 0.001, 95 % CI proximal–distal [−3.52, −3.27]), as well as confirmed decreases in the distal end of the D42 regenerated bone as compared to both the proximal stump (p < 0.001, 95 % CI [0.04, 1.20]), and the distal unamputated tip (p < 0.001, 95 % CI [5.64, 5.90]).
Spatial variation of calculated E values in the proximal and distal regions of UA and D42 digits can be seen in Fig. 3. Fig. 3a shows voxel calculated E values versus position along proximodistal axis for all UA digits, with Fig. 3b showing the same for all D42 digits. A local polynomial regression curve demonstrates the proximodistal variation in trend of E. Comparing Fig. 3a and Fig. 3b, the rising trend of the distal region in the UA digits contrasts with the values of the D42 digits distal region, which displays a neutral or slight downward trend, and wider distribution. Spatial visualization of E values is shown through 3D-reconstructed digit structures in Fig. 4, for both UA and D42 representative digits. Overall, spatial representation of E values shows increased heterogeneity in the distal regenerated bone as compared to both the stump and the original uninjured bone.
Fig. 3.
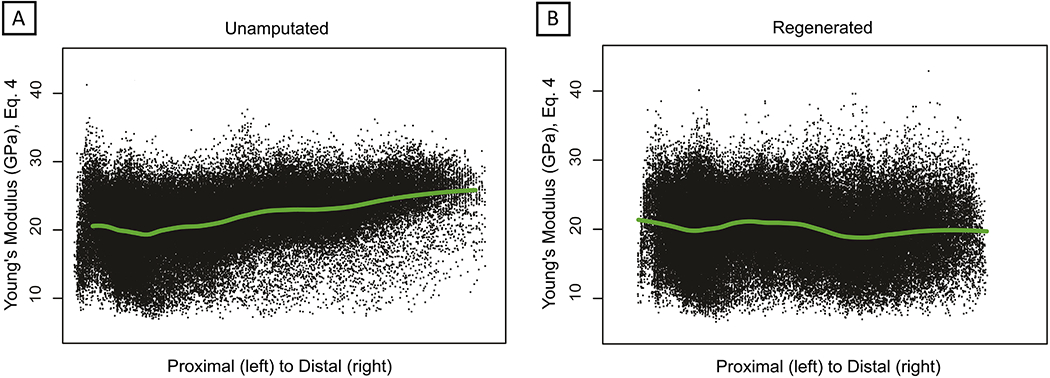
Plotting of numerically calculated A) Unamputated and B) Regenerated Young’s modulus values versus proximal to distal distance. Local polynomial regression curve indicated in green, indicating the trend in modulus value from proximal to distal. (For interpretation of the references to colour in this figure legend, the reader is referred to the web version of this article.)
Fig. 4.

Young’s Modulus (E, units of GPa) values in 3D with intensity reflecting magnitude as shown, calculated from mineral density data measured through μCT imaging, with Eq. (4). Whole digit rendering is displays of A) unamputated and B) regenerated representative digits, and planar vertical slices along the proximal to distal axis are used to create cross-sections of the same C) unamputated and D) regenerated digits.
4. Discussion
Quantification of bone mechanical properties is essential for assessing treatments aimed at improving overall bone quality. Equally important are methods to overcome analytical challenges in animal models such as the mouse digit amputation model. The research presented here combines semi-automatic methods of μCT image processing and densiometric-based numerical calculation to predict spatially distinct Young’s modulus values in regenerated bone, with validation shown through agreement with nanoindentation measurements. This allows improved analysis of the structural quality of regenerated bone in the mouse digit model, including 3D visualization of rebuilding bone, and provides a predictive method with statistically relevant sensitivity that was limited by scale-associated approaches to mechanical testing.
Collectively, these results highlight the importance of using predictive modeling to assess the biomechanics of regenerated bone, and underscores the utility of densiometric relationships in qCT studies. While nanoindentation has some limitations, including possible alteration of the sample during the freezing and embedding process, our data is another step towards improving whole sample analysis of non-standard bones.
Comparing calculated results for distal and proximal regions shows that UA digits appear to have a higher Young’s modulus near the distal tip as opposed to the proximal end near the joint, whereas D42 regenerated bone lacks the same trend, instead showing a decline in values. Experimental hardness values exhibit a similar pattern. Together these data indicate that newly regenerated bone may be less able to resist deformation and failure, and is curious in light of the fact that we recently showed an increase in mineral density values in newly regenerated bone (Hoffseth et al., 2021b). This may be due to a difference in bone tissue organization, where a lower hierarchical length scale has shown more variation in density-modulus correlation (Nobakhti and Shefelbine, 2018), and where lamellar bone also may show local variation in properties, due anisotropy and local orientation versus loading (Currey, 2002; Reisinger et al., 2011). Tissue organization may also explain small differences between calculated and experimental values of E in bone with assumption of isotropic elasticity during analysis. A larger sample size in future work may help unravel trends in the data, and when paired with additional age data points may broaden applicability of the numerical modelling.
The mouse digit regeneration model was chosen for its value in determining differences between regenerated and non-regenerated bone, with unique challenges to more detailed structural analysis. Following the qCT-FE path to finite element analysis in the future holds potential for further analysis in subsequent work, with the link between μCT based calculation and experimental assessment of E now established in the mouse digit model of skeletal regeneration.
5. Conclusion
This work demonstrates and validates use of select density-modulus relations in the calculation of Young’s modulus for regenerated mouse digit bone based on μCT imaging, and allows for improved evaluation and analysis of structural quality when assessing bone regrowth success. A common variation of the power law density-modulus relation used in qCT-FE methods returned best agreement with experimental nanoindentation results. Spatially rendering values throughout the 3D digit allows more powerful analysis and visualization of the bone structure, with regenerated bone displaying lower Young’s modulus and hardness values than uninjured bone.
Acknowledgements
Funding was provided by a research grant from the National Institute of General Medical Sciences P20GM103629 (Sammarco), and support from Louisiana State University (Hoffseth).
Appendix A
See the Table A1, Table A2, Table A3.
Table A1.
Mean hardness values (GPa) measured by nanoindentation experiment. Values for overall digit (N = 32), proximal region only (N = 12), and distal region only (N = 20), with standard deviation in parentheses.
| Hardness, GPa |
|||
|---|---|---|---|
| Sample | Digit | Proximal | Distal |
| D42 233 | 0.597 (0.143) | 0.694 (0.102) | 0.538 (0.133) |
| D42 234 | 0.613 (0.115) | 0.661 (0.055) | 0.584 (0.132) |
| D42 235 | 0.591 (0.121) | 0.667 (0.116) | 0.546 (0.101) |
| UA 233 | 0.640 (0.113) | 0.630 (0.098) | 0.646 (0.123) |
| UA 234 | 0.628 (0.099) | 0.614 (0.140) | 0.637 (0.067) |
| UA 235 | 0.717 (0.108) | 0.729 (0.074) | 0.709 (0.125) |
Table A2.
Mean Young’s modulus values (GPa) measured by nanoindentation experiment. Values for overall digit (N = 32), proximal region only (N = 12), and distal region only (N = 20), with standard deviation in parentheses.
| Young’s Modulus, GPa |
|||
|---|---|---|---|
| Sample | Digit | Proximal | Distal |
| D42 233 | 16.612 (3.103) | 18.747 (2.598) | 15.337 (2.686) |
| D42 234 | 15.496 (2.559) | 16.726 (1.149) | 14.759 (2.899) |
| D42 235 | 15.829 (2.235) | 16.899 (2.069) | 15.189 (2.125) |
| UA 233 | 16.453 (2.242) | 15.781 (1.861) | 16.856 (2.396) |
| UA 234 | 15.263 (1.994) | 14.319 (2.236) | 15.980 (1.584) |
| UA 235 | 18.354 (2.476) | 18.241 (2.175) | 18.422 (2.693) |
Table A3.
Parameters of μCT imaging used in measurement of digits.
|
μCT Parameters |
|
|
|---|---|---|
| Parameter | Value | |
| Bruker SkySkan 1172 | power | 50 kV, 201 μA |
| resolution | 2 K | |
| isotropic voxel size | 3.9 μm | |
| rotation angle | 0.2 | |
| beam hardening correction | 24 %, no smoothing | |
| dynamic range | 0.00–0.339 |
Footnotes
CRediT authorship contribution statement
Kevin F. Hoffseth: Conceptualization, Data curation, Formal analysis, Investigation, Methodology, Software, Visualization, Supervision, Project administration, Writing – original draft, Writing – review & editing. Emily Busse: Data curation. Michelle Lacey: Formal analysis, Software. Mimi C. Sammarco: Conceptualization, Formal analysis, Funding acquisition, Supervision, Project administration, Writing – original draft, Writing – review & editing.
Declaration of Competing Interest
The authors declare that they have no known competing financial interests or personal relationships that could have appeared to influence the work reported in this paper.
References
- Borgens RB, 1982. Mice regrow the tips of their foretoes. Science 217, 747–750. [DOI] [PubMed] [Google Scholar]
- Brockes JP, Kumar A, 2005. Appendage regeneration in adult vertebrates and implications for regenerative medicine. Science 310, 1919–1923. [DOI] [PubMed] [Google Scholar]
- Bryant SV, Endo T, Gardiner DM, 2002. Vertebrate limb regeneration and the origin of limb stem cells. Int. J. Dev. Biol 46, 887–896. [PubMed] [Google Scholar]
- Busse E, Simkin J, Marrero L, Stewart K, Brunauer R, Muneoka K, Guntur A, Lacey M, Sammarco M, 2019. Sirtuin 3 deficiency does not impede digit regeneration in mice. Sci. Rep 9, 16491. [DOI] [PMC free article] [PubMed] [Google Scholar]
- Currey J, 2002. Bones: Structure and Mechanics. Princeton University Press. [Google Scholar]
- Dawson LA, Yu L, Yan M, Marrero L, Schanes PP, Dolan C, Pela M, Petersen B, Han M, Muneoka K, 2017. The periosteal requirement and temporal dynamics of BMP2-induced middle phalanx regeneration in the adult mouse. Regeneration (Oxf) 4, 140–150. [DOI] [PMC free article] [PubMed] [Google Scholar]
- Douglas BS, 1972. Conservative management of guillotine amputation of the finger in children. Australian Paediatric J. 8, 86–89. [DOI] [PubMed] [Google Scholar]
- Eberle S, Gottlinger M, Augat P, 2013a. Individual density-elasticity relationships improve accuracy of subject-specific finite element models of human femurs. J. Biomech 46, 2152–2157. [DOI] [PubMed] [Google Scholar]
- Eberle S, Gottlinger M, Augat P, 2013b. An investigation to determine if a single validated density-elasticity relationship can be used for subject specific finite element analyses of human long bones. Med. Eng. Phys 35, 875–883. [DOI] [PubMed] [Google Scholar]
- Edwards WB, Schnitzer TJ, Troy KL, 2013. Torsional stiffness and strength of the proximal tibia are better predicted by finite element models than DXA or QCT. J. Biomech 46, 1655–1662. [DOI] [PMC free article] [PubMed] [Google Scholar]
- Fernando WA, Leininger E, Simkin J, Li N, Malcom CA, Sathyamoorthi S, Han M, Muneoka K, 2011. Wound healing and blastema formation in regenerating digit tips of adult mice. Dev. Biol 350, 301–310. [DOI] [PMC free article] [PubMed] [Google Scholar]
- Han M, Yang X, Lee J, Allan CH, Muneoka K, 2008. Development and regeneration of the neonatal digit tip in mice. Dev. Biol 315, 125–135. [DOI] [PMC free article] [PubMed] [Google Scholar]
- Hoffler CE, Guo XE, Zysset PK, Goldstein SA, 2005. An application of nanoindentation technique to measure bone tissue Lamellae properties. J. Biomech. Eng 127, 1046–1053. [DOI] [PubMed] [Google Scholar]
- Hoffseth K, Busse E, Jaramillo J, Simkin J, Lacey M, Sammarco MC, 2021a. Age-Dependent Changes in Bone Architecture, Patterning, and Biomechanics During Skeletal Regeneration. Front. Cell Dev. Biol 2874. [DOI] [PMC free article] [PubMed] [Google Scholar]
- Hoffseth KF, Simkin J, Busse E, Stewart K, Watt J, Chappie A, Hargrove A, Sammarco MC, 2021b. A new approach to analyzing regenerated bone quality in the mouse digit amputation model using semi-automatic processing of microCT data. Bone 144, 115776. [DOI] [PMC free article] [PubMed] [Google Scholar]
- Hothorn T, Bretz F, Westfall P, 2008. Simultaneous inference in general parametric models. Biom. J 50, 346–363. [DOI] [PubMed] [Google Scholar]
- Illingworth CM, 1974. Trapped fingers and amputated finger tips in children. J. Pediatr. Surg 9, 853–858. [DOI] [PubMed] [Google Scholar]
- Knowles NK, Reeves JM, Ferreira LM, 2016. Quantitative Computed Tomography (QCT) derived Bone Mineral Density (BMD) in finite element studies: a review of the literature. J. Exp. Orthop 3, 36. [DOI] [PMC free article] [PubMed] [Google Scholar]
- Maruyama N, Shibata Y, Mochizuki A, Yamada A, Maki K, Inoue T, Kamijo R, Miyazaki T, 2015. Bone micro-fragility caused by the mimetic aging processes in alpha-klotho deficient mice: in situ nanoindentation assessment of dilatational bands. Biomaterials 47, 62–71. [DOI] [PubMed] [Google Scholar]
- Mora-Macias J, Pajares A, Miranda P, Dominguez J, Reina-Romo E, 2017. Mechanical characterization via nanoindentation of the woven bone developed during bone transport. J. Mech. Behav. Biomed. Mater 74, 236–244. [DOI] [PubMed] [Google Scholar]
- Nishiyama KK, Gilchrist S, Guy P, Cripton P, Boyd SK, 2013. Proximal femur bone strength estimated by a computationally fast finite element analysis in a sideways fall configuration. J. Biomech 46, 1231–1236. [DOI] [PubMed] [Google Scholar]
- Nobakhti S, Shefelbine SJ, 2018. On the relation of bone mineral density and the elastic modulus in healthy and pathologic bone. Curr. Osteoporosis Reports 16, 404–410. [DOI] [PubMed] [Google Scholar]
- Oliver W, Pharr G, 2011. Measurement of hardness and elastic modulus by instrumented indentation: Advances in understanding and refinements to methodology. J. Mater. Res 19. [Google Scholar]
- Pepe V, Oliviero S, Cristofolini L, Dall’Ara E, 2020. Regional Nanoindentation Properties in Different Locations on the Mouse Tibia From C57BL/6 and Balb/C Female Mice. Front. Bioeng. Biotechnol 8, 478. [DOI] [PMC free article] [PubMed] [Google Scholar]
- Pinheiro J, 2021. nlme: Linear and Nonlinear Mixed Effects Models, pp. Fit and compare Gaussian linear and nonlinear mixed-effects models.
- Ramachandran P, Varoquaux G, 2011. Mayavi: 3D visualization of scientific data. Gomput. Sci. Eng 13, 40–51. [Google Scholar]
- Reisinger AG, Pahr DH, Zysset PK, 2011. Elastic anisotropy of bone lamellae as a function of fibril orientation pattern. Biomech. Model. Mechanobiol 10, 67–77. [DOI] [PubMed] [Google Scholar]
- Rodriguez-Florez N, Oyen ML, Shefelbine SJ, 2013. Insight into differences in nanoindentation properties of bone. J. Mech. Behav. Biomed. Mater 18, 90–99. [DOI] [PubMed] [Google Scholar]
- Rossum GV, 1995. Python tutorial, Technical Report CS-R9526. Centrum voor Wiskunde en Informatica (CWI), Amsterdam. [Google Scholar]
- Said S, Parke W, Neufeld DA, 2004. Vascular supplies differ in regenerating and nonregenerating amputated rodent digits. The anatomical record. Part A, Discoveries in molecular. Cellular, Evolution. Biol 278, 443–449. [DOI] [PubMed] [Google Scholar]
- Sammarco MC, Simkin J, Fassler D, Cammack AJ, Wilson A, Van Meter K, Muneoka K, 2014. Endogenous bone regeneration is dependent upon a dynamic oxygen event. J. Bone Mineral Res.: Off. J. Am. Soc. Bone Mineral Res 29, 2336–2345. [DOI] [PMC free article] [PubMed] [Google Scholar]
- Sammarco MC, Simkin J, Cammack AJ, Fassler D, Gossmann A, Marrero L, Lacey M, Van Meter K, Muneoka K, 2015. Hyperbaric Oxygen Promotes Proximal Bone Regeneration and Organized Collagen Composition during Digit Regeneration. PLoS ONE 10, e0140156. [DOI] [PMC free article] [PubMed] [Google Scholar]
- Simkin J, Sammarco MC, Dawson LA, Schanes PP, Yu L, Muneoka K, 2015. The mammalian blastema: regeneration at our fingertips. Regeneration 2, 93–105. [DOI] [PMC free article] [PubMed] [Google Scholar]
- Simkin J, Sammarco MC, Marrero L, Dawson LA, Yan M, Tucker C, Cammack A, Muneoka K, 2017. Macrophages are required to coordinate mouse digit tip regeneration. Development 144, 3907–3916. [DOI] [PMC free article] [PubMed] [Google Scholar]
- Singer M, Weckesser EC, Geraudie J, Maier CE, Singer J, 1987. Open finger tip healing and replacement after distal amputation in rhesus monkey with comparison to limb regeneration in lower vertebrates. Anat. Embryol 177, 29–36. [DOI] [PubMed] [Google Scholar]
- Vanleene M, Porter A, Guillot PV, Boyde A, Oyen M, Shefelbine S, 2012. Ultrastructural defects cause low bone matrix stiffness despite high mineralization in osteogenesis imperfecta mice. Bone 50, 1317–1323. [DOI] [PMC free article] [PubMed] [Google Scholar]