

Abstract
Hemochromatosis is a hereditary disorder, most often associated with mutations of the HFE (High FErrum) gene. If left untreated, it can result in severe parenchymal iron accumulation. Bloodletting is the mainstay treatment. We have previously shown that treatment of hemochromatosis by repeated bloodlettings may induce changes in the serum levels of several trace elements. The aim of this work was to evaluate if whole blood concentrations of the environmental pollutants lead (Pb), mercury (Hg), and cadmium (Cd) could be affected by bloodlettings. We recruited 28 patients and 21 healthy individuals (control group). Whole blood and urine levels of Pb, Hg, and Cd were measured before the start and after the completion of treatment using inductively coupled plasma mass spectrometry, together with serum iron and liver function tests. Concentrations of blood Pb, but not Hg or Cd, were significantly increased after treatment. The increase in Pb was higher in C282Y homozygous patients than in the other patients, and it was positively correlated with the serum concentration of alkaline phosphatase. Bloodlettings in hemochromatosis result in an increase in the blood concentration of Pb. Augmented absorption due to iron loss or Pb mobilization from bone may contribute to the higher blood Pb level.
Supplementary Information
The online version contains supplementary material available at 10.1007/s12011-022-03424-y.
Keywords: Hemochromatosis, Bloodletting, Trace elements, Lead, Mercury, Cadmium
Introduction
Hemochromatosis is an inherited iron overload disorder characterized by excessive absorption of iron caused by deficiency of hepcidin [1]. It is the most common hereditary disorder in the Nordic countries [2]. Permanently increased iron (Fe) uptake from the gut results in iron accumulation and overload, leading to severe parenchymal damage, particularly in the liver and the heart, joints, and other organs [3]. If left untreated, the disorder may result in a lethal outcome.
Different types of hereditary hemochromatosis are defined by the specific mutation involved [3]. In most cases, the disorder is associated with mutations of the High FErrum (HFE) gene. Homozygosity for C282Y is the most prevalent variant in patients with symptoms, although other variants like H63D homozygosity or compound heterozygosity C282Y/H63D may contribute to disease manifestations [4]. Routine treatment involves bloodlettings of 450–500 mL weekly, up to 20–40 times, to remove excess iron from the body. After normalization of iron parameters, patients need maintenance blood lettings throughout their lives [5, 6].
The pathogenetic mechanisms of hemochromatosis are not fully understood. The genetic mutations have variable phenotypic penetrance, and the development of clinical symptoms seems to be modulated by yet unknown factors [6, 7]. Although it is not a gender-specific disease, the symptoms occur more often in male patients [8]. In women, clinical symptoms are usually presented later because of blood loss experienced with menstruation and childbirth.
Multiple interrelationships between serum levels of iron and various trace elements have been demonstrated [9, 10]. Disturbances in iron metabolism may affect the metabolism of metals other than iron [9, 11–14]. Iron-binding proteins like transferrin and ferritin can bind other metals in addition to iron [15–20].
Barton et al. [21] found that hemochromatosis patients, especially homozygotes, absorb increased quantities of lead. In contrast, Åkesson [12] demonstrated that blood concentrations of cadmium, but not lead, were significantly higher in bloodletted hemochromatosis patients than in paired controls. The reason for this discrepancy is not clear. Beyond these and our previous study [22], we have found no other report on the effects of bloodlettings on trace element status in hemochromatosis patients.
The aim of this study was to see if bloodlettings in hemochromatosis patients affect whole blood concentrations of the environmental pollutants lead (Pb), mercury (Hg), and cadmium (Cd). We recruited untreated patients and compared pre-phlebotomy blood concentrations with post-phlebotomy values in the same individuals using a prospective, pairwise design. In addition, a group of healthy persons without hemochromatosis and not subject to bloodlettings were included as controls.
Materials and Methods
Reagents
Seronorm™ Trace Elements Whole Blood controls were obtained from SERO AS (Billingstad, Norway). HNO3 and Triton® X-100 were purchased from Merck (KGaA, Darmstadt, Germany) and gold from PerkinElmer Inc. (Shelton, Connecticut, USA).
Subject Selection
Twenty-eight patients and twenty-one healthy individuals (controls) were recruited (Fig. 1). For prospective pairwise comparisons, samples from the patients were analyzed before the start and after the completion of treatment (bloodlettings) aimed at normalizing serum iron parameters. Exclusion criteria were age less than 18 years, other bloodletting or transfusion within the last 3 months, concurrent disease, pregnancy, installed osteosynthesis materials (e.g., after fractures), or other metal items.
Fig. 1.
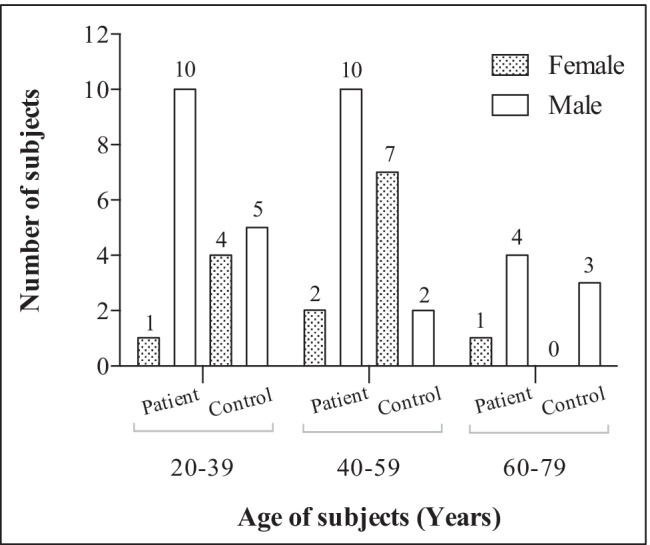
Age and sex distribution of subjects
Informed Consent
The study was approved by the Regional Committee for Medical and Health Research Ethics, Western Norway (REC no. 220.05). Informed consent was obtained from patients referred by their doctors to the hemochromatosis outpatients’ clinics at Haukeland University Hospital, Bergen and Oslo University Hospital, Oslo, Norway, and from control persons.
Blood and Urine Collection
All the patients were treated with venesection of 450 mL blood either weekly or every alternate week until normalization of iron parameters, which could take up to 24 bloodlettings. Blood samples were collected for trace element and hematological analyses and serum samples for iron status and clinical chemistry measurements. Urine samples were also collected for most of the patients. Clinical chemistry and hematological analyses were done as described previously [22]. Transferrin iron saturation (Tfsat) was calculated as the molar ratio between serum iron and total iron binding capacity (TIBC).
Trace Element Analysis and Analytical Quality Control
Whole blood samples were collected on BD Vacutainer K2 EDTA Trace Elements (Puls Norge, Oslo). Prior to analysis, the samples were diluted 1:25 with 0.33% v/v (volume per volume) HNO3, 0.1% v/v Triton® X-100, and 0.5 ppm gold. Trace elements were measured by inductively-coupled plasma mass spectrometry (ICP-MS) on Perkin Elmer ELAN DRC-e (PerkinElmer, Toronto, Canada) using a standard mode [22, 23]. The lower limits of quantification (LQ) were defined as five times the within-day analytical standard deviation, as determined by 20 measurements in a sample pool—this gives a theoretical coefficient of variation of 20% for LQ [24]. LQ for Pb, Hg, and Cd was 0.01 μmol/L, 4.7 nmol/L, and 1.6 nmol/L, respectively.
The between-run analytical coefficients of variation for Pb, Hg, and Cd, as determined in Seronorm Trace Elements Wholeblood Level 1, were 3%, 10%, and 10%, respectively. All analyses complied with assigned values for Seronorm Trace Elements Wholeblood Level 1, 2, and 3. Urine metal concentrations are given as the molar ratio urine metal/urine creatinine concentration [25].
Statistical Analysis
The concentrations of trace elements and other variables before the start and after the completion of treatment were compared using related samples Wilcoxon signed-rank test. All paired analyses were done in the same analytical run. Correlation coefficients were calculated as Spearman’s rho. Other comparisons were done as stated to the text and tables. In our calculations, the genotypes were dichotomized to C282Y homozygote vs. all other genotypes. All statistical analyses were performed with IBM SPSS Statistics Version 25 (IBM Corp., Armonk, NY). GraphPad Prism 6.0 for Mac (GraphPad Software, San Diego, CA, USA) was used for preparing the figures.
Results
Figure 1 and Supplementary Table 1 present the subject demographics. As could be expected [8], the number of male patients (n = 24) was higher than that of female patients (n = 4), in contrast to the control group (males = 10; females = 11). The age group of 60–79 years presented the lowest number of participants for both the patient group (n = 5) and the control group (n = 3). The group-wise scatter plots of blood Pb, Cd, and Hg by age are shown in Supplementary Fig. 1.
Genotypes of the patients are shown in Fig. 2. Half of the patients had C282Y mutation (homozygote = 13; heterozygote = 1). Two male patients had raised iron parameters but no HFE mutation; in these cases, the clinical diagnosis of hemochromatosis with iron overload was confirmed by tolerance to repeated therapeutic bloodlettings.
Fig. 2.
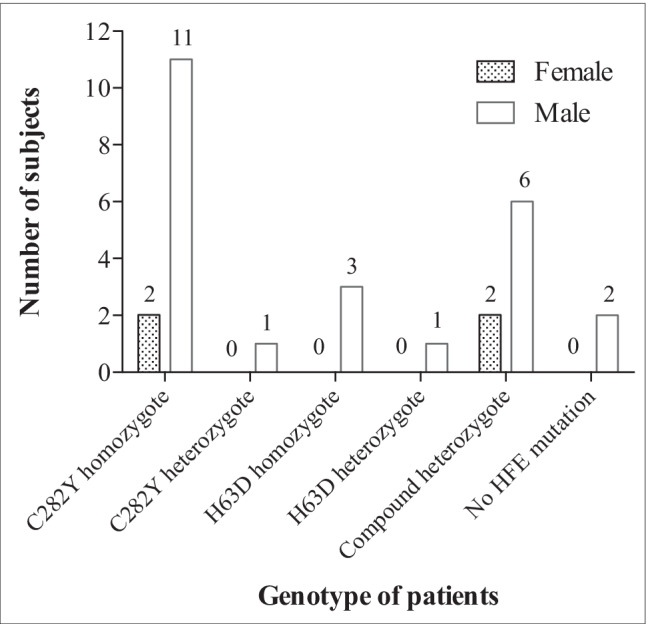
Distribution of genotypes by gender
Table 1 summarizes the correlations among iron status (as represented by ferritin), hemoglobin (Hb), and clinical chemistry variables in the patients before and after the treatment, as well as those in the control group. In patients not yet subjected to bloodletting, ferritin levels were significantly correlated with Hb (r = 0.439), gamma-glutamyltransferase (GGT, r = 0.610), and alanine aminotransferase (ALT, r = 0.791). After bloodlettings, a significant correlation to ferritin was found for only creatinine (r = − 0.407). In the control group, there were significant positive correlations of ferritin with three parameters: Hb (r = 0.515), GGT (r = 0.468), and alkaline phosphatase (ALP, r = 0.593).
Table 1.
Correlations among variables. Correlation (Spearman’s rho coefficients) of serum ferritin with Hb and liver function test parameters in patients before and after bloodletting and in the control group
| Bloodletted? | n | Hb | Creatinine | GGT | ALT | ALP | |
|---|---|---|---|---|---|---|---|
| Ferritin | No | 28 | 0.439* | 0.477 | 0.610** | 0.791** | 0.351 |
| Yes | 28 | 0.294 | − 0.407* | 0.356 | − 0.262 | − 0.192 | |
| Control | 21 | 0.515* | 0.168 | 0.468* | 0.410 | 0.593** |
*p < 0.05
**p < 0.01
The significant p values have been highlighted in bold fonts
Correlations of the abovementioned variables with trace elements are shown in Table 2. Before bloodlettings, significantly positive associations were observed between Pb and the liver enzymes GGT (r = 0.477) and ALP (r = 0.388). Of these, only the correlation between Pb and ALP (r = 0.465) persisted after bloodlettings. There was no significant correlation between Pb and iron status. There were negative correlations of Hg levels with some iron parameters, and Hg levels were significantly correlated with serum creatinine levels in all the groups. Cd was negatively correlated with TIBC both before (r = − 0.593) and after (r = − 0.615) the bloodlettings. These and other correlations are shown in Table 2.
Table 2.
Correlations among variables. Correlation (Spearman’s rho coefficients) of trace metal concentrations with Hb, liver function test parameters, and iron profiles in patients before and after bloodletting and in the control group
| Bloodletted? | n | Iron | TIBC | Ferritin | Hb | Tfsat | Creat | GGT | ALT | ALP | |
|---|---|---|---|---|---|---|---|---|---|---|---|
| Pb | No | 28 | − 0.269 | 0.120 | 0.195 | 0.329 | − 0.308 | 0.095 | 0.477* | 0.194 | 0.388* |
| Yes | 28 | − 0.028 | − 0.230 | − 0.008 | 0.450* | − 0.070 | − 0.092 | 0.152 | − 0.013 | 0.465* | |
| Control | 20 | 0.307 | 0.161 | − 0.037 | 0.145 | 0.300 | 0.120 | 0.397 | 0.451* | 0.217 | |
| Hg1 | No | 22 | − 0.510* | 0.232 | 0.016 | 0.249 | − 0.481* | 0.431* | 0.401 | 0.111 | 0.032 |
| Yes | 22 | 0.108 | 0.202 | − 0.445* | 0.056 | − 0.014 | 0.614** | 0.453* | − 0.006 | 0.231 | |
| Control | 16 | − 0.031 | − 0.187 | 0.394 | 0.436 | 0.124 | 0.538* | 0.438 | 0.530* | 0.436 | |
| Cd1 | No | 18 | − 0.119 | − 0.593** | 0.138 | 0.287 | 0.007 | 0.043 | 0.081 | 0.050 | 0.542* |
| Yes | 20 | − 0.255 | − 0.615** | − 0.078 | − 0.015 | − 0.070 | − 0.001 | − 0.109 | 0.011 | 0.376 | |
| Control | 8 | 0.310 | 0.108 | − 0.357 | 0.190 | 0.286 | − 0.071 | 0.263 | 0.095 | 0.095 |
*p < 0.05
**p < 0.01
1Results below limit of quantification excluded
The significant p values have been highlighted in bold fonts
Table 3 shows the correlations among trace elements. In the control group, the levels of Pb were significantly associated with those of Cd in the blood (r = 0.922) and urine (r = 0.693); however, in the patient group, this association was found only in the urine after treatment (r = 0.674). Blood Pb was also correlated with Hg in untreated patients (r = 0.514) and in controls (r = 0.688).
Table 3.
Correlations among variables. Correlation (Spearman’s rho coefficients) between trace metal concentrations in patients before and after bloodletting and in the control group
| Bloodletted? | Hg (n)† | Cd (n)† | ||
|---|---|---|---|---|
| Blood | Pb | No | 0.514* (22) | 0.407(18) |
| Yes | 0.182 (22) | 0.448 (20) | ||
| Control | 0.688** (16) | 0.922** (8) | ||
| Hg | No | 0.159 (15) | ||
| Yes | − 0.388 (16) | |||
| Control | 0.760 (7) | |||
| Urine | Pb | No | NA | 0.454 (15) |
| Yes | NA | 0.674** (16) | ||
| Control | 0.394 (10) | 0.693* (19) | ||
| Hg | No | NA (2) | ||
| Yes | NA (1) | |||
| Control | 0.083 (9) |
*p < 0.05
**p < 0.01
†Spearman’s rho coefficients (n)
NA, not available
Results below limit of quantification excluded
The significant p values have been highlighted in bold fonts
The results from paired comparisons of iron status, Hb levels, and clinical chemistry variables in patient and control groups are provided in Table 4 (p values in Supplementary Table 2). Iron status (iron, TIBC, ferritin, and Tfsat) of untreated patients was significantly different from controls, and bloodletting changed it significantly in the patient group. There was a significant difference between untreated patients and controls for iron status, Hb, and ALT. GGT levels differed significantly between controls and patients, both before and after treatment. As shown in Table 5, Pb in blood increased by 26% (median, p < 0.001) after the bloodlettings. In addition, Pb levels were significantly higher in the treated patients than in the control group (p values in Supplementary Table 3).
Table 4.
Paired comparisons of serum iron profiles, Hb, serum creatinine, and liver function test parameters in patients and controls

aIndependent samples Mann–Whitney U test for inter-group comparisons
bRelated samples Wilcoxon signed-rank test for paired comparisons
Letters (a or b) above groups denote significant differences. Supplementary Table 2 provides the p values
Table 5.
Paired comparisons of trace metal concentrations in patients and controls

aIndependent samples Mann–Whitney U test for inter-group comparisons
bRelated samples Wilcoxon signed-rank test for paired comparisons
cValues < LQ in u-Cd excluded
dX = Result below LQ
eValues below LQ excluded
Letters (a or b) above groups denotes significant difference. Supplementary Table 2 provides the p values
Table 6 shows the increase in blood Pb by genotypes. The increase was higher in C282Y homozygote patients than in patients with other genotypes (Table 7, p = 0.048). Among other pre-treatment variables, only ALP was significantly correlated with the increase in blood Pb (p < 0.001, Table 7). The relation between ALP and the increase in Pb is shown in Fig. 3.
Table 6.
Increase in Pb concentrations: relationships with pre-treatment variables. Increase in blood lead concentrations in subjects with different hemochromatosis genotypes (μmol/L)
| Median | Range | n | |
|---|---|---|---|
| C282Y homozygote | 0.034 | − 0.004 to 0.114 | 13 |
| C282Y heterozygote | 0.008 | 1 | |
| H63D homozygote | 0.002 | − 0.012 to 0.011 | 3 |
| H63D heterozygote | 0.000 | 1 | |
| Compound heterozygote | 0.024 | − 0.007 to 0.063 | 8 |
| No HFE mutation | 0.026 | − 0.010 to 0.062 | 2 |
| Total | 0.029 | − 0.012 to 0.114 | 28 |
Table 7.
Increase in Pb concentrations: relationships with pre-treatment variables. Correlation (Spearman’s rho coefficients) between increase in Pb and serum iron profiles, Hb, serum creatinine, liver function test parameters, and C282Y homozygote genotype
| Ferritin | Iron | TIBC | Tfsat | Hb | GGT | ALT | ALP | Creat | Genotypea | ||
|---|---|---|---|---|---|---|---|---|---|---|---|
| Increase in b-Pb | Spearman’s rho | 0.103 | 0.260 | − 0.322 | 0.321 | 0.143 | − 0.019 | − 0.062 | 0.662 | − 0.145 | 0.337 |
| p | 0.603 | 0.182 | 0.095 | 0.096 | 0.468 | 0.922 | 0.754 | < 0.001 | 0.462 | 0.048 | |
| n | 28 | 28 | 28 | 28 | 28 | 28 | 28 | 28 | 28 | 28 |
aC282Y homozygote vs. all others
The significant p values have been highlighted in bold fonts
Fig. 3.
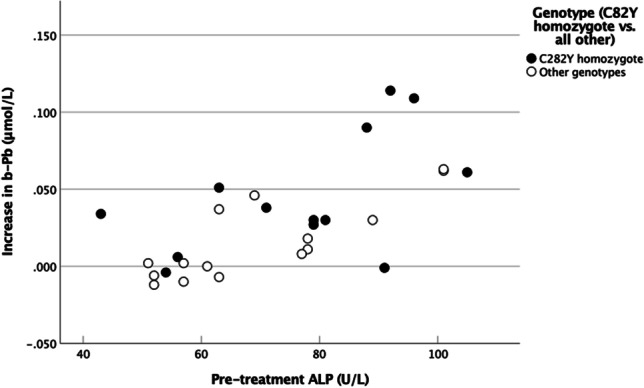
The relationship of Pb levels with pre-treatment ALP levels in blood
Discussion
Toxic Metals
In this work, we demonstrate that bloodlettings performed to eliminate iron overload in hemochromatosis patients increase the concentration of Pb in blood. The concurrent increase in the concentration of Cd was not statistically significant, whereas Hg levels were not affected by the bloodlettings (Table 5 and Supplementary Table 3). The findings are in line with those of our previous study, which showed that several other trace elements in the serum might be influenced by bloodlettings [22]. Åkesson et al. [12] observed that both Cd and Pb levels increased after phlebotomy in hemochromatosis patients; however, the increase was statistically significant only for Cd. The discrepancy between Åkesson’s and our results might have been caused by the limited number of participants in both studies. In our study, the number of male patients (n = 24) was higher than that of female patients (n = 4), such uneven gender distribution has been previously reported [8].
To our knowledge, no other publication has attempted to show the effects of bloodletting therapy on micromineral homeostasis in hemochromatosis patients. However, several investigations have revealed associations between iron and various microelements [9, 10, 26]. The observation that the blood concentration of Pb was influenced by bloodlettings (Table 5) may be partly explained by the associations between HFE mutations and blood Pb levels [27–29]. It has been reported that hemochromatosis patients, especially homozygotes, absorb increased quantities of Pb compared to normal persons [21]. In line with this, our patients with the homozygote genotype C282Y mutation presented a higher increase in blood Pb concentration than the other patients (Tables 6 and 7). The adverse health effects of Pb, even at very low blood levels, are well-known [30–34]. Although the concentrations of Pb reported in this study were low, adverse effects of increased Pb absorption or mobilization cannot be ruled out.
Hg was detected in the blood samples of all participants. In contrast to Pb, the Hg concentration was not affected by the treatment (Table 5 and Supplementary Table 3). Due to global contamination, Hg is generally present in humans. Fish and seafood are the leading sources of Hg exposure [35], especially in societies with high consumption, like the Nordic countries [36]. The median Cd concentration was higher after the bloodlettings than before in both blood and urine (Table 5 and Supplementary Table 3), although the difference was not statistically significant. However, Cd concentration in the patients was highly dispersed, much more than in the control persons. There was a significant correlation between Pb and Hg levels in the blood (Table 3). Pb was also correlated with Cd in the controls (Table 3). Correlations among Hg, Pb, and Cd in the general population have been assumed to be due to common exposure sources and accumulation in the body [37].
Cd was negatively correlated with TIBC in untreated and treated individuals (Table 2). A similar negative correlation between blood Cd and iron status was reported previously [38–41]. Cd levels may increase under iron overload conditions [42].
Liver Function Tests
Pb concentration before the bloodlettings was correlated with ALP and GGT levels (Table 2). Elevated levels of liver enzymes may be an early sign of this organ’s injury due to iron accumulation. In agreement with a previous study [4], liver enzyme levels were correlated with the ferritin level (Table 1). Moreover, ALP is related to bone disease, and Pb is known to accumulate in bones [43]. The strong correlation of pre-treatment ALP with both Pb (Table 2) and the subsequent increase in Pb levels (Table 7 and Fig. 3) may suggest that Pb is mobilized from the bones into the blood. Notably, ALP levels were not significantly altered by the bloodlettings (Table 4 and Supplementary Table 2). Interestingly, the levels of ALT, another liver enzyme, were significantly correlated with Pb levels in control persons only (Table 2). A corresponding relationship of ALT with Hg was detected (Table 2). Hg is the trace element showing a significant correlation with Pb levels in the blood (Table 3). In the control group, Pb was also correlated with Cd (Table 3). However, this did not result in a significant correlation of ALT with Cd (Table 2), possibly due to the low number of samples (n = 8).
Hg concentration was correlated with ALT levels in only the control group (Table 2). In a cohort study of healthy premenopausal women (n = 259) [44], the associations of low exposure levels to Hg and some functional biomarkers of the liver and kidney were revealed, similar to our results for GGT, ALT, and creatinine. For Cd, our study found a correlation with ALP levels (Table 2). It could be an early indication of liver injury in untreated patients [45, 46]. Cd exists in tobacco, and thus, humans are exposed to Cd through tobacco smoke [47], but we do not have complete data on the smoking status of the recruited individuals. In serum, this environmental and industrial pollutant is bound to alfa-2-macroglobulin and albumin [48]. Cd chiefly accumulates in the liver and kidneys of exposed individuals.
Creatinine concentration was the only parameter in the present study that was correlated with Hg concentration in all subjects (Table 2), although no significant difference between groups was found as a result of the bloodlettings (Table 4 and Supplementary Table 2). The kidneys are one of the main targets of Hg deposition and subsequent toxicity [49], whereas creatinine is frequently used as a biomarker of renal function [50]. Pb concentration was not significantly correlated with creatinine levels (Table 2).
Iron Metabolism
Several organs, including the duodenum, liver, and bone marrow, are involved in regulating iron metabolism [8]. Iron and other elements compete for biomolecular binding sites for transportation, e.g., DMT1, transferrin, and ferritin [17, 51, 52]. The induced duodenal absorption of iron (e.g., by bloodletting) may affect the fate of some other metals such as Pb, Cd, and Co [53–55]. In line with this, while the repeated bloodlettings removed iron from the body and normalized the iron status (Table 4), the absorption or mobilization of Pb increased (Table 5).
The strength of this work is its design, which allows pairwise comparisons of the included patients. Weaknesses include the limited number of participants for each genotype, the imbalance between genders, the absence of data on diet, medications, and lifestyle (e.g., drinking and smoking habits) of the participants, and the unavailability of data for urine Hg levels.
Conclusion
The present and previous works demonstrate that repeated bloodlettings in hemochromatosis affect the blood levels of several metals and not only iron. While serum iron declines, the effect on other metals, if any, is generally an increase in serum or whole blood levels. In the treatment of hemochromatosis, one should be aware that repeated bloodlettings may induce increased absorption or mobilization of toxic metals in the body. Whether this effect is due to increased absorption or redistribution in the body is not clear, and further studies are needed.
Supplementary Information
Below is the link to the electronic supplementary material.
Acknowledgements
We thank Tina Rosvold and Alexander Blø, Department of Medical Biochemistry and Pharmacology, Haukeland University Hospital, Bergen, Norway, for their support in sample preparation and analysis.
Author Contribution
All authors contributed to the study conception and design. Material preparation, data collection, and analysis were performed by Bjørn J. Bolann, Rune J. Ulvik, and Sonia Distante. The first draft of the manuscript was written by Bjørn J. Bolann and Mazyar Yazdani, and all authors commented on previous versions of the manuscript. All authors read and approved the final manuscript.
Funding
Open access funding provided by University of Bergen (incl Haukeland University Hospital)
Declarations
Competing Interests
The authors declare no competing interests.
Footnotes
Publisher's Note
Springer Nature remains neutral with regard to jurisdictional claims in published maps and institutional affiliations.
References
- 1.Kowdley KV, Brown KE, Ahn J, Sundaram V (2019) ACG clinical guideline: hereditary hemochromatosis. Off J Am Coll Gastroenterol 114:1202–1218 [DOI] [PubMed]
- 2.Åsberg A, Hveem K, Thorstensen K, Ellekjaer E, Kannelønning K, Fjøsne U, et al. Screening for hemochromatosis: high prevalence and low morbidity in an unselected population of 65,238 persons. Scand J Gastroenterol. 2001;36:1108–1115. doi: 10.1080/003655201750422747. [DOI] [PubMed] [Google Scholar]
- 3.Kane SF, Roberts C, Paulus R. Hereditary hemochromatosis: rapid evidence review. Am Fam Physician. 2021;104:263–270. [PubMed] [Google Scholar]
- 4.Sandnes M, Vorland M, Ulvik RJ, Reikvam H. HFE genotype, ferritin levels and transferrin saturation in patients with suspected hereditary hemochromatosis. Genes. 2021;12:1162. doi: 10.3390/genes12081162. [DOI] [PMC free article] [PubMed] [Google Scholar]
- 5.Barton JC, McDonnell SM, Adams PC, Brissot P, Powell LW, Edwards CQ, et al. Management of hemochromatosis. Ann Intern Med. 1998;129:932–939. doi: 10.7326/0003-4819-129-11_Part_2-199812011-00003. [DOI] [PubMed] [Google Scholar]
- 6.Brissot P, Troadec M-B, Bardou-Jacquet E, Le Lan C, Jouanolle A-M, Deugnier Y, et al. Current approach to hemochromatosis. Blood Rev. 2008;22:195–210. doi: 10.1016/j.blre.2008.03.001. [DOI] [PubMed] [Google Scholar]
- 7.Ganz T. Systemic iron homeostasis. Physiol Rev. 2013;93:1721–1741. doi: 10.1152/physrev.00008.2013. [DOI] [PubMed] [Google Scholar]
- 8.Harrison-Findik DD. Gender-related variations in iron metabolism and liver diseases. World J Hepatol. 2010;2:302. doi: 10.4254/wjh.v2.i8.302. [DOI] [PMC free article] [PubMed] [Google Scholar]
- 9.Barany E, Bergdahl I, Bratteby L-E, Lundh T, Samuelson G, Skerfving S, et al. Iron status influences trace element levels in human blood and serum. Environ Res. 2005;98:215–223. doi: 10.1016/j.envres.2004.09.010. [DOI] [PubMed] [Google Scholar]
- 10.Mitchell CJ, Shawki A, Ganz T, Nemeth E, Mackenzie B. Functional properties of human ferroportin, a cellular iron exporter reactive also with cobalt and zinc. Am J Physiol-Cell Physiol. 2014;306:C450–C459. doi: 10.1152/ajpcell.00348.2013. [DOI] [PMC free article] [PubMed] [Google Scholar]
- 11.Olatunbosun D, Corbett W, Ludwig J, Valberg L. Alteration of cobalt absorption in portal cirrhosis and idiopathic hemochromatosis. J Lab Clin Med. 1970;75:754–762. [PubMed] [Google Scholar]
- 12.Akesson A, Stål P, Vahter M. Phlebotomy increases cadmium uptake in hemochromatosis. Environ Health Perspect. 2000;108:289–291. doi: 10.1289/ehp.108-1638026. [DOI] [PMC free article] [PubMed] [Google Scholar]
- 13.Beckett JM, Ball MJ. Effect of hereditary haemochromatosis genotypes and iron overload on other trace elements. Eur J Nutr. 2013;52:255–261. doi: 10.1007/s00394-012-0319-3. [DOI] [PubMed] [Google Scholar]
- 14.Bjørklund G, Aaseth J, Skalny AV, Suliburska J, Skalnaya MG, Nikonorov AA, et al. Interactions of iron with manganese, zinc, chromium, and selenium as related to prophylaxis and treatment of iron deficiency. J Trace Elem Med Biol. 2017;41:41–53. doi: 10.1016/j.jtemb.2017.02.005. [DOI] [PubMed] [Google Scholar]
- 15.Wardeska J, Viglione B, Chasteen N. Metal ion complexes of apoferritin. Evidence for initial binding in the hydrophilic channels. J Biol Chem. 1986;261:6677–6683. doi: 10.1016/S0021-9258(19)62670-0. [DOI] [PubMed] [Google Scholar]
- 16.Joshi J, Sczekan S, Fleming J. Ferritin–a general metal detoxicant. Biol Trace Elem Res. 1989;21:105–110. doi: 10.1007/BF02917242. [DOI] [PubMed] [Google Scholar]
- 17.Bolann BJ, Ulvik RJ. Stimulated decay of Superoxide caused by ferritin-bound copper. FEBS Lett. 1993;328:263–267. doi: 10.1016/0014-5793(93)80940-V. [DOI] [PubMed] [Google Scholar]
- 18.Smith TAD. Human serum transferrin cobalt complex: stability and cellular uptake of cobalt. Bioorg Med Chem. 2005;13:4576–4579. doi: 10.1016/j.bmc.2005.04.052. [DOI] [PubMed] [Google Scholar]
- 19.Chahine J-MEH, Hémadi M, Ha-Duong N-T. Uptake and release of metal ions by transferrin and interaction with receptor 1. BBA-Gen Subj. 2012;1820:334–347. doi: 10.1016/j.bbagen.2011.07.008. [DOI] [PubMed] [Google Scholar]
- 20.Laghaei R, Evans DG, Coalson RD. Metal binding sites of human H-chain ferritin and iron transport mechanism to the ferroxidase sites: a molecular dynamics simulation study. Proteins: Struct, Funct, Bioinf. 2013;81:1042–1050. doi: 10.1002/prot.24251. [DOI] [PubMed] [Google Scholar]
- 21.Barton JC, Patton MA, Edwards CQ, Griffen LM, Kushner JP, Meeks RG, et al. Blood lead concentrations in hereditary hemochromatosis. J Lab Clin Med. 1994;124:193–198. [PubMed] [Google Scholar]
- 22.Bolann BJ, Distante S, Mørkrid L, Ulvik RJ. Bloodletting therapy in hemochromatosis: does it affect trace element homeostasis? J Trace Elem Med Biol. 2015;31:225–229. doi: 10.1016/j.jtemb.2014.07.021. [DOI] [PubMed] [Google Scholar]
- 23.Yang HS, LaFrance DR, Hao Y. Elemental testing using inductively coupled plasma mass spectrometry in clinical laboratories: an ACLPS critical review. Am J Clin Pathol. 2021;156:167–175. doi: 10.1093/ajcp/aqab013. [DOI] [PubMed] [Google Scholar]
- 24.Magnusson B, Örnemark U (eds) (2014) Eurachem guide: the fitness for purpose of analytical methods - a laboratory guide to method validation and related topics, 2nd edn. Available from www.eurachem.org
- 25.Hsieh C-Y, Wang S-L, Fadrowski JJ, Navas-Acien A, Kuo C-C. Urinary concentration correction methods for arsenic, cadmium, and mercury: a systematic review of practice-based evidence. Curr Environ Health Rep. 2019;6:188–199. doi: 10.1007/s40572-019-00242-8. [DOI] [PubMed] [Google Scholar]
- 26.Rahil-Khazen R, Bolann BJ, Ulvik RJ. Correlations of trace element levels within and between different normal autopsy tissues analyzed by inductively coupled plasma atomic emission spectrometry (ICP-AES) Biometals. 2002;15:87–98. doi: 10.1023/A:1013197120350. [DOI] [PubMed] [Google Scholar]
- 27.Hopkins MR, Ettinger AS, Hernández-Avila M, Schwartz J, Téllez-Rojo MM, Lamadrid-Figueroa H, et al. Variants in iron metabolism genes predict higher blood lead levels in young children. Environ Health Perspect. 2008;116:1261–1266. doi: 10.1289/ehp.11233. [DOI] [PMC free article] [PubMed] [Google Scholar]
- 28.Fan G, Du G, Li H, Lin F, Sun Z, Yang W, et al. The effect of the hemochromatosis (HFE) genotype on lead load and iron metabolism among lead smelter workers. PLoS ONE. 2014;9:e101537. doi: 10.1371/journal.pone.0101537. [DOI] [PMC free article] [PubMed] [Google Scholar]
- 29.Loréal O, Cavey T, Bardou-Jacquet E, Guggenbuhl P, Ropert M, Brissot P. Iron, hepcidin, and the metal connection. Front Pharmacol. 2014;5:128. doi: 10.3389/fphar.2014.00128. [DOI] [PMC free article] [PubMed] [Google Scholar]
- 30.Lanphear BP, Hornung R, Khoury J, Yolton K, Baghurst P, Bellinger DC, et al. Low-level environmental lead exposure and children’s intellectual function: an international pooled analysis. Environ Health Perspect. 2005;113:894–899. doi: 10.1289/ehp.7688. [DOI] [PMC free article] [PubMed] [Google Scholar]
- 31.Navas-Acien A, Guallar E, Silbergeld EK, Rothenberg SJ. Lead exposure and cardiovascular disease—a systematic review. Environ Health Perspect. 2007;115:472–482. doi: 10.1289/ehp.9785. [DOI] [PMC free article] [PubMed] [Google Scholar]
- 32.Mitra P, Sharma S, Purohit P, Sharma P. Clinical and molecular aspects of lead toxicity: an update. Crit Rev Clin Lab Sci. 2017;54:506–528. doi: 10.1080/10408363.2017.1408562. [DOI] [PubMed] [Google Scholar]
- 33.Miao H, Liu Y, Tsai TC, Schwartz J, Ji JS. Association between blood lead level and uncontrolled hypertension in the US population (NHANES 1999–2016) J Am Heart Assoc. 2020;9:e015533. doi: 10.1161/JAHA.119.015533. [DOI] [PMC free article] [PubMed] [Google Scholar]
- 34.Goel A, Aschner M. The effect of lead exposure on autism development. Int J Mol Sci. 2021;22:1637. doi: 10.3390/ijms22041637. [DOI] [PMC free article] [PubMed] [Google Scholar]
- 35.Mahaffey KR, Clickner RP, Jeffries RA. Adult women’s blood mercury concentrations vary regionally in the United States: association with patterns of fish consumption (NHANES 1999–2004) Environ Health Perspect. 2009;117:47–53. doi: 10.1289/ehp.11674. [DOI] [PMC free article] [PubMed] [Google Scholar]
- 36.Mangerud G (2005) Dietary mercury exposure in selected Norwegian municipalities: the Norwegian fish and game study, part C. Nordic Scholl of Public Health, Göteborg, Sweden
- 37.Eom S-Y, Lee Y-S, Lee S-G, Seo M-N, Choi B-S, Kim Y-D et al (2018) Lead, mercury, and cadmium exposure in the Korean general population. J Korean Med Sci 33(2):e9 [DOI] [PMC free article] [PubMed]
- 38.Meltzer H, Alexander J, Brantsæter A, Borch-Iohnsen B, Ellingsen D, Thomassen Y, et al. The impact of iron status and smoking on blood divalent metal concentrations in Norwegian women in the HUNT2 study. J Trace Elem Med Biol. 2016;38:165–173. doi: 10.1016/j.jtemb.2016.04.008. [DOI] [PubMed] [Google Scholar]
- 39.Gallagher CM, Chen JJ, Kovach JS. The relationship between body iron stores and blood and urine cadmium concentrations in US never-smoking, non-pregnant women aged 20–49 years. Environ Res. 2011;111:702–707. doi: 10.1016/j.envres.2011.03.007. [DOI] [PubMed] [Google Scholar]
- 40.Lee B-K, Kim SH, Kim N-S, Ham J-O, Kim Y. Iron deficiency increases blood cadmium levels in adolescents surveyed in KNHANES 2010–2011. Biol Trace Elem Res. 2014;159:52–58. doi: 10.1007/s12011-014-9982-y. [DOI] [PubMed] [Google Scholar]
- 41.Suh YJ, Lee JE, Lee DH, Yi HG, Lee MH, Kim CS, et al. Prevalence and relationships of iron deficiency anemia with blood cadmium and vitamin D levels in Korean women. J Korean Med Sci. 2016;31:25–32. doi: 10.3346/jkms.2016.31.1.25. [DOI] [PMC free article] [PubMed] [Google Scholar]
- 42.Raja KB, Jafri SE, Peters TJ, Simpson RJ. Iron and cadmium uptake by duodenum of hypotransferrinaemic mice. Biometals. 2006;19:547–553. doi: 10.1007/s10534-005-5919-4. [DOI] [PubMed] [Google Scholar]
- 43.Rabinowitz M (1991) Toxicokinetics of bone lead. Environ Health Perspect 91:33–37 [DOI] [PMC free article] [PubMed]
- 44.Pollack AZ, Mumford SL, Mendola P, Perkins NJ, Rotman Y, Wactawski-Wende J, et al. Kidney biomarkers associated with blood lead, mercury, and cadmium in premenopausal women: a prospective cohort study. J Toxicol Environ Health. 2015;78:119–131. doi: 10.1080/15287394.2014.944680. [DOI] [PMC free article] [PubMed] [Google Scholar]
- 45.Kang M-Y, Cho S-H, Lim Y-H, Seo J-C, Hong Y-C. Effects of environmental cadmium exposure on liver function in adults. Occup Environ Med. 2013;70:268–273. doi: 10.1136/oemed-2012-101063. [DOI] [PubMed] [Google Scholar]
- 46.Hong D, Min J-Y, Min K-B. Association between cadmium exposure and liver function in adults in the United States: a cross-sectional study. J Prev Med Public Health. 2021;54:471. doi: 10.3961/jpmph.21.435. [DOI] [PMC free article] [PubMed] [Google Scholar]
- 47.Caini S, Bendinelli B, Masala G, Saieva C, Lundh T, Kyrtopoulos SA, et al. Predictors of erythrocyte cadmium levels in 454 adults in Florence, Italy. Sci Total Environ. 2018;644:37–44. doi: 10.1016/j.scitotenv.2018.06.347. [DOI] [PubMed] [Google Scholar]
- 48.Liu Y, Chen M, Jiang L, Song L. New insight into molecular interaction of heavy metal pollutant—cadmium (II) with human serum albumin. Environ Sci Pollut Res. 2014;21:6994–7005. doi: 10.1007/s11356-014-2610-8. [DOI] [PubMed] [Google Scholar]
- 49.Jeevanaraj P, Hashim Z, Elias SM, Aris AZ. Mercury: a review on the target organs and toxic effects. Asia Pac Environ Occup Health J. 2016;2:1–5. [Google Scholar]
- 50.Nuttall KL. Interpreting mercury in blood and urine of individual patients. Ann Clin Lab Sci. 2004;34:235–250. [PubMed] [Google Scholar]
- 51.Illing AC, Shawki A, Cunningham CL, Mackenzie B. Substrate profile and metal-ion selectivity of human divalent metal-ion transporter-1. J Biol Chem. 2012;287:30485–30496. doi: 10.1074/jbc.M112.364208. [DOI] [PMC free article] [PubMed] [Google Scholar]
- 52.Bressler JP, Olivi L, Cheong JH, Kim Y, Bannona D. Divalent metal transporter 1 in lead and cadmium transport. Ann N Y Acad Sci. 2004;1012:142–152. doi: 10.1196/annals.1306.011. [DOI] [PubMed] [Google Scholar]
- 53.Elsenhans B, Janser H, Windisch W, Schümann K. Does lead use the intestinal absorptive pathways of iron? Impact of iron status on murine 210Pb and 59Fe absorption in duodenum and ileum in vivo. Toxicology. 2011;284:7–11. doi: 10.1016/j.tox.2011.03.005. [DOI] [PubMed] [Google Scholar]
- 54.Meltzer HM, Brantsæter AL, Borch-Iohnsen B, Ellingsen DG, Alexander J, Thomassen Y, et al. Low iron stores are related to higher blood concentrations of manganese, cobalt and cadmium in non-smoking, Norwegian women in the HUNT 2 study. Environ Res. 2010;110:497–504. doi: 10.1016/j.envres.2010.03.006. [DOI] [PubMed] [Google Scholar]
- 55.Sim C-S, Kim Y, Lee H, Park C-Y, Ham J-O, Lee B-K. Iron deficiency increases blood lead levels in boys and pre-menarche girls surveyed in KNHANES 2010–2011. Environ Res. 2014;130:1–6. doi: 10.1016/j.envres.2014.01.004. [DOI] [PubMed] [Google Scholar]
Associated Data
This section collects any data citations, data availability statements, or supplementary materials included in this article.