

Abstract
Background
The present study aimed to evaluate the performance of several machine learning (ML) algorithms in predicting 1‐year afatinib continuation and 2‐year survival after afatinib initiation and to identify the differences in survival outcomes between ML‐classified strata.
Methods
Data that were also used in the RESET study were retrospectively collected from 16 hospitals in South Korea. A stratified random sampling method was applied to split the data into training and test sets (70:30 split ratio). Clinical information, such as age, sex, tumor stage, smoking, performance status, metastasis, type of metastasis, dose adjustment, and pathologic information on EGFR mutations were inputted. Training was performed using eight ML algorithms: logistic regression, decision tree, deep neural network, random forest, support vector machine, boosting, bagging, and the naïve Bayes classifier. The model performance was assessed based on sensitivity, specificity, and accuracy. Area under the receiver operator characteristic curve (AUC) was calculated and compared between the ML models using DeLong's test. A Kaplan–Meier (KM) curve was used to visualize the identified strata obtained from the ML models.
Results
No significant differences in the input variables were observed between the training and test datasets. The best‐performing models were support vector machine in predicting 1‐year afatinib continuation (AUC 0.626) and decision tree in 2‐year survival after afatinib start (AUC 0.644), although the performances of the ML models were comparable and did not display any predictive roles. KM analysis and log‐rank test revealed significant differences between the strata identified from the ML model (p < 0.001) in terms of both time‐on‐treatment (TOT) and overall survival (OS).
Conclusion
The performances of ML models in our study found no discernible roles in predicting afatinib‐related outcomes, although the identified strata revealed different TOT and OS in the KM analysis. This implies the strength of ML in predicting the survival outcome, as well as the limitation of electronic medical record‐based variables in ML algorithms. Careful consideration of variable inclusion is likely to improve the general model performance.
Keywords: machine learning, NSCLC, outcome, survival
Machine learning methods used in this study did not offer any advantage in predicting 1‐year afatinib continuation and 2‐year survival after afatinib initiation. Despite poor performance, ML algorithms successfully classified the strata that showed significant differences in survival outcomes, which were assessed using time‐on‐treatment and overall survival. The application of machine learning using routine electronic medical record‐based variables may be cost inefficient. Further studies using machine learning techniques to predict the outcome of non‐small‐cell lung cancer would benefit from including various clinical, histopathological, and genetic predictors.

BACKGROUND
Lung cancer is one of the leading causes of death, accounting for approximately 23.3% of all cancer‐related deaths in South Korea in 2020. 1 Although a decline in lung cancer development is observed in some countries, 2 the trend of incidence differs according to the histologic type. For example, in Brazil, the incidence of adenocarcinoma (ADC) has been increasing, and it is the predominant histological type. 3 Similar results were observed in an analysis from South Korea; the rate of squamous cell carcinoma (SQC) is decreasing, while that of ADC steadily increasing. 4 Furthermore, lung cancer incidences in South Korea are decreasing among men and increasing in the female population. 4
With the rise of precision approaches in the management of non‐small‐cell lung cancer (NSCLC), application of machine learning (ML) has been highlighted for individualized cancer detection, diagnosis, treatment, and prognosis prediction. The ML technique is feasible for the identification of early lung cancer, where more than 20 features are imputed for model production. 5 Another study, combining four clinical and 40 radiomic features, suggested the role of the ML approach in identifying the histologic subtypes of lung cancer. 6 The ML algorithm may also help clinicians select appropriate candidates for immune checkpoint inhibitors. 7 In terms of risk stratification, an ML model that derived 34 features predicted recurrence and overall survival (OS) more accurately compared to the TNM staging system. 8
This study aimed to evaluate the performance of several ML algorithms in predicting the outcome of afatinib treatment in patients with advanced EGFR‐mutated NSCLC in South Korea, using data collected from multiple medical centers.
METHODS
Datasets
The present study utilized the data in the RESET study, 9 which evaluated the real‐world effectiveness of sequential treatment with afatinib and osimertinib in patients with EGFR‐mutated advanced NSCLC. Data on all patients and variables were extracted from the cohort collected by the Korean Academy of Tuberculosis and Respiratory Disease. The cohort retrospectively gathered electronic medical record (EMR)‐based information on patients with advanced EGFR‐mutated NSCLC. A total of 16 hospitals in South Korea participated in the data registration from 2014 to 2019.
The study protocol was approved by the Institutional Review Board of Kosin University Gospel Hospital (KUGH no. 2019–07‐038). The study was conducted following the Declaration of Helsinki. All procedures were performed in accordance with relevant guidelines and regulations.
Variables
The following two dichotomized (yes or no) factors related to afatinib treatment outcomes were adopted as dependent variables: (1) 1‐year afatinib continuation, which was the period between the first dose of afatinib and discontinuation of the drug for any reason, including tumor progression, drug toxicity, or death; and (2) 2‐year survival after the initiation of afatinib, which was the length of time from the start of afatinib to death from any cause.
Explanatory input variables were selected from the initial cohort database: age; sex; tumor stage classified based on the 8th edition of the American Joint Committee on Cancer staging system; Eastern Cooperative Oncology Group performance status; number of metastatic organs; presence of the brain, liver, bone, and pleural metastasis; smoking status; EGFR mutation status categorized as 19 deletion, L858R, and others; type of brain metastasis (single versus multiple with or without leptomeningeal seeding); and dose modification for afatinib.
Statistics
All statistical analyses were performed using the R software version 4.2.1 for Windows (R Development Core Team) and Python in the Google Colaboratory. The threshold level of statistical significance was set at p < 0.05. Clinical parameters were summarized as frequencies and percentages. Comparisons between the test and training datasets were summarized using chi‐squared or Fisher's exact tests. Before individual model construction, a hold‐out method was applied to split the data into training and test datasets. This process was performed using the R package caret, with 70% of the data going to the training set and the remaining 30% to the test set. The function createDataPartition splits the dataset using a stratified random sampling method, which can minimize the bias of the data distribution and create balanced data.
The following eight ML models were used for analysis: (1) for logistic regression analysis, a generalized linear model was used, considering logit as a link function, (2) a decision tree (DT) classifier was constructed using the R package rpart. In this study, a popular DT algorithm, classification and regression tree (CART), was applied to build binary trees. The Gini index was used to measure the impurity of data, that is, a larger Gini index indicates a larger impurity of the node. In this study, 10‐fold cross‐validation was applied to assess the robustness of the model, (3) a deep neural network (DNN) model was constructed using the R‐function neural network, where five perceptrons in two hidden layers were constructed. The rectified linear unit (ReLU) was used as the activation function. Resilient backpropagation with a weight backtracking algorithm was applied, (4) the random forest model, which is an ensemble learning model for classification, built 500 different trees and selected the most voted tree, (5) the ksvm classifier from the kernlab package in the R library was used to construct the support vector machine (SVM). The quality of the model was evaluated using 3‐fold cross‐validation of the training data, and a sigmoid function was fitted to the resulting decision values. The sequential minimal optimization algorithm, invented by John Platt, was applied to the SVM, (6) boosting is an ensemble meta‐algorithm that combines several rough and moderately inaccurate models. The C50 R package contains the C5.0 classification model, which was used to optimize the predictive value with 100 trials of boosting interactions, (7) bagging, also known as bootstrap aggregation, is another ensemble meta‐algorithm. This algorithm reduces the variance within a noisy dataset. Repeated random samples were selected from the original data with replacement, and then individual models were created from the samples. The final model was subsequently obtained through voting by combining multiple classifiers, and (8) naïve Bayes (NB) classifier was applied using the R package e1071. The NB classifier is a decision support model that depends on Bayes' theorem, and this algorithm is only applicable for classification.
After constructing the ML models, sensitivity, specificity, and accuracy were calculated to test the performance. Sensitivity was defined as the proportion of true positives correctly identified by the test, while specificity was defined as the proportion of true‐negatives correctly identified by the test. Accuracy was defined as the proportion of true results, either true positives or true negatives. The receiver operator characteristic (ROC) curve was then drawn for each ML model, and the area under the ROC curve (AUC) was measured. DeLong's test was used to compare the models with the highest and lowest AUC values. Importance plots were constructed to visualize the weights of the different variables in each prediction algorithm.
In addition, we used the functions train and trainControl in the R package caret, which automatically resample, tune the parameters of individual ML models, choose the optimal model, and estimate the performance to validate the model performance of the ML algorithms. Apart from the hold‐out method that was used in the above models, we additionally adopted two other resampling methods: the 10‐fold cross‐validation method and bootstrapping. A 10‐fold cross‐validation divides the data into 10 parts, fits the model with 90% of the data, and predicts with the remaining 10%. Bootstrapping iteratively resamples a dataset with replacement and applies the modeling to the resample. The default time was set at 25.
Subsequently, a Kaplan–Meier curve was drawn to visualize the discrimination among the predicted strata obtained from the ML models. The strata were divided into low‐ and high‐risk groups based on Youden's index, which was calculated from the ROC curve for each model. Time‐on‐treatment (TOT), defined as the time from the first dose of afatinib to drug discontinuation for any cause, was used to numerically compare the differences between strata created for the prediction of 1‐year afatinib continuation. Overall survival (OS), the time from the start of afatinib treatment to death from any cause, was used to estimate the differences between the strata created for the prediction of 2‐year survival after afatinib treatment. The log‐rank test was performed to validate the statistical differences between strata discriminated by the ML model.
In addition, we used the DeepSurv algorithm to estimate personalized survival probability. 10 The DeepSurv module calculates individualized risk and may provide personalized treatment recommendations by constructing a nonlinear Cox proportional hazard network. Deepsurv functions in R library survival models and Python modules were used for this estimation.
RESULTS
The baseline characteristics of the training and test sets are presented in Table 1. For all imputed variables, no statistically significant differences were observed between the training and test datasets.
TABLE 1.
Comparison of the characteristics of the training and validation datasets
| Test (n = 97) | Training (n = 227) | p | |
|---|---|---|---|
| Male | 49 (50.5%) | 128 (56.4%) | 0.333 |
| Age (years) | 0.808 | ||
| <65 | 53 (54.6%) | 128 (56.4%) | |
| ≥65 | 44 (45.4%) | 99 (43.6%) | |
| Tumor stage a | 0.806 | ||
| 3 and 4A | 58 (59.8%) | 131 (58.0%) | |
| 4B | 39 (40.2%) | 95 (42.0%) | |
| Smoking | 0.765 | ||
| Never | 59 (61.5%) | 139 (61.8%) | |
| Former | 29 (30.2%) | 62 (27.6%) | |
| Current | 8 (8.3%) | 24 (10.7%) | |
| ECOG PS | |||
| 0 and 1 | 83 (85.6%) | 191 (84.1%) | 0.637 |
| ≥2 | 5 (5.2%) | 18 (7.9%) | |
| NA | 9 (9.3%) | 18 (7.9%) | |
| EGFR mutation | 0.578 | ||
| Del19 | 49 (50.5%) | 129 (56.8%) | |
| L858R | 33 (34.0%) | 67 (29.5%) | |
| Others b | 15 (15.5%) | 31 (13.7%) | |
| Number of metastatic organs | 0.643 | ||
| 0–1 | 47 (48.5%) | 106 (46.7%) | |
| 2–3 | 43 (44.3%) | 97 (42.7%) | |
| 4 or more | 7 (7.2%) | 24 (10.6%) | |
| Presence of liver metastasis | 10 (10.3%) | 35 (15.4%) | 0.293 |
| Presence of bone metastasis | 42 (43.3%) | 97 (42.7%) | 1.0 |
| Presence of brain metastasis | 43 (44.3%) | 54 (55.7%) | 0.903 |
| Presence of pleural metastasis | 34 (35.1%) | 90 (39.6%) | 0.457 |
| Type of brain metastasis | 0.219 | ||
| Single parenchymal | 30 (30.9%) | 55 (24.3%) | |
| Multiple +/− seeding | 67 (69.1%) | 171 (75.7%) | |
| Dose adjustment for afatinib | 1.0 | ||
| Yes | 62 (63.9%) | 144 (63.7%) | |
| No | 35 (36.1%) | 82 (36.3%) |
Note: Data are presented as numbers (percentages) unless otherwise stated.
Abbreviations: Del19, deletion 19; ECOG PS, Eastern Cooperative Oncology Group performance status; EGFR, epidermal growth factor receptor.
Tumor stage is classified based on the 8th edition of the American Joint Committee on Cancer staging system.
Patients not presenting with EGFR Del19 and L858R mutations, including de novo T790M mutation, are classified as the “Others” group.
In terms of 1‐year afatinib continuation, the highest model performance was obtained by SVM (AUC = 0.626; Table 2 and Figure 1a), followed by the NB classifier, bagging, DNN, boosting, random forest model, logistic regression model, and DT with AUCs of 0.611, 0.606, 0.605, 0.601, 0.596, 0.594, and 0.553, respectively. The lowest model performance was observed for DT. DeLong's test found no statistically significant difference (p = 0.563) between the best and worst performance models. The importance plots of each model for predicting 1‐year afatinib continuation and the weights of different variables according to the ML models are shown in Figure S1.
TABLE 2.
Prediction of 1‐year afatinib continuation in patients with EGFR‐mutated NSCLC using several machine‐learning models
| Sensitivity (%) | Specificity (%) | Accuracy (%) | AUC a | |
|---|---|---|---|---|
| Logistic regression model | 52.3 | 59.5 | 55.8 | 0.594 |
| Decision tree model | 52.8 | 51.4 | 55.6 | 0.553 |
| Boosting | 70.5 | 47.6 | 59.3 | 0.601 |
| Bagging | 63.6 | 52.4 | 58.1 | 0.606 |
| Random forest model | 70.5 | 57.1 | 64.0 | 0.596 |
| Support vector machine | 70.5 | 54.8 | 62.8 | 0.626 |
| Deep neural network | 68.2 | 40.5 | 54.7 | 0.605 |
| Naïve Bayes classifier | 75.0 | 33.3 | 54.7 | 0.611 |
p = 0.563 between the random forest model and support vector machine by DeLong's test for the comparison of AUC.
FIGURE 1.
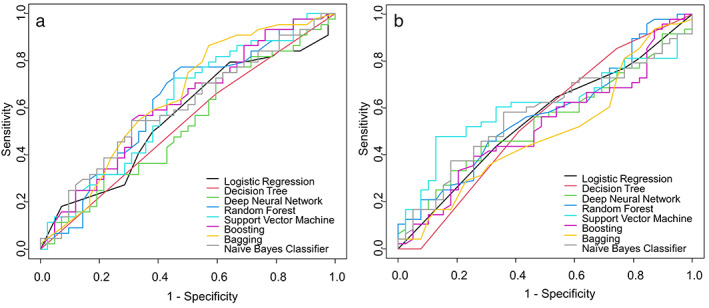
ROC curves for the prediction of 1‐year afatinib continuation (a) and 2‐year survival after afatinib initiation (b)
With respect to 2‐year survival after afatinib initiation, the DT algorithm showed the highest AUC value of 0.612 (Table 3 and Figure 1b), followed by boosting, NB classifier, logistic regression model, SVM, random forest, bagging, and DNN, with AUCs of 0.61, 0.583, 0.573, 0.563, 0.558, 0.555, and 0.543, respectively. However, no significant difference was observed between the best and worst performance models (P = 0.294). The importance plots of each model for the prediction of 2‐year survival after afatinib treatment and the weights of different variables according to the ML models are shown in Figure S2.
TABLE 3.
Prediction of 2‐year survival after afatinib initiation in patients with EGFR‐mutated NSCLC using several machine‐learning models
| Sensitivity (%) | Specificity (%) | Accuracy (%) | AUC a | |
|---|---|---|---|---|
| Logistic regression model | 85.4 | 33.3 | 62.1 | 0.594 |
| Decision tree model | 75.0 | 53.9 | 65.6 | 0.644 |
| Boosting | 79.2 | 41.0 | 62.1 | 0.601 |
| Bagging | 75.0 | 46.2 | 62.1 | 0.606 |
| Random forest model | 83.3 | 35.9 | 62.1 | 0.596 |
| Support vector machine | 75.0 | 43.6 | 60.9 | 0.593 |
| Deep neural network | 64.6 | 56.4 | 60.9 | 0.605 |
| Naïve Bayes classifier | 81.3 | 41.0 | 63.2 | 0.611 |
p = 0.48 between the support vector machine and decision tree model using DeLong's test for the comparison of AUC.
The Kaplan–Meier curve showed that the TOT between ML‐classified strata was significantly different across all ML algorithms (p < 0.001 by log‐rank test; Figure 2). In addition, the ML‐identified strata significantly discriminated the groups with low and high risk in terms of OS (p < 0.001 by log‐rank test; Figure 3). Individually predicted survival probabilities using the DeepSurv module are shown in Figure S3. The losses based on the learning rate and epochs are also depicted. In addition, the concordance indices using the DeepSurv module for TOT and OS were 0.503 and 0.569, respectively (data not shown).
FIGURE 2.
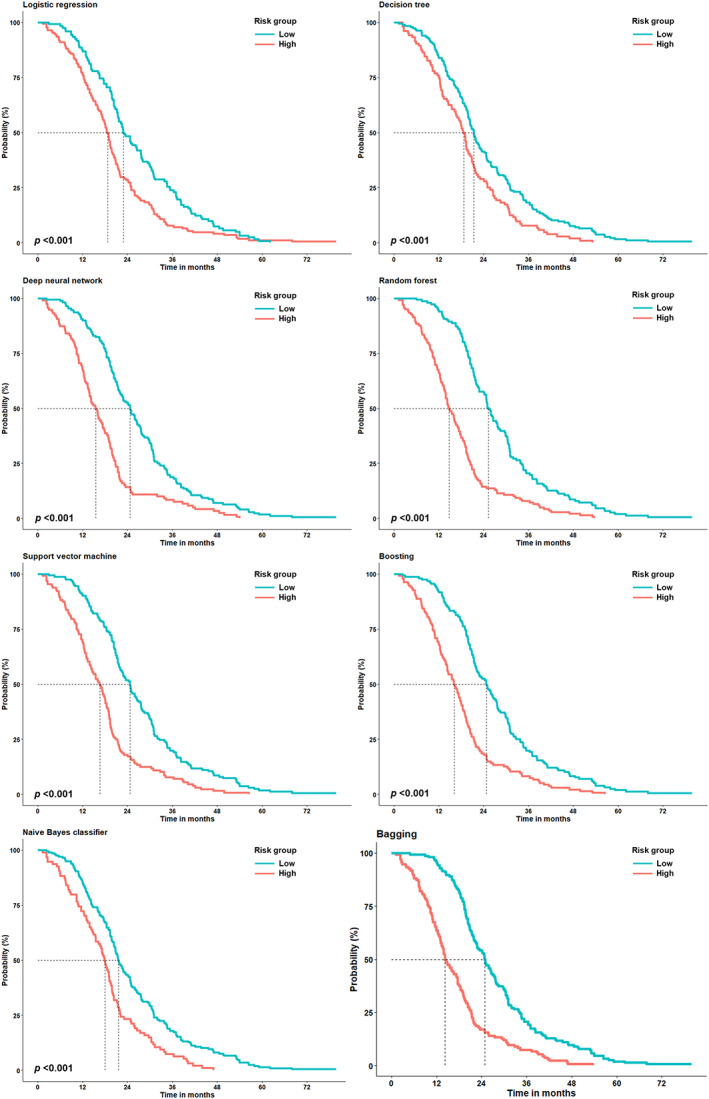
The Kaplan–Meier curve for the time‐on‐treatment (TOT) according to the strata identified using several machine learning algorithms. The dotted lines indicate the time at which the probability drops to 0.5
FIGURE 3.
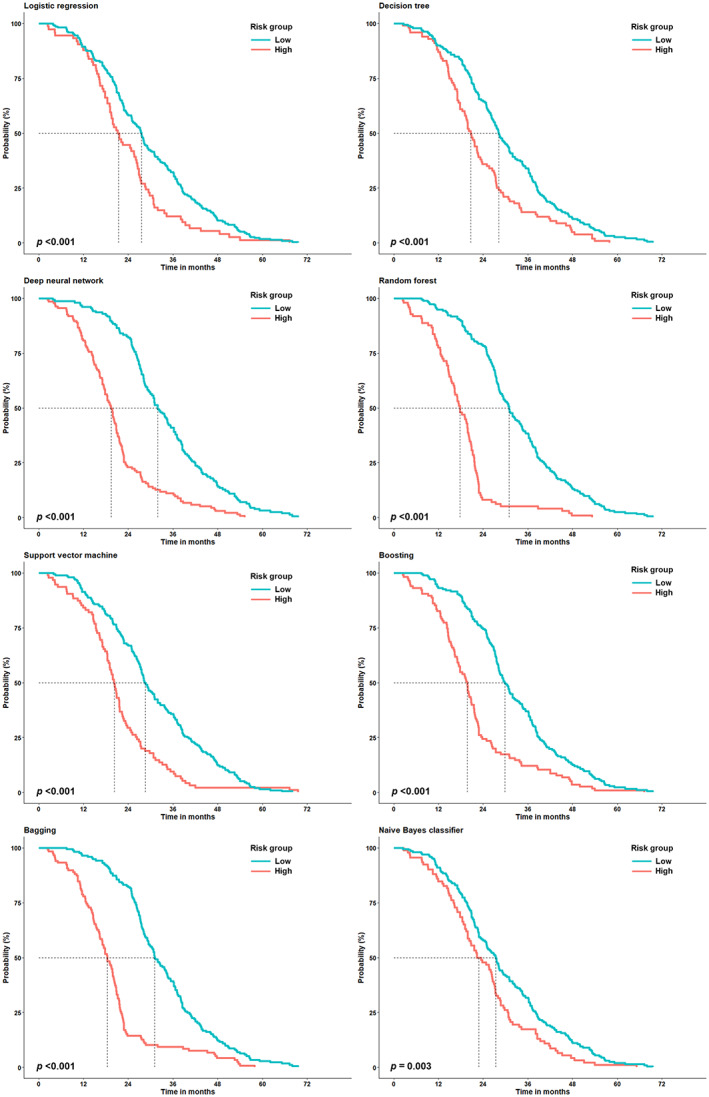
The Kaplan–Meier curve for the overall survival (OS) according to the strata identified using several machine learning algorithms. The dotted lines indicate the time at which the probability drops to 0.5
The results of the automatically customized tuning process for several ML models are presented in Table 4. Both resampling techniques implemented for evaluating the performances of ML models using automatically tuned parameters in the caret package, 10‐fold cross validation, and bootstrapping showed no difference from the estimations observed in Tables 2 and 3.
TABLE 4.
Comparison of model performance using automatic parameter tuning using different sampling methods
| 1‐year afatinib continuation | 10‐fold cross validation | Bootstrapping | ||||
|---|---|---|---|---|---|---|
| Sensitivity (%) | Specificity (%) | Accuracy (%) | Sensitivity (%) | Specificity (%) | Accuracy (%) | |
| Logistic regression model | 54.4 | 57.5 | 55.8 | 51.4 | 52.9 | 52.3 |
| Decision tree model | 16.7 | 48.8 | 46.5 | 48.1 | 50.0 | 48.8 |
| Boosting | 45.7 | 47.5 | 46.5 | 48.9 | 51.2 | 50.0 |
| Bagging | 48.8 | 51.2 | 50.0 | 45.2 | 49.1 | 47.7 |
| Random forest model | 50.0 | 52.2 | 51.2 | 45.5 | 49.1 | 47.8 |
| Support vector machine | 56.3 | 60.5 | 58.1 | 55.0 | 56.5 | 55.8 |
| Deep neural network | 51.6 | 58.3 | 53.5 | 52.4 | 54.6 | 53.5 |
| Naïve Bayes classifier | 37.5 | 50.0 | 48.8 | 56.7 | 55.4 | 55.8 |
| 2‐year survival after afatinib | Sensitivity (%) | Specificity (%) | Accuracy (%) | Sensitivity (%) | Specificity (%) | Accuracy (%) |
|---|---|---|---|---|---|---|
| Logistic regression model | 52.6 | 61.2 | 57.5 | 52.0 | 58.1 | 56.3 |
| Decision tree model | 55.6 | 66.7 | 60.9 | 52.4 | 62.2 | 57.5 |
| Boosting | 48.9 | 59.5 | 54.0 | 51.7 | 58.6 | 56.3 |
| Random forest model | 45.5 | 55.6 | 51.7 | 50.0 | 58.2 | 55.2 |
| Support vector machine | 54.1 | 62.0 | 58.6 | 48.0 | 56.5 | 54.0 |
| Deep neural network | 53.8 | 68.6 | 60.0 | 56.8 | 64.0 | 60.9 |
| Naïve Bayes classifier | 58.3 | 57.3 | 57.5 | 22.2 | 52.6 | 49.4 |
Note: The values of sensitivity, specificity, and accuracy are the means of the results from the 10‐fold cross‐validation.
DISCUSSION
The present study attempted to identify the performance of several ML models for the prediction of 1‐year afatinib continuation and 2‐year survival after drug administration, using nationwide cohort data of advanced EGFR‐mutated NSCLC in South Korea. The performances of several ML algorithms were comparable, although their predictive values, which were calculated by the sensitivity, specificity, accuracy, and AUC, were poor. None of the ML algorithms provided any advantages over the other algorithms. Promisingly, the ML models adequately classified strata that exhibited significant differences in terms of treatment time and OS. Our results indicate the potential benefit of ML models in classifying patients with better survival outcomes, as well as the limitation that prediction of outcome based on EMR‐based variables might not necessitate complicated ML algorithms.
The ML algorithms used in the current study did not have an outstanding predictive value for afatinib treatment and the following are the possible reasons for this finding. First, the relationship between the input and output variables may not be complicated. Consistent with our results, in one study on patients with oral SQC, where recurrence‐free 5‐year survival was predicted using various ML models, estimated AUCs in ROC were 0.69, 0.65, 0.5, 0.77, and 0.69 for logistic regression, KNN, NB classifier, DT, and random forest models, respectively. 11 The strength of the ML technique lies in its ability to analyze large, complex biological information and discover the differences and significance within the data. 12 Given that previous reports imputed many predictors in their ML models compared to our study, 5 , 6 the algorithms that were selected in our study might not exhibit any discernable role in our data.
Second, the relatively small sample size may have affected the predictive value. Like our results, a previous study in patients with prostate cancer evaluated the performance of DNN, k‐nearest neighborhood, and DT algorithms to identify early recurrence and reported AUCs of 0.607, 0.596, and 0.534, respectively. 13 They discussed that the small numbers of study participants might have impacted the poor performance of their ML models. The accuracy of ML algorithms depends on the input size, that is, it can be increased with an increase in the data input. 14 Although our study enrolled over 200 patients with NSCLC for model training, a small number of training examples may have caused a high variance in the classification results. A previous study assessed the ML algorithm bias related to sample size and suggested that a minimum of 1000 samples were needed to maintain the robustness of ML models. 15
Third, the constraints of the tabular dataset, the most common data type in real‐world statistics, may contribute to the poor ML performance in our study. Tabular data generally refer to an organized table with a set of samples (rows) and the same set of features (columns). However, when applying ML models to this form of data, several issues, such as data noise and data fragmentation, should be adequately controlled. Several efforts have been made to mitigate this problem. For example, the tabular constraint learner (TaCLe) was suggested as a method for finding row‐wise and column‐wise constraints in an unsupervised manner. 16 However, various obstacles remain in the application of tabular data for deep learning. The lack of spatial relationships between features makes it difficult to apply algorithms based on inductive bias, such as occurs in convolutional neural networks. 17
In cancer computing, several studies have been performed to analyze and predict cancer‐related issues. Many algorithms have been modified to improve accuracy and achieve better predictive performance. Previously, the application of ML could improve the accuracy of cancer prognosis by 15–20%. 18 Chen et al. reported an accuracy of 83% in lung cancer using an artificial neural network when gene expression data were combined. 19 Furthermore, ML exhibited the ability to individually classify patients with NSCLC according to whether they might be candidates for immune checkpoint inhibitors by integrating hundreds of gene expression data. 20 In terms of reproducibility, inclusion of large volumes of genomic data may be unfeasible, but clinicians may find simple clinical and histopathological features.
Notably, although the AUC values of our ML algorithms were numerically poor, the ML models provided adequate significance levels (p < 0.001) for determining the high‐ and low‐risk groups. The ML‐measured OS months were comparable to those in the LUX‐Lung 6 trial (median 23.1, 95% confidence interval 20.4–27.3). 21 In agreement with our results, the OS prediction was successfully accomplished using DNN in patients with NSCLC. 22 The ML model demonstrated outstanding performance in distinguishing the groups showing different survival in the Kaplan–Meier curve, and this discrimination has the potential to yield different signatures in cancer. 23 The ML model demonstrated outstanding performance in distinguishing the groups showing different survival in the Kaplan–Meier curve, and this discrimination has the potential to yield different signatures in cancer. 24
The conventional approach to cancer management may be limited by inter‐individual diversity and intra‐individual tumor heterogeneity. Several studies have been performed to bridge the gap between the traditional approach and personalized assessment, emphasizing the potential risk of over‐ and undertreatment from an insufficient approach, 25 therefore future work in this field will consider a strategy for the enrollment of additional variables to enhance model performance. It seems that the accuracy of our study is better than that of the study by Chang et al., where the AUC was 0.4 to 0.7 when considering only clinical and histopathological data. 26 However, the authors demonstrated an improvement in the accuracy of their models with the inclusion of genomic variables. Similarly, considering imaging data for clinical features could effectively improve outcome prediction. 27 A balance between model performance and ease of achievement for data input should be considered.
Our study had several limitations. First, it lacked an external validation, a method used to test the performance of prediction models for new patients to determine whether the models have generalizability and reproducibility. 28 Although we partitioned our dataset into training and test sets using stratified random sampling, this action was limited as an internal validation. Second, the outcome variables were binary variables. Several cancer‐related outcome studies have reported results as continuous variables, such as OS, TOT, and progression‐free survival. ML algorithms can be applied to either a classification that predicts discrete class labels or a regression that predicts a continuous quantity. However, numerous ML studies on cancer diagnosis and prediction have constructed models based on classification, rather than regression.
CONCLUSION
The ML methods used in this study did not offer any advantage in predicting 1‐year afatinib continuation and 2‐year survival after afatinib initiation. Despite poor performance, ML algorithms successfully classified the strata that showed significant differences in survival outcomes, which were assessed using TOT and OS. The application of ML using routine EMB‐based variables may be cost inefficient. Further studies using ML techniques to predict the outcome of NSCLC would benefit from including various clinical, histopathological, and genetic predictors.
DISCLOSURE
The authors declare that they have no competing interests.
AUTHOR CONTRIBUTIONS
T. Kim: Conceptualization, writing – original draft, formal analysis, investigation, methodology, supervision. S.J. Lee: Methodology and formal analysis. T.W. Jang: Project administration, writing – review and editing. All authors discussed the results and approved the final version of the manuscript.
AVAILABILITY AND DATA AND MATERIALS
The datasets used and/or analyzed during the current study are available from the corresponding author on reasonable request.
Supporting information
Supporting Information Figure S1 Importance plots on the weights of the different variables in each algorithm for the prediction of 1‐year afatinib continuation
Supporting Information Figure S2 Importance plots on the weights of the different variables in each algorithm for the prediction of 2‐year survival after afatinib initiation
Supporting Information Figure S3Losses according to the learning rate (a for TOT and d for OS). Losses of the training and test set according to the epoch (b for TOT and e for OS). Probabilities of survival in each patient using DeepSurv module (c for TOT and f for OS). TOT, time‐on‐treatment; OS, overall survival
Kim T, Lee SJ, Jang T‐W. Application of several machine learning algorithms for the prediction of afatinib treatment outcome in advanced‐stage EGFR‐mutated non‐small‐cell lung cancer. Thorac Cancer. 2022;13(23):3353–3361. 10.1111/1759-7714.14694
REFERENCES
- 1. Jung KW, Won YJ, Hong S, Kong HJ, Lee ES. Prediction of cancer incidence and mortality in Korea, 2020. Cancer Res Treat. 2020;52(2):351–8. [DOI] [PMC free article] [PubMed] [Google Scholar]
- 2. Huang J, Deng Y, Tin MS, Lok V, Ngai CH, Zhang L, et al. Distribution, risk factors, and temporal trends for lung cancer incidence and mortality: a global analysis. Chest. 2022;161(4):1101–11. [DOI] [PubMed] [Google Scholar]
- 3. Mathias C, Prado GF, Mascarenhas E, Ugalde PA, Zimmer Gelatti AC, Carvalho ES, et al. Lung cancer in Brazil. J Thorac Oncol. 2020;15(2):170–5. [DOI] [PubMed] [Google Scholar]
- 4. Lee JG, Kim HC, Choi CM. Recent trends of lung cancer in Korea. Tuberc Respir Dis. 2021;84(2):89–95. [DOI] [PMC free article] [PubMed] [Google Scholar]
- 5. Gould MK, Huang BZ, Tammemagi MC, Kinar Y, Shiff R. Machine learning for early lung cancer identification using routine clinical and laboratory data. Am J Respir Crit Care Med. 2021;204(4):445–53. [DOI] [PubMed] [Google Scholar]
- 6. Hyun SH, Ahn MS, Koh YW, Lee SJ. A machine‐learning approach using PET‐based radiomics to predict the histological subtypes of lung cancer. Clin Nucl Med. 2019;44(12):956–60. [DOI] [PubMed] [Google Scholar]
- 7. Prelaj A, Boeri M, Robuschi A, Ferrara R, Proto C, Lo Russo G, et al. Machine learning using real‐world and translational data to improve treatment selection for NSCLC patients treated with immunotherapy. Cancer. 2022;14(2):435. [DOI] [PMC free article] [PubMed] [Google Scholar]
- 8. Hindocha S, Charlton TG, Linton‐Reid K, Hunter B, Chan C, Ahmed M, et al. A comparison of machine learning methods for predicting recurrence and death after curative‐intent radiotherapy for non‐small cell lung cancer: development and validation of multivariable clinical prediction models. EBioMedicine. 2022;77:103911. [DOI] [PMC free article] [PubMed] [Google Scholar]
- 9. Kim T, Jang TW, Choi CM, Kim MH, Lee SY, Park CK, et al. Sequential treatment of afatinib and osimertinib or other regimens in patients with advanced non‐small‐cell lung cancer harboring EGFR mutations: results from a real‐world study in South Korea. Cancer Med. 2021;10(17):5809–22. [DOI] [PMC free article] [PubMed] [Google Scholar]
- 10. Katzman JL, Shaham U, Cloninger A, Bates J, Jiang T, Kluger Y. DeepSurv: personalized treatment recommender system using a cox proportional hazards deep neural network. BMC Med Res Methodol. 2018;18(1):24. [DOI] [PMC free article] [PubMed] [Google Scholar]
- 11. Alkhadar H, Macluskey M, White S, Ellis I, Gardner A. Comparison of machine learning algorithms for the prediction of five‐year survival in oral squamous cell carcinoma. J Oral Pathol Med. 2021;50(4):378–84. [DOI] [PubMed] [Google Scholar]
- 12. Xu C, Jackson SA. Machine learning and complex biological data. Genome Biol. 2019;20(1):76. [DOI] [PMC free article] [PubMed] [Google Scholar]
- 13. Park S, Byun J, Woo JY. A machine learning approach to predict an early biochemical recurrence after a radical prostatectomy. Appl Sci. 2020;10(11):3854. [Google Scholar]
- 14. Zhang Y, Ling C. A strategy to apply machine learning to small datasets in materials science. Npj Comput Mater. 2018;4(1):25. [Google Scholar]
- 15. Vabalas A, Gowen E, Poliakoff E, Casson AJ. Machine learning algorithm validation with a limited sample size. PLoS One. 2019;14(11):e0224365. [DOI] [PMC free article] [PubMed] [Google Scholar]
- 16. Kolb S, Paramonov S, Guns T, De Raedt L. Learning constraints in spreadsheets and tabular data. Mach Learn. 2017;106(9):1441–68. [Google Scholar]
- 17. Zhu Y, Brettin T, Xia F, Partin A, Shukla M, Yoo H, et al. Converting tabular data into images for deep learning with convolutional neural networks. Sci Rep. 2021;11(1):11325. [DOI] [PMC free article] [PubMed] [Google Scholar]
- 18. Kourou K, Exarchos TP, Exarchos KP, Karamouzis MV, Fotiadis DI. Machine learning applications in cancer prognosis and prediction. Comput Struct Biotechnol J. 2015;13:8–17. [DOI] [PMC free article] [PubMed] [Google Scholar]
- 19. Chen YC, Ke WC, Chiu HW. Risk classification of cancer survival using ANN with gene expression data from multiple laboratories. Comput Biol Med. 2014;48:1–7. [DOI] [PubMed] [Google Scholar]
- 20. Wiesweg M, Mairinger F, Reis H, Goetz M, Kollmeier J, Misch D, et al. Machine learning reveals a PD‐L1–independent prediction of response to immunotherapy of non‐small cell lung cancer by gene expression context. Eur J Cancer. 2020;140:76–85. [DOI] [PubMed] [Google Scholar]
- 21. Yang JC‐H, Wu Y‐L, Schuler M, Sebastian M, Popat S, Yamamoto N, et al. Afatinib versus cisplatin‐based chemotherapy for EGFR mutation‐positive lung adenocarcinoma (LUX‐lung 3 and LUX‐lung 6): analysis of overall survival data from two randomised, phase 3 trials. Lancet Oncol. 2015;16(2):141–51. [DOI] [PubMed] [Google Scholar]
- 22. Lai Y‐H, Chen W‐N, Hsu T‐C, Lin C, Tsao Y, Wu S. Overall survival prediction of non‐small cell lung cancer by integrating microarray and clinical data with deep learning. Sci Rep. 2020;10(1):4679. [DOI] [PMC free article] [PubMed] [Google Scholar]
- 23. Deng Y, Yuan W, Ren E, Wu Z, Zhang G, Xie Q. A four‐methylated LncRNA signature predicts survival of osteosarcoma patients based on machine learning. Genomics. 2021;113(1):785–94. [DOI] [PubMed] [Google Scholar]
- 24. Liu Z, Liu L, Weng S, Guo C, Dang Q, Xu H, et al. Machine learning‐based integration develops an immune‐derived lncRNA signature for improving outcomes in colorectal cancer. Nat Commun. 2022;13(1):816. [DOI] [PMC free article] [PubMed] [Google Scholar]
- 25. Salazar R, Tabernero J. New approaches but the same flaws in the search for prognostic signatures. Clin Cancer Res. 2014;20(8):2019–22. [DOI] [PubMed] [Google Scholar]
- 26. Chang S‐W, Abdul‐Kareem S, Merican AF, Zain RB. Oral cancer prognosis based on clinicopathologic and genomic markers using a hybrid of feature selection and machine learning methods. BMC Bioinf. 2013;14(1):170. [DOI] [PMC free article] [PubMed] [Google Scholar]
- 27. Shiri I, Sorouri M, Geramifar P, Nazari M, Abdollahi M, Salimi Y, et al. Machine learning‐based prognostic modeling using clinical data and quantitative radiomic features from chest CT images in COVID‐19 patients. Comput Biol Med. 2021;132:104304. [DOI] [PMC free article] [PubMed] [Google Scholar]
- 28. Ramspek CL, Jager KJ, Dekker FW, Zoccali C, van Diepen M. External validation of prognostic models: what, why, how, when and where? Clin Kidney J. 2021;14(1):49–58. [DOI] [PMC free article] [PubMed] [Google Scholar]
Associated Data
This section collects any data citations, data availability statements, or supplementary materials included in this article.
Supplementary Materials
Supporting Information Figure S1 Importance plots on the weights of the different variables in each algorithm for the prediction of 1‐year afatinib continuation
Supporting Information Figure S2 Importance plots on the weights of the different variables in each algorithm for the prediction of 2‐year survival after afatinib initiation
Supporting Information Figure S3Losses according to the learning rate (a for TOT and d for OS). Losses of the training and test set according to the epoch (b for TOT and e for OS). Probabilities of survival in each patient using DeepSurv module (c for TOT and f for OS). TOT, time‐on‐treatment; OS, overall survival