Abstract
Background
Dengue is one of the common arboviral infections and is a public health problem in South East Asia. The aim of this systematic review and meta-analysis was to evaluate the prevalence and distribution of dengue in SAARC (South Asian Association for Regional Cooperation) countries.
Methods
The PubMed, PubMed Central, Embase and Scopus databases were searched for relevant studies. Statistical analysis on data extracted from the selected studied was conducted using the Comprehensive Meta-Analysis Software (CMA) version 3 software package. Proportions were used to estimate the outcome with a 95% confidence interval (CI).
Results
Across all studies, among cases of suspected dengue, 30.7% were confirmed dengue cases (proportion: 0.307, 95% CI: 0.277–0.339). The seroprevalence of dengue immunoglobulin (Ig)G, IgM or both (IgM and IgG) antibodies and dengue NS1 antigen was 34.6, 34.2, 29.0 and 24.1%, respectively. Among the different strains of dengue, dengue virus (DENV) strains DENV-1, DENV-2, DENV-3 and DENV-4 accounted for 21.8, 41.2, 14.7 and 6.3% of cases, respectively. The prevalence of dengue fever, dengue hemorrhagic fever and dengue shock syndrome was 80.5, 18.2 and 1.5%, respectively. Fever was a commonly reported symptom, and thrombocytopenia was present in 44.7% of cases. Mortality was reported in 1.9% of dengue cases.
Conclusions
Dengue is a common health problem in South East Asia with high seroprevalence. DENV-2 was found to be the most common strain causing infection, and most dengue cases were dengue fever. In addition, thrombocytopenia was reported in almost half of the dengue cases.
Graphical Abstract
Supplementary Information
The online version contains supplementary material available at 10.1186/s13071-022-05409-1.
Keywords: Dengue, SAARC region, Dengue fever, Dengue shock syndrome
Background
Dengue, one of the most common arboviral infections, is transmitted by the bite of the Aedes mosquito. Dengue infections are caused by four circulating dengue virus serotypes (DENV-1 to -4) that are ubiquitously prevalent throughout the tropical and subtropical regions of the world. The risk of infection is strongly influenced by rainfall, temperature and the degree of urbanization [1, 2]. Dengue infection is usually asymptomatic in > 50% of cases; alternatively, it can present as a flu-like illness, including headache, myalgia and rash [3]. Therefore, knowledge of dengue's geographical distribution and burden is crucial [2]. To date, there are not licensed vaccines or specific therapeutics against dengue [2].
Dengue is one of the major public health concerns in developing countries. More than 100 countries in South East Asia, the Western Pacific region, the Americas and Africa are reported to be dengue endemic, a scenario that differs from that which prevailed 20–30 years ago [3]. Dengue is considered to be among the most significant infectious diseases, having a high disease burden, especially in the South East Asia region, with cycles of epidemics every 3–5 years [4]. Bhatt et al. estimated 390 million dengue infections worldwide in 2010, much higher than the number of cases previously assumed by WHO [2]. Shepherd et al. estimated an average of 2.9 million dengue infection episodes and 5906 deaths per year with an annual economic burden of US$950 million in the Southeast Asian region [5].
Similarly, the disability-adjusted life years (DALYS) of dengue in the South East Asian region was 372 DALYs per million per year [5]. This trend is projected to rise further in the future owing to the rapid population growth in the region together with unplanned urbanization and industrialization, increased population sensitivity and lack of licensed vaccines and specific therapeutics against dengue [2, 4]. Although all eight countries in the South Asian Association for Regional Cooperation (SAARC) region reported sporadic cases or outbreaks of dengue infection with significant health and economic burden, no has yet study scrutinized its prevalence and risk factors among the febrile and healthy general population in the SAARC region to date. The aim of our meta-analysis was, therefore, to evaluate the prevalence, risk factors and distribution of dengue fever in SAARC countries.
Methods
Protocol registration
The systematic review was registered in PROSPERO (CRD42020215737) and was conducted according to the Meta-Analysis of Observational Studies in Epidemiology (MOOSE) guidelines [6, 7]. For details, see Additional file 1: Text 1.
Data sources and search strategy
The PubMed, PubMed Central, Scopus and Embase databases were searched for relevant articles from 1995 up to December 2020 using the appropriate terms and Boolean operators. For details, see Additional file 2: Text 1.
Eligibility and exclusion criteria
The eligibility criteria for inclusion were: (i) all papers (cross-sectional studies, case series reporting > 50 patients with dengue, cohort study) mentioning prevalence of dengue and/or details of dengue-like risk factors, outcome and outcome predictors; (ii) studies conducted between 1995 onwards to date; (iii) published articles. The following studies were excluded: (i) editorials, comments, and viewpoint articles with no proper data on dengue and lacking adequate data of interest; and (ii) studies conducted outside SAARC countries. When ≥ 2 studies were identified that used the same dataset, we considered the most comprehensive and updated one for inclusion.
Study selection
The studies were filtered using Covidence [8]. Three reviewers (BG, SS, AB) independently screened the title and abstract based on the inclusion criteria. Discrepancies were resolved by consensus, with a fourth reviewer (SA) making the decision when consensus could not be reached.
Risk of bias assessment based on the critical appraisal checklist
Qualitative assessment of each individual study was conducted using the Joanna Briggs Institute (JBI) critical appraisal tool [9]. This checklist consists of nine items that assess the methodological quality of an investigation and determine the extent to which a study has addressed the possibility of bias in its design, conduct and analysis. Our bias assessment of the 55 articles included in our meta-analysis is shown in Table 1.
Table 1.
Bias assessment of the studies included in the meta-analysis
| Country | Rreference | JBI critical appraisal checklista | ||||||||
|---|---|---|---|---|---|---|---|---|---|---|
| Was the sample frame appropriate to address the target population? | Were study participants sampled appropriately? | Was the sample size adequate? | Were the study subjects and the setting described in detail? | Was the data analysis conducted with sufficient coverage of the identified sample? | Were valid methods used for the identification of the condition? | Was the condition measured in a standard, reliable way for all participants? | Was there appropriate statistical analysis? | Was the response rate adequate, and if not, was the low response rate managed appropriately? | ||
| India | [10] | Yes | Yes | Yes | Yes | Yes | Yes | Yes | Yes | Yes |
| India | [11] | Yes | Yes | Yes | Yes | Yes | Yes | Yes | Yes | Yes |
| India | [12] | Yes | Yes | Yes | Yes | Yes | Yes | Yes | Yes | Yes |
| India | [13] | Yes | Yes | Yes | Yes | Yes | Yes | Yes | Yes | Yes |
| Pakistan | [14] | Unclear | Yes | Yes | No | Yes | Yes | Yes | Yes | Yes |
| India | [15] | Yes | Yes | Yes | Yes | Yes | Yes | Yes | Yes | Yes |
| India | [16] | Unclear | Yes | Yes | No | Yes | Yes | Yes | Yes | Yes |
| India | [17] | Yes | Yes | Yes | Yes | Yes | Yes | Yes | Yes | Yes |
| India | [18] | Yes | Yes | Yes | Yes | Yes | Yes | Yes | Yes | Yes |
| Sri Lanka | [19] | Yes | Yes | Yes | Yes | Yes | Yes | Yes | Yes | Yes |
| Pakistan | [20] | Yes | Yes | Yes | Yes | Yes | Yes | Yes | Yes | Yes |
| India | [21] | Yes | Yes | Yes | No | Yes | Yes | Yes | Yes | Yes |
| India | [22] | Yes | Yes | Yes | Yes | Yes | Yes | Yes | Yes | Yes |
| India | [23] | Yes | Yes | Yes | Yes | Yes | Yes | Yes | Yes | Yes |
| India | [24] | Yes | Yes | Yes | Yes | Yes | Yes | Yes | Yes | Yes |
| Pakistan | [25] | Yes | Yes | Yes | No | Yes | Yes | Yes | Yes | Yes |
| India | [26] | Yes | Yes | Yes | No | Yes | Yes | Yes | Yes | Yes |
| India | [27] | Yes | Yes | Yes | No | Yes | Yes | Yes | Yes | Yes |
| India | [28] | Yes | Yes | Yes | Yes | Yes | Yes | Yes | Yes | Yes |
| Nepal | [29] | Yes | Yes | Yes | No | Yes | Yes | Yes | Yes | Yes |
| India | [30] | Yes | Yes | Yes | No | Yes | Yes | Yes | Yes | Yes |
| Pakistan | [31] | Yes | Yes | Yes | Yes | Yes | Yes | Yes | Yes | Yes |
| Nepal | [32] | Yes | Yes | Yes | Yes | Yes | Yes | Yes | Yes | Yes |
| India | [33] | Yes | Yes | Yes | No | Yes | Yes | Yes | Yes | Yes |
| India | [34] | Yes | Yes | Yes | No | Yes | Yes | Yes | Yes | Yes |
| India | [35] | Yes | Yes | Yes | Yes | Yes | Yes | Yes | Yes | Yes |
| India | [36] | Yes | Yes | Yes | Yes | Yes | Yes | Yes | Yes | Yes |
| Pakistan | [37] | Yes | Yes | Yes | No | Yes | Yes | Yes | Yes | Yes |
| Sri Lanka | [38] | Yes | Yes | Yes | Yes | Yes | Yes | Yes | Yes | Yes |
| Nepal | [39] | Yes | Yes | Yes | No | Yes | Yes | Yes | Yes | Yes |
| India | [40] | Yes | Yes | Yes | Yes | Yes | Yes | Yes | Yes | Yes |
| India | [41] | Yes | Yes | Yes | Yes | Yes | Yes | Yes | Yes | Yes |
| Pakistan | [42] | Yes | Yes | Yes | Yes | Yes | Yes | Yes | Yes | Yes |
| Pakistan | [43] | Yes | Yes | Yes | Yes | Yes | Yes | Yes | Yes | Yes |
| Bangladesh | [44] | Yes | Yes | Yes | No | Yes | Yes | Yes | Yes | Yes |
| India | [45] | Yes | Yes | Yes | No | Yes | Yes | Yes | Yes | Yes |
| India | [46] | Yes | Yes | Yes | Yes | Yes | Yes | Yes | Yes | Yes |
| Nepal | [47] | Yes | Yes | Yes | Yes | Yes | Yes | Yes | Yes | Yes |
| India | [48] | Yes | Yes | Yes | No | Yes | Yes | Yes | Yes | Yes |
| India | [49] | Yes | Yes | Yes | Yes | Yes | Yes | Yes | Yes | Yes |
| India | [50] | Yes | Yes | Yes | Yes | Yes | Yes | Yes | Yes | Yes |
| Nepal | [51] | Yes | Yes | Yes | Yes | Yes | Yes | Yes | Yes | Yes |
| Sri Lanka | [52] | Yes | Yes | Yes | Yes | Yes | Yes | Yes | Yes | Yes |
| India | [53] | Yes | Yes | Yes | Yes | Yes | Yes | Yes | Yes | Yes |
| Bangladesh | [54] | Yes | Yes | Yes | Unclear | Yes | Yes | Yes | Yes | Yes |
| India | [55] | Yes | Yes | Yes | Yes | Yes | Yes | Yes | Yes | Yes |
| India | [56] | Yes | Yes | Yes | Yes | Yes | Yes | Yes | Yes | Yes |
| Nepal | [57] | Yes | Yes | Yes | Yes | Yes | Yes | Yes | Yes | Yes |
| Sri Lanka | [58] | Yes | Yes | Yes | Yes | Yes | Yes | Yes | Yes | Yes |
| Pakistan | [59] | Yes | Yes | Yes | Yes | Yes | Yes | Yes | Yes | Yes |
| India | [60] | Yes | Yes | Yes | Yes | Yes | Yes | Yes | Yes | Yes |
| India | [61] | Yes | Yes | Unclear | Yes | Yes | Yes | Yes | Yes | Yes |
| India | [62] | Yes | Yes | Yes | Yes | Yes | Yes | Yes | Yes | Yes |
| India | [63] | Yes | Yes | Yes | Yes | Yes | Yes | Yes | Yes | Yes |
| Bhutan | [64] | Yes | Yes | Yes | Yes | Yes | Yes | Yes | Yes | Yes |
aThe quality of each study was assessed using the Joanna Briggs Institute (JBI) critical appraisal tool [9] that consists of the 9 items listed in the header
Subgroup analysis
Subgroup analyses were conducted based on countries.
Results
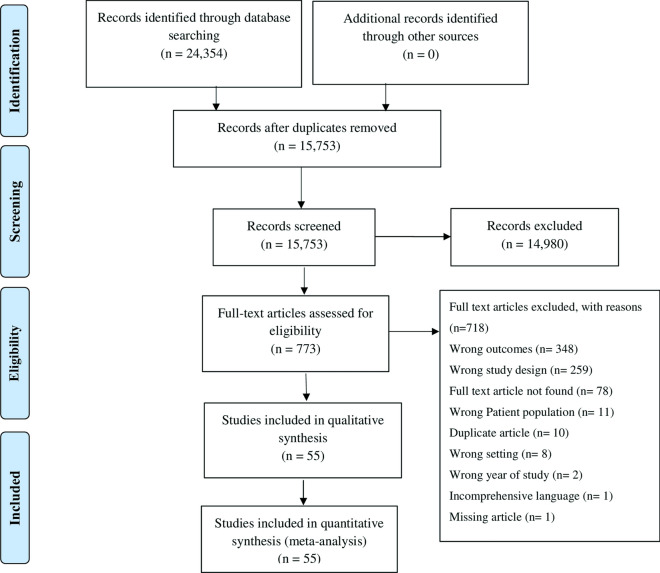
Our thorough search of the databases resulted in the identification of 24,354 studies. Following removal of all duplicate studies, we screened the, titles and abstracts of 15,773 studies, resulting in the exclusion of 14,980 studies; the eligibility of the remaining 773 studies was assessed on the basis of the full text. Ultimately, 55 studies were included in the final quantitative analysis (Fig. 1). The narrative summary is presented in Table 2.
Fig. 1.
PRISMA (Preferred Reporting Items for Systematic Reviews and Meta-Analyses) flow diagram of study selection process
Table 2.
Narrative summary of included studies
| Country | Reference | Study design | Sample size total (n) | Clinically suspected cases (n) | Laboratory-confirmed cases (n) | Age, yearsa | Distribution of patients by sex | Dengue infection according to DENV serotypes (n) | ||||
|---|---|---|---|---|---|---|---|---|---|---|---|---|
| Male (n) | Female (n) | DENV1 | DENV2 | DENV3 | DENV4 | |||||||
| India | [10] | Prospective, cross-sectional | 398 | 398 | 150 | 35.5 ± 11.6 | 201/398 | 197/398 | 6/60 | 25/60 | 7/60 | 22/60 |
| India | [11] | Retrospective, cross-sectional | 1593 | 1593 | 686 | 19 ± 17 | 968/1593 | 625/1593 | NA | NA | NA | NA |
| India | [12] | Retrospective case–control | 50 | NA | 50 | NA | 29/50 | 21//50 | NA | NA | NA | NA |
| India | [13] | Cross-sectional | 712 | 712 | 433 | NA | 370/712 | 342/712 | 191/433 | 115/433 | 89/433 | 38/433 |
| Pakistan | [14] | Retrospective, cross-sectional | 482 | 482 | 172 | 25.9 ± 12.8 (confirmed cases only) | 96/172 | 76/172 | NA | NA | NA | NA |
| India | [15] | Retrospective, cross-sectional | 3677 | 3677 | 503 | NA | NA | NA | NA | NA | NA | NA |
| India | [16] | Cross-sectional | 948 | NA | 948 | NA | 671/948 | 277/948 | NA | NA | NA | NA |
| India | [17] | Cross-sectional | 4370 | 4370 | 1700 | 1046/1700 | 654/1700 | 33/55 | 1/55 | 0/55 | 0/55 | |
| India | [18] | Cross-sectional | 8138 | 8138 | 1600 | NA | NA | NA | NA | NA | NA | |
| Sri Lanka | [19] | Cross-sectional | 1167 | NA | 1167 | 32.9 ± 15 | 773/1167 | 394/1167 | 0/32 | 28/32 | 4/32 | 0/32 |
| Pakistan | [20] | Cross-sectional | 483 | 483 | 110 | NA | 70/110 | 40/110 | 0/17 | 5/17 | 2/17 | 10/17 |
| India | [21] | Cross-sectional | 4366 | 4366 | 1802 | NA | 2653/4366 | 1713/4366 | NA | NA | NA | NA |
| India | [22] | Retrospective, cross-sectional | 216 | NA | 216 | NA | 136/216 | 80/216 | NA | NA | NA | NA |
| India | [23] | Cross-sectional | 4019 | 4019 | 886 | NA | 564/886 | 322/886 | 39/103 | 26/103 | 38/103 | 0/103 |
| India | [24] | Cross-sectional | 1980 | 1980 | 733 | NA | 1335/1980 | 645//1980 | 140/733 (monotypic 63/656) | 488//733 (monotypic 411/656) | 185/733 (monotypic 182/656) | 0/733 |
| Pakistan | [25] | Cross-sectional | 9493 | 9493 | 3504 | NA | 6858/9493 | 2635/9493 | NA | NA | NA | NA |
| India | [26] | Retrospective, cross-sectional | 309 | 309 | 34 | NA | 208/309 | 101/309 | NA | NA | NA | NA |
| India | [27] | Cross-sectional | 289 | 289 | 114 | NA | 84/114 | 30/114 | NA | NA | NA | NA |
| India | [28] | Cross-sectional | 192 | 192 | 143 | NA | 102/192 | 90/192 | 0/5 | 0/5 | 2/5 | 3/5 |
| Nepal | [29] | Cross-sectional | 283 | 283 | 28 | NA | 155/283 | 128/283 | NA | NA | NA | NA |
| India | [30] | Prospective, observational | 182 | NA | 182 | 30 ± 12.6 | 125/182 | 57/182 | NA | NA | NA | NA |
| Pakistan | [31] | Cross-sectional | 310 | NA | 310 | 32.67 ± 16.5 | 198/310 | 112/310 | NA | NA | NA | NA |
| Nepal | [32] | Cross-sectional | 266 | 266 | 45 | NA | 169/266 | 97/266 | NA | NA | NA | NA |
| India | [33] | Cross-sectional | 3312 | 3312 | 1107 | NA | 2054/3312 | 1258/3312 | NA | NA | NA | NA |
| India | [34] | Cross-sectional | 4948 | 4948 | 735 | NA | 502/735 | 233/735 | 3/40 | 6/40 | 13/40 | 1/40 |
| India | [35] | Cross-sectional | 2169 | 2169 | 412 | NA | 1356/2169 | 813/2169 | NA | NA | NA | NA |
| India | [36] | Cross-sectional | 5536 | 5536 | 1536 | NA | NA | NA | 0/60 | 47/60 | 1/60 | 2/60 |
| Pakistan | [37] | Cross-sectional | 612 | 612 | 319 | NA | 489/612 | 123/612 | NA | NA | NA | NA |
| Sri Lanka | [38] | Cross-sectional | 295 | NA | 295 | NA | 153//295 | 142//295 | 0/225 | 219/225 | 3/225 | 3/225 |
| Nepal | [39] | Cross-sectional | 1215 | 1215 | 403 | Median 29.5 (IQR 21.3:40.0) | 645/1215 | 570/1215 | 58/91 | 25/91 | 2/91 | 5/91 |
| India | [40] | Cross-sectional | 1668 | 1668 | 302 | NA | 191/302 | 111/302 | NA | NA | NA | NA |
| India | [41] | Prospective, observational | 313 | 313 | 137 | Median 36.0 (IQR 26.0:52.0) | 75/137 | 62/137 | NA | NA | NA | NA |
| Pakistan | [42] | Retrospective (epidemic report) | 120,948 | 120,948 | 24,938 | 26 ± 19.8 | 16,294/24938 | 8664/24938 | NA | NA | NA | NA |
| Pakistan | [43] | Retrospective, descriptive | 841 | NA | 841 | 31.3 ± 14.0 | 665/841 | 176/841 | NA | NA | NA | NA |
| Bangladesh | [44] | Cross-sectional | 720 | NA | 69 | Median 12 (IQR 4:28) | 454/720 | 268/720 | NA | NA | NA | NA |
| India | [45] | Retrospective, cross-sectional | 640 | 640 | 398 | NA | 380/640 | 260/640 | NA | NA | NA | NA |
| India | [46] | Cross-sectional | 2502 | 2502 | 464 | NA | 268/464 | 196/464 | NA | NA | NA | NA |
| Nepal | [47] | cross sectional | 239 | 239 | 70 | NA | 132/239 | 107/239 | NA | NA | NA | NA |
| India | [48] | Retrospective, cross-sectional | 55 | NA | 55 | NA | 33/55 | 22/55 | NA | NA | NA | NA |
| India | [49] | Cross-sectional | 536 | 536 | 112 | NA | 77/112 | 35/112 | NA | NA | NA | NA |
| India | [50] | Retrospective, cross-sectional | 219 | 219 | 135 | 8.3 ± 3.5 | 77/135 | 58/135 | NA | NA | NA | NA |
| Nepal | [51] | Cross-sectional | 198 | 198 | 42 | 45.75 ± 38.61 | 126/198 | 72/198 | 0/15 | 15/15 | 0/15 | 0/15 |
| Sri Lanka | [52] | Prospective, observational | 108 | NA | 108 | 26.6 ± 9.9 | 64/108 | 44/108 | 1/7 | 1/7 | 5/7 | 0/7 |
| India | [53] | Retrospective, cross-sectional | 5102 | 5102 | 1074 | NA | 664/1074 | 410/1074 | 0/3 | 1/3 | 0/3 | 0/3 |
| Bangladesh | [54] | Cross-sectional | 319 | NA | 319 | 33 ± 14.07 | 223/319 | 97/319 | NA | NA | NA | NA |
| India | [55] | Retrospective analysis | 900 | 900 | 461 | NA | 595/900 | 305/900 | NA | NA | NA | NA |
| India | [56] | Cross-sectional | 1426 | 1426 | 423 | 19 ± 17 | 807/1417 | 610/1417 | NA | NA | NA | NA |
| Nepal | [57] | Cross-sectional | 221 | 221 | 34 | NA | 126/221 | 95/221 | NA | NA | NA | NA |
| Sri Lanka | [58] | Observational | 404 | NA | 183 | NA | 108/183 | 75/183 | NA | NA | NA | NA |
| Pakistan | [59] | Cross-sectional | 5592 | NA | 5592 | NA | 3882/5592 | 1770/5592 | NA | NA | NA | NA |
| India | [60] | Prospective, observational | 81 | NA | 81 | NA | 55/81 | 26/81 | NA | NA | NA | NA |
| India | [61] | Retrospective | 62 | NA | 62 | 23.6 ± 3.53 | 0/62 | 62/62 | NA | NA | NA | NA |
| India | [62] | Community-based, descriptive | 2125 | NA | 226 | NA | 932/2125 | 1193/2125 | NA | NA | NA | NA |
| India | [63] | Retrospective | 858 | NA | 858 | NA | NA | NA | NA | NA | NA | NA |
| Bhutan | [64] | Cross-sectional | 379 | 379 | 119 | 29 ± 2 | 192/379 | 187/379 | 53/58 | 3/58 | 2/58 | 0/58 |
DENV Dengue virus, NA not available, SD standard deviation
aAge is presented as the mean ± standard deviation, or as the median with the interquartile range (IQR) in parentheses
Confirmed dengue-positive cases
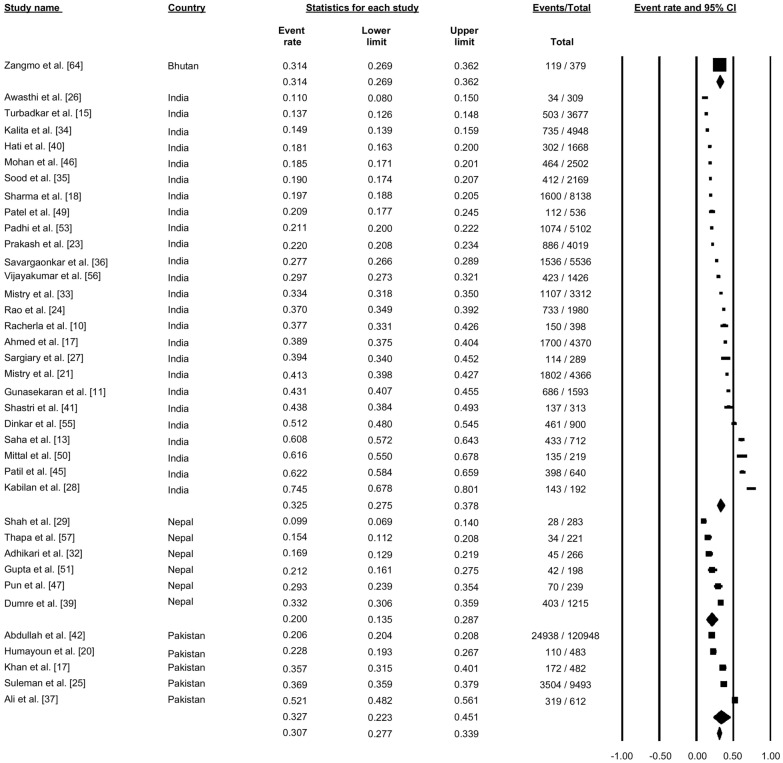
A total of 37 studies reported confirmed dengue cases among suspected cases of dengue (Fig. 2). Pooling of the data using a random-effects model showed that 30.7% (proportion: 0.307, 95% CI: 0.277–0.339, I2: 99.42%) of the suspected cases were confirmed to be dengue. The proportion of confirmed cases varied from country to country in the SAARC countries. In Bhutan, one study reported that the proportion of confirmed dengue cases was 31.4%. In India, 25 studies reported confirmed dengue cases among suspected cases, with the proportion of confirmed cases ranging from 11% to 74.5% across the studies; the pooled proportion of confirmed cases across all studies was 32.5% (progression: 0.325, 95% CI: 0.275–0.378). In Nepal, six studies reported confirmed dengue cases among the suspected cases, with the proportion ranging from 9.9% to 33.2% across different studies; the pooled proportion of confirmed cases was 20% (proportion: 0.200, 95% CI: 0.135–0.287). Five studies from Pakistan reported the proportion of confirmed cases among suspected dengue cases, with a range of 20.5% to 52.1%; the pooled proportion of confirmed cases across all studied was 32.7% (proportion: 0.327, 95% CI: 0.223–0.458) (Fig. 2).
Fig. 2.
Forest plot showing the proportion of dengue cases across different countries among suspected cases of dengue using a random-effect model. Abbreviation: CI confidence, interval
Dengue immunoglobulin M seroprevalence
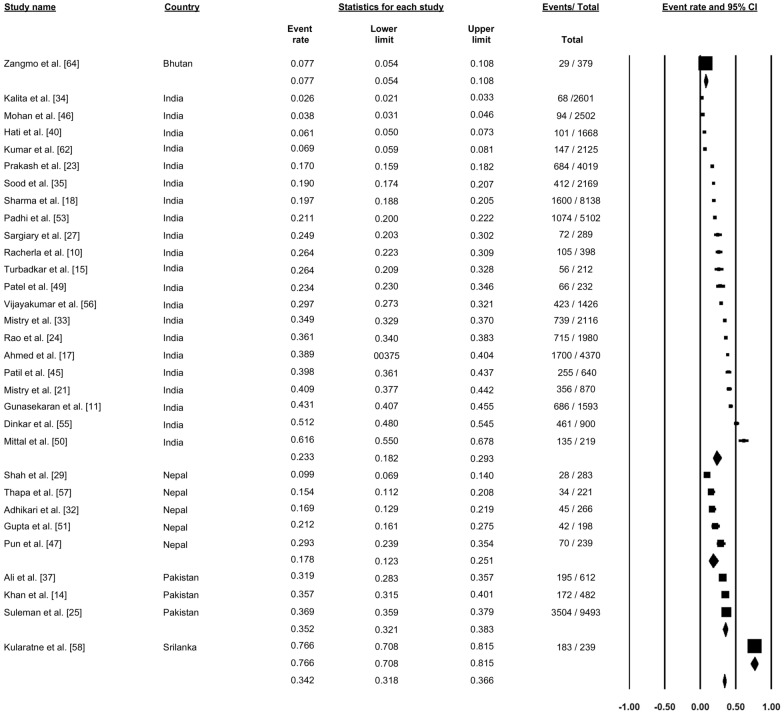
A total of 31 studies reportedly the seroprevalence of dengue immunoglobulin M (IgM) antibodies (Fig. 3). Pooling the data using a random effect model across all the studies showed a seroprevalence of 34.2% (proportion: 0.342, 95% CI: 0.318–0.366, I2: 99.26%). One study from Bhutan showed a seroprevalence of 7.7%, and 21 studies from India reported seroprevalence ranging from 2.6% to 61.6%, with a pooled dengue IgM seroprevalence of 23.3% (proportion: 0.233, 95% CI: 0.182–0.293). Five studies reported seroprevalence from Nepal, ranging from 9.9% to 29.3%, with a pooled dengue IgM seroprevalence 17.8% (proportion: 0.178, 95% CI: 0.123–0.251). Three studies reported dengue IgM seroprevalence from Pakistan, with a pooled prevalence of 35.2% (proportion: 0.352, 95% CI: 0.321–0.383). Finally, one study from Sri Lanka showed a dengue IgM seroprevalence of 76.6% (Fig. 3).
Fig. 3.
Forest plot showing the proportion of seroprevalence of dengue immunoglobulin M (IgM) antibodies across different countries among suspected cases of dengue using a random-effect model
Dengue NS1 seroprevalence
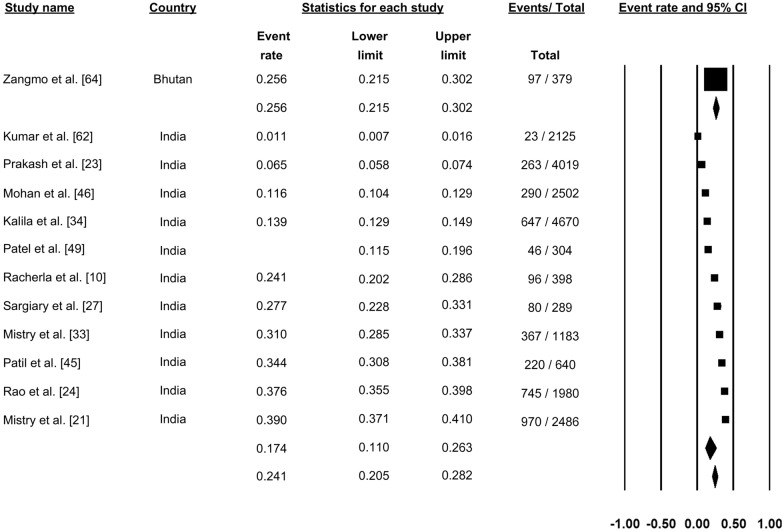
Twelve studies reported the seroprevalence of NS1 antigen, and pooling of these results showed dengue NS1 positivity in 24.1% of the cases (proportion: 0.241, 95% CI: 0.205–0.282, I2: 99.4) (Fig. 4).
Fig. 4.
Forest plot showing the proportion of dengue IgM seroprevalence across different countries among suspected cases of dengue using a random-effect model
Dengue immunoglobulin G seroprevalence
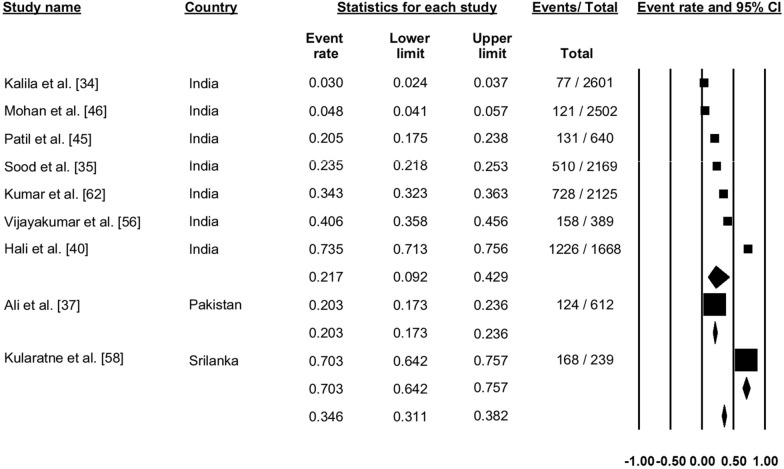
Nine studies reported the seroprevalence of dengue immunoglobulin G (IgG) antibodies (Fig. 5). Pooling of the data showed dengue IgG positivity in 34.6% of cases (proportion: 0.346, 95% CI: 0.311–0.382, I2: 99.67) (Fig. 5).
Fig. 5.
Forest plot showing the proportion of dengue immunoglobulin G (IgG) seroprevalence across different countries among suspected cases of dengue using a random-effect model
Combined dengue IgM and IgG seroprevalence
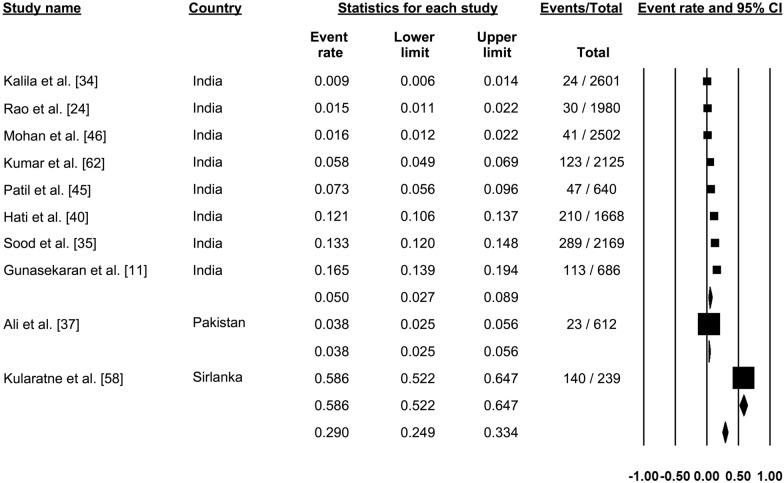
Ten studies reported seroprevalence of both IgM and IgG antibodies of dengue (Fig. 6). Pooling of these results showed positivity for both dengue IgM and IgG antibodies in 29.0% of cases (proportion: 0.290, 95% CI: 0.249–0.334, I2: 99.02) (Fig. 6).
Fig. 6.
Forest plot showing the proportion of both IgM and IgG seroprevalence of dengue across different countries among suspected cases of dengue using a random-effect model
DENV virus strain
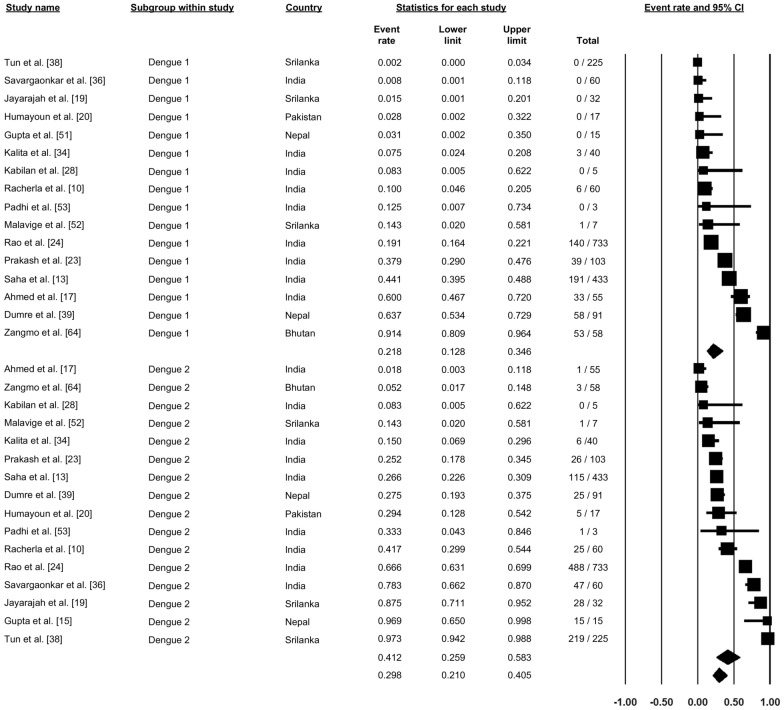
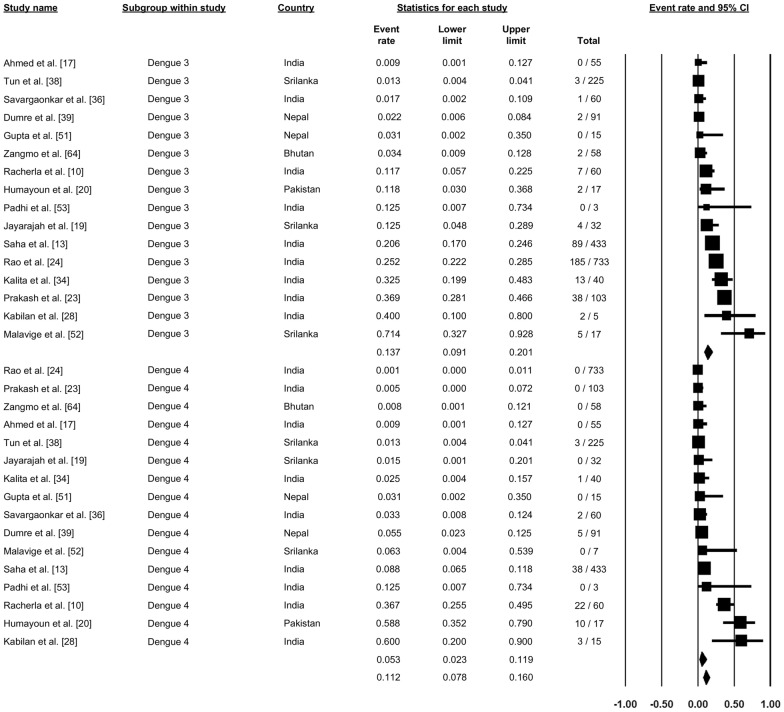
A total of 16 studies reported on the different strains of DENV, with the proportion of different strains varying between studies (Figs. 7, 8). A study from Bhutan reported that DENV-1 was the most prevalent strain in that country (91.4%). Studies from Sri Lanka, India and Nepal reported differences in the prevalence of specific strains among these three countries, with the predominant DENV strain(s) being DNV-1 and DNV-2 in Nepal, DNV-2 and DNV-3 in Sri Lanka and DNV-4 in Sri Lanka. In contrast, in India, all four strains were reported to be circulating in different parts of the country, with, overall, DENV-1 accounting for 21.8% (proportion: 0.18, 95% CI: 0.128–0.346), DENV-2 accounting for 41.2% (proportion: 0.412, 95% CI: 0.250–0.583), DENV-3 accounting for 14.7% (proportion: 0.137, 95% CI: 0.091–0.201) and DENV-4 accounting for 6.3% (proportion: 0.063, 95% CI: 0.023–0.119) (Figs. 7, 8).
Fig. 7.
Forest plot showing the proportion of dengue virus strains 1 and 2 (DENV-1, DENV-2) across different countries among confirmed cases of dengue using a random-effect model
Fig. 8.
Forest plot showing the proportion of DENV-3 and DENV-4 across different countries among confirmed cases of dengue using a random-effect model
Residential setting (urban versus rural)
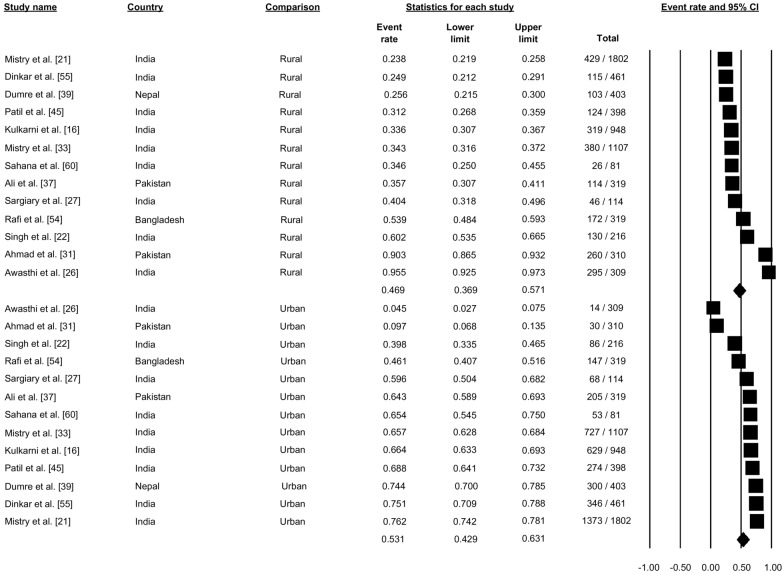
Thirteen studies reported the residential setting of patients with dengue (Fig. 9). Pooling of these data showed the 46.95% of dengue cases were from rural settings (proportion: 0.469, 95% CI: 0.369–0.571) and that 53.1% were from urban residential settings (proportion 0.531, 95% CI: 0.429–0.631) (Fig. 9).
Fig. 9.
Forest plot showing the proportion of dengue cases based on residential setting across different countries among cases of dengue using a random-effect model
Dengue severity
Dengue fever
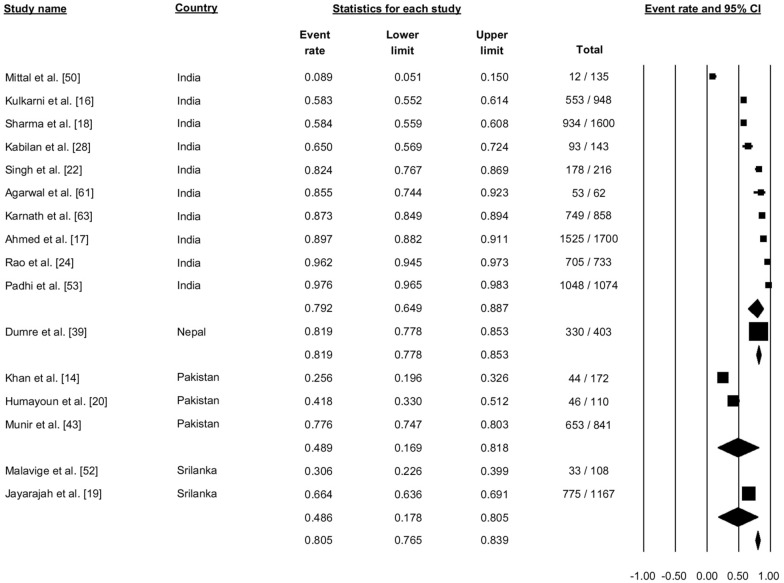
Sixteen studies reported dengue fever (Fig. 10). Pooling the data using the random effects model showed that 80.5% of the cases were categorized as dengue fever (proportion: 0.805, 95% CI: 0.765–0.839, I2: 98.86) (Fig. 10).
Fig. 10.
Forest plot showing the proportion of dengue fever cases across different countries among cases of dengue using a random-effects model
Dengue hemorrhagic fever
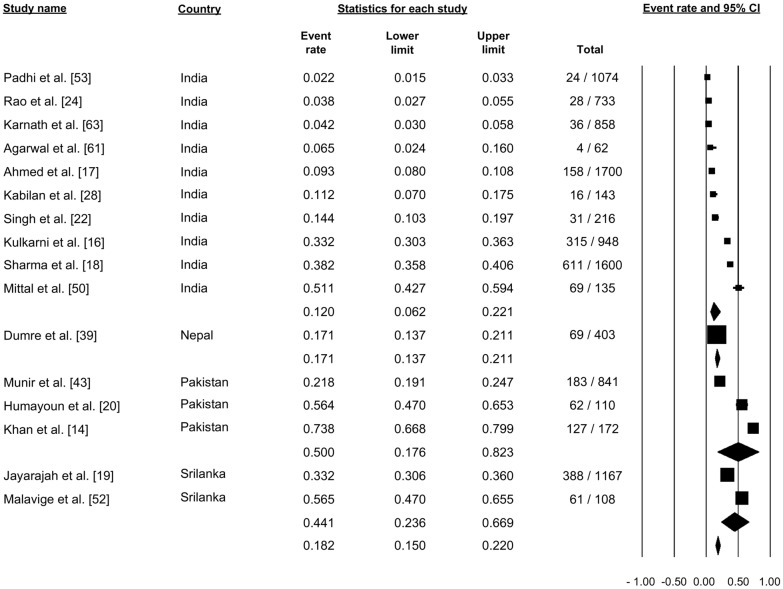
Sixteen studies reported dengue hemorrhagic fever (DHF) (Fig. 11). Pooling of the data using the random-effects model showed that 18.2% of the cases were categorized as DHF (proportion: 0.182,, 95% CI: 0.150–0.220, I2: 98.73) (Fig. 11).
Fig. 11.
Forest plot showing the proportion of dengue hemorrhagic fever cases across different countries among cases of dengue using a random-effects model
Dengue shock syndrome
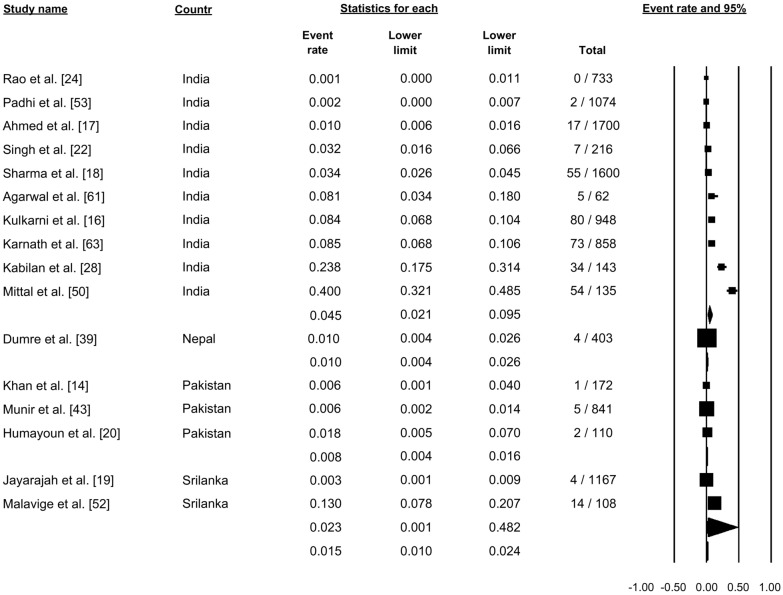
Sixteen studies reported dengue shock syndrome (Fig. 12). Pooling of the data using a random-effects model showed that 1.5% of the cases were categorized as dengue shock syndrome (proportion: 0.015, 95% CI: 0.010–0.024, I2: 96.70) (Fig. 12).
Fig. 12.
Forest plot showing the proportion of dengue shock syndrome cases across different countries among cases of dengue using a random-effects model
Fever as a symptom
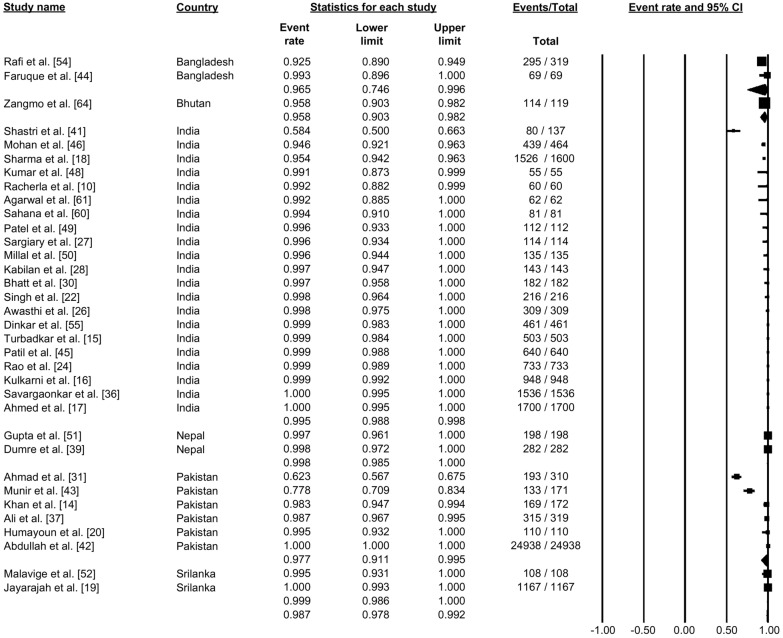
A total of 34 studies reported the status of fever as a symptom (Fig. 13). Pooling the data using the random-effects model showed that 98.7% of the patients had a fever, which was the most typical symptom reported (proportion: 0.987, 95% CI: 0.978–0.992, I2: 95.06) (Fig. 13).
Fig. 13.
Forest plot showing the proportion of fever among cases of dengue across different countries using a random-effects model
Thrombocytopenia
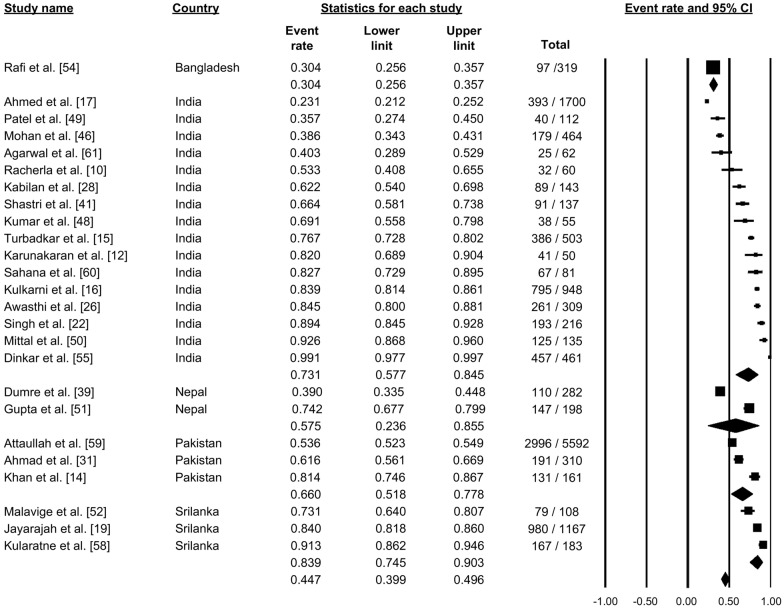
A total of 25 studies reported thrombocytopenia among dengue cases (Fig. 14). Pooling these findings using the random-effects model showed that 44.7% of patients had a low platelet count (proportion: 0.447, 95% CI: 0.399–0.496, I2: 98.77) (Fig. 14).
Fig. 14.
Forest plot showing the proportion of thrombocytopenia among cases of dengue across different countries using a random-effects model
Mortality outcome
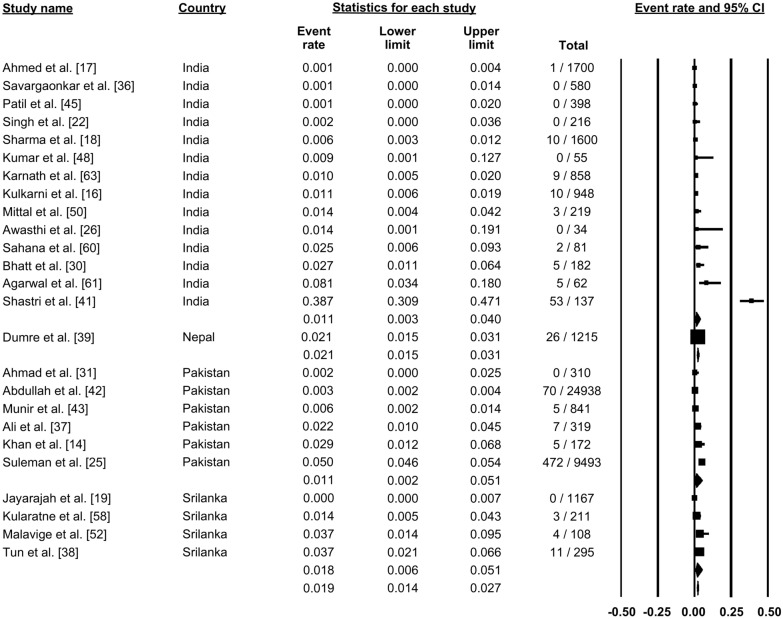
Mortality was reported in 25 studies (Fig. 15). Pooling these data using a random-effects model showed that mortality was reported in 1.9% of dengue cases (proportion: 0.019, 95% CI: 0.014–0.027, I2: 97.4) (Fig. 15).
Fig. 15.
Forest plot showing mortality among cases of dengue across different countries using a random-effects model
Publication bias
Publication bias is among the different outcomes assessed using the Funnel plot and Egger’s test. Rough estimates for publication bias were based on the symmetry of the Funnel plot and confirmed using the Egger’s test. Publication bias was significant for the confirmed dengue-positive cases and the ‘fever as a symptom’ outcome (P < 0.05); for the remaining other outcomes, publication bias was not significant (P > 0.05).
Discussion
The present study reports on the epidemiology of dengue infection in SAARC countries over the past 2.5 decades. There was a substantial discrepancy in the proportion of laboratory-confirmed dengue infections among the SAARC countries, with the highest proportion reported in Pakistan and the lowest reported in Nepal. The overall pooled proportion of confirmed cases among suspected cases was 30.7%, with a significantly increased heterogeneity that varies according to country and time frame of the studies, infection marker of interest, severity and outcome [65]. This prevalence is very high compared to the pooled proportion of autochthonous dengue infections in Europe (0.7%). In a systematic review study by Ganeshkumar et al. in 2018, the pooled proportion of dengue infections in India was 38.3% [66]. We were unable to determine the proportion of dengue infections in a number of SAARC countries, including Afghanistan, Bangladesh, Maldives and Sri Lanka, due to the lack of published studied from these countries.
In this study, the pooled seroprevalence of dengue infection based on markers, namely IgM and IgG antibodies and NS1 antigen was 34.2, 35.2 and 24.1%, respectively. In comparison, the pooled seroprevalence of dengue infection based on both IgM and IgG seropositivity was 29.0%. These values are similar to those reported by Li et al., who found that the worldwide seroprevalence of dengue infection was 38%, with the highest dengue seroprevalence, namely 56%, in the South East Asia region and the lowest, namely 4%, in the European arena [67]. However, IgM, IgG and DENV-RNA pooled seroprevalence in febrile participants of Africa was reported to be 8.4, 10.8 and 24.8%, respectively [68]. Similarly, the seroprevalence in the general population of the Middle East and North Africa was reported by Humphrey et al. to be 25% (range: 0–62%) from 1941 to 2015 [69].
The likely explanation for the increased clinical and serological prevalence of dengue cases in SAARC countries could be the climate, geographic distribution of mosquito vectors, urbanization and absence or failure of appropriate vector control measures [70–73]. Based on a thermodynamic model, dengue virus transmission increases at a mean temperature of < 18 °C as the diurnal temperature range increases, indicating that small fluctuations in temperature favor dengue virus development [74, 75].
Our study showed that different strains of the dengue virus were predominant in different countries of SAARC. DENV-2 was most predominant dengue virus strain (41.2%), followed by DENV-1 (21.8%). The DENV-2 strain is considered to be the most virulent and life-threatening of the four serotypes [76]. The predominance of different DENV strains in different areas could be due to selection during DENV evolution, as well as viral fitness in the human or mosquito host that allows some lineages to survive better than others [77]. Therefore, the dynamics of serotype oscillations is a complex phenomenon. In our study, DENV-2 and DENV-3 were predominant in Sri Lanka. The novel appearance of DENV-3 in 1989 in Sri Lanka is considered to be responsible for the emergence of DHF in that year. [78] Similarly, in our study, DENV-4 was predominant in Pakistan, but DENV-2, DENV-3 and DENV-4 are known to have co-circulated in Pakistan from 2008 to 2011. These three serotypes share an Indian ancestry and are likely to have been introduced first into southern Pakistan. DENV-2 and DENV-3 had undergone in situ evolution to emerge as distinct, heterogeneous virus populations during the same period [79]. In the same way, all four strains were circulating in India, when a novel clade of DENV-4 (genotype I) abruptly emerged in Pune, India, during the 2016 season [80, 81].
Efforts to combat dengue infection by vaccinating susceptible and high-risk populations have been ongoing globally for over three decades, albeit without much success. Several candidate vaccines against dengue are in the pipeline [82, 83]. Since DENV-2 is known to be widely distributed across India, Nepal and Sri Lanka based on the studies included in our meta-analysis, the live attenuated CYD TDV tetravalent vaccine (Sanofi Pasteur, Lyon, France) that successfully met its targets in the phase III trial would also not be effective for SAARC countries [84] due to the resistance shown by DENV-2 to this vaccine [85, 86].
According to the WHO 2009 classification criteria, dengue cases are classified into dengue without warning signs, dengue with warning signs and severe dengue [87, 93]. However, due to the lack of data based on the WHO 2009 classification and evidence that has become available since the WHO 1997 classification, the severity of dengue has been classified into dengue fever, dengue hemorrhagic fever and dengue shock syndrome. This study showed that most dengue infection cases were less severe.
In our study, thrombocytopenia was present in nearly 50% of all dengue cases, primarily due to bone marrow suppression and increased peripheral destruction of platelets during the febrile and early convalescent phase of the disease [88]. This result is similar to that reported in a retrospective cohort study where the prevalence of thrombocytopenia among patients with confirmed dengue cases was 40.3% [89]. The rapid decline in platelet count indicates dengue with warning signs and helps the healthcare provider to classify the dengue infection. Thrombocytopenia is also a prognostic marker, and a platelet count < 20,000/ml blood is a good predictor of mortality in patients with severe dengue [90].
The results of our study lead us to conclude that the pooled dengue case fatality rate was 1.9% in SAARC countries [66]. This contrasts with a systematic review of dengue infection in India, where the pooled estimate of case fatality rate was 2.6% [80, 81]. The most likely reason for this difference is that in India all dengue strains responsible for multiple dengue outbreaks are circulating. The mortality in dengue cases is multifactorial, determined primarily by prior health status [91].
The WHO has set a target for dengue control by reducing the case fatality rate from 0.8% in 2020 to 0.0% in 2030 [92]. The WHO roadmap against neglected tropical diseases (NTDs) has prioritized a group of 20 NTDs, including dengue fever, that requires a global collaboration of all partners to achieve the target [92]. This dramatically emphasizes the need for an in-depth understanding of the epidemiology of dengue infection to combat it in SAARC countries.
Our systematic review has certain limitations. First, we included peer-reviewed literature from selected databases and excluded gray literature that provided additional data. Secondly, age was not uniformly reported in the included studies, and we did not estimate the prevalence of dengue cases by age. Third, we were not able to categorize the severity of dengue by the WHO 2009 classification since most of the included literature used data on the severity of dengue based on the WHO 1997 classification.
Conclusion
Dengue is common in South East Asian countries, with infected individuals showing a high seroprevalence of dengue IgG, IgM and both (IgM and IgG) antibodies and dengue NS1 antigen, in descending order or seroprevalence. DENV-2 was the most common strain, followed by DENV-1 and DENV-3; DENV-4 was the less reported strain. Fortunately, dengue fever was the most common presentation (80.5%), followed by DHF (18.2%) and dengue shock syndrome (1.5%). As the burden of dengue in the SAARC region is significant, the various governments and stakeholders need to focus on preventive measures, including vector control and timely diagnosis and treatment of the dengue cases.
Supplementary Information
Additional file 2: Electronic search details.
Author contributions
DBS, PB, BG, SS, SA, AB and LBS contributed to the concept and design of the work. DBS, and PB carried out the analysis and interpreted the data. DBS, PB, BG, SS, SA, AB, BA, AA, GKY, BR and AP contributed to the literature search, data extraction, review and initial drafting of the manuscript. MK and LBS helped in interpreting the data and revising the manuscript for important intellectual content. All authors were involved in drafting and revising the manuscript and approved the final version.
Funding
The article did not receive any specific grant from funding agencies in the public, commercial or any other sectors.
Availability of data and materials
The datasets analyzed during the current study are available in the manuscript and supplement files.
Declarations
Ethics approval and consent to participate:
Not applicable.
Consent for publication
Not applicable.
Competing interests
The authors declare that they have no competing interests.
Footnotes
Publisher's Note
Springer Nature remains neutral with regard to jurisdictional claims in published maps and institutional affiliations.
Contributor Information
Dhan Bahadur Shrestha, Email: medhan75@gmail.com.
Pravash Budhathoki, Email: pravash.budhathoki123@gmail.com.
Bipana Gurung, Email: bipanagurung11@gmail.com.
Subash Subedi, Email: subedisubash03@gmail.com.
Shishir Aryal, Email: shishir3aryal@gmail.com.
Anisha Basukala, Email: nepalanisa@gmail.com.
Barun Aryal, Email: beingbarunaryal@gmail.com.
Anurag Adhikari, Email: a.adhikarianu@gmail.com.
Ayusha Poudel, Email: pdlayusha@gmail.com.
Gopal Kumar Yadav, Email: gopalbpkihs@gmail.com.
Mtanis Khoury, Email: mtaniskhoury@gmail.com.
Binod Rayamajhee, Email: b.rayamajhee@unsw.edu.au.
Lok Bahadur Shrestha, Email: lok.shrestha@bpkihs.edu.
References
- 1.Wartel TA, Prayitno A, Hadinegoro SRS, Capeding MR, Thisyakorn U, Tran NH, et al. Three decades of dengue surveillance in five highly endemic South East Asian Countries. Asia Pac J Public Heal. 2017;29:7–16. doi: 10.1177/1010539516675701. [DOI] [PubMed] [Google Scholar]
- 2.Bhatt S, Gething PW, Brady OJ, Messina JP, Farlow AW, Moyes CL, et al. The global distribution and burden of dengue. Nature. 2013;496:504–507. doi: 10.1038/nature12060. [DOI] [PMC free article] [PubMed] [Google Scholar]
- 3.Simo FBN, Bigna JJ, Kenmoe S, Ndangang MS, Temfack E, Moundipa PF, et al. Dengue virus infection in people residing in Africa: a systematic review and meta-analysis of prevalence studies. Sci Rep. 2019;9:13626. doi: 10.1038/s41598-019-50135-x. [DOI] [PMC free article] [PubMed] [Google Scholar]
- 4.Ooi E-E, Gubler DJ. Dengue in Southeast Asia: epidemiological characteristics and strategic challenges in disease prevention. Cad Saude Publica. 2009;25:S115–S124. doi: 10.1590/s0102-311x2009001300011. [DOI] [PubMed] [Google Scholar]
- 5.Shepard DS, Undurraga EA, Halasa YA. Economic and disease burden of dengue in Southeast Asia. PLoS Negl Trop Dis. 2013;7:e2055. doi: 10.1371/journal.pntd.0002055. [DOI] [PMC free article] [PubMed] [Google Scholar]
- 6.Stroup DF, Berlin JA, Morton SC, Olkin I, Williamson GD, Rennie D, et al. Meta-analysis of observational studies in epidemiology—a proposal for reporting. JAMA. 2000;283:2008–2012. doi: 10.1001/jama.283.15.2008. [DOI] [PubMed] [Google Scholar]
- 7.Budhathoki P, Shrestha D, Gurung B, Subedi S, Aryal S, Basukala A, et al. Epidemiology of dengue in SAARC territory, its risk factors and outcome: a systematic review and meta-analysis. PROSPERO. 2020;2020:CRD42020215737. doi: 10.1186/s13071-022-05409-1. [DOI] [PMC free article] [PubMed] [Google Scholar]
- 8.Veritas Health Innovation. Covidence systematic review software. www.covidence.org. Accessed 13 May 2021.
- 9.Joanna Briggs Institute (JBI). Critical appraisal tools. https://jbi.global/critical-appraisal-tools. Accessed 28 Nov 2021.
- 10.Racherla RG, Pamireddy ML, Mohan A, Mudhigeti N, Mahalakshmi PA, Nallapireddy U, et al. Co-circulation of four dengue serotypes at South Eastern Andhra Pradesh, India: a prospective study. Indian J Med Microbiol. 2018;36:236–40. doi: 10.4103/ijmm.IJMM_18_109. [DOI] [PubMed] [Google Scholar]
- 11.Gunasekaran P, Kaveri K, Mohana S, Arunagiri K, Suresh Babu BV, Padma Priya P, et al. Dengue disease status in Chennai (2006–2008): a retrospective analysis. Indian J Med Res. 2011;133:322–325. [PMC free article] [PubMed] [Google Scholar]
- 12.Karunakaran A, Ilyas WM, Sheen SF, Jose NK, Nujum ZT. Risk factors of mortality among dengue patients admitted to a tertiary care setting in Kerala, India. J Infect Public Health. 2014;7:114–20. doi: 10.1016/j.jiph.2013.09.006. [DOI] [PubMed] [Google Scholar]
- 13.Saha K, Ghosh M, Firdaus R, Biswas A, Seth B, Bhattacharya D, et al. Changing pattern of dengue virus serotypes circulating during 2008–2012 and reappearance of dengue serotype 3 may cause outbreak in Kolkata. India J Med Virol. 2016;88:1697–1702. doi: 10.1002/jmv.24529. [DOI] [PubMed] [Google Scholar]
- 14.Khan E, Siddiqui J, Shakoor S, Mehraj V, Jamil B, Hasan R. Dengue outbreak in Karachi, Pakistan, 2006: experience at a tertiary care center. Trans R Soc Trop Med Hyg. 2007;101:1114–1119. doi: 10.1016/j.trstmh.2007.06.016. [DOI] [PubMed] [Google Scholar]
- 15.Turbadkar D, Ramchandran A, Mathur M, Gaikwad S. Laboratory and clinical profile of dengue: a study from Mumbai. Ann Trop Med Public Heal. 2012;5:20–23. [Google Scholar]
- 16.Kulkarni MJ, Sarathi V, Bhalla V, Shivpuri D, Acharya U. Clinico-epidemiological profile of children hospitalized with dengue. Indian J Pediatr. 2010;77:1103–1107. doi: 10.1007/s12098-010-0202-2. [DOI] [PubMed] [Google Scholar]
- 17.Ahmed NH, Broor S. Dengue fever outbreak in Delhi, North India: a clinico-epidemiological study. Indian J Commun Med. 2015;40:135–138. doi: 10.4103/0970-0218.153884. [DOI] [PMC free article] [PubMed] [Google Scholar]
- 18.Sharma Y, Kaur M, Singh S, Pant L, Kudesia M, Jain S. Seroprevalence and trend of dengue cases admitted to a Government hospital, Delhi—5-year study (2006–2010): a look into the age shift. Int J Prev Med. 2012;3:537–543. [PMC free article] [PubMed] [Google Scholar]
- 19.Jayarajah U, de Silva PK, Jayawardana P, Dissanayake U, Kulatunga A, Fernando H, et al. Pattern of dengue virus infections in adult patients from Sri Lanka. Trans R Soc Trop Med Hyg. 2018;112:144–153. doi: 10.1093/trstmh/try034. [DOI] [PubMed] [Google Scholar]
- 20.Humayoun MA, Waseem T, Jawa AA, Hashmi MS, Akram J. Multiple dengue serotypes and high frequency of dengue hemorrhagic fever at two tertiary care hospitals in Lahore during the 2008 dengue virus outbreak in Punjab, Pakistan. Int J Infect Dis. 2010;14:e54–9. doi: 10.1016/j.ijid.2009.10.008. [DOI] [PubMed] [Google Scholar]
- 21.Mistry M, Goswami Y, Chudasama RK, Thakkar D. Epidemiological and demographic characteristics of dengue disease at a tertiary care centre in Saurashtra region during the year 2013. J Vector Borne Dis. 2015;52:299–303. [PubMed] [Google Scholar]
- 22.Singh J, Dinkar A, Atam V, Himanshu D, Gupta KK, Usman K, et al. Awareness and outcome of changing trends in clinical profile of dengue fever: a retrospective analysis of dengue epidemic from january to december 2014 at a tertiary care hospital. J Assoc Phys India. 2017;65:42–46. [PubMed] [Google Scholar]
- 23.Prakash O, Singh DD, Mishra G, Prakash S, Singh A, Gupta S, et al. Observation on dengue cases from a virus diagnostic laboratory of a tertiary care hospital in north India. Indian J Med Res. 2015;142:7–11. doi: 10.4103/0971-5916.176596. [DOI] [PMC free article] [PubMed] [Google Scholar]
- 24.Rao MRK, Padhy RN, Das MK. Episodes of the epidemiological factors correlated with prevailing viral infections with dengue virus and molecular characterization of serotype-specific dengue virus circulation in eastern India. Infect Genet Evol. 2018;58:40–49. doi: 10.1016/j.meegid.2017.12.005. [DOI] [PubMed] [Google Scholar]
- 25.Suleman M, Lee HW, Zaidi SSZ, Alam MM, Nisar N, Aamir UB, et al. Preliminary seroepidemiological survey of dengue infections in Pakistan, 2009–2014. Infect Dis Poverty. 2017;6:1–7. doi: 10.1186/s40249-017-0258-6. [DOI] [PMC free article] [PubMed] [Google Scholar]
- 26.Awasthi S, Singh VK, Kumar S, Kumar A, Dutta S. The changing clinical spectrum of Dengue fever in the 2009 epidemic in north India: a tertiary teaching hospital based study. J Clin Diagn Res. 2012;6:999–1002. [Google Scholar]
- 27.Sargiary P, Das A, Rrajkhowa P, Hhussain PR, Nnath R. First outbreak of dengue in Jorhat District of Assam. J Clin Diagnostic Res. 2018;12:DC01–3. [Google Scholar]
- 28.Kabilan L, Balasubramanian S, Keshava SM, Satyanarayana K. The 2001 dengue epidemic in Chennai. Indian J Pediatr. 2005;72:919–923. doi: 10.1007/BF02731664. [DOI] [PubMed] [Google Scholar]
- 29.Shah Y, Katuwal A, Pun R, Pant K, Sherchand SP, Pandey K, et al. Dengue in western Terai region of Nepal. J Nepal Health Res Counc. 2012;10:152–155. [PubMed] [Google Scholar]
- 30.Bhatt M, Soneja M, Farooqui FA, Singla P, Vikram NK, Biswas A, et al. Myocarditis in admitted patients with dengue fever. Infection. 2020;48:899–903. doi: 10.1007/s15010-020-01500-w. [DOI] [PubMed] [Google Scholar]
- 31.Ahmed MS, Zeb R, Zeb J, Khan A, Khan Y. Outcome of dengue fever admitted at district head quarter hospital Kohat, Pakistan during 2015–16. Rawal Med J. 2018;43:377–380. [Google Scholar]
- 32.Adhikari S, Neupane B, Rijal KR, Banjara MR, Uphadhaya BP, Ghimire P. Burden estimation of dengue at National Public Health Laboratory, Kathmandu. Asian Pac J Trop Dis. 2015;5:289–92. [Google Scholar]
- 33.Mistry M, Chudasama R, Goswami Y, Dalwadi C, Mitra A, Mehta G. Epidemiological characteristics of dengue disease in Saurashtra region, India, during year 2015. J Fam Med Prim Care. 2017;6:249. doi: 10.4103/2249-4863.220003. [DOI] [PMC free article] [PubMed] [Google Scholar]
- 34.Kalita JM, Aggarwal A, Yedale K, Gadepalli R, Nag VL. A 5-year study of dengue seropositivity among suspected cases attending a teaching hospital of North-Western region of India. J Med Virol. 2021;93:3338–3343. doi: 10.1002/jmv.26592. [DOI] [PubMed] [Google Scholar]
- 35.Sood S. A hospital based serosurveillance study of dengue infection in Jaipur (Rajasthan) India J Clin Diagn Res. 2013;7:1917–1920. doi: 10.7860/JCDR/2013/5562.3357. [DOI] [PMC free article] [PubMed] [Google Scholar]
- 36.Savargaonkar D, Sinha S, Srivastava B, Nagpal BN, Sinha A, Shamim A, et al. An epidemiological study of dengue and its coinfections in Delhi. Int J Infect Dis. 2018;74:41–6. doi: 10.1016/j.ijid.2018.06.020. [DOI] [PubMed] [Google Scholar]
- 37.Ali A, Rehman Ur H, Nisar M, Rafique S, Ali S, Hussain A, et al. Seroepidemiology of dengue fever in Khyber Pakhtunkhawa, Pakistan. Int J Infect Dis. 2013;17:e518–23. doi: 10.1016/j.ijid.2013.01.007. [DOI] [PubMed] [Google Scholar]
- 38.Ngwe Tun MM, Muthugala R, Nabeshima T, Rajamanthri L, Jayawardana D, Attanayake S, et al. Unusual, neurological and severe dengue manifestations during the outbreak in Sri Lanka, 2017. J Clin Virol. 2020;125:104304. doi: 10.1016/j.jcv.2020.104304. [DOI] [PubMed] [Google Scholar]
- 39.Dumre SP, Bhandari R, Shakya G, Shrestha SK, Cherif MS, Ghimire P, et al. Dengue virus serotypes 1 and 2 responsible for major dengue outbreaks in Nepal: clinical, laboratory, and epidemiological features. Am J Trop Med Hyg. 2017;97:1062–1069. doi: 10.4269/ajtmh.17-0221. [DOI] [PMC free article] [PubMed] [Google Scholar]
- 40.Hati AK. Dengue serosurveillance in Kolkata, facing an epidemic in West Bengal. India J Vector Borne Dis. 2009;46:197–204. [PubMed] [Google Scholar]
- 41.Shastri PS, Gupta P, Kumar R. A prospective 3 year study of clinical spectrum and outcome of dengue fever in ICU from a tertiary care hospital in North India. Indian J Anaesth. 2020;64:181–186. doi: 10.4103/ija.IJA_865_19. [DOI] [PMC free article] [PubMed] [Google Scholar]
- 42.Abdullah Ali S, Salman M, Din M, Khan K, Ahmad M, et al. Dengue outbreaks in khyber pakhtunkhwa (KPK), Pakistan in 2017: an integrated disease surveillance and response system (IDSRS)-based report. Pol J Microbiol. 2019;68:115–9. doi: 10.21307/pjm-2019-013. [DOI] [PMC free article] [PubMed] [Google Scholar]
- 43.Munir MA, Alam SE, Khan ZU, Saeed Q, Arif A, Iqbal R, et al. Dengue fever in patients admitted in tertiary care hospitals in Pakistan. J Pak Med Assoc. 2014;64:553–559. [PubMed] [Google Scholar]
- 44.Faruque LI, Zaman RU, Alamgir ASM, Gurley ES, Haque R, Rahman M, et al. Hospital-based prevalence of malaria and dengue in febrile patients in Bangladesh. Am J Trop Med Hyg. 2012;86:58–64. doi: 10.4269/ajtmh.2012.11-0190. [DOI] [PMC free article] [PubMed] [Google Scholar]
- 45.Patil PS, Chandi DH, Damke S, Mahajan S, Ashok R, Basak S. A retrospective study of clinical and laboratory profile of dengue fever in tertiary care Hospital, Wardha, Maharashtra. India J Pure Appl Microbiol. 2020;14:1935–1939. [Google Scholar]
- 46.Mohan K, Malaiyan J, Nasimuddin S, Devasir RS, Meenakshi-Sundaram P, Selvaraj S, et al. Clinical profile and atypical manifestation of dengue fever cases between 2011 and 2018 in Chennai. India J Fam Med Prim care. 2020;9:1119–1123. doi: 10.4103/jfmpc.jfmpc_926_19. [DOI] [PMC free article] [PubMed] [Google Scholar]
- 47.Pun R, Pant KP, Bhatta DR, Pandey BD. Acute dengue infection in the western terai region of Nepal. J Nepal Med Assoc. 2011;51:11–14. [PubMed] [Google Scholar]
- 48.Kumar R, Sekhar G, Ananthi N, Kalyani M. Clinical profile, laboratory investigations and outcome in dengue positive children in South India. Int J Res Pharm Sci. 2020;11:175–180. [Google Scholar]
- 49.Patel ND, Desai KJ, Sarvaiya J, Malek S, Patel ND. Clinico-laboratory profile of dengue patients at Sir T. Hospital, Bhavnagar. India. Acta Med Iran. 2020;58:69–72. [Google Scholar]
- 50.Mittal H, Faridi MMA, Arora SK, Patil R. Clinicohematological profile and platelet trends in children with dengue during 2010 epidemic in North India. Indian J Pediatr. 2012;79:467–471. doi: 10.1007/s12098-011-0586-7. [DOI] [PubMed] [Google Scholar]
- 51.Gupta BP, Singh S, Kurmi R, Malla R, Sreekumar E, Das MK. Re-emergence of dengue virus serotype 2 strains in the 2013 outbreak in Nepal. Indian J Med Res. 2015;142:1–6. doi: 10.4103/0971-5916.176564. [DOI] [PMC free article] [PubMed] [Google Scholar]
- 52.Malavige GN, Velathanthiri VGNS, Wijewickrama ES, Fernando S, Jayaratne SD, Aaskov J, et al. Patterns of disease among adults hospitalized with dengue infections. QJM. 2006;99:299–305. doi: 10.1093/qjmed/hcl039. [DOI] [PubMed] [Google Scholar]
- 53.Padhi S, Dash M, Panda P, Parida B, Mohanty I, Sahu S, et al. A three year retrospective study on the increasing trend in seroprevalence of dengue infection from southern Odisha, India. Indian J Med Res. 2014;140:660–664. [PMC free article] [PubMed] [Google Scholar]
- 54.Rafi A, Mousumi AN, Ahmed R, Chowdhury RH, Wadood A, Hossain G. Dengue epidemic in a non-endemic zone of Bangladesh: clinical and laboratory profiles of patients. PLoS Negl Trop Dis. 2020;14:1–14. doi: 10.1371/journal.pntd.0008567. [DOI] [PMC free article] [PubMed] [Google Scholar]
- 55.Dinkar A, Singh J. Dengue infection in North India: an experience of a tertiary care center from 2012 to 2017. Tzu Chi Med J. 2020;32:36–40. doi: 10.4103/tcmj.tcmj_161_18. [DOI] [PMC free article] [PubMed] [Google Scholar]
- 56.Vijayakumar TS, Chandy S, Sathish N, Abraham M, Abraham P, Sridharan G. Is dengue emerging as a major public health problem? Indian J Med Res. 2005;121:100–107. [PubMed] [Google Scholar]
- 57.Thapa S, Pant ND, Shrestha R, Gc G, Shrestha B, Pandey BD, et al. Prevalence of dengue and diversity of cultivable bacteria in vector Aedes aegypti (L.) from two dengue endemic districts, Kanchanpur and Parsa of Nepal. J Health Popul Nutr. 2017;36:5. doi: 10.1186/s41043-017-0080-6. [DOI] [PMC free article] [PubMed] [Google Scholar]
- 58.Kularatne SAM, Gawarammana IB, Kumarasiri PRV. Epidemiology, clinical features, laboratory investigations and early diagnosis of dengue fever in adults: a descriptive study in Sri Lanka. Southeast Asian J Trop Med Public Health. 2005;36:686–692. [PubMed] [Google Scholar]
- 59.Attaullah Iqbal N, Nabi Khan G, Muhammad Yousafzai A, Ahmad N, Alaudin Khan S, et al. Incidence of dengue virus eruption in Swat. Asian Pac J Trop Dis. 2017;7:129–31. [Google Scholar]
- 60.Sahana KS, Sujatha R. Clinical profile of dengue among children according to revised WHO classification: analysis of a 2012 outbreak from Southern India. Indian J Pediatr. 2015;82:109–113. doi: 10.1007/s12098-014-1523-3. [DOI] [PubMed] [Google Scholar]
- 61.Agarwal K, Malik S, Mittal P. A retrospective analysis of the symptoms and course of dengue infection during pregnancy. Int J Gynaecol Obstet. 2017;139:4–8. doi: 10.1002/ijgo.12245. [DOI] [PubMed] [Google Scholar]
- 62.Vikram K, Nagpal BN, Pande V, Srivastava A, Saxena R, Anvikar A, et al. An epidemiological study of dengue in Delhi, India. Acta Trop. 2016;153:21–7. doi: 10.1016/j.actatropica.2015.09.025. [DOI] [PubMed] [Google Scholar]
- 63.Kamath SR, Ranjit S. Clinical features, complications and atypical manifestations of children with severe forms of dengue hemorrhagic fever in South India. Indian J Pediatr. 2006;73:889–895. doi: 10.1007/BF02859281. [DOI] [PMC free article] [PubMed] [Google Scholar]
- 64.Zangmo S, Klungthong C, Chinnawirotpisan P, Tantimavanich S, Kosoltanapiwat N, Thaisomboonsuk B, et al. Epidemiological and molecular characterization of dengue virus circulating in Bhutan, 2013–2014. PLoS Negl Trop Dis. 2015;9:2013–2014. doi: 10.1371/journal.pntd.0004010. [DOI] [PMC free article] [PubMed] [Google Scholar]
- 65.Sirisena PD, Noordeen F. Evolution of dengue in Sri Lanka—changes in the virus, vector, and climate. Int J Infect Dis. 2014;19:6–12. doi: 10.1016/j.ijid.2013.10.012. [DOI] [PubMed] [Google Scholar]
- 66.Ganeshkumar P, Murhekar MV, Poornima V, Saravanakumar V, Sukumaran K, Anandaselvasankar A, et al. Dengue infection in India: a systematic review and meta-analysis. PLoS Negl Trop Dis. 2018;12:e0006618. doi: 10.1371/journal.pntd.0006618. [DOI] [PMC free article] [PubMed] [Google Scholar]
- 67.Li Z, Wang J, Cheng X, Hu H, Guo C, Huang J, et al. The worldwide seroprevalence of DENV, CHIKV and ZIKV infection: a systematic review and meta-analysis. PLoS Negl Trop Dis. 2021;15:e0009337. doi: 10.1371/journal.pntd.0009337. [DOI] [PMC free article] [PubMed] [Google Scholar]
- 68.Simo FBN, Bigna JJ, Kenmoe S, Ndangang MS, Temfack E, Moundipa PF, et al. Dengue virus infection in people residing in Africa: a systematic review and meta-analysis of prevalence studies. Sci Rep. 2019;9:1–9. doi: 10.1038/s41598-019-50135-x. [DOI] [PMC free article] [PubMed] [Google Scholar]
- 69.Humphrey JM, Cleton NB, Reusken CB, Glesby MJ, Koopmans MP, Abu-Raddad LJ. Dengue in the Middle East and North Africa: a systematic review. PLoS Negl Trop Dis. 2016;10:e0005194. doi: 10.1371/journal.pntd.0005194. [DOI] [PMC free article] [PubMed] [Google Scholar]
- 70.Rijal KR, Adhikari B, Ghimire B, Dhungel B, Pyakurel UR, Shah P, et al. Epidemiology of dengue virus infections in Nepal, 2006–2019. Infect Dis Poverty. 2021;10:1–10. doi: 10.1186/s40249-021-00837-0. [DOI] [PMC free article] [PubMed] [Google Scholar]
- 71.Li Y, Kamara F, Zhou G, Puthiyakunnon S, Li C, Liu Y, et al. Urbanization increases Aedes albopictus larval habitats and accelerates mosquito development and survivorship. PLoS Negl Trop Dis. 2014;8:e3301. doi: 10.1371/journal.pntd.0003301. [DOI] [PMC free article] [PubMed] [Google Scholar]
- 72.Buhler C, Winkler V, Runge-Ranzinger S, Boyce R, Horstick O. Environmental methods for dengue vector control—a systematic review and meta-analysis. PLoS Negl Trop Dis. 2019;13:e0007420. doi: 10.1371/journal.pntd.0007420. [DOI] [PMC free article] [PubMed] [Google Scholar]
- 73.Bowman LR, Donegan S, McCall PJ. Is dengue vector control deficient in effectiveness or evidence?: Systematic review and meta-analysis. PLoS Negl Trop Dis. 2016;10:e0004551. doi: 10.1371/journal.pntd.0004551. [DOI] [PMC free article] [PubMed] [Google Scholar]
- 74.Mutheneni SR, Morse AP, Caminade C, Upadhyayula SM. Dengue burden in India: recent trends and importance of climatic parameters. Emerg Microbes Infect. 2019 doi: 10.1038/emi201757. [DOI] [PMC free article] [PubMed] [Google Scholar]
- 75.Lambrechts L, Paaijmans KP, Fansiri T, Carrington LB, Kramer LD, Thomas MB, et al. Impact of daily temperature fluctuations on dengue virus transmission by Aedes aegypti. Proc Natl Acad Sci USA. 2011;108:7460–5. doi: 10.1073/pnas.1101377108. [DOI] [PMC free article] [PubMed] [Google Scholar]
- 76.Gupta B, Reddy BPN. Fight against dengue in India: progresses and challenges. Parasitol Res. 2013;112:1367–78. doi: 10.1007/s00436-013-3342-2. [DOI] [PubMed] [Google Scholar]
- 77.Hang VTT, Holmes EC, Veasna D, Quy NT, Hien TT, Quail M, et al. Emergence of the Asian 1 genotype of dengue virus serotype 2 in Vietnam: in vivo fitness advantage and lineage replacement in South-East Asia. PLoS Negl Trop Dis. 2010;4:e757. doi: 10.1371/journal.pntd.0000757. [DOI] [PMC free article] [PubMed] [Google Scholar]
- 78.Messer WB, Gubler DJ, Harris E, Sivananthan K, de Silva AM. Emergence and global spread of a dengue serotype 3, subtype III Virus. Emerg Infect Dis. 2003;9:800–9. doi: 10.3201/eid0907.030038. [DOI] [PMC free article] [PubMed] [Google Scholar]
- 79.Koo C, Nasir A, Hapuarachchi HC, Lee KS, Hasan Z, Ng LC, et al. Evolution and heterogeneity of multiple serotypes of Dengue virus in Pakistan, 2006–2011. Virol J. 2013;10:1–10. doi: 10.1186/1743-422X-10-275. [DOI] [PMC free article] [PubMed] [Google Scholar]
- 80.Shrivastava S, Tiraki D, Diwan A, Lalwani SK, Modak M, Mishra AC, et al. Co-circulation of all the four dengue virus serotypes and detection of a novel clade of DENV-4 (genotype I) virus in Pune, India during 2016 season. PLoS ONE. 2018;13:e0192672. doi: 10.1371/journal.pone.0192672. [DOI] [PMC free article] [PubMed] [Google Scholar]
- 81.Vaddadi K, Gandikota C, Jain PK, Prasad VS, Venkataramana M. Co-circulation and co-infections of all dengue virus serotypes in Hyderabad, India 2014. Epidemiol Infect. 2017;145:2563–74. doi: 10.1017/S0950268817001479. [DOI] [PMC free article] [PubMed] [Google Scholar]
- 82.Webster DP, Farrar J, Rowland-Jones S. Progress towards a dengue vaccine. Lancet Infect Dis. 2009;9:678–87. doi: 10.1016/S1473-3099(09)70254-3. [DOI] [PubMed] [Google Scholar]
- 83.Bharati K, Vrati S. Viral vaccines in india: an overview. Proc Natl Acad Sci India Sect B Biol Sci. 2012;82:181–98. doi: 10.1007/s40011-011-0014-9. [DOI] [PMC free article] [PubMed] [Google Scholar]
- 84.Guy B, Briand O, Lang J, Saville M, Jackson N. Development of the Sanofi Pasteur tetravalent dengue vaccine: one more step forward. Vaccine. 2015;33:7100–7111. doi: 10.1016/j.vaccine.2015.09.108. [DOI] [PubMed] [Google Scholar]
- 85.Halstead SB. Dengue vaccine development: a 75% solution? Lancet. 2012;380:1535–6. doi: 10.1016/S0140-6736(12)61510-4. [DOI] [PubMed] [Google Scholar]
- 86.Sabchareon A, Wallace D, Sirivichayakul C, Limkittikul K, Chanthavanich P, Suvannadabba S, et al. Protective efficacy of the recombinant, live-attenuated, CYD tetravalent dengue vaccine in Thai schoolchildren: a randomised, controlled phase 2b trial. Lancet. 2012;380:1559–67. doi: 10.1016/S0140-6736(12)61428-7. [DOI] [PubMed] [Google Scholar]
- 87.Dussart P, Duong V, Bleakley K, Fortas C, Try PL, Kim KS, et al. Comparison of dengue case classification schemes and evaluation of biological changes in different dengue clinical patterns in a longitudinal follow-up of hospitalized children in Cambodia. PLoS Negl Trop Dis. 2020;14:e0008603. doi: 10.1371/journal.pntd.0008603. [DOI] [PMC free article] [PubMed] [Google Scholar]
- 88.Guzman MG, Gubler DJ, Izquierdo A, Martinez E, Halstead SB. Dengue infection. Nat Rev Dis Prim. 2016;2:1–25. doi: 10.1038/nrdp.2016.55. [DOI] [PubMed] [Google Scholar]
- 89.Castilho BM, Silva MT, Freitas ARR, Fulone I, Lopes LC. Factors associated with thrombocytopenia in patients with dengue fever: a retrospective cohort study. BMJ Open. 2020;10:e035120. doi: 10.1136/bmjopen-2019-035120. [DOI] [PMC free article] [PubMed] [Google Scholar]
- 90.Pinto RC, de Castro DB, de Albuquerque BC, de Sampaio V, S, Passos RA dos, Costa CF da, , et al. Mortality predictors in patients with severe dengue in the State of Amazonas, Brazil. PLoS ONE. 2016;11:e0161884. doi: 10.1371/journal.pone.0161884. [DOI] [PMC free article] [PubMed] [Google Scholar]
- 91.Fonseca-Portilla R, Martínez-Gil M, Morgenstern-Kaplan D. Risk factors for hospitalization and mortality due to dengue fever in a Mexican population: a retrospective cohort study. Int J Infect Dis. 2021;110:332–6. doi: 10.1016/j.ijid.2021.07.062. [DOI] [PubMed] [Google Scholar]
- 92.WHO. Ending the neglect to attain the Sustainable Development Goals. https://apps.who.int/iris/handle/10665/332094. Accessed 1 Nov 2021.
- 93.WHO. Dengue guidelines, for diagnosis, treatment, prevention and control. 2009.https://www.who.int/publications/i/item/9789241547871. [PubMed]
Associated Data
This section collects any data citations, data availability statements, or supplementary materials included in this article.
Supplementary Materials
Additional file 2: Electronic search details.
Data Availability Statement
The datasets analyzed during the current study are available in the manuscript and supplement files.


