

Abstract
Aims
Low-density lipoprotein (LDL-C) lowering is imperative in cardiovascular disease prevention. We aimed to compare accuracy of three clinically-implemented LDL-C equations in a clinical trial of cholesterol ester transfer protein (CETP) inhibition.
Methods and results
Men and women aged 18–75 years with dyslipidaemia were recruited from 17 sites in the Netherlands and Denmark. Patients were randomly assigned to one of nine groups using various combinations of the CETP inhibitor TA-8995 (obicetrapib), statin therapy, and placebo. In pooled measurements over 12 weeks, we calculated LDL-C by the Friedewald, Martin/Hopkins, and Sampson equations, and compared values with preparative ultracentrifugation (PUC) LDL-C overall and with a special interest in the low LDL-C/high triglycerides subgroup. There were 242 patients contributing 921 observations. Overall median LDL-C differences between estimates and PUC were small: Friedewald, 0.00 (25th, 75th: −0.10, 0.08) mmol/L [0 (−4, 3) mg/dL]; Martin/Hopkins, 0.02 (−0.08, 0.10) mmol/L [1 (−3, 4) mg/dL]; and Sampson, 0.05 (−0.03, 0.15) mmol/L [2 (−1, 6) mg/dL]. In the subgroup with estimated LDL-C <1.8 mmol/L (<70 mg/dL) and triglycerides 1.7–4.5 mmol/L (150−399 mg/dL), the Friedewald equation underestimated LDL-C with a median difference versus PUC of −0.25 (−0.33, −0.10) mmol/L [−10 (−13, −4) mg/dL], whereas the median difference by Martin/Hopkins was 0.00 (−0.08, 0.10) mmol/L [0 (−3, 4) mg/dL] and by Sampson was −0.06 (−0.13, 0.00) mmol/L [−2 (−5, 0) mg/dL]. In this subgroup, the proportion of LDL-C observations <1.8 mmol/L (<70 mg/dL) that were correctly classified compared with PUC was 71.4% by Friedewald vs. 100.0% by Martin/Hopkins and 93.1% by Sampson.
Conclusion
In European patients with dyslipidaemia receiving a CETP inhibitor, we found improved LDL-C accuracy using contemporary equations vs. the Friedewald equation, and the greatest accuracy was observed with the Martin/Hopkins equation.
Registration
Keywords: Low-density lipoprotein cholesterol, Accuracy, Cholesterol ester transfer protein inhibition, Friedewald equation, Martin/Hopkins equation, Sampson equation
Introduction
Low-density lipoprotein (LDL-C) lowering is central to addressing the global burden of atherosclerotic cardiovascular disease (ASCVD).1–7 In addition to diet and lifestyle modification, the evolving landscape of pharmacotherapies to lower LDL-C is enabling both greater LDL-C lowering and greater reduction in ASCVD risk.6,8 Randomized trials and meta-analyses of statin and non-statin therapies have shown that each 1 mmol/L (or 39 mg/dL) lowering of LDL-C reduces the relative risk of ASCVD by ∼20–25%.3 Increasing evidence supports a combination lipid-lowering strategy to optimally lower LDL-C,6 and supports earlier and longer reductions of LDL-C considering that ASCVD risk is related to cumulative LDL-C exposure.4
Effectively translating the evidence for LDL-C lowering to maximize clinical and public health benefits depends on the availability of accurate LDL-C results from clinical laboratories to guide therapy.9–11 Traditionally, LDL-C has been calculated because the reference method for LDL-C measurement (preparative ultracentrifugation (PUC) or “beta quantification”) is too time-consuming and costly for routine clinical practice.9,10 However, multiple different LDL-C equations are now being used in different laboratories to assess LDL-C, raising questions about which equation to use in clinical trials and daily practice. Furthermore, prior work has raised the possibility that LDL-C accuracy could be impacted by pharmacotherapies, suggesting that cholesterol ester transfer protein (CETP) inhibition could interfere with an accurate assessment of LDL-C.12As the newest-generation CETP inhibitor obicetrapib (TA-8995) enters phase III development, clarifying the ability to accurately assess LDL-C on treatment is particularly timely and relevant.13,14
As such, we compare three clinically implemented LDL-C equations with respect to their accuracy vs. PUC in patients with dyslipidaemia receiving CETP inhibition in a randomized clinical trial. Our analysis focuses on the LDL-C cutpoint of 1.8 mmol/L (70 mg/dL) due to its importance in drug development and in clinical practice as reflected in dyslipidaemia guidelines. While the aim of our analysis is to compare LDL-C equations, we also examine non-high-density lipoprotein cholesterol (non-HDL-C) and apolipoprotein B (apoB) levels, as these are also important atherogenic lipid measures that are recognized by clinical guidelines as risk factors and targets of therapy.1,2
Methods
Study design and participants
Details on the design of the Cholesterol Ester Transfer Protein Inhibition by TA-8995 in Patients with Mild Dyslipidaemia (TULIP) trial have been published previously.15 The trial protocol was registered on ClinicalTrials.gov (NCT01970215). TULIP was a 12-week randomised, double-blind, placebo-controlled, parallel-group phase 2 trial. Men and women aged 18–75 years were recruited beginning in August 2013 through July 2014 from 17 sites, including hospitals and independent clinical research organisations, in the Netherlands and Denmark.
Inclusion required a fasting LDL-C level of 2.5–4.5 mmol/L (97–174 mg/dL), HDL-C level of 0.8–1.8 mmol/L (31–70 mg/dL), and triglyceride (TG) level <4.5 mmol/L (<400 mg/dL) after run-in or washout of lipid-lowering drugs. Key exclusion criteria included clinical manifestations of atherosclerotic vascular disease, type 1 diabetes, uncontrolled type 2 diabetes (haemoglobin A1c ≥8%), uncontrolled hypertension, history of hyperaldosteronism, active muscle disease or persistent creatine kinase >3 times the upper limit of normal, clinically significant renal or hepatic dysfunction, or other clinically significant non-cardiac disease.
TULIP followed the ethical principles in the Declaration of Helsinki, the International Conference on Harmonisation/Good Clinical Practice, and appropriate regulatory requirements. The protocol was reviewed and approved by the Institutional Review Board of each participating site and each patient gave written informed consent.
Randomization and masking
In the original trial, each patient was randomly assigned (1:1) to receive one of the following nine treatments: 1 mg, 2.5 mg, 5 mg, or 10 mg TA-8995 or matching placebo; 10 mg TA-8995 plus 20 mg atorvastatin, 10 mg TA-8995 plus 10 mg rosuvastatin, 20 mg atorvastatin, or 10 mg rosuvastatin alone. The present analysis was focused on patients who received CETP inhibition with TA-8995 (obicetrapib). Over 12 weeks in the TULIP trial, different doses of obicetrapib as monotherapy resulted in reductions in PUC (beta quantification) measured LDL-C ranging 27.4–45.3% and apoB ranging 20.0–33.7%, and increases in HDL-C ranging 75.8–179.0%.15
Procedures
Following a screening visit, patients entered a run-in phase lasting 6 weeks if lipid-lowering treatment washout was needed or 4 weeks if no washout was needed. Patients were instructed to take their assigned treatment once daily with food for 12 weeks. Laboratory measurements were performed on blood samples that were collected during visits at baseline (week 0) and at weeks 4, 8, and 12. Of note, steady state in plasma with TA-8955 is achieved in 7–14 days.16
Assays
Lipid measurements were performed at Medpace Reference Laboratories (Cincinnati, OH), which participates in the College of American Pathologists (CAP) External Quality Control program (five surveys each year) and the Lipid Standardization Program of the Centers of Disease Control (CDC) quarterly to ensure accuracy and precision of measurements. Analytical performances of lipid measures met guideline-established benchmarks. Between-day inter-assay reproducibility coefficients of variation for total cholesterol, TG, and HDL-C were <1.10%, <2.25%, and <3.41%, respectively.
Analysis of total cholesterol, TG, and HDL-C was by enzymatic methods on a Beckman Coulter AU Series automatic analyzer, with calibration directly traceable to CDC reference procedures.17 For HDL-C, using reference methodology, precipitation with 50 kDa dextran sulfate with magnesium ions (MgCl2) was followed by analysis of the supernatant for cholesterol. Non‐HDL‐C was calculated as total cholesterol minus HDL-C, and apoB was measured by nephelometry.
Using total cholesterol, HDL-C, and TG values, LDL-C was calculated by the Friedewald,18 Martin/Hopkins,19 and Sampson20 equations in patients with TG levels <4.5 mmol/L (<400 mg/dL). Friedewald LDL-C was calculated as Total Cholesterol — HDL-C — TG/2.18 in mmol/L (TG/5 in mg/dL). Martin/Hopkins LDL-C was calculated as Total Cholesterol — HDL-C — TG/adjustable factor, wherein the adjustable factor ranged from 1.35–4.15 in mmol/L (3.1–9.5 in mg/dL). This adjustable factor is personalized to the patient to account for heterogeneity in the ratio of TG to VLDL-C. It is selected based on non-HDL-C and TG levels using a lookup table algorithm that does not require dedicated measurement of VLDL-C, with 174 possible factors in patients with TG levels <4.5 mmol/L (<400 mg/dL). Sampson LDL-C was calculated in mg/dL as total cholesterol/0.948 — HDL-C/0.971 — (TG/8.56 + TG x non-HDL-C/2140 — TG2/16100) — 9.44, then converted to mmol/L.
Our reference LDL-C measure was PUC, also known as ‘beta-quantification’. Centrifugation was performed at 40 000 rpm for 18–22 hours at 10°C to separate very low-density lipoproteins (VLDL) and chylomicrons into the supernatant (top fraction <1.006 density), and LDL, IDL, Lp(a), and HDL into the infranatant (bottom fraction >1.006). Apolipoprotein B containing lipoproteins were precipitated from whole serum using 50 kDa dextran sulfate with magnesium ions, and then cholesterol in the remaining HDL fraction was measured. HDL-C was subtracted from infranatant cholesterol to determine the PUC LDL-C value. Therefore, in accordance with the standard clinical definition of LDL-C, PUC included the biologic LDL-C fraction, along with IDL-C and Lp(a)-C.
Statistical analysis
The primary outcome was the difference in LDL-C levels (mmol/L or mg/dL) of PUC subtracted from each equation. We evaluated the 5th, 25th, 50th (median), 75th, and 95th percentile differences. Based on prior reports and dyslipidaemia guidelines, we stratified LDL-C by < vs. ≥ 1.8 mmol/L (70 mg/dL) and < vs. ≥ 2.59 mmol/L (100 mg/dL), and TG as <1.7 mmol/L (<150 mg/dL) vs. 1.7–4.5 mmol/L (150–399 mg/dL). We evaluated the concordance of each equation in classifying LDL-C levels compared with PUC. Additionally, we created concordant and discordant groups based on comparison of the Friedewald equation to each of the contemporary equations in classifying LDL-C < vs. ≥ 1.8 mmol/L (70 mg/dL), and examined non-HDL-C and apoB levels within groups. We also created waterfall plots of differences in LDL-C equations vs. PUC. Analyses were conducted using SAS version 9.4. The data underlying this article may be shared on reasonable request to the first and last authors.
Role of the funding source
The funder was involved in designing the TULIP trial, and in collection, management, and analysis of the data, in conjunction with the steering committee. The initial draft of this report was prepared by SSM who in collaboration with the other authors made the decision to submit for publication. All authors attest to the accuracy and completeness of the data and analyses.
Results
Study population demographics and clinical characteristics
From August, 2013 to July, 2014, 364 patients were randomised and received ≥1 dose of study treatment. Among these patients, we excluded 122 patients because they were not treated with CETP inhibition, including 81 patients in the two statin only arms, 40 patients in the placebo-only arm, and 1 additional patient who was randomised in error and never dosed with study drug, leaving 242 patients who were included in the present analysis, contributing a total of 921 observations (see Figure 1). Table 1 summarizes baseline characteristics of the present study population. Most were white men and the mean age was 65 ± 7 years, which was similar to the overall TULIP trial population. Baseline LDL-C levels were 3.53 ± 0.58 mmol/L (136 ± 22 mg/dL) by PUC, 3.58 ± 0.57 mmol/L (138 ± 22 mg/dL) by the Friedewald equation, 3.61 ± 0.56 mmol/L (139 ± 22 mg/dL) by the Martin/Hopkins equation, and 3.64 ± 0.57 mmol/L (141 ± 22 mg/dL) by the Sampson equation. Median (25th–75th) TG levels at baseline were 1.25 (0.95 to 1.71) mmol/L (111; 84 to 151 mg/dL). At week 4, 8, and 12, respectively, there were an additional 230, 228, and 223 observations; there were six values that were excluded for TG levels of ≥4.5 mmol/L (400 mg/dL).
Figure 1.

TULIP trial profile and low-density lipoprotein cholesterol accuracy analysis population. The figure depicts the flow of patients through the TULIP trial and the analysis population, which includes all available low-density lipoprotein cholesterol observations. Observations are defined as blood samples with available standard lipid profile data to estimate low-density lipoprotein cholesterol and direct measurement of low-density lipoprotein cholesterol by preparative ultracentrifugation. TULIP, TA-8995 in Patients with Mild Dyslipidaemia; LDL-C, low-density lipoprotein cholesterol; HDL-C, high-density lipoprotein cholesterol; TG, triglycerides.
Table 1.
Baseline characteristics of the study population
| Characteristic | Total (N = 242) |
|---|---|
| Age, years | 64.9 (7.0) |
| Sex | |
| Women | 42 (17.4%) |
| Men | 200 (82.6%) |
| Body mass index, kg/m2 | 26.1 (2.8) |
| White Race/Ethnicity | 237 (97.9%) |
| Smoking status | |
| Current smoking | 33 (13.6%) |
| Non-smoking | 100 (41.3%) |
| Past smoking | 109 (45.0%) |
| History of type 2 diabetes | 3 (1.2%) |
| History of hypertension | 45 (18.6%) |
| Systolic blood pressure, mmHg | 134.1 (13.1) |
| Diastolic blood pressure, mmHg | 79.1 (7.2) |
| Total cholesterol, mmol/L [mg/dL] | 5.58 (0.70) [216 (27)] |
| HDL-C, mmol/L [mg/dL] | 1.33 (0.26) [51 (10)] |
| Triglycerides, mmol/L [mg/dL] | 1.25 (0.95, 1.71) [129 (64)] |
| LDL-C by Preparative Ultracentrifugation, mmol/L [mg/dL] | 3.53 (0.58) [136 (22)] |
| LDL-C by Friedewald, mmol/L [mg/dL] | 3.58 (0.57) [138 (22)] |
| LDL-C by Martin/Hopkins, mmol/L [mg/dL] | 3.61 (0.56) [139 (22)] |
| LDL-C by Sampson, mmol/L [mg/dL] | 3.64 (0.57) [141 (22)] |
| Non-HDL-C, mmol/L [mg/dL] | 4.25 (0.68) [164 (26)] |
| Apolipoprotein B, g/L [mg/dL] | 0.99 (0.17) [99 (17)] |
Values are presented as mean (standard deviation), median (25th–75th) or n (%). Baseline was defined as the last measurement prior to the first dose of study drug. HDL-C = high-density lipoprotein cholesterol. LDL-C = low-density lipoprotein cholesterol.
Absolute differences between low-density lipoprotein cholesterol levels
In the overall study population, the differences between each LDL-C estimate and PUC LDL-C were approximately normally distributed and small in magnitude. Friedewald LDL-C showed a median difference of 0.00 (25th, 75th: −0.10, 0.08) mmol/L [0 (−4, 3) mg/dL], Martin/Hopkins LDL-C a median difference of 0.02 (−0.08, 0.10) mmol/L [1 (−3, 4) mg/dL], and Sampson LDL-C a median difference of 0.05 (−0.03, 0.15) mmol/L [2 (−1, 6) mg/dL]. The full distribution of differences between LDL-C estimates and PUC is shown in Figure 2.
Figure 2.

Waterfall plot of differences between low-density lipoprotein cholesterol estimates and preparative ultracentrifugation. Differences are shown in mmol/L overall for each low-density lipoprotein cholesterol equation and in subgroups with estimated low-density lipoprotein cholesterol <1.8 mmol/L (<70 mg/dL) and triglyceride levels 1.7–4.5 mmol/L (150–399 mg/dL). Difference in low-density lipoprotein cholesterol vs. preparative ultracentrifugation = (low-density lipoprotein cholesterol by specified equation method)—(low-density lipoprotein cholesterol by preparative ultracentrifugation). PUC, preparative ultracentrifugation; LDL-C, low-density lipoprotein cholesterol.
Stratified by LDL-C and TG levels, larger differences were observed between LDL-C estimates and PUC at lower concentrations of LDL-C and higher concentrations of TG (Table 2). When LDL-C was <1.8 mmol/L (<70 mg/dL) by the Friedewald equation, there was a propensity for underestimation with a median (25th, 75th) LDL-C difference vs. PUC of −0.25 (−0.33, −0.10) mmol/L [−10 (−13, −4) mg/dL] in patients with TG levels of 1.7–4.5 mmol/L (150–399 mg/dL). Martin/Hopkins corrected this issue with a median LDL-C difference vs. PUC of 0.00 (−0.08, 0.10) mmol/L [0 (−3, 4) mg/dL] in patients with estimated LDL-C <1.8 mmol/L (<70 mg/dL) and TG levels of 1.7–4.5 mmol/L (150–399 mg/dL). In contrast, there was tendency towards underestimation using the Sampson equation, with a median LDL-C difference vs. PUC of −0.06 (−0.13, 0.00) mmol/L [−2 (−5, 0) mg/dL] in patients with estimated LDL-C <1.8 mmol/L (<70 mg/dL) and TG levels of 1.7–4.5 mmol/L (150–399 mg/dL).
Table 2.
Differences in estimated LDL-C by various methods compared with LDL-C by preparative ultracentrifugation, stratified by LDL-C, and triglyceride levels
| Difference in estimated LDL-C vs. PUC, Median (25, 75th percentile), mmol/L [mg/dL] | ||
|---|---|---|
| Triglycerides | Triglycerides | |
| <1.7 mmol/L | 1.7–4.5 mmol/L | |
| [<150 mg/dL] | [150–399 mg/dL] | |
| LDL-C by Friedewald, <1.8 mmol/L (<70 mg/dL), N’ | 324 | 42 |
| −0.05 (−0.13, 0.03) mmol/L | −0.25 (−0.33, −0.10) mmol/L | |
| [−2 (−5, 1) mg/dL] | [−10 (−13, −4) mg/dL] | |
| LDL-C by Friedewald, ≥1.8 mmol/L (≥70 mg/dL), N’ | 464 | 91 |
| 0.03 (−0.07, 0.11) mmol/L | 0.00 (−0.16, 0.15) mmol/L | |
| [1 (−3, 4) mg/dL] | [0 (−6, 6) mg/dL] | |
| LDL-C by Friedewald, Overall, N’ | 788 | 133 |
| 0.0 (−0.08, 0.08) mmol/L | −0.08 (−0.24, 0.08) mmol/L | |
| [0 (−3, 3) mg/dL] | [−3 (−9, 3) mg/dL] | |
| LDL-C by Martin/Hopkins, <1.8 mmol/L (<70 mg/dL), N’ | 318 | 26 |
| −0.03 (−0.11, 0.05) mmol/L | 0.00 (−0.08, 0.10) mmol/L | |
| [−1 (−4, 2) mg/dL] | [0 (−3, 4) mg/dL] | |
| LDL-C by Martin/Hopkins, ≥1.8 mmol/L (≥70 mg/dL), N’ | 470 | 107 |
| 0.02 (−0.08, 0.10) mmol/L | 0.15 (0.02, 0.28) mmol/L | |
| [1 (−3, 4) mg/dL] | [6 (1, 11) mg/dL] | |
| LDL-C by Martin/Hopkins, Overall, N’ | 788 | 133 |
| 0.00 (−0.08, 0.08) mmol/L | 0.12 (0.00, 0.26) mmol/L | |
| [0 (−3, 3) mg/dL] | [5 (0, 10) mg/dL] | |
| LDL-C by Sampson, <1.8 mmol/L (<70 mg/dL), N’ | 302 | 29 |
| 0.02 (−0.06, 0.10) mmol/L | −0.06 (−0.13, 0.00) mmol/L | |
| [1 (−2, 4) mg/dL] | [−2 (−5, 0) mg/dL] | |
| LDL-C by Sampson, ≥1.8 mmol/L (≥70 mg/dL), N’ | 486 | 104 |
| 0.10 (0.00, 0.16) mmol/L | 0.08 (−0.02, 0.23) mmol/L | |
| [4 (0, 6) mg/dL] | [3 (−1, 9) mg/dL] | |
| LDL-C by Sampson, Overall, N’ | 788 | 133 |
| 0.05 (−0.03, 0.15) mmol/L | 0.05 (−0.08, 0.20) mmol/L | |
| [2 (−1, 6) mg/dL] | [2 (−3, 8) mg/dL] | |
Difference in LDL-C vs. PUC = (LDL-C by specified equation) — (LDL-C by PUC). N' = number of records in the double-blind treatment period with an LDL-C measurement by preparative ultracentrifugation and specified LDL-C equation. LDL‑C = low‑density lipoprotein cholesterol.
Considering the 2.59 mmol/L (100 mg/dL) cutpoint, a similar pattern of findings was noted. In patients with Friedewald LDL-C below this cutpoint and TG levels of 1.7–4.5 mmol/L (150–399 mg/dL), Friedewald LDL-C differed from PUC by a median of −0.20 (−0.31, −0.06) mmol/L [−8 (−12, −2) mg/dL]. When estimated LDL-C was <2.6 mmol/L (<100 mg/dL) in patients with TG levels of 1.7–4.5 mmol/L (150–399 mg/dL), Martin/Hopkins LDL-C showed a median LDL-C difference vs. PUC of 0.02 (−0.06, 0.15) mmol/L [1 (−2, 6) mg/dL] and Sampson showed a median LDL-C difference vs. PUC of −0.03 (−0.11, 0.15) mmol/L [−1 (−4. 6) mg/dL].
Classification according to guideline-based cutpoints
Overall, each of the equations showed high proportions of correct classification across the 1.8 mmol/L (70 mg/dL) LDL-C cutpoint: 94.1% for Friedewald, 95.4% for Martin/Hopkins, and 95.5% for Sampson. However, these high levels of correct classification were in the context of largely well controlled TG levels in the population. In patients with TG levels of 1.7–4.5 mmol/L (150–399 mg/dL), Figure 3 shows the proportion of LDL-C levels classified by the equations as < or ≥1.8 mmol/L (< or ≥70 mg/dL) that were correctly classified when compared with PUC. In those with estimated LDL-C <1.8 mmol/L (<70 mg/dL) and TG levels of 1.7–4.5 mmol/L (150–399 mg/dL), the proportion of correct classifications by Friedewald was markedly lower at 71.4% compared with 100.0% by Martin/Hopkins and 93.1% by Sampson. In contrast, all three equations showed >95% accuracy when estimated LDL-C levels were ≥1.8 mmol/L (≥70 mg/dL). For the 2.6 mmol/L (100 mg/dL) LDL-C cutpoint, underestimation by the Friedewald equation in the group with TG levels of 1.7–4.5 mmol/L (150–399 mg/dL) was again observed, though less than for the 1.8 mmol/L (70 mg/dL) cutpoint, and a similar pattern of improvement with Martin/Hopkins and Sampson was observed.
Figure 3.
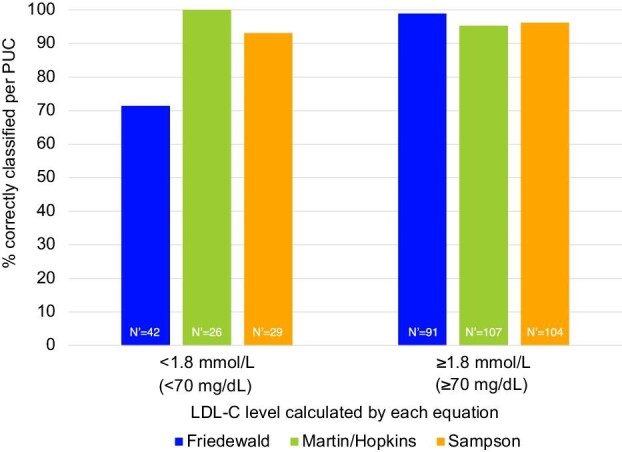
Proportion of low-density lipoprotein cholesterol levels classified by the equations as < or ≥1.8 mmol/L (70 mg/dL) that were correctly classified when compared with preparative ultracentrifugation in patients with triglyceride levels of 1.7–4.5 mmol/L (150–399 mg/dL). N’ = number of records in the double-blind treatment period with an LDL-C measurement by preparative ultracentrifugation and Friedewald, for the given category. LDL-C, low-density lipoprotein; PUC, preparative ultracentrifugation.
Non-high-density lipoprotein cholesterol & apolipoprotein B levels in the presence of low-density lipoprotein cholesterol discordance
Non-HDL-C and apoB levels were higher when LDL-C was discordantly elevated by the Martin/Hopkins or Sampson equation compared with the Friedewald equation. In patients with LDL-C <1.8 mmol/L (<70 mg/dL) by the Friedewald equation but ≥1.8 mmol/L (≥70 mg/dL) by the Martin/Hopkins equation (n = 27), the mean non-HDL-C level was 2.58 (0.27) mmol/L [100 (10) mg/dL] as compared with 1.70 (0.40) mmol/L [66 (15) mg/dL] when the equations were concordantly <1.8 mmol/L (<70 mg/dL) (n = 339). ApoB levels were 66 (6) mg/dL when the Martin/Hopkins equation was discordantly elevated and 53 (9) mg/dL when the Martin/Hopkins and Friedewald equations were both <1.8 mmol/L (<70 mg/dL). Similarly, when LDL-C was <1.8 mmol/L (<70 mg/dL) by the Friedewald equation but ≥1.8 mmol/L (≥70 mg/dL) by the Sampson equation (n = 36), the mean non-HDL-C level was 2.44 (0.29) mmol/L [94 (11) mg/dL] as compared with 1.69 (0.40) mmol/L [65 (15) mg/dL] when the equations were concordantly <1.8 mmol/L (<70 mg/dL) (n = 330). ApoB levels were 65 (7) mg/dL when the Sampson equation was discordantly elevated and 53 (9) mg/dL when the Sampson and Friedewald equations were both <1.8 mmol/L (<70 mg/dL).
Discussion
In 242 CETP inhibitor-treated TULIP trial participants with dyslipidaemia contributing 921 lipid observations, we compared the Friedewald, Martin/Hopkins, and Sampson equations using the gold standard reference measure for LDL-C of PUC. The TULIP trial presented an opportunity to evaluate existing LDL-C equations not only as a confirmatory experiment using rigorous determinations of LDL-C via PUC, but also as a dedicated follow up to questions of LDL-C accuracy in the setting of CETP inhibition. In comparing our findings with prior literature,19,21–33 we find further confirmation of the improvement in LDL-C accuracy using contemporary LDL-C equations over the Friedewald equation, particularly the Martin/Hopkins equation. High LDL-C accuracy can be achieved even in the context of CETP inhibition, and our data are consistent with accuracy depending more on the equation, and lipid profile, than drug therapy. Even in the context of TG elevation, Martin/Hopkins estimated LDL-C <1.8 mmol/L (<70 mg/dL) was 100% correct in comparison with PUC. As the TULIP trial was conducted in the Netherlands and Denmark, these data are particularly valuable to inform future clinical trials, guidelines, and practice in Europe.
A previous analysis of the DEFINE trial raised the possibility that LDL-C estimation by the Friedewald equation and direct detergent-based methods for measuring LDL-C could both be inaccurate in the setting of CETP inhibitor use.12 The analysis of 280 patients found that after 24 weeks of treatment with anacetrapib the Friedewald equation underestimated LDL-C compared with the beta-quantification reference method by a mean of −12.2 ± 7.5 mg/dL, which is a finding compatible with the present analysis. Furthermore, the DEFINE analysis found that two detergent-based methods for measuring LDL-C by Roche and Genzyme differed from beta-quantification by a mean of −10.2 ± 6.6 and −10.8 ± 8.8 mg/dl, respectively. Considering the greater accuracy achieved with contemporary LDL-C equations in the present analysis, it seems most likely that the underestimation by the direct detergent-based methods reflects their inherent inaccuracy. Detergent-based assays to measure LDL-C each use proprietary chemicals in an attempt to block non-LDL lipoproteins, but their performance is not well-validated and multiple prior analyses have raised accuracy concerns.33–35 Therefore, our data provide reassurance with respect to LDL-C assessment in the context of CETP inhibition, and support contemporary LDL-C equations rather than detergent-based methods. These data will inform ongoing CETP inhibitor development, including obicetrapib, which can lower LDL-C by 51% from baseline on top of high-intensity statins and is entering phase III development.13,14
The present TULIP data are in line with prior literature in demonstrating that while the Friedewald equation overall provides high accuracy, the accuracy breaks down in the context of lower LDL-C levels and elevated TG levels.9–11,19–21 The elevation in TG levels does not need to reach ≥400 mg/dL for the Friedewald equation to lose accuracy as conventionally thought, rather clinically relevant underestimation of LDL-C can occur with moderately elevated TG levels. This is consistent with the TG-estimated portion of the Friedewald equation assuming a relatively larger portion of the equation as LDL-C levels decrease into the modern treatment range. The phenomenon of underestimation is not unexpected as Friedewald and colleagues noted in their original paper18 that division of TG levels by the fixed factor does not yield a very accurate estimate of VLDL-C (which is subtracted in the equation to calculate LDL-C), but inaccuracy was tolerable at the time as it was a relatively small portion of the equation in a time that preceded the availability of statins or other modern lipid therapeutics.
The major clinical concern in current practice is that underestimation of LDL-C levels will lead to underuse of lipid lowering therapy. Clinicians and patients rely on the clinical laboratory results to guide decisions about initiation or intensification of guideline-directed medical therapy to lower LDL-C and reduce atherosclerotic cardiovascular disease events. Therefore, underestimation will result in missed opportunities for prevention, whereas more accurate LDL-C assessment can lead to appropriate use of established therapies, such as lifestyle modification, statins, ezetimibe, and PCSK9 inhibitors, to improve clinical outcomes.1,2,5 Further validating the importance of differences between LDL-C equations, our analysis showed that non-HDL-C and apoB levels were higher in groups with LDL-C that was discordantly higher using the Martin/Hopkins or Sampson equation, as compared with the Friedewald equation. Therefore, use of contemporary LDL-C equations may not only improve accuracy of LDL-C, but has the potential to direct treatment to more individuals who carry residual risk related to non-HDL-C and apoB.
Whereas the Friedewald equation uses a one-size-fits-all approach to divide TG levels by a factor of 2.2 in mmol/L units or 5 in mg/dL units, the Martin/Hopkins and Sampson equations allow for more tailoring of LDL-C estimation. In the case of the Martin/Hopkins equation it is a lookup table approach and in the case of the Sampson equation it is a biavariate equation. Although both contemporary equations resulted in improved accuracy in our analysis, the Martin/Hopkins equation showed unique advantages. Furthermore, it has been more extensively validated and is recommended by guidelines and expert recommendations around the globe, such as those of the National Lipid Association,10 the American Heart Association/American College of Cardiology,2 the European Atherosclerosis Society/European Federation of Clinical Chemistry and Laboratory Medicine,9 the Polish Lipid Association,7 and the Brazilian Society of Cardiology.11 The Martin/Hopkins equation is free and open source.
Some limitations of our analysis warrant consideration. First, the TULIP trial participants were predominantly men and of White race, therefore they do not represent the diversity of patients seen in day-to-day clinical practice, and generalizability may be limited in this respect. Nevertheless, prior literature with greater representation of women and individuals of non-White race is consistent with the findings of this study.19,26,27,29 Second, the participants in our analysis had LDL-C levels on the higher side and TG levels that were largely well controlled, characteristics which would bias the analysis towards more conservative findings (less difference between equations). A recent large-scale analysis showed larger advantages of the Martin/Hopkins vs Sampson and Friedewald equations in patients with TG levels >4.5 mmol/L (≥400 mg/dL), especially at low LDL-C.32 Third, participants were all fasting, which would not be the case in routine clinical practice, especially given recent recommendations for flexibility with respect to fasting status,9,11 and would further bias the analysis towards more conservative findings. It has been shown previously that the Friedewald equation is even more prone to underestimation in non-fasting lipid samples whereas the Martin/Hopkins equation preserves accuracy in this setting.28 Fourth, participants did not have a history of ASCVD events and did not have LDL-C managed down to very high risk LDL-C goals of 1.42 or 1.03 mmol/L (<55 or <40 mg/dL) as recommended in recent guidelines.1 However, a prior analysis of PCSK9 inhibitor patients with ASCVD in the FOURIER trial showed underestimation of LDL-C by the Friedewald equation at LDL-C levels <1.03 mmol/L (<40 mg/dL) and strong agreement of the Martin/Hopkins equation with PUC LDL-C in this range.27 FOURIER also showed reduction in ASCVD risk down to LDL-C levels <0.26 mmol/L (<10 mg/dL),36 highlighting the importance of accuracy in LDL-C assessment at very low LDL-C.
In conclusion, in Europeans with dyslipidaemia receiving CETP inhibitor therapy, our analysis shows improved accuracy in LDL-C when using contemporary LDL-C equations over the Friedewald equation. High levels of accuracy compared to gold standard preparative ultracentrifugation were observed using the Martin/Hopkins and Sampson equations, even in the context of LDL-C <1.8 mmol/L (<70 mg/dL) and TG levels of 1.7–4.5 mmol/L, and the Martin/Hopkins equation delivered the best results. These findings add to the body of evidence on approaches to LDL-C determination and can inform clinical trials and practice moving forward.
Contributor Information
Seth S Martin, Ciccarone Center for the Prevention of Cardiovascular Disease, Division of Cardiology, Department of Medicine, Johns Hopkins University School of Medicine, Baltimore, MD 21287, USA.
Marc Ditmarsch, NewAmsterdam Pharma B.V., Naarden, 1411 DC, The Netherlands.
Mark Simmons, Medpace and Medpace Reference Laboratories, Cincinnati, OH 45227, USA.
Nicholas Alp, Medpace and Medpace Reference Laboratories, Cincinnati, OH 45227, USA.
Traci Turner, Medpace and Medpace Reference Laboratories, Cincinnati, OH 45227, USA.
Michael H Davidson, NewAmsterdam Pharma B.V., Naarden, 1411 DC, The Netherlands; Preventive Cardiology, Department of Cardiology, The University of Chicago Pritzker School of Medicine, Chicago, IL 60637, USA.
John J P Kastelein, NewAmsterdam Pharma B.V., Naarden, 1411 DC, The Netherlands; Department of Vascular Medicine, Academic Medical Center, University of Amsterdam, 1105 AZ Amsterdam, The Netherlands.
Funding
This TULIP study was funded by Dezima and undertaken by Xention. This analysis was funded by NewAmsterdam Pharma.
Conflict of interest: S.S.M. reports personal fees from Amgen, AstraZeneca, Dalcor, Kaneka, Novo Nordisk, Novartis, Regeneron, RegenXBio, and 89 Bio. S.S.M. is an inventor of the Martin/Hopkins LDL-C equation. The Martin/Hopkins equation is free and open source. Although Johns Hopkins University originally pursued a patent on the equation and licensing fees, it was recognized by Johns Hopkins University that this was limiting adoption. As such, Johns Hopkins University abandoned the patent to allow use of the Martin/Hopkins LDL-C equation without any intellectual property restrictions or requirements for licensing fees. M.D. is founder of Diomedea Medical and employed at New Amsterdam Pharma. M.H.D. is the co-founder of NewAmsterdam Pharma B.V. and Dock Therapeutics, Inc. He is also the former co-founder of Omthera Pharmaceuticals, Inc. (acquired by AstraZeneca) and Corvidia Therapeutics, Inc. (acquired by Novo Nordisk). J.J.P.K. reports personal fees from AstraZeneca, CiVi Biopharma, CSL Behring, Draupnir, Esperion, Madrigal Pharmaceuticals, Matinas Biopharma, North Sea Therapeutics, Novo Nordisk, Novartis, Regeneron, RegenXBio, SirnaOmics, Staten Biotech, 89 Bio, and Omeicos, and reports employment at NewAmsterdam Pharma. The other authors report no conflicts.
References
- 1. Mach F, Baigent C, Catapano AL, Koskinas KC, Casula M, Badimon L, Chapman MJ, De Backer GG, Delgado V, Ference BA, Graham IM, Halliday A, Landmesser U, Mihaylova B, Pedersen TR, Riccardi G, Richter DJ, Sabatine MS, Taskinen MR, Tokgozoglu L, Wiklund O; ESC scientific document group. 2019 ESC/EAS guidelines for the management of dyslipidaemias: lipid modification to reduce cardiovascular risk. Eur Heart J 2020;41:111–188. [DOI] [PubMed] [Google Scholar]
- 2. Grundy SM, Stone NJ, Bailey AL, Beam C, Birtcher KK, Blumenthal RS, Braun LT, de Ferranti S, Faiella-Tommasino J, Forman DE, Goldberg R, Heidenreich PA, Hlatky MA, Jones DW, Lloyd-Jones D, Lopez-Pajares N, Ndumele CE, Orringer CE, Peralta CA, Saseen JJ, Smith SC Jr, Sperling L, Virani SS, Yeboah J. 2018AHA/ACC/AACVPR/AAPA/ABC/ACPM/ADA/AGS/APhA/ASPC/NLA/PCNA guideline on the management of blood cholesterol: a report of the American college of cardiology/American heart association task force on clinical practice guidelines. Circulation 2019;139:e1082–e143. [DOI] [PMC free article] [PubMed] [Google Scholar]
- 3. Collins R, Reith C, Emberson J, Armitage J, Baigent C, Blackwell L, Blumenthal R, Danesh J, Smith GD, DeMets D, Evans S, Law M, MacMahon S, Martin S, Neal B, Poulter N, Preiss D, Ridker P, Roberts I, Rodgers A, Sandercock P, Schulz K, Sever P, Simes J, Smeeth L, Wald N, Yusuf S, Peto R. Interpretation of the evidence for the efficacy and safety of statin therapy. Lancet North Am Ed 2016;388:2532–2561. [DOI] [PubMed] [Google Scholar]
- 4. Ference BA, Ginsberg HN, Graham I, Ray KK, Packard CJ, Bruckert E, Hegele RA, Krauss RM, Raal FJ, Schunkert H, Watts GF, Borén J, Fazio S, Horton JD, Masana L, Nicholls SJ, Nordestgaard BG, van de Sluis B, Taskinen MR, Tokgözoglu L, Landmesser U, Laufs U, Wiklund O, Stock JK, Chapman MJ, Catapano AL. Low-density lipoproteins cause atherosclerotic cardiovascular disease. 1. Evidence from genetic, epidemiologic, and clinical studies. A consensus statement from the european atherosclerosis society consensus panel. Eur Heart J 2017;38:2459–2472. [DOI] [PMC free article] [PubMed] [Google Scholar]
- 5. Michos ED, McEvoy JW, Blumenthal RS. Lipid management for the prevention of atherosclerotic cardiovascular disease. N Engl J Med 2019;381:1557–1567. [DOI] [PubMed] [Google Scholar]
- 6. Ray KK, Reeskamp LF, Laufs U, Banach M, Mach F, Tokgözoğlu LS, Connolly DL, Gerrits AJ, Stroes ESG, Masana L, Kastelein JJP. Combination lipid-lowering therapy as first-line strategy in very high-risk patients. Eur Heart J 2022;43:830–833. [DOI] [PubMed] [Google Scholar]
- 7. Banach M, Burchardt P, Chlebus K, Dobrowolski P, Dudek D, Dyrbuś K, Gąsior M, Jankowski P, Jóźwiak J, Kłosiewicz-Latoszek L, Kowalska I, Małecki M, Prejbisz A, Rakowski M, Rysz J, Solnica B, Sitkiewicz D, Sygitowicz G, Sypniewska G, Tomasik T, Windak A, Zozulińska-Ziółkiewicz D, Cybulska B. PoLA/CFPiP/PCS/PSLD/PSD/PSH guidelines on diagnosis and therapy of lipid disorders in Poland 2021. Arch Med Sci 2021;17:1447–1547. [DOI] [PMC free article] [PubMed] [Google Scholar]
- 8. Karagiannis AD, Mehta A, Dhindsa DS, Virani SS, Orringer CE, Blumenthal RS, Stone NJ, Sperling LS. How low is safe? The frontier of very low (<30 mg/dL) LDL cholesterol. Eur Heart J 2021;42:2154–69. [DOI] [PubMed] [Google Scholar]
- 9. Langlois MR, Nordestgaard BG, Langsted A, Chapman MJ, Aakre KM, Baum H, Borén J, Bruckert E, Catapano A, Cobbaert C, Collinson P, Descamps OS, Duff CJ, von Eckardstein A, Hammerer-Lercher A, Kamstrup PR, Kolovou G, Kronenberg F, Mora S, Pulkki K, Remaley AT, Rifai N, Ros E, Stankovic S, Stavljenic-Rukavina A, Sypniewska G, Watts GF, Wiklund O, Laitinen P; European Atherosclerosis Society (EAS) and the European federation of clinical chemistry and laboratory medicine (EFLM) joint consensus initiative . Quantifying atherogenic lipoproteins for lipid-lowering strategies: consensus-based recommendations from EAS and EFLM. Clin. Chem. Lab. Med. 2020;58:496–517. [DOI] [PubMed] [Google Scholar]
- 10. Wilson PWF, Jacobson TA, Martin SS, Jackson EJ, Le NA, Davidson MH, Vesper HW, Frikke-Schmidt R, Ballantyne CM, Remaley AT. Lipid measurements in the management of cardiovascular diseases: practical recommendations a scientific statement from the national lipid association writing group. J Clin Lipidol 2021;15:629–648. [DOI] [PubMed] [Google Scholar]
- 11. Scartezini M, Ferreira C, Izar MCO, Bertoluci M, Vencio S, Campana GA, Sumita NM, Barcelos LF, Faludi AA, Santos RD, Malachias MVB, Aquino JL, Galoro CAO, Sabino C, Gurgel MHC, Turatti LAA, Hohl A, Martinez TLDR. Positioning about the flexibility of fasting for lipid profiling. Arq Bras Cardiol 2017;108:195–197. [DOI] [PMC free article] [PubMed] [Google Scholar]
- 12. Davidson M, Liu SX, Barter P, Brinton EA, Cannon CP, Gotto AM Jr, Leary ET, Shah S, Stepanavage M, Mitchel Y, Dansky HM. Measurement of LDL-C after treatment with the CETP inhibitor anacetrapib. J Lipid Res 2013;54:467–472. [DOI] [PMC free article] [PubMed] [Google Scholar]
- 13. Nurmohamed NS, Ditmarsch M, Kastelein JJP. CETP-inhibitors: from HDL-C to LDL-C lowering agents? Cardiovasc Res 2021. doi: 10.1093/cvr/cvab350 (Online ahead of print). [DOI] [PMC free article] [PubMed] [Google Scholar]
- 14. Nurmohamed NS, Navar AM, Kastelein JJP. New and emerging therapies for reduction of LDL-cholesterol and apolipoprotein B: JACC focus seminar 1/4. J Am Coll Cardiol 2021;77:1564–1575. [DOI] [PubMed] [Google Scholar]
- 15. Hovingh GK, Kastelein JJ, van Deventer SJ, Round P, Ford J, Saleheen D, Rader DJ, Brewer HB, Barter PJ. Cholesterol ester transfer protein inhibition by TA-8995 in patients with mild dyslipidaemia (TULIP): a randomised, double-blind, placebo-controlled phase 2 trial. Lancet North Am Ed 2015;386:452–460. [DOI] [PubMed] [Google Scholar]
- 16. Ford J, Lawson M, Fowler D, Maruyama N, Mito S, Tomiyasu K, Kinoshita S, Suzuki C, Kawaguchi A, Round P, Boyce M, Warrington S, Weber W, van Deventer S, Kastelein JJ. Tolerability, pharmacokinetics and pharmacodynamics of TA-8995, a selective cholesteryl ester transfer protein (CETP) inhibitor, in healthy subjects. Br J Clin Pharmacol 2014;78:498–508. [DOI] [PMC free article] [PubMed] [Google Scholar]
- 17. Myers GL, Cooper GR, Winn CL, Smith SJ. The centers for disease control-national heart, lung and blood institute lipid standardization program. An approach to accurate and precise lipid measurements. Clin Lab Med 1989;9:105–136. [PubMed] [Google Scholar]
- 18. Friedewald WT, Levy RI, Fredrickson DS. Estimation of the concentration of low-density lipoprotein cholesterol in plasma, without use of the preparative ultracentrifuge. Clin Chem 1972;18:499–502. [PubMed] [Google Scholar]
- 19. Martin SS, Blaha MJ, Elshazly MB, Toth PP, Kwiterovich PO, Blumenthal RS, Jones SR. Comparison of a novel method vs the friedewald equation for estimating low-density lipoprotein cholesterol levels from the standard lipid profile. JAMA 2013;310:2061–2068. [DOI] [PMC free article] [PubMed] [Google Scholar]
- 20. Sampson M, Ling C, Sun Q, Harb R, Ashmaig M, Warnick R, Sethi A, Fleming JK, Otvos JD, Meeusen JW, Delaney SR, Jaffe AS, Shamburek R, Amar M, Remaley AT. A new equation for calculation of low-density lipoprotein cholesterol in patients with normolipidemia and/or hypertriglyceridemia. JAMA Cardiology 2020;5:540–548. [DOI] [PMC free article] [PubMed] [Google Scholar]
- 21. Martin SS, Blaha MJ, Elshazly MB, Brinton EA, Toth PP, McEvoy JW, Joshi PH, Kulkarni KR, Mize PD, Kwiterovich PO, Defilippis AP, Blumenthal RS, Jones SR. Friedewald-estimated versus directly measured low-density lipoprotein cholesterol and treatment implications. J Am Coll Cardiol 2013;62:732–739. [DOI] [PubMed] [Google Scholar]
- 22. Chaen H, Kinchiku S, Miyata M, Kajiya S, Uenomachi H, Yuasa T, Takasaki K, Ohishi M. Validity of a novel method for estimation of low-density lipoprotein cholesterol levels in diabetic patients. J Atheroscler Thromb. 2016;23:1355–1364. [DOI] [PMC free article] [PubMed] [Google Scholar]
- 23. Lee J, Jang S, Son H. Validation of the martin method for estimating low-density lipoprotein cholesterol levels in korean adults: findings from the korea national health and nutrition examination survey, 2009-2011. PLoS One 2016;11:e0148147. [DOI] [PMC free article] [PubMed] [Google Scholar]
- 24. Kang M, Kim J, Lee SY, Kim K, Yoon J, Ki H. Martin's equation as the most suitable method for estimation of low-density lipoprotein cholesterol levels in Korean adults. Korean J Fam Med 2017;38:263–269. [DOI] [PMC free article] [PubMed] [Google Scholar]
- 25. Quispe R, Hendrani A, Elshazly MB, Michos ED, McEvoy JW, Blaha MJ, Banach M, Kulkarni KR, Toth PP, Coresh J, Blumenthal RS, Jones SR, Martin SS. Accuracy of low-density lipoprotein cholesterol estimation at very low levels. BMC Medicine 2017;15:83. [DOI] [PMC free article] [PubMed] [Google Scholar]
- 26. Whelton SP, Meeusen JW, Donato LJ, Jaffe AS, Saenger A, Sokoll LJ, Blumenthal RS, Jones SR, Martin SS. Evaluating the atherogenic burden of individuals with a Friedewald-estimated low-density lipoprotein cholesterol <70 mg/dL compared with a novel low-density lipoprotein estimation method. J Clin Lipidol 2017;11:1065–1072. [DOI] [PubMed] [Google Scholar]
- 27. Martin SS, Giugliano RP, Murphy SA, Wasserman SM, Stein EA, Ceška R, López-Miranda J, Georgiev B, Lorenzatti AJ, Tikkanen MJ, Sever PS, Keech AC, Pedersen TR, Sabatine MS. Comparison of low-density lipoprotein cholesterol assessment by martin/hopkins estimation, friedewald estimation, and preparative ultracentrifugation: insights from the FOURIER trial. JAMA Cardiology 2018;3:749–753. [DOI] [PMC free article] [PubMed] [Google Scholar]
- 28. Sathiyakumar V, Park J, Golozar A, Lazo M, Quispe R, Guallar E, Blumenthal RS, Jones SR, Martin SS. Fasting versus nonfasting and low-density lipoprotein cholesterol accuracy. Circulation 2018;137:10–19. [DOI] [PubMed] [Google Scholar]
- 29. Pallazola VA, Sathiyakumar V, Ogunmoroti O, Fashanu O, Jones SR, Santos RD, Toth PP, Bittencourt MS, Duncan BB, Lotufo PA, Bensenor IM, Blaha MJ, Martin SS. Impact of improved low-density lipoprotein cholesterol assessment on guideline classification in the modern treatment era-Results from a racially diverse Brazilian cross-sectional study. J Clin Lipidol 2019;13:804–811.e2e2. [DOI] [PubMed] [Google Scholar]
- 30. Schneider EE, Sarkar S, Margolick JB, Martin SS, Post WS, Brown TT. Comparison of calculated low-density lipoprotein cholesterol (LDL-C) values in HIV-infected and HIV-uninfected men using the traditional friedewald and the novel martin-hopkins LDL-C equations. AIDS Res Hum Retroviruses 2020;36:176–179. [DOI] [PMC free article] [PubMed] [Google Scholar]
- 31. Cao J, Remaley AT, Guan W, Devaraj S, Tsai MY. Performance of novel low-density lipoprotein-cholesterol calculation methods in predicting clinical and subclinical atherosclerotic cardiovascular disease risk: the multi-ethnic study of atherosclerosis. Atherosclerosis 2021;327:1–4. [DOI] [PubMed] [Google Scholar]
- 32. Sajja A, Park J, Sathiyakumar V, Varghese B, Pallazola VA, Marvel FA, Kulkarni K, Muthukumar A, Joshi PH, Gianos E, Hirsh B, Mintz G, Goldberg A, Morris PB, Sharma G, Blumenthal RS, Michos ED, Post WS, Elshazly MB, Jones SR, Martin SS. Comparison of methods to estimate low-density lipoprotein cholesterol in patients with high triglyceride levels. JAMA Network Open 2021;4:e2128817. [DOI] [PMC free article] [PubMed] [Google Scholar]
- 33. Brownstein AJ, Martin SS. More accurate LDL-C calculation: externally validated, guideline endorsed. Clin Chim Acta 2020;506:149–153. [DOI] [PubMed] [Google Scholar]
- 34. Miller WG, Myers GL, Sakurabayashi I, Bachmann LM, Caudill SP, Dziekonski A, Edwards S, Kimberly MM, Korzun WJ, Leary ET, Nakajima K, Nakamura M, Nilsson G, Shamburek RD, Vetrovec GW, Warnick GR, Remaley AT. Seven direct methods for measuring HDL and LDL cholesterol compared with ultracentrifugation reference measurement procedures. Clin Chem 2010;56:977–986. [DOI] [PMC free article] [PubMed] [Google Scholar]
- 35. Oliveira MJ, van Deventer HE, Bachmann LM, Warnick GR, Nakajima K, Nakamura M, Sakurabayashi I, Kimberly MM, Shamburek RD, Korzun WJ, Myers GL, Miller WG, Remaley AT. Evaluation of four different equations for calculating LDL-C with eight different direct HDL-C assays. Clin Chim Acta 2013;423:135–140. [DOI] [PMC free article] [PubMed] [Google Scholar]
- 36. Giugliano RP, Pedersen TR, Park JG, De Ferrari GM, Gaciong ZA, Ceska R, Toth K, Gouni-Berthold I, Lopez-Miranda J, Schiele F, Mach F, Ott BR, Kanevsky E, Pineda AL, Somaratne R, Wasserman SM, Keech AC, Sever PS, Sabatine MS; FOURIER Investigators . Clinical efficacy and safety of achieving very low LDL-cholesterol concentrations with the PCSK9 inhibitor evolocumab: a prespecified secondary analysis of the FOURIER trial. Lancet North Am Ed 2017;390:1962–1971. [DOI] [PubMed] [Google Scholar]