Abstract
Background
Persistence of long-term COVID-19 pandemic is putting high pressure on healthcare services worldwide for several years. This article aims to establish models to predict infection levels and mortality of COVID-19 patients in China.
Methods
Machine learning models and deep learning models have been built based on the clinical features of COVID-19 patients. The best models are selected by area under the receiver operating characteristic curve (AUC) scores to construct two homogeneous ensemble models for predicting infection levels and mortality, respectively. The first-hand clinical data of 760 patients are collected from Zhongnan Hospital of Wuhan University between 3 January and 8 March 2020. We preprocess data with cleaning, imputation, and normalization.
Results
Our models obtain AUC = 0.7059 and Recall (Weighted avg) = 0.7248 in predicting infection level, while AUC=0.8436 and Recall (Weighted avg) = 0.8486 in predicting mortality ratio. This study also identifies two sets of essential clinical features. One is C-reactive protein (CRP) or high sensitivity C-reactive protein (hs-CRP) and the other is chest tightness, age, and pleural effusion.
Conclusions
Two homogeneous ensemble models are proposed to predict infection levels and mortality of COVID-19 patients in China. New findings of clinical features for benefiting the machine learning models are reported. The evaluation of an actual dataset collected from January 3 to March 8, 2020 demonstrates the effectiveness of the models by comparing them with state-of-the-art models in prediction.
Keywords: Ensemble model, COVID-19, machine learning, electronic health records, prediction models
Introduction
Outbreaks of the COVID-19 have been impacting the lives of people severely. COVID-19 was the first discovered in December 2019 and has since rapidly spread to over 200 countries.1 As of 20 March 2022, over 468 million confirmed cases and over 6 million deaths have been reported globally.2 Infection prevention and control recommendations from the World Health Organization (WHO) stress that early detection, effective triage, and isolation of potentially infectious patients are essential to prevent unnecessary exposures to COVID-19.3
There are a number of existing studies for predicting mortality of COVID-19, which have been proven to be helpful for treatment, medication, screening, prediction, and forecasting the COVID-19 pandemic and reduce human intervention in medical practice.4 However, most of them are based on binary classification which includes deceased and survival and lack of more detailed classification. Thus, there is still room for methodology improvement in prediction. Yan et al.5 developed a machine learning model based on eXtreme Gradient Boosting (XGBoost), and discovered three features (lactate dehydrogenase (LDH), hs-CRP, and lymphocytes) to predict mortality of COVID-19 patients. The neural network designed by Liang et al.6 required 10 features to identify at risk of severe illness. Yadaw et al.7 used several machine learning models to identify three additional features (age, minimum oxygen saturation over the course of their medical encounter, and type of patient encounter) to predict the mortality. Their studies revealed that using machine learning and deep learning models to analyze the status of COVID-19 patients was promising in practice. However, their studies were merely binary classification and some of them required many features in the prediction or features were difficult to access. As people gradually form a consensus that COVID-19 was likely to coexist with humans for a long time, and there are still many cases breaking out in various places, predicting infection levels and mortality based on fewer and easier accessible features is essential.
To achieve this goal, this study leverages the clinical data of 760 COVID-19 patients collected from Zhongnan Hospital of Wuhan University, China, to predict infection levels and mortality of the patients. Compared with previous studies that mostly focused on binary classification (predicting categories either deceased or survival), this study develops two prediction models to predict infection levels additionally, which provides more detailed categories than previous studies. Second, this study investigates the validity of single machine learning models and neural networks in prediction, as well as constructs two homogeneous ensemble models by selecting models with the highest area under the receiver operating characteristic curve (AUC) scores. Based on the dataset, our homogeneous ensemble models obtain the best AUC scores (Infection levels: AUC = 0.7059, Mortality: AUC = 0.8436) compared with state-of-the-art methods (Infection levels: 0.60–0.7009, Mortality: AUC = 0.52–0.83). Third, this study identifies the most significant clinical features as new findings for the two prediction tasks. The models may be helpful for preserving healthcare capacity for successfully combating COVID-19.1
In summary, the contributions of this article lie in the following three aspects:
Two new homogeneous ensemble models are proposed to predict infection levels and mortality of COVID-19 patients.
Two sets of clinical features that are essential to the automatic predictions are newly discovered and assessed.
The evaluation of 760 COVID-19 patients demonstrates that the performance of our models outperforms state-of-the-art models, revealing their effectiveness.
Methods
Overview
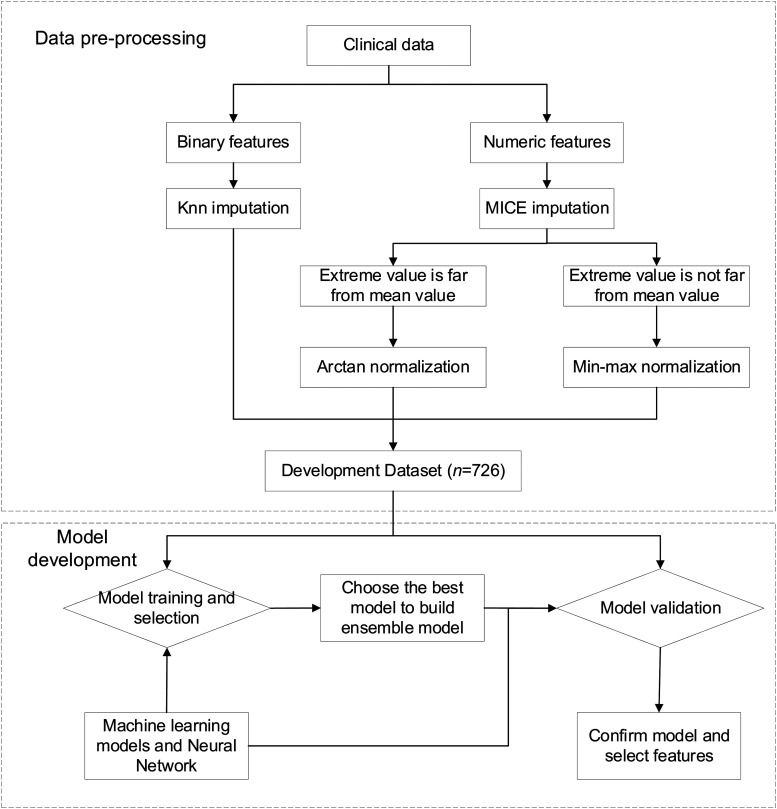
To derive the target models from the given development dataset, this study set up a data preprocessing, model selection, development, and evaluation pipeline, as shown in Figure 1. After obtaining the data, we preprocessed data with cleaning, imputation, and normalization, and split the data into a training dataset and a test dataset randomly to develop and evaluate machine learning models and neural networks. The model with best performance under the evaluation criteria were selected for ensemble. The ensemble models and the previous models were then trained and evaluated together to confirm the validity of the homogeneous ensemble models and identify features when the homogeneous ensemble models exceeded other baseline models. We outline the pipeline stages in detail in the following paragraphs.
Figure 1.
Workflow for data preprocessing and model development for predicting COVID-19 infection levels and mortality.
Data were from a top hospital in three-A level in China. The data preprocessing used mice imputation or KNN imputation and normalization. After preprocessing, we first divided the data in a 70:30 ratio into a training dataset (n = 508) and a test dataset (n = 218) randomly. We put the data into six different models (machine learning models and neural networks) for training. After that, this study selected the best models to construct homogeneous ensemble models. Then we used the development dataset again to train homogeneous ensemble models to verify whether our homogeneous ensemble models were the best Finally, we confirmed the efficacy of the proposed models and identified two sets of features with maximum weights of the homogeneous ensemble models when their AUCs exceeded other baseline models.
Datasets
The clinical data were collected from the Zhongnan Hospital of Wuhan University, which is one of top-grade hospitals. The collection was based on ID card, lung CT scans, past medical history, blood pressure monitor, coagulation tests, ultrasonic examination, blood test, and the measurement of body temperature of patients. The inclusion criteria were (1) data collected from 3 January to 8 March 2020, (2) clinically confirmed COVID-19 patients according to Diagnosis and Treatment Protocol for COVID-19 (Trial Version 7), (3) infection levels were mild, moderate, severe, and critical. The definition of the four levels was shown in the online Appendix, and (4) the viral genome sequencing of respiratory tract or blood samples was highly homologous with known novel coronavirus. The exclusion criteria were (1) merely considered as a suspected COVID-19 patient clinically and (2) incomplete clinical data.
Infection levels of the patients were classified as mild, moderate, severe, and critical. The proposed models used the features of 726 confirmed COVID-19 patients, of whom 698 (96%) were in survival, 28 (4%) in deceased, and 46 (6%) in grade 1 (mild), 520 (72%) in grade 2(moderate), 101 (14%) in grade 3(severe), and 59 (8%) in grade 4(critical) (Table 1). The data were split into two groups randomly, 70% of which were used as training and 30% as test
Table 1.
The statistics of different conditions of the COVID-19 patients.
| Mortality | Infection levels | |||||
|---|---|---|---|---|---|---|
| Class | Deceased | Alive | Mild (1) | Moderate (2) | Severe (3) | Critical (4) |
| Count | 28 (4%) | 698 (96%) | 46 (6%) | 520 (72%) | 101 (14%) | 59 (8%) |
Data preprocessing
The dataset consisted of 760 patients, including 726 confirmed cases and 34 suspected COVID-19 patients. In the preprocessing stage, we removed some redundant/irrelevant features and unconfirmed cases. In order to obtain a more accurate relationship between various clinical features of the patients and outcomes, 34 suspected COVID-19 patients were excluded from this study and only 726 confirmed patients were used. In addition, the aim of this study was to investigate the relationship between clinical features and infection levels or mortality, so irrelevant features of the aim were deleted, such as patients’ hospitalization number, occupation, ethnicity, prescription drugs, and antibody tests.
Since missing values were inevitable in clinical data, this study divided features into binary features and continuous features to impute rationally. We used different imputations for the two groups of features respectively. Binary features used K-Nearest Neighbor (KNN) imputation and continuous features used MICE imputation.8
The KNN imputation used a weighted average of the values of the neighbors. The weights were computed as equation (1):
| (1) |
| (2) |
dist(k, x) was the Euclidean distance between the case with unknown sample (x) and the neighbor k, and it computed only over the columns that two vectors had in common. Their distance was infinite if two vectors had no features in common. D was the dimension of samples, kd was the value of dth dimension of the neighbor k, xd was the values of dth dimension of the x. Based on the weights and value of its k similar cases, we used the values of these cases to fill in unknowns.9 k was set to 5 empirically in this study.
The MICE imputation was an imputation that modeled each feature with missing values as a function of other features. In each step, a feature column was designated as output y and the other feature columns were treated as inputs X. A function was fit on (X, y) for known y. Then, the function was used to predict the missing values of y. It repeated for max iteration imputation rounds. The results of the final imputation round were returned.10 This study used the default estimator which was Bayesian Ridge.
To enable data with different mean and variance could be compared in the same numerical range, we normalized all features. The continuous features usually needed a normalization. In order to normalize the features more reasonably, this study further divided the continuous features into extreme values with large deviations from the mean but rational and extreme value with small deviations from the mean. The features whose extreme values with small deviations from the mean used min-max normalization is computed as equation (3).
| (3) |
x was the value of a feature, xmin was the minimum of this feature, xmax was the maximum of this feature, xnorm was the value after min-max normalization. This study normalized height, weight, temperature and respiratory rate, and so on, whose extreme values were not far from the mean values.
The features whose extreme values with large deviations from the mean would inevitably be normalized to a very small region if the linear normalization method was used. Therefore, this study used a nonlinear normalization called Arctan normalization as shown in equation (4).
| (4) |
where x is the value of a feature and xnorm is the value after the Arctan normalization. This study normalized leukocyte, lymphocytes, platelets (PLT), and other blood test indicators, whose extreme values were far from the mean value often reflect the fact rather than outliers.
Model evaluation
The performances of models were evaluated by assessing accuracy score, precision score, recall score, and F1=score of classifications. To better evaluate models with unbalanced data category, macro averaged score, and weighted average score were utilized. The metrics were defined from equations (5) to (10). In addition, AUC score was also used for in the performance comparison.
| (5) |
| (6) |
| (7) |
| (8) |
| (9) |
| (10) |
represented the class, N was the number of all samples, C was the number of all classes, Ni was the number of samples, TPi, TNi, FPi and FNi stand for true positive, true negative, false positive, and false negative rates for class i, respectively.
Model development
In the model development stage, supervised learning was used to train candidate machine learning models and deep learning models based on preprocessed data. This study developed two models, one was a multi-classification model for predicting infection levels, and the other was a binary classification model for predicting deceased or survival. This study selected XGBoost, logistic regression, random forest, decision tree, support vector machine and the neural network with two hidden layers and one output layer as candidate models.
We used AUC to evaluate the models to select as the base learners to construct ensemble models. The model with the highest AUC score was selected to construct homogeneous ensemble models and the top three models were selected to construct heterogeneous ensemble models.
Based on these above models, this study selected sets of features with the best performances to predict infection levels and mortality of the patients. All the features of the patients, including demographic and clinical features, were input into the models to obtain every features’ importance in model prediction and the order of features. To limit the complexity of the models, this study set the upper limit of the number of selected features as 35. According to the sorted features, the top features were selected as the input features of the training dataset in turn for performance evaluation.
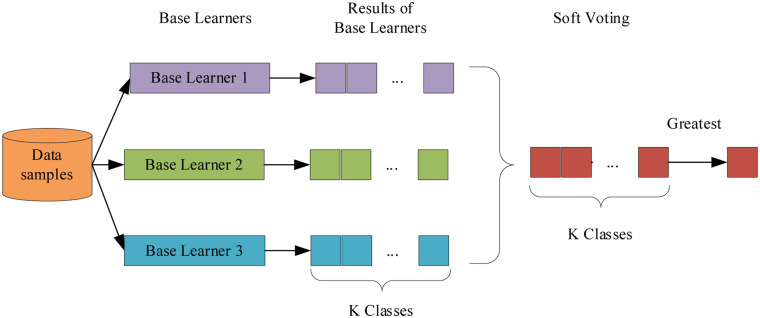
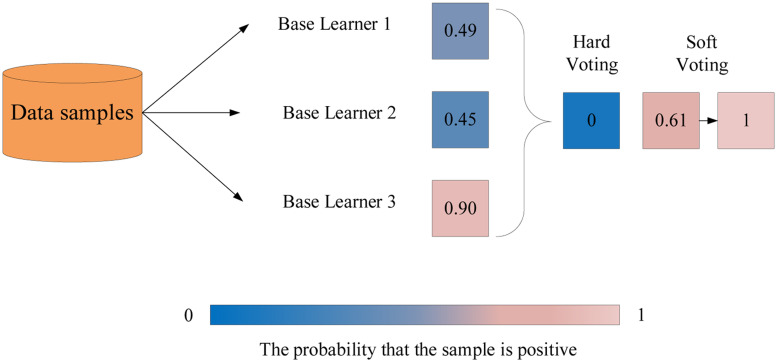
The proposed model used a soft voting to merge the three same kind of machine learning models. First, all the base models were trained and assigned with the probabilities of all classes individually. In the voting stage, the final predictions were the average of performance of each base learner of all classes. The label with the greatest average value was selected as target label, as shown in Figure 2.11 In contrast to hard voting, the soft voting had better performance and could solve the weakness of individual models since it considered the overall average of probabilities.12 When certain base learners didn’t classify samples correctly, the final result was balanced together with other base learners with high confidence, as shown in Figure 3. Moreover, the ensemble model also provided different parameter spaces and the key objective was to reduce bias and variance.
Figure 2.
The architecture of ensemble model with soft voting.
Figure 3.
The comparison of hard voting and soft voting. The result of hard voting is negative since more than half of base learners return negative results. However, the result of the soft voting is positive because the average of all base learners is greater than 0.5. Therefore, the soft voting could balance the weakness of those base learners that could not classify sample correctly.
Results
In this section, this study conducted a univariate analysis of commonly used features about COVID-19 patients to investigate the relationship between these features and outcomes. Moreover, this study compared the performance of the homogeneous ensemble model with other models using the metrics AUC and Recall (Weighted avg). The classification performance of the proposed homogeneous ensemble models were presented with the metrics accuracy, recall, and F1-score. In addition, the performances of the features selection manually and automatically were compared. The manual selection was based on two defined equations and the automatic selection was based on models. The whole process was implemented using Python including various standard libraries and self-developed programs.
Univariate analysis
To investigate the relationship between features and infection levels outcome, we selected some commonly used features about COVID-19 patients from previous studies. We calculated the mean and SDs with odds ratio and p-value of continuous features, as well as the proportion of binary features (Table 2). Data were mean ± SD or n/N (%), where N is the total number of patients. Meanwhile, the same work was carried out on mortality outcome. Odds ratio and p-value were calculated by Fisher's exact test (Table 3).
Table 2.
Univariate analysis of the manually selected features on infection levels outcome.
| Feature | Mild (n = 62) | Moderate (n = 530) | Severe (n = 106) | Critical (n = 62) | |
|---|---|---|---|---|---|
| Ages, years | 37.89 ± 16.89 | 51.82 ± 15.39 | 59.84 ± 15.50 | 64.94 ± 14.23 | |
| Gender | Male | 21 (33.87%) | 231 (43.58%) | 53 (50.00%) | 43 (69.35%) |
| Female | 41 (66.13%) | 299 (56.42%) | 53 (50.00%) | 19 (30.65%) | |
| Bilateral lesions | 31 (50.00%) | 409 (77.17%) | 88 (83.02%) | 57 (91.94%) | |
| Chest tightness | 5 (8.06%) | 95 (17.92%) | 37 (34.91%) | 31 (50.00%) | |
| COPD | 2 (3.23%) | 10 (1.89%) | 3 (2.83%) | 3 (4.84%) | |
| CRP | 9.00 ± 22.57 | 18.20 ± 41.53 | 48.04 ± 62.02 | 102.12 ± 82.83 | |
| hs-CRP | 8.08 ± 21.95 | 13.56 ± 31.86 | 30.69 ± 41.42 | 66.86 ± 58.76 | |
| Hypertension | 3 (4.84%) | 104 (19.62%) | 41 (38.68%) | 33 (53.23%) | |
| LDH | 175.81 ± 48.92 | 195.56 ± 92.21 | 276.57 ± 161.86 | 420.40 ± 222.75 | |
| Leukocytes | 7.53 ± 3.43 | 5.58 ± 2.48 | 6.56 ± 3.95 | 8.70 ± 5.24 | |
| Lymphocytes | 1.64 ± 0.64 | 1.46 ± 1.01 | 1.11 ± 0.59 | 0.98 ± 0.96 | |
| Monocytes | 0.49 ± 0.18 | 0.50 ± 0.29 | 0.54 ± 0.26 | 0.55 ± 0.43 | |
| Oxygen saturation | 98.02 ± 1.26 | 97.77 ± 1.35 | 95.30 ± 5.74 | 91.38 ± 12.10 | |
| Pleural effusion | 0 (0.00%) | 8 (1.51%) | 10 (9.43%) | 12 (19.35%) | |
| Prothrombin time | 11.29 ± 1.14 | 12.01 ± 2.08 | 13.03 ± 1.67 | 13.79 ± 2.29 | |
| Respiratory rate | 19.42 ± 1.25 | 19.63 ± 1.52 | 20.73 ± 2.82 | 23.06 ± 5.39 | |
| Temperature | 36.75 ± 0.44 | 36.75 ± 0.63 | 36.90 ± 0.69 | 37.06 ± 0.95 |
Table 3.
Univariate analysis of the manually selected features on mortality outcome.
| Feature | Total (n = 760) | Deceased (n = 31) | Alive (n = 729) | Odds ratio | p-value | |
|---|---|---|---|---|---|---|
| Ages, years | 52.87 ± 16.59 | 67.06 ± 15.06 | 52.27 ± 16.39 | 0.122 | 0.00002 | |
| Gender | Male | 348 (45.79%) | 21 (67.74%) | 327 (44.86%) | ||
| Female | 412 (54.21%) | 10 (32.26%) | 402 (55.14%) | |||
| Bilateral lesions | 585 (76.97%) | 28 (90.32%) | 557 (76.41%) | 0 | 0.00494 | |
| Chest tightness | 168 (22.11%) | 21 (67.74%) | 147 (20.16%) | 0.121 | <1e-5 | |
| COPD | 18 (2.37%) | 3 (9.68%) | 15 (2.06%) | 0.19 | 0.03076 | |
| CRP | 29.03 ± 54.65 | 131.31 ± 108.06 | 24.25 ± 45.67 | 0.11 | <1e-5 | |
| hs-CRP | 20.32 ± 39.00 | 90.21 ± 74.43 | 17.37 ± 33.88 | 0.163 | 0.00014 | |
| Hypertension | 181 (23.82%) | 18 (58.06%) | 163 (22.36%) | 0.193 | 0.00002 | |
| LDH | 224.94 ± 135.86 | 473.55 ± 221.01 | 213.03 ± 118.20 | 0.091 | <1e-5 | |
| Leukocytes | 6.13 ± 3.25 | 9.54 ± 6.29 | 5.98 ± 2.97 | 0.179 | 0.00002 | |
| Lymphocytes | 1.39 ± 0.95 | 1.10 ± 1.17 | 1.40 ± 0.94 | 2.295 | 0.04254 | |
| Monocytes | 0.51 ± 0.29 | 0.49 ± 0.31 | 0.51 ± 0.29 | 1.338 | 0.57804 | |
| Oxygen saturation | 96.91 ± 4.64 | 91.03 ± 12.90 | 97.16 ± 3.76 | 2.952 | 0.00698 | |
| Pleural effusion | 30 (3.95%) | 13 (41.94%) | 17 (2.33%) | 0.029 | <1e-5 | |
| Prothrombin time | 12.24 ± 2.09 | 14.10 ± 2.87 | 12.15 ± 2.00 | 0.247 | 0.0007 | |
| Respiratory rate | 20.05 ± 2.48 | 22.20 ± 5.06 | 19.96 ± 2.28 | 0.179 | 0.00001 | |
| Temperature | 36.80 ± 0.66 | 36.95 ± 0.92 | 36.79 ± 0.65 | 0.656 | 0.26778 |
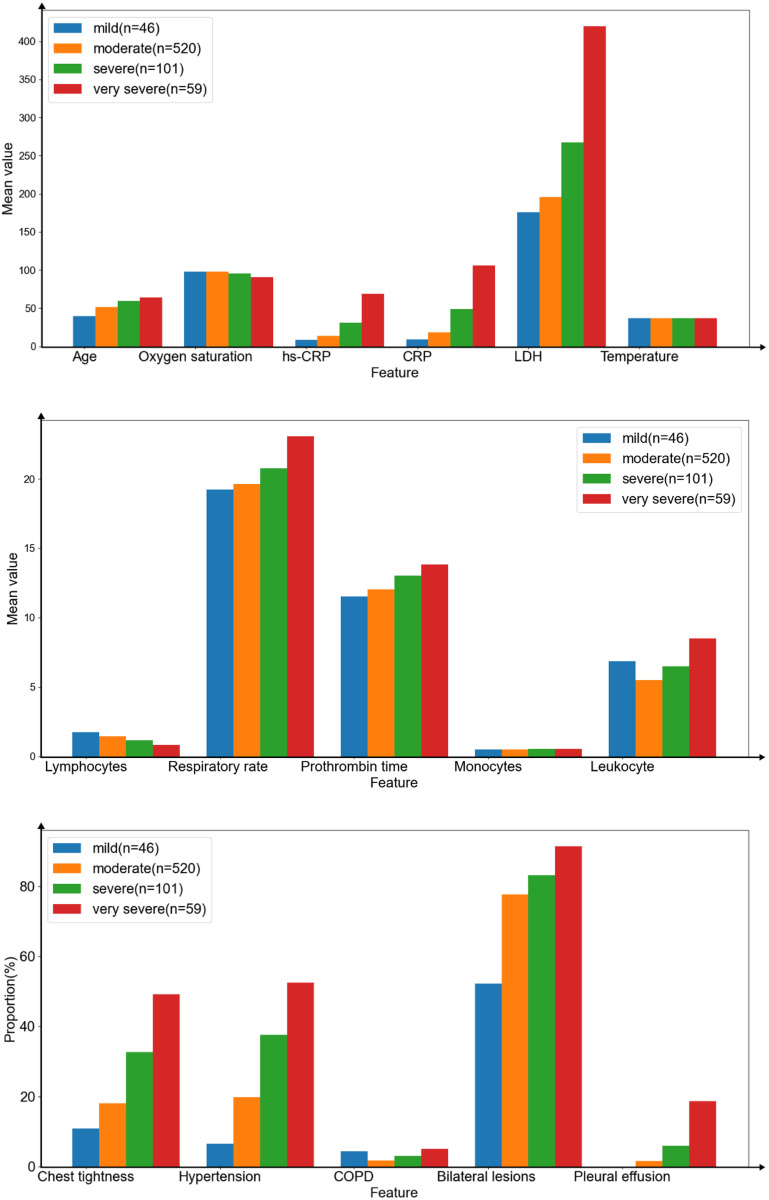
According to the result on infection levels, the average age of patients with severe (59.71 ± 15.46) and critical (64.31 ± 14.14) was 60 years old and above, the mean value of respiratory rate, CRP/hs-CRP, prothrombin time, and LDH became higher as infection levels increased. Lymphocytes and oxygen saturation were the opposite. Infection levels of patients were more severe, the more patients suffered from chest tightness, hypertension, bilateral lesions, and pleural effusion. Besides, the higher infection levels did not mean more patients suffered from chronic obstructive pulmonary disease (COPD), high leukocytes, high monocytes and high temperature.
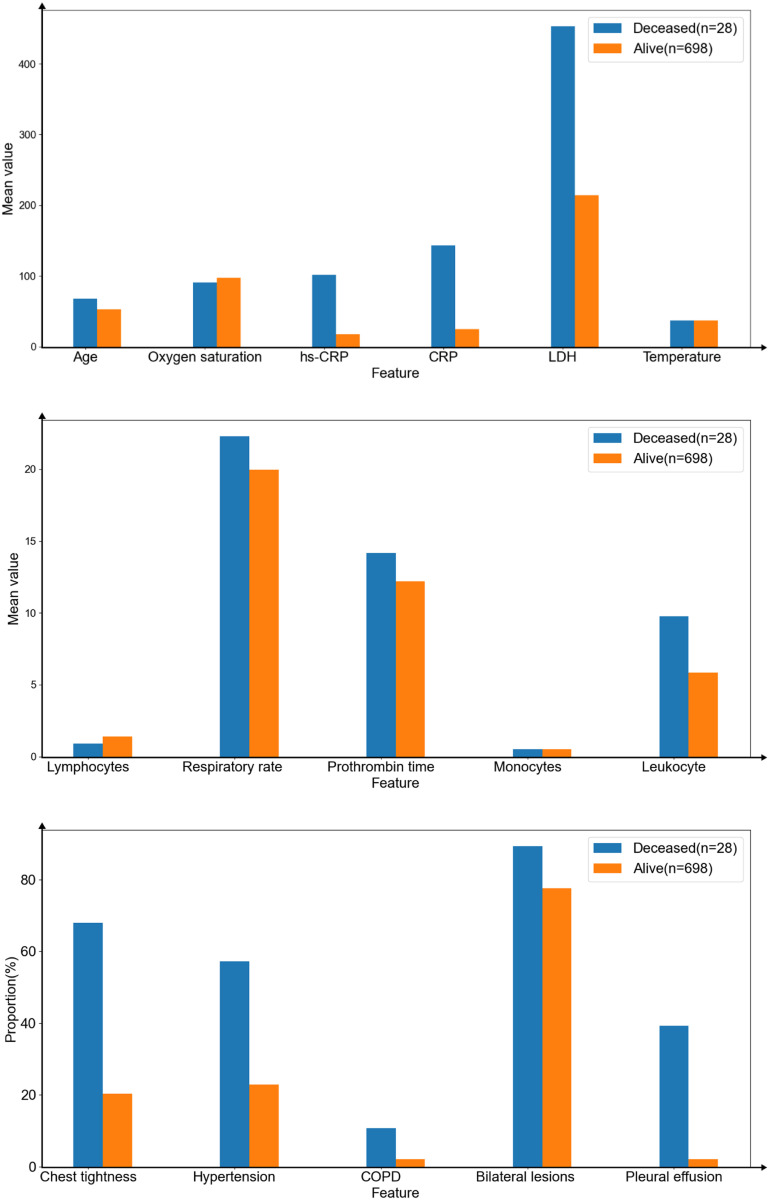
In the case of mortality outcome, univariate analyses of patient features in the dataset showed that those who died were significantly older, with a mean age of 67.68 years (SD 14.26), compared with 52.63 years (SD 16.23) of those alive. The value of leukocytes (5.83 ± 2.82) (p < 1e-5), monocytes (0.50 ± 0.29) (p = 0.70158), hs-CRP (17.44 ± 34.01) (p < 1e-5), CRP (24.58 ± 46.4) (p < 1e-5), prothrombin time (12.19 ± 2.02) (p = 0.00088), LDH (214.10 ± 119.94) (p < 1e-5), respiratory rate (19.95 ± 2.31) (p < 1e-5) were lower in survival. Lymphocytes (1.40 ± 0.95) (p = 0.01909), and oxygen saturation (97.23 ± 3.51) (p = 0.00432) were higher in survival. The deceased also had chest tightness (68%) and bilateral lesions (89%). More than half of people had hypertension (57%), 11% and 39%, respectively, had COPD and pleural effusion, where only 2% of survivors had both of them. There was almost no difference in their admission temperature.
This study chose the mean value of continuous features and the proportion of binary features to compare the different infection levels (Figure 4). In addition, we did the same work to compare the difference between deceased and alive (Figure 5).
Figure 4.
The mean value of continuous features (upper and middle) and the proportion of binary features (lower) on infection levels outcome.
Figure 5.
The mean value of continuous features (upper and middle) and the proportion of binary features (lower) on mortality outcome.
Manual selection
To further investigate the effect of features on predicting infection levels and mortality, this study defined diversity1, diversity2 to measure the degrees of differences in features, respectively, and ordered the features by these diversity as equations (11) and (12).
| (11) |
| (12) |
is the proportion value or the mean value of the features from whose infection levels were mild, while , , and correspond to moderate, severe and critical categories, respectively. is the mean value of , , , and . is the proportion value or the mean value of the features from who were deceased, while is from who were alive. is the mean value of and . This study calculated and ordered the diversity1 (Table 4) and the diversity2 (Table 5) of all features.
Table 4.
The order of all features based on diversity1.
| Feature | Diversity1 | Feature | Diversity1 |
|---|---|---|---|
| Pleural effusion | 0.94884 | Lymphocytes | 0.34286 |
| CRP | 0.82846 | Age | 0.22443 |
| hs-CRP | 0.82821 | Prothrombin time | 0.14094 |
| COPD | 0.81233 | Bilateral lesions | 0.13193 |
| Chest tightness | 0.70027 | Respiratory rate | 0.10538 |
| Hypertension | 0.60133 | Oxygen saturation | 0.06901 |
| LDH | 0.52770 | Monocytes | 0.01961 |
| Leukocyte | 0.40205 | Temperature | 0.00460 |
Table 5.
The order of all features based on diversity2.
| Feature | Diversity2 | Feature | Diversity2 |
|---|---|---|---|
| Pleural effusion | 1.80533 | Lymphocytes | 0.41379 |
| CRP | 1.41431 | Age | 0.25280 |
| hs-CRP | 1.41358 | Prothrombin time | 0.15163 |
| COPD | 1.36792 | Bilateral lesions | 0.14125 |
| Chest tightness | 1.07755 | Respiratory rate | 0.11124 |
| Hypertension | 0.85986 | Oxygen saturation | 0.07148 |
| LDH | 0.71683 | Monocytes | 0.01980 |
| Leukocyte | 0.50321 | Temperature | 0.00461 |
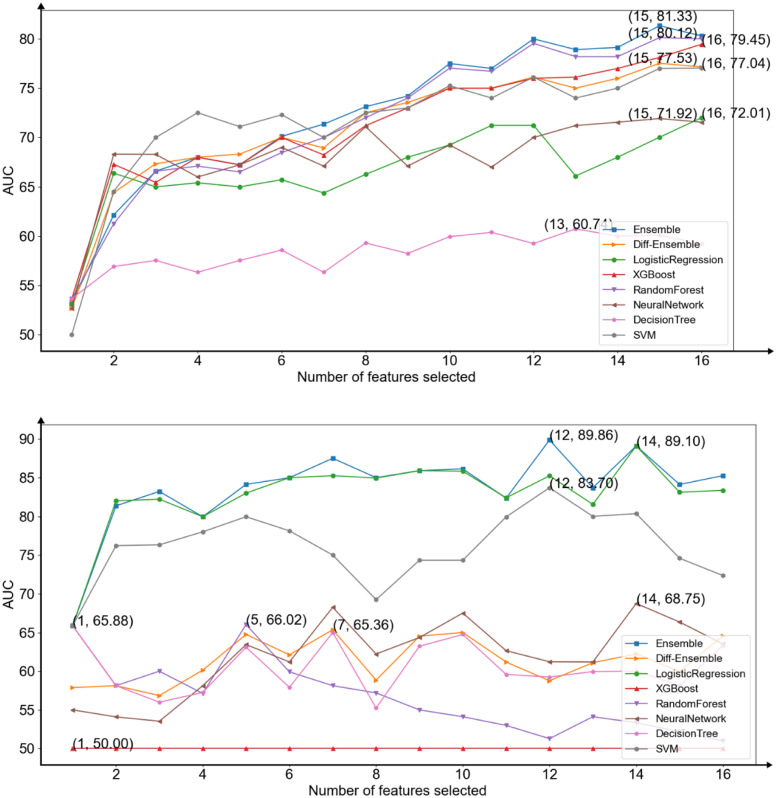
According to the results, this study selected the features, in turn, to add to the development of models and to observe the performances of the models (Figure 6). Data points of the upper figure showed the average AUC score for each machine learning model, neural network, and ensemble model based on diversity1. Data points of the lower figure showed the average AUC score for each machine learning model, neural network and ensemble model based on diversity2.
Figure 6.
The area under the receiver operating characteristic curve (AUC) average scores of all models for each subset of number of manually selected features in predicting infection levels (upper) and predicting mortality (lower).
Automatic selection
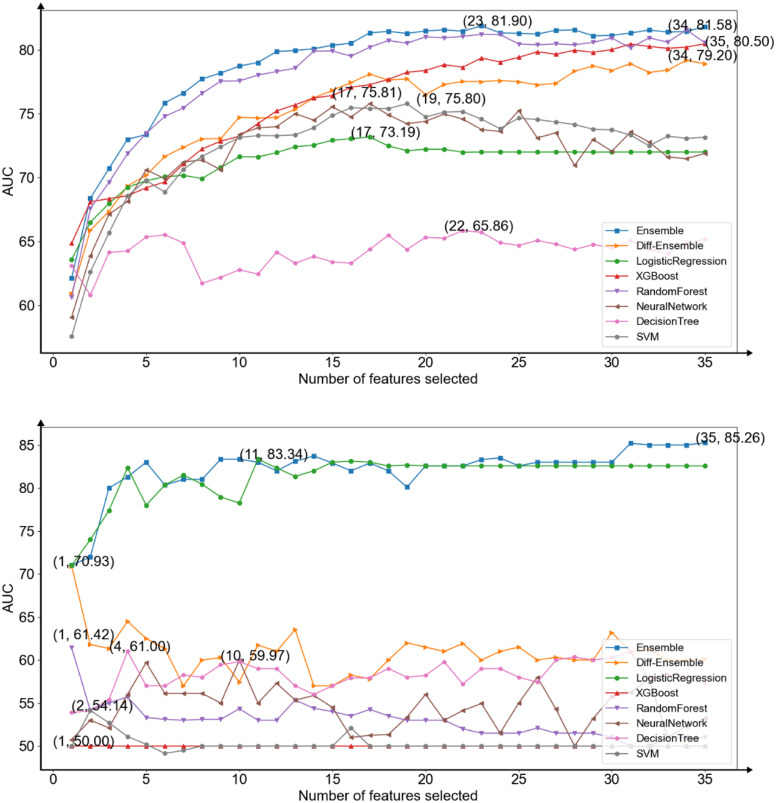
This study attempted to develop two homogeneous ensemble models using a smaller number of features and performing better than candidate models (XGBoost, logistic regression, random forest, decision tree, support vector machine, and the neural network). Besides, this study intended to select two sets of features automatically for reducing human intervention. To achieve these goals, this study first implemented all models to train repeated 10 times and averaged the results of them. This study showed that Random Forest had the best performance when predicting infection levels, thus the model was selected as the base learner to construct a homogeneous ensemble model to predict infection levels. This study used three base learners with different parameters to build soft voting models. Their parameter called n_estimators was different (RF1 (n_estimators = 100), RF2 (n_estimators = 200), RF3 (n_estimators = 300)). Compared to predicting mortality, logistic regression had the best performance and it was used as base learner to construct the homogeneous ensemble model to predict mortality. Their penalty methods, penalty factors and solvers were different (LR1 (penalty = l1, C = 0.1, solver = liblinear), LR2 (penalty = l2, C = 0.1, solver = newton-cg), and LR3 (penalty = l1, C = 0.15, solver = liblinear)) (Figure 7).
Figure 7.
The area under the receiver operating characteristic curve (AUC) average scores of all models for each subset of number of features selected by models in predicting infection levels (upper) and predicting mortality (lower).
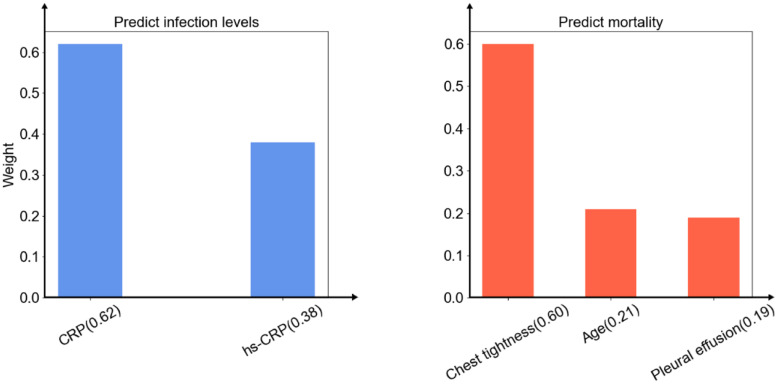
The selected features of the models were different each time. To identify the clinical features most predictive, this study collected the features chosen the most times of two homogeneous ensemble models respectively. In order to reduce the complexity, this study selected the best number of features when the performance of the homogeneous ensemble model just exceeded other models. The results showed that in the case of two and three features, the homogeneous ensemble models this study proposed exceeded other baseline models in predicting infection levels and mortality, respectively. The two sets of selected features were: CRP and hs-CRP for predicting infection levels, while chest tightness, age, and pleural effusion for predicting mortality. After normalizing the important scores of these features in model training, this study obtained the weights of these features (chest tightness (0.60), age (0.21), pleural effusion (0.19), CRP (0.62), and hs-CRP (0.38)) (Figure 8).
Figure 8.
The features were selected by the homogeneous ensemble models. The weights of the features of predicting infection levels (left) and predicting mortality (right).
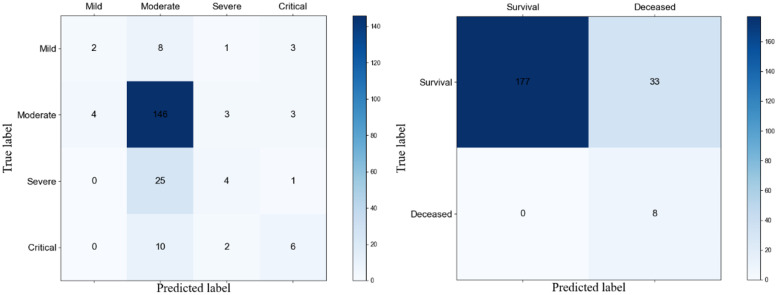
After the above features were selected, these features were used in the homogeneous ensemble models to obtain the classification performances of homogeneous ensemble models in predicting infection levels (Table 6) and mortality (Table 7). The confusion matrixes of the proposed model were also shown (Figure 9). The results showed that when predicting infection levels, the model had a high performance at identifying moderate patients but was slightly weak in other categories. In the case of predicting mortality, the precision of predicting survival was 100% and the recall of predicting deceased was also 100%. The weighted average of results showed that the performances reached 80-100% and the AUC score surpassed other baseline models clearly.
Table 6.
Classification performances of the homogeneous ensemble model in predicting infection levels.
| Precision | Recall | F1-score | #Samples | |
|---|---|---|---|---|
| Mild | 0.33 | 0.14 | 0.20 | 14 |
| Moderate | 0.77 | 0.94 | 0.85 | 156 |
| Severe | 0.40 | 0.13 | 0.20 | 30 |
| Critical | 0.46 | 0.33 | 0.39 | 18 |
| Accuracy | 0.72 | 0.72 | 0.72 | 218 |
| Macro avg | 0.49 | 0.39 | 0.41 | 218 |
| Weighted avg | 0.67 | 0.72 | 0.68 | 218 |
Table 7.
Classification performances of the homogeneous ensemble model in predicting mortality.
| Precision | Recall | F1-score | #Samples | |
|---|---|---|---|---|
| Survival | 1.00 | 0.84 | 0.91 | 210 |
| Deceased | 0.20 | 1.00 | 0.33 | 8 |
| Accuracy | 0.85 | 0.85 | 0.85 | 218 |
| Macro avg | 0.60 | 0.92 | 0.62 | 218 |
| Weighted avg | 0.97 | 0.85 | 0.89 | 218 |
Figure 9.
Confusion matrixes of infection levels prediction (left) and mortality prediction (right).
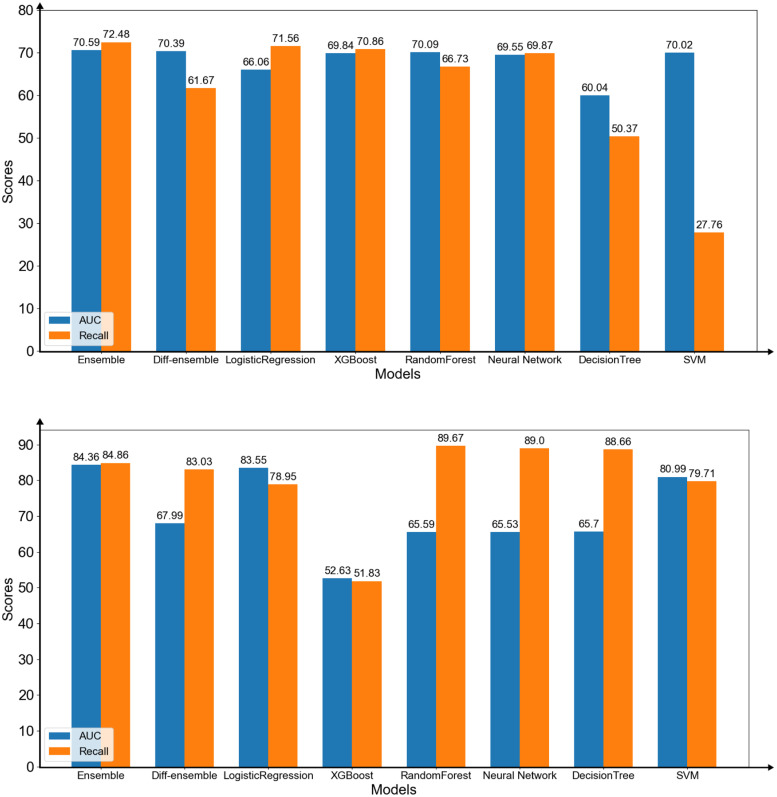
We compared the performances of all models using the features selected by the homogeneous ensemble model. The results of predicting infection levels showed that the homogeneous ensemble model was better than other models (Figure 10(upper)). The AUC and Recall (Weighted avg) of the proposed model were the highest among all models when using the selected features. In addition, the AUC score of the proposed model was higher than the highest score when using the selected features (AUC = 70.59). The results of predicting mortality ratio showed that the homogeneous ensemble model had higher AUC and Recall (Weighted avg) scores compared with that of other models. (Figure 10(lower)). The AUC score of the homogeneous model was higher than the best performance (AUC = 84.36) using the three features.
Figure 10.
The area under the receiver operating characteristic curve (AUC) scores and weighted average recall of the models predicting infection levels (upper) and mortality (lower) with only the selected features by the homogeneous ensemble model.
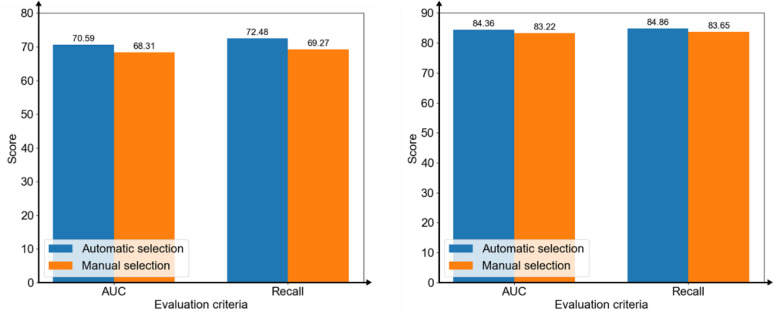
To confirm selecting features automatically by the homogeneous ensemble models was better than selecting features manually, this study compared the AUC scores and Recall (Weighted avg) between automatically and manually. The results showed that using the features selected automatically was better than the best scores of manual selections under the two evaluation criteria in two prediction tasks (Figure 11).
Figure 11.
The area under the receiver operating characteristic curve (AUC) scores and weighted average recall of the models on predicting infection levels (left) and mortality (right) with selecting features automatically by the homogeneous ensemble models and manually.
Discussion
Principle findings
The significance of this study was multifold. First, this study predicted infection levels (multi-classification) and mortality (binary classification) based on the clinical data of patients collected from Zhongnan Hospital of Wuhan University at the same time. Two homogeneous ensemble models were proposed in this study and they had better performance than state-of-the-art baseline models. Second, factors that contributed most to the mortality of COVID-19 were not always readily apparent, rendering care and management of these patients difficult in settings of finite healthcare resources.7 The models this study proposed could be provided as quantitative tools to predict infection levels and the risk of death. Third, this study obtained the essential features of predicting infection levels and mortality. The models we proposed selected CRP and hs-CRP which is available in routine blood tests when predicting infection levels and selected chest tightness, age, and pleural effusion when predicting mortality. All of them were easily obtained in the hospital. By collecting these features of patients and input into the homogeneous ensemble models proposed, it was possible to accurately predict infection levels and mortality. This might be helpful for determining the disease progression of patients and arranging a reasonable priority for them, especially when the resources were limited.13
The findings of this study were supported by many related studies. In previous studies, age, CRP, hs-CRP, and respiratory symptoms were all used as features to construct predictive models.5–7, 14–19 This study achieved better results than previous models on the same or even a smaller number of features selected.
When predicting infection levels, the weights of CRP and hs-CRP were 71% and 29%, respectively, indicating that CRP played an essential role. In the univariate analyses, the mean values of CRP in patients with different infection levels discriminated significantly. In dengue infection, CRP had been considered a prognostic biomarker, and higher values of CRP usually indicated higher risk of disease progression.20, 21 It was worth noting that dengue virus and COVID-19 were both the RNA virus, and their infection progression was similar. Biologically, CRP was rapidly synthesized by hepatocytes when stimulated by inflammation, binding to a variety of eukaryotic and prokaryotic pathogens.22 Therefore, CRP was considered an inflammatory biomarker that correlates with disease severity and was also an important marker for intensive care unit (ICU) admission.17, 19 Clinically, CRP could be used as an important indicator for patients of COVID-19, and doctors could prevent disease progression by judging whether CRP was elevated.23, 24
The results showed that using the mean values of hs-CRP could also be used to divide patients into different infection levels. However, the performance was not as good as CRP. Despite predicting mortality or predicting infection levels, our work showed that the increase in hs-CRP was also an effective marker of the disease severity of COVID-19,25, 26 it reflected the persistent inflammatory.27 The result of this persistent inflammatory response was large grey-white lesions in the lungs of patients with COVID-19 (seen in autopsy).28
In the case of predicting mortality, this study found that chest tightness accounted for a large proportion in predicting mortality of patients and it was significantly associated with poor prognosis in COVID-19 patients.29 Chest tightness was also a common clinical feature of COVID-19. It was also associated with delayed clearance of viral RNA in patients hospitalized with COVID-1930 and was found to influence patients’ subsequent improvement.31 Therefore, chest tightness was also an important factor in predicting the risk of death in patients.
Age was the risk factor for the patients with COVID-19. Since the beginning of COVID-19 pandemic, older age had been recognized as a risk factor for worse outcomes,32, 33 with the most severe and fatal cases among patients over 60 years old.6 This manifested not only in the univariate analysis of the data but also in the features selected by the homogeneous ensemble models. It was worth noting that age was reflected in the patients of this study, as well as in the study in the United States. In New York State, USA, patients aged 60 years and older took nearly 85% of all deaths due to COVID-19 as of 2 September 2020.34 Similarly, age (over 60 years) and comorbid disease were also risk factors for poor outcome in severe acute respiratory syndrome (SARS) patients in 2003.35
Pleural effusion was an important factor for the patients of COVID-19. There were quite few cases of pleural effusion in the ICU and deceased patients. The incidence of pleural effusion in severe and critical patients was also higher than that in ordinary patients, and the treatment time was longer.36–38 There were also a lot of reports of pleural effusion in emergency cases,39 thus pleural effusion was significantly associated with infection levels and mortality.40
The performance of automatic selection was slightly better than that of manual selection. We speculated that the homogeneous ensemble model could find a certain relationship among the features, and this relationship associated certain features together to more effectively predict than that of manual selection. The reason for only the small performance difference was mainly that the features in manually selected and automatically selected had much overlap (>50%).
Limitations
This study had limitations. First, the models proposed were purely data-driven, and the models might vary if the dataset was significantly different. As more data were given, the result could be more stable and more accurate models could be obtained. Second, this study was a single-centered and retrospective study without evaluating external datasets. The results might be related to different regions.
Conclusions
This study proposed two homogeneous ensemble models based on clinical features of COVID-19 patients for predicting infection levels and mortality. Based on a retrospective dataset, the models obtained the best performance (Infection levels: AUC = 0.7059, Recall (Weighted avg) = 0.7248, Mortality: AUC = 0.8436, Recall (Weighted avg) = 0.8486) compared to the state-of-the-art baseline models. In addition, this study obtained two sets of effective features for predicting infection levels and mortality respectively. One set of features consisted of CRP and hs-CRP for predicting infection levels, the other contained chest tightness, age, and pleural effusion for predicting mortality. These two sets of features were easily obtained clinically. The identified features increased the understanding of the relationship between these features and outcomes resulting from COVID-19. The results of this study might benefit the determination of disease progression of COVID-19 patients and the arrangement of a reasonable priority for patients.
Supplemental Material
Supplemental material, sj-docx-1-dhj-10.1177_20552076221133692 for Homogeneous ensemble models for predicting infection levels and mortality of COVID-19 patients: Evidence from China by Jiafeng Wang, Xianlong Zhou, Zhitian Hou, Xiaoya Xu, Yueyue Zhao, Shanshan Chen, Jun Zhang, Lina Shao, Rong Yan, Mingshan Wang, Minghua Ge, Tianyong Hao, Yuexing Tu and Haijun Huang in Digital Health
Footnotes
The authors declared no potential conflicts of interest with respect to the research, authorship, and/or publication of this article.
Contributorship: TH, HH, YT, JW, XZ, and ZH conceived the study. HH, YZ, SC, and RY collected the data. JW, XZ, ZH, JZ, LS, MW, and MG did literature research. TH and ZH developed study design. HH, TH, JW, and ZH analyzed results. JW, XZ, and ZH wrote first draft. TH, HH, YT, and XX contributed to revisions.
Ethical approval: This retrospective study was approved by the Research Ethics Commission of Zhongnan Hospital of Wuhan University and the Ethics Committee of Zhejiang Provincial People's Hospital. The requirement for informed consent was waived due to its retrospective design.
Funding: The authors disclosed receipt of the following financial support for the research, authorship, and/or publication of this article: This work was supported by the Natural Science Foundation of Guangdong Province, National Natural Science Foundation of China, and Scientific Research Fund of the National Health Commission of China (grant numbers 2020A1515010924, 72101059, and WKJ-ZJ-2102).
Guarantor: JW.
Data availability statement: The datasets used and analyzed during the current study are not publicly available for privacy reasons but are available from the corresponding author on reasonable request and formal application.
ORCID iD: Zhitian Hou https://orcid.org/0000-0002-3520-5052
Supplemental material: Supplemental material for this article is available online.
References
- 1.Schwab P, Schütte AD, Dietz Bet al. et al. Clinical predictive models for COVID-19: systematic study. J Med Internet Res 2020; 22: e21439. [DOI] [PMC free article] [PubMed] [Google Scholar]
- 2.World Health Organization. COVID-19 weekly epidemiological update, edition 84, 22 March 2022. 2022.
- 3.World Health Organization (WHO). Clinical management of severe acute respiratory infection when novel coronavirus (nCoV) infection is suspected: interim guidance; WHO: Geneva, Switzerland; Available online: https://apps.who.int/iris/handle/10665/332299. Published 12 January 2020. [Google Scholar]
- 4.Lalmuanawma S, Hussain J, Chhakchhuak L. Applications of machine learning and artificial intelligence for COVID-19 (SARS-CoV-2) pandemic: a review. Chaos Solitons Fractals 2020; 139: 110059. [DOI] [PMC free article] [PubMed] [Google Scholar]
- 5.Yan L, Zhang HT, Goncalves Jet al. An interpretable mortality prediction model for COVID-19 patients. Nat Mach Intell 2020; 2: 283–288. [Google Scholar]
- 6.Liang W, Yao J, Chen Aet al. et al. Early triage of critically ill COVID-19 patients using deep learning. Nat Commun 2020; 11: 1–7. [DOI] [PMC free article] [PubMed] [Google Scholar]
- 7.Yadaw AS, Li YC, Bose Set al. et al. Clinical features of COVID-19 mortality: development and validation of a clinical prediction model. Lancet Digit Health 2020; 2: e516–e525. [DOI] [PMC free article] [PubMed] [Google Scholar]
- 8.Wells BJ, Chagin KM, Nowacki ASet al. et al. Strategies for handling missing data in electronic health record derived data. eGEMs 2017; 1: 7. [DOI] [PMC free article] [PubMed] [Google Scholar]
- 9.Rubinsteyn A, Feldman S. Fancyimpute. An Imputation Library for Python, https://github.com/iskandr/fancyimpute (2016).
- 10.Pedregosa F, Varoquaux G, Gramfort Aet al. Scikit-learn: machine learning in Python. J Mach Learn Res 2011; 12: 2825–2830. [Google Scholar]
- 11.Ali S, Hussain A, Aich Set al. et al. A soft voting ensemble-based model for the early prediction of idiopathic pulmonary fibrosis (IPF) disease severity in lungs disease patients. Life 2021; 11: 1092. [DOI] [PMC free article] [PubMed] [Google Scholar]
- 12.Saqlain M, Jargalsaikhan B, Lee JY. A voting ensemble classifier for wafer map defect patterns identification in semiconductor manufacturing. IEEE Trans Semicond Manuf 2019; 32: 171–182. [Google Scholar]
- 13.Truog RD, Mitchell C, Daley GQ. The toughest triage—allocating ventilators in a pandemic. N Engl J Med 2020; 382: 1973–1975. [DOI] [PubMed] [Google Scholar]
- 14.Zhou Y, He Y, Yang Het al. et al. Development and validation a nomogram for predicting the risk of severe COVID-19: a multi-center study in Sichuan, China. PloS One 2020; 15: e0233328. [DOI] [PMC free article] [PubMed] [Google Scholar]
- 15.Li J, Chen Y, Chen Set al. et al. Derivation and validation of a prognostic model for predicting in-hospital mortality in patients admitted with COVID-19 in Wuhan, China: the PLANS (platelet lymphocyte age neutrophil sex) model. BMC Infect Dis 2020; 20: 1–10. [DOI] [PMC free article] [PubMed] [Google Scholar]
- 16.Gong J, Ou J, Qiu Xet al. A tool for early prediction of severe coronavirus disease 2019 (COVID-19): a multicenter study using the risk nomogram in Wuhan and Guangdong, China. Clin Infect Dis 2020; 71: 833–840. [DOI] [PMC free article] [PubMed] [Google Scholar]
- 17.Lassau N, Ammari S, Chouzenoux Eet al. Integrating deep learning CT-scan model, biological and clinical variables to predict severity of COVID-19 patients. Nat Commun 2021; 12: 1–11. [DOI] [PMC free article] [PubMed] [Google Scholar]
- 18.Mahdavi M, Choubdar H, Zabeh Eet al. A machine learning based exploration of COVID-19 mortality risk. Plos One 2021; 16: e0252384. [DOI] [PMC free article] [PubMed] [Google Scholar]
- 19.Subudhi S, Verma A, Patel ABet al. Comparing machine learning algorithms for predicting ICU admission and mortality in COVID-19. NPJ Digit Med 2021; 4: 1–7. [DOI] [PMC free article] [PubMed] [Google Scholar]
- 20.Yacoub S, Wills B. Predicting outcome from dengue. BMC Med 2014; 12: 1–10. [DOI] [PMC free article] [PubMed] [Google Scholar]
- 21.Diamond MS, Pierson TC. Molecular insight into dengue virus pathogenesis and its implications for disease control. Cell 2015; 162: 488–492. [DOI] [PMC free article] [PubMed] [Google Scholar]
- 22.Chen W, Zheng KI, Liu Set al. et al. Plasma CRP level is positively associated with the severity of COVID-19. Ann Clin Microbiol Antimicrob 2020; 19: 1–7. [DOI] [PMC free article] [PubMed] [Google Scholar]
- 23.Feng G, Zheng KI, Yan QQet al. COVID-19 and liver dysfunction: current insights and emergent therapeutic strategies. J Clin Transl Hepatol 2020; 8: 1. [DOI] [PMC free article] [PubMed] [Google Scholar]
- 24.Guan WJ, Ni ZY, Hu Yet al. Clinical characteristics of coronavirus disease 2019 in China. N Engl J Med 2020; 382: 1708–1720. [DOI] [PMC free article] [PubMed] [Google Scholar]
- 25.Ridker PM, Danielson E, Fonseca FAet al. Rosuvastatin to prevent vascular events in men and women with elevated C-reactive protein. N Engl J Med 2008; 359: 2195–2207. [DOI] [PubMed] [Google Scholar]
- 26.Sharma SK, Gupta A, Biswas Aet al. Aetiology, outcomes & predictors of mortality in acute respiratory distress syndrome from a tertiary care centre in north India. Indian J Med Res 2016; 143: 782. [DOI] [PMC free article] [PubMed] [Google Scholar]
- 27.Bajwa EK, Khan UA, Januzzi JLet al. et al. Plasma C-reactive protein levels are associated with improved outcome in ARDS. Chest 2009; 136: 471–480. [DOI] [PMC free article] [PubMed] [Google Scholar]
- 28.Liu X, Wang RS, Qu GQ. A general report on the systematic anatomy of COVID-19. J Forensic Med 2020; 36: 1–3. [Google Scholar]
- 29.Yang L, Jin J, Luo Wet al. et al. Risk factors for predicting mortality of COVID-19 patients: a systematic review and meta-analysis. PLoS One 2020; 15: e0243124. [DOI] [PMC free article] [PubMed] [Google Scholar]
- 30.Hu X, Xing Y, Jia Jet al. et al. Factors associated with negative conversion of viral RNA in patients hospitalized with COVID-19. Sci Total Environ 2020; 728: 138812. [DOI] [PMC free article] [PubMed] [Google Scholar]
- 31.Zhang J, Wang X, Jia Xet al. Risk factors for disease severity, unimprovement, and mortality in COVID-19 patients in Wuhan, China. Clin Microbiol Infect 2020; 26: 767–772. [DOI] [PMC free article] [PubMed] [Google Scholar]
- 32.Wu Z, McGoogan JM. Characteristics of and important lessons from the coronavirus disease 2019 (COVID-19) outbreak in China: summary of a report of 72 314 cases from the Chinese center for disease control and prevention. JAMA 2020; 323: 1239–1242. [DOI] [PubMed] [Google Scholar]
- 33.Mehra MR, Desai SS, Kuy Set al. et al. Cardiovascular disease, drug therapy, and mortality in COVID-19. N Engl J Med 2020; 382: e102. [DOI] [PMC free article] [PubMed] [Google Scholar] [Retracted]
- 34.Bhatraju PK, Ghassemieh BJ, Nichols Met al. COVID-19 in critically ill patients in the Seattle region—case series. N Engl J Med 2020; 382: 2012–2022. [DOI] [PMC free article] [PubMed] [Google Scholar]
- 35.Booth CM, Matukas LM, Tomlinson GAet al. et al. Clinical features and short-term outcomes of 144 patients with SARS in the greater toronto area. Jama 2003; 289: 2801–2809. [DOI] [PubMed] [Google Scholar]
- 36.Li K, Wu J, Wu Fet al. et al. The clinical and chest CT features associated with severe and critical COVID-19 pneumonia. Invest Radiol 2020; 55: 327–331. [DOI] [PMC free article] [PubMed] [Google Scholar]
- 37.Mo P, Xing Y, Xiao YUet al. Clinical characteristics of refractory COVID-19 pneumonia in Wuhan, China. Clin Infect Dis 2020; 73: e4208–e4213. [DOI] [PMC free article] [PubMed] [Google Scholar]
- 38.Wei XS, Wang X, Ye LLet al. et al. Pleural effusion as an indicator for the poor prognosis of COVID-19 patients. Int J Clin Pract 2021; 75: e14123. [DOI] [PMC free article] [PubMed] [Google Scholar]
- 39.Tabatabaei SMH, Talari H, Moghaddas Fet al. et al. CT features and short-term prognosis of COVID-19 pneumonia: a single-center study from Kashan, Iran. Radiol Cardiothorac Imaging 2020; 2 : e200130. [DOI] [PMC free article] [PubMed] [Google Scholar]
- 40.Rathore SS, Hussain N, Manju AHet al. Prevalence and clinical outcomes of pleural effusion in COVID–19 patients: a systematic review and meta–analysis. J Med Virol 2022; 94: 229–239. [DOI] [PMC free article] [PubMed] [Google Scholar]
Associated Data
This section collects any data citations, data availability statements, or supplementary materials included in this article.
Supplementary Materials
Supplemental material, sj-docx-1-dhj-10.1177_20552076221133692 for Homogeneous ensemble models for predicting infection levels and mortality of COVID-19 patients: Evidence from China by Jiafeng Wang, Xianlong Zhou, Zhitian Hou, Xiaoya Xu, Yueyue Zhao, Shanshan Chen, Jun Zhang, Lina Shao, Rong Yan, Mingshan Wang, Minghua Ge, Tianyong Hao, Yuexing Tu and Haijun Huang in Digital Health


