

Abstract
Calgranulin C performs antimicrobial activity in the human immune response by sequestering Zn(II). This biological function is afforded with the aid of two structurally distinct Ca(II)‐binding EF hand motifs, wherein one of which bears an unusual amino acid sequence. Here, we utilize solution state NMR relaxation measurements to investigate the mechanism of Ca(II)‐modulated enhancement of Zn(II) sequestration by calgranulin C. Using C13/N15 CPMG dispersion experiments we have measured pH‐dependent major and minor state populations exchanging on micro‐to‐millisecond timescale. This conformational exchange takes place exclusively in the Ca(II)‐bound state and can be mapped to residues located in the EF‐I loop and the linker between the tandem EF hands. Molecular dynamics (MD) simulations spanning nano‐to‐microsecond timescale offer insights into the role of pH‐dependent electrostatic interactions in EF‐hand dynamics. Our results suggest a pH‐regulated dynamic equilibrium of conformations that explore a range of “closed” and partially “open” sidechain configurations within the Zn(II) binding site. We propose a novel mechanism by which Ca(II) binding to a non‐canonical EF loop regulates its flexibility and tunes the antimicrobial activity of calgranulin C.
Keywords: Ca(II) binding proteins, molecular dynamics simulations, NMR spectroscopy, zinc sequestration
1. INTRODUCTION
Sequestration of Zn(II), Mn(II), and Fe(II) is the primary approach undertaken by the human innate immune response to impede pathogenic growth. 1 , 2 , 3 , 4 Calgranulins are a group of small proteins that perform metal sequestration antimicrobial functions in human bodies. 2 , 5 , 6 , 7 , 8 Calgranulin C performs its antimicrobial activities by sequestering Zn(II) from microbes that require this divalent metal ion to proliferate. 2 , 5 , 9 Zn(II) binding to calgranulin C takes place at the interface of its homodimer to a His3Asp‐binding scaffold composed of H15 and D25 from one monomer and H85 and H89 belonging to the second monomer of the dimer (Figure 1a). 10 The symmetry imposed by the homodimeric configuration allows sequestration of two Zn(II) ions per dimer. Calgranulin C has two calcium‐binding EF hand motifs. The N‐terminal EF loop (EF‐I) is a non‐canonical EF motif specific to the large S100 family of proteins to which calgranulin C belongs. The EF loop at the C‐terminal (EF‐II) is the conventional motif present in all Ca(II) binding proteins.
FIGURE 1.
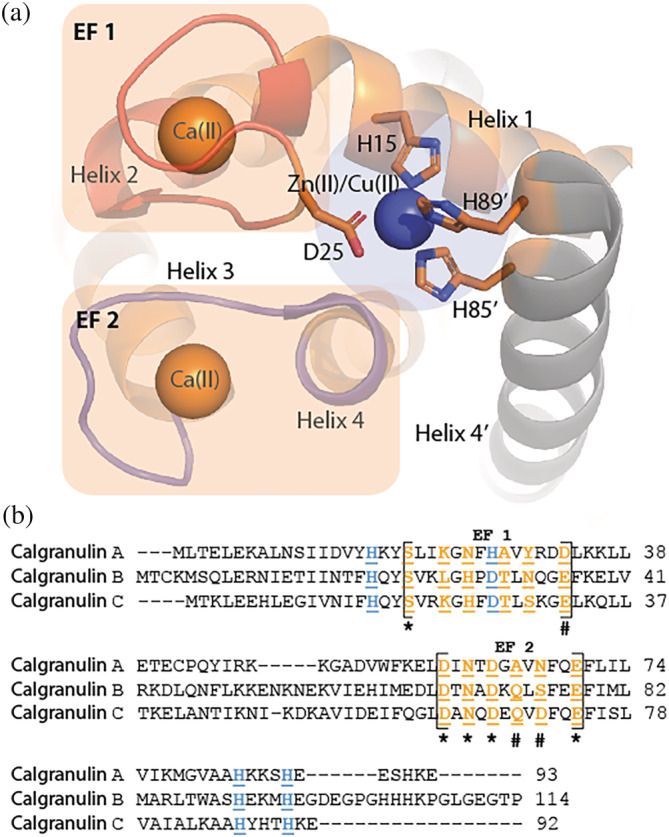
(a) Metal‐binding scaffold of calgranulin C (PDB: 1ODB). Cu(II) and Zn(II) share the His3Asp‐binding site, which is occupied by Zn(II) under biological conditions and (b) sequence comparison of residues of EF‐I and ‐II loops in calgranulin A, B, and C
Ca(II) binding is critical for the antimicrobial functions of calgranulins. Ca(II) increases Zn(II), Fe(II), and Mn(II) affinity of calgranulins, 11 , 12 , 13 thereby enhancing metal sequestration and antipathogenic activities. In vivo, where calgranulins are secreted during the immune response, high Ca(II) concentration in the extracellular milieu ensures that the antimicrobial functions are performed by the Ca(II)‐bound protein. Despite extensive structural characterization of apo‐ and metal‐bound calgranulin C, 14 , 15 , 16 , 17 the mechanism of Ca(II)‐induced modulation of Zn(II) binding is not fully understood. Furthermore, the functional relevance of the EF‐I loop is unclear. EF‐I loop is architecturally distinct from the canonical Ca(II)‐binding loops found in nature. In contrast to the highly conserved EF‐II loops that contain 12 residues, the EF‐I loop has 14 residues (Figure 1b). Typically, EF‐II loops are composed of acidic residues, while the EF‐I loops bear several basic residues. Additionally, Ca(II) binding in EF‐I loop takes place via backbone carbonyls for several ligands as opposed to sidechain carbonyls in EF‐II. EF‐I loop also exhibits larger sequence variations within calgranulins compared to EF‐II. 18 , 19
Apo‐calgranulin C is an efficient Zn(II) chelator (K D ~ nanomolar). 12 We previously demonstrated that Zn(II) binding to calgranulin C is pH‐dependent. 20 At sub‐neutral pH (~6.0), Zn(II) affinity of apo‐protein is dramatically reduced. Ca(II) restores and extends the viable pH range for Zn(II) binding. Similar behavior was observed for calgranulin A/B (calprotectin) heterodimer, which similar to calgranulin C performs metal sequestration‐mediated antimicrobial functions in the immune response. 21 For calgranulin C, the loss in Zn(II) binding to apo‐protein at pH 6.0 and the expansion of the pH‐range for Zn(II) binding were demonstrated to originate from an unknown mechanism other than protonation of the metal‐binding histidines. These findings demonstrate the synergy between divalent metal ion binding in the EF‐I/II loops of calgranulins and metal sequestration under sub‐neutral pH conditions known to exist at the sites of inflammation and during neutrophil activation underscoring the need for further investigation into the mechanism of pH regulation of antimicrobial activity by the human innate response. 22
The available structures of calgranulin C typically focus on the determinants of metal coordination and not as much on the question of cooperativity in binding. While structure of biomolecules undeniably dictates functions, motions on various timescales have been shown to have critical contributions in their activity. 23 , 24 , 25 , 26 , 27 , 28 , 29 , 30 , 31 Here, we investigate millisecond (ms) motions in apo‐ and Ca(II)‐calgranulin C using Carr‐Purcell‐Meiboom‐Gill (CPMG) relaxation dispersion NMR measurements. Apo‐protein exhibited complete lack of conformational fluctuations in the polypeptide backbone on μs‐ms timescale. Upon Ca(II) binding, the backbone mobility along EF‐I/II loops and functionally relevant hinge residues (38–52) increased significantly. We demonstrate, for the first time, that Ca(II)‐binding‐induced μs‐ms timescale flexibility in the EF‐I loop is allosterically coupled to EF‐II residues. Molecular dynamics (MD) simulations carried out to probe the mechanism of pH‐dependent cooperativity between Ca(II) and Zn(II) binding offer a framework for understanding the motions observed by NMR. Results indicate that the motions in the polypeptide backbone, particularly in the hinge region and the EF loops, are triggered by pH‐dependent electrostatic interactions involving the C‐terminal. These interactions suggest conformational regulation, executed by the EF‐I loop, that controls the population of Zn(II)‐binding states in a pH‐dependent manner. Our hybrid NMR‐MD approach unravels dynamics‐modulated functions of the unique EF‐I loop, underscoring its pivotal role in metal sequestration‐based antimicrobial functions of calgranulin C. Such dynamics‐modulated conformational subspace may also exist in calgranulin A/B, indicating a prevailing mechanism of pH modulation of antimicrobial functions in human immune response.
2. RESULTS AND DISCUSSION
2.1. Millisecond dynamics in apo‐ and Ca(II)‐protein
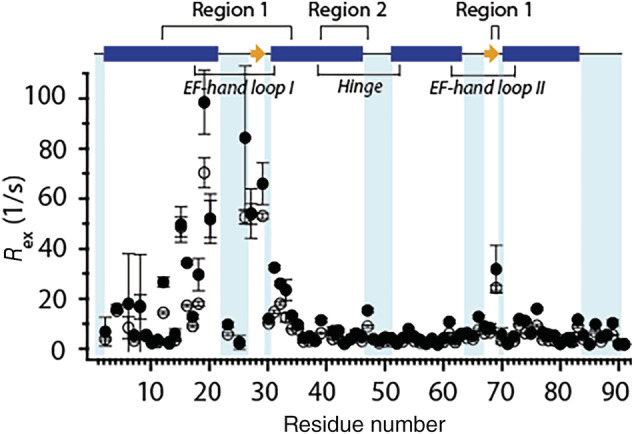
Quantitative characterization of ms motions in the backbone of apo‐ and Ca(II)‐calgranulin C at pH 6.0 was performed by 15N CPMG relaxation dispersion experiments at 11.7 and 18.8 T. Residue‐specific dispersion trajectories were obtained based on backbone assignments previously reported by us. 20 , 32 No substantial decay in the dispersion curves for the apo‐protein was detected (data not shown). To estimate the contribution of chemical exchange, R ex, to 15N R 2 values, dispersion curves of each residue was fit individually to the Carver‐Richards two‐site exchange model. 33 Site‐specific R ex values determined from these fits are displayed in Figure 2. Due to the lack of decay in the dispersion curves for apo‐protein, no significant R ex values were obtained (Figure 2a). Similar analysis on the Ca(II)‐bound protein yielded several residues with large R ex (>10 s−1 at 18.8 T) and suggested the presence of chemical exchange processes (Figure 2b). Figure 2c shows R ex values mapped on the structure of Ca(II)‐calgranulin C. Large R ex of ca. 30–40 s−1 (at 18.8 T) was observed for EF‐I residues. Albeit smaller than EF‐I loop, residues in the hinge region (38–53) also indicated motions with R ex values of ca. 4–18 s−1 (at 18.8 T), along with several residues in EF‐II and the isolated C‐terminal residue (Y86). While expected to be flexible, these regions in the apo‐protein do not show any evidence of motions on this timescale. These results demonstrate the presence of Ca(II)‐induced exchange processes in functionally relevant motifs of calgranulin C that are not present in the apo form.
FIGURE 2.
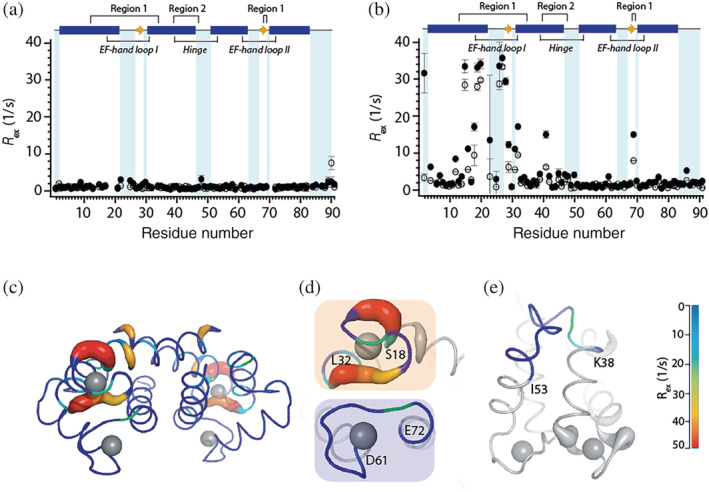
Residue‐specific R ex contributions to 15N R 2 rates from CPMG relaxation dispersion experiments at 11.7 T (hollow circles) and 18.8 T (filled circles) for (a) apo and, (b) Ca(II)‐calgranulin C at pH 6.0 and 25°C. The secondary structure of the protein is displayed at the top of the plots: α‐helices (blue bars); β‐sheet (yellow arrow); loop (solid line). (c, d, e) R ex values mapped on the crystal structure of Ca(II)‐calgranulin C (PDB code: 1GQM) with (d) showing only the EF‐I and II loops and (e) showing the hinge region. Gray spheres represent Ca(II). Region 1 includes residues 12–34 and 68, 69; region 2 includes residues 39–47
Structurally coupled residues are expected to belong to the same dynamic hotspots. Hence, the exchange parameters such as the populations of the major (pA) and minor (pB) states and the rate of chemical exchange, k ex, should be similar. Two strategies were employed to identify the residues that undergo the same dynamics process and therefore, can be clustered together for global fit analysis. In a two‐site exchange model, , the forward and backward rates (k a and k b, respectively with k ex = k a + k b) are related to the exchange rates by: k a = pB*k ex and k b = pA*k ex. In our first approach, log(k b) versus log(k a) obtained from individual fits to the dispersion curves were plotted (Figure 3). Two clusters can be clearly identified. The exchange processes associated with residues in EF‐I loop show clear correlation and are distinct from residues in the hinge region. This suggests EF‐I loop undergo concerted motions in ms‐timescale which are different from the hinge. Additionally, V68 and D69, belonging to EF‐II loop also undergo similar dynamic processes as the EF‐I loop. While isolated from EF‐I loop based on their primary sequence, V68 and D69 might undergo synchronous motions with the EF‐I loop due to their spatial proximity (vide infra). Based on this hypothesis, two regions with distinct dynamic process were identified: residues 12–34 (and including V68 and D69) and residues 39–47 (belonging to the hinge region). We note that few outliers that do not fall in these two clusters were identified. For example, H23 and F14 fall in the region of the plot with residues from the hinge region and Y17 is isolated from the two clusters. In our second approach, global fits using the two site‐exchange model were performed by setting the same k ex and pA values for: (1) all of the residues that exhibit R ex; (2) for residues 12–34 and 68, 69 and; (3) residues 39–47 of the hinge region. When all the residues were considered for a global analysis, the fits to the dispersion curves of many residues clearly did not agree well with the experimental data and the reduced χ 2 value was significantly higher compared to considering the two regions as in (2) and (3) separately.
FIGURE 3.
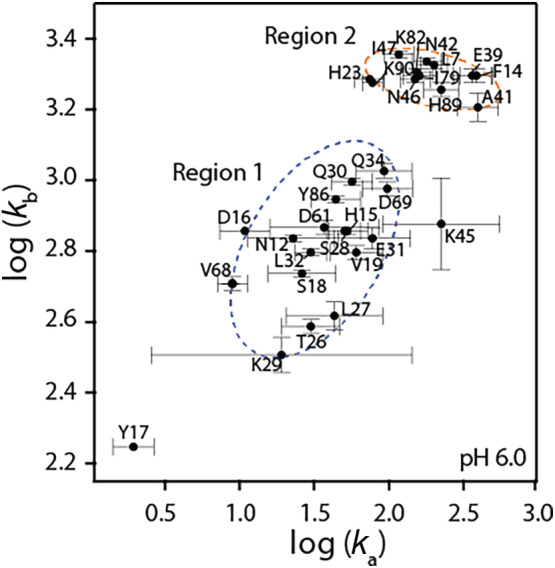
Plot of logarithm of forward (k a) and backward (k b) rates from individual residue fits showing two separate exchange processes (dashed circles)
Based on the above analyses, we deduce that calcium binding induces different dynamics in two regions: the EF‐I loop (along with V68 and D69) and the hinge region. Global least‐square fitting was performed for residues 12–34, and 68, 69 cluster (region 1) and the hinge region cluster (region 2) separately. Site‐specific dispersion curves were fit to the two‐site exchange model by assuming the same k ex and pA parameters for each region. The reduced χ 2 values for the global analysis were similar to those obtained from the individual residue fits suggesting that the goodness of the fits was not compromised by clustering the residues together (Table S2). Dispersion trajectories and representative fits to some residues in region 1 are shown in Figure 4. This global fitting yielded k ex = 680 ± 20 s−1 and pA = 93.8 ± 5% for region 1 and k ex = 850 ± 10 s−1 and pA = 98.2 ± 3.5% for region 2. We note that the observed conformational exchange cannot arise from Ca(II) on/off processes. K d for the EF‐I loop is ~0.1 mM (based on previously reported studies and our unpublished ITC results). In our experiments, we added 20‐fold excess Ca(II), effectively oversaturating the protein with Ca(II). Additionally, a diffusion limited k on (k A) of 107–108 M−1 s−1 gives a theoretically k ex of ~2,000–20,000 s−1 for a Kd of 0.1 mM. These values are outside the range of the observed k ex values from NMR experiments.
FIGURE 4.
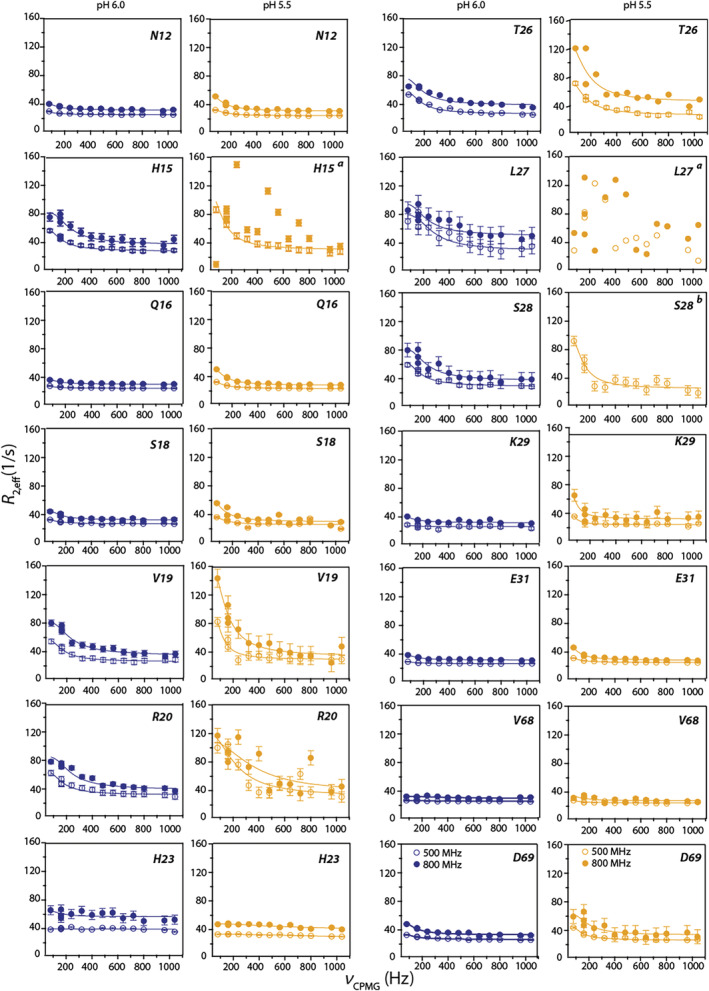
15NH‐CPMG relaxation dispersion curves of representative residues from region 1 at pH 6.0 (blue) and 5.5 (yellow) acquired at 11.7 (hollow circles) and 18.8 T (filled circles) and 25°C. (a) Reliable fits could be obtained due to large fluctuations in data points; (b) resonance was not observed at 18.8 T
2.2. Effect of pH on exchange processes
We have previously reported on pH‐dependence of Zn(II) binding to apo and Ca(II)‐calgranulin C using Co(II) as a surrogate. 20 While Ca(II)‐bound protein can efficiently bind Zn(II) in the pH range of 6.0–9.0, the ability of the protein to sequester Co(II)/Zn(II) dramatically diminishes at pH 5.5. To investigate if the exchange processes observed at pH 6.0 upon Ca(II) binding are correlated to Zn(II) sequestration, CPMG relaxation dispersion experiments were performed for Ca(II)‐loaded protein at pH 5.5. Individual two‐site model fits to the dispersion trajectories indicate large R ex values of ca. 80 s−1 for residues in the EF‐I loop and up to 20 s−1 for residues in the hinge region (Figure 5). Similar to pH 6.0, motions were observed for residues 68 and 69 of EF‐II. Lastly, several residues at the C‐terminal end of the protein (such as 73–76, 83, 86, 88, 89) also exhibited small but considerable R ex values of >3 s−1.
FIGURE 5.
Residue‐specific R ex contributions to 15N R 2 at 11.7 T (hollow circles) and 18.8 T (filled circles) for Ca(II)‐calgranulin C at pH 5.5. R ex values were determined as described in Figure 2
A procedure similar to the pH 6.0 sample was employed to identify residues that undergo same dynamic processes. Analysis showed that the residues in the EF‐I loop, along with V68 and D69 undergo concerted exchange processes. Cluster fits performed in this region (residues 12–32;68–69) yielded k ex = 725 ± 32 s−1 and pA = 63.8 ± 7%. Representative fits to the dispersion trajectories of some key residues are presented in Figure 4. Remarkably, within the error of the curve fittings, k ex for region 1 remains the same at the two pH conditions. More surprisingly, lowering the pH by 0.5 units reduced the population of the major species from 94% (pH 6.0) to 63.8% (pH 5.5).
2.3. Temperature effects
CPMG relaxation dispersion experiments were conducted for Ca(II)‐calgranulin C at 15°C, 25°C and 37°C to observe the temperature dependencies of the exchange processes at pH 6.0. ln(K) vs 1/RT Van't Hoff plots yield the expected linear relationship for regions 1 and 2 while allowing for the determination of enthalpy and entropy of these dynamics processes (Figure 6). ΔH > 0 for exchange processes in both regions but the magnitude of enthalpic contributions to these two processes vary significantly, demonstrating the distinction between them.
FIGURE 6.
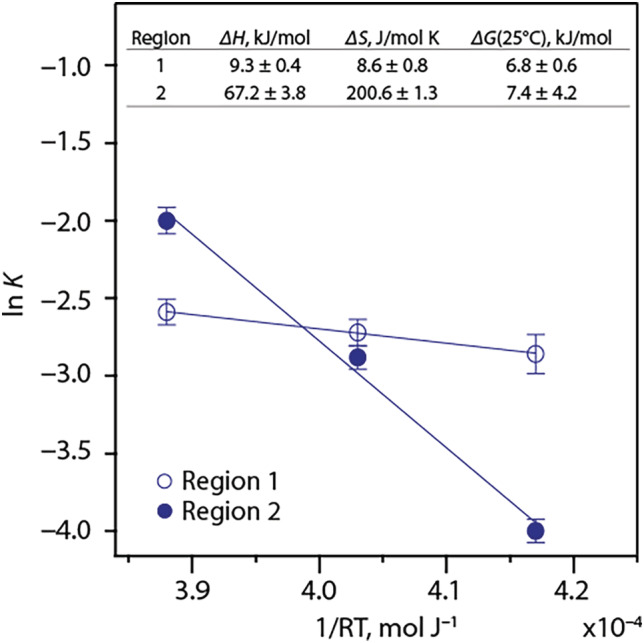
Van't Hoff plots showing temperature dependences of exchange processes in regions 1 and 2 with the calculated thermodynamics parameters in the inset
2.4. Conformational exchange in histidine sidechains
Out of the six histidines in the sequence, H15, H85, amd H89 bind Zn(II), and H23 belongs to the EF‐I loop. We have previously reported site‐specific histidine sidechain resonance assignments and their tautomer forms in Ca(II)‐calgranulin C. 20 Here, exchange parameters for histidine sidechains were measured with 13Cε1 CPMG relaxation experiments at 11.7 and 18.8 T. While the flat dispersion curves of H85, H87 and H89 are consistent with the lack of exchange processes, νcpmg‐dependent curves of H6 and H15 confirm the presence of R ex contributions. The downward trend in the dispersion curve of H23 suggests R ex contributions but reliable fits could not be obtained due to the exchange between protonated and neutral states. 20 Individual fits yielded: k ex = 291 ± 70 s−1, pA = 0.90 ± 0.21 for H6 and, k ex = 610 ± 29 s−1, pA = 0.95 ± 0.03 for H15 (Figure 7). Similar measurements produced relatively flat dispersion curves for all the histidines in the apo‐protein (Figure S1).
FIGURE 7.
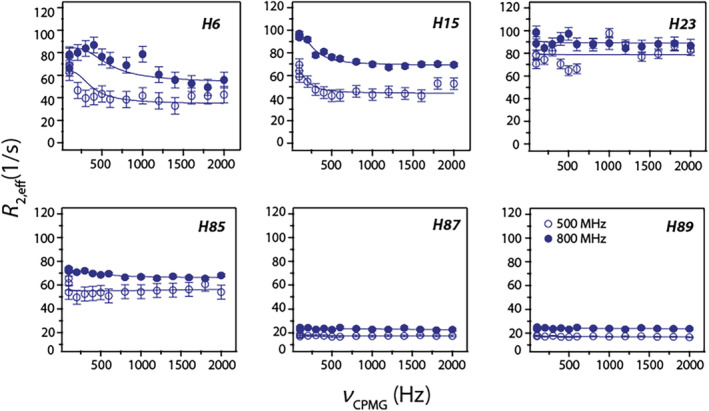
13Cε1 CPMG relaxation dispersion trajectories for histidines in Ca(II)‐calgranulin C at pH 6.0 and 25°C. Experiments were performed at 11.7 T (hollow circles) and 18.8 T (filled circles). Solid lines represent fits to the trajectories using parameters provided in the text
Typically, exchange broadening of the imidazole resonances is a function of multi‐state equilibrium between protonated, neutral state tautomers (Nδ1‐H and Nε2‐H) and the corresponding rotamers. 34 The rotamer flipping is on a ps‐ns timescale and may be ignored unless restricted. Previous studies at pH 6.0 showed that His15, His87, and His89 are fully protonated in both apo and Ca(II) state, while His6 is present as Nε2‐H tautomer. A fully charged His15 sidechain at pH 6.0 precludes the ionic or tautomeric equilibrium as the origin of the minor conformer. This conclusion is further corroborated by the small ΔG ~ 7 kcal mol−1 calculated from the Van't Hoff plot representing backbone exchange processes (Figure 6) compared to the Gibbs free energy change for sidechain protonation ~34 kJ mol−1 at 25°C assuming a pKa of 6.0.
2.5. Coupled dynamics in the EF‐I and EF‐II loops triggered by Ca(II) binding
Being flexible, EF loops are expected to undergo motions in various time regimes. On the ms‐timescale our data show both the EF loops are relatively rigid in the apo‐protein but sample multiple conformations in the Ca(II) saturated state (Figure 2a,b). The dynamic exchange phenomenon is especially pronounced in the non‐canonical EF‐I loop, and the hinge region compared to the EF‐II loop. EF‐II loop did not exhibit exchange‐related line broadening, except for V68 and D69. In particular, the dispersion curve of D69 shows clear evidence of decay, indicative of dynamic processes suppressed by the rapid pulsing during the CPMG experiments (Figure 4). Furthermore, global fit of the exchange parameters suggests both loops sense a single dynamic event triggered by Ca(II) binding. The crystal structure of apo‐protein reveals a short antiparallel β‐sheet structure between EF‐I and EF‐II loop residues (Figure 8a,b). This observation is consistent with secondary structure propensities determined using NMR chemical shifts. 32 Upon Ca(II) binding, the β‐strand propensity of EF‐II residues is weakened but they continue to interact with the EF‐I loop as confirmed by NMR and X‐ray. 14 , 15 Unlike the limited mobility afforded by the inter‐strand H‐bonding interactions detected in the apo‐protein, the loss of secondary structure when Ca(II) is coordinated favors a more dynamic coupling between the loops.
FIGURE 8.
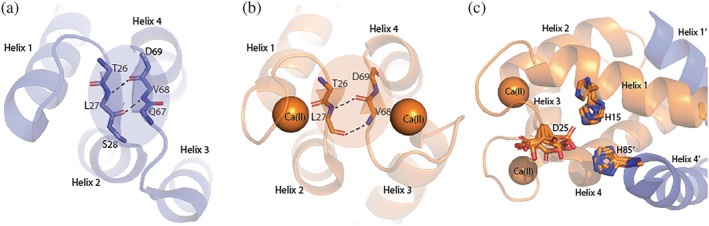
Crystal structures of (a) apo (PDB: 2WCF) and (b) Ca(II)‐protein (PDB: 1E8A) showing the interaction between the two EF loops with the backbones of β‐strand forming residues shown as sticks. (c) Sidechain fluctuations in the His3Asp motif for all 12 chains in the crystal structure of Ca(II)‐protein (PDB: 1GQM)
Results of CPMG experiments are consistent with pH‐dependent shift in “major” and “minor” state populations of region 1 supported by sidechain and backbone motions (vide supra). Interestingly, some evidence for the conformational equilibrium can also be found in the crystal structures of calgranulin C. The unit cell of Ca(II)‐calgranulin C (PDB code 1GQM) 17 contains 12 chains. Backbone superposition of these subunits revealed significant differences in the alignments of Zn(II) ligating sidechains (Figure 8c). Most chains (except one) favor H15 oriented “inwards” facing the location of bound Zn(II) ion. D25 samples relatively large distance fluctuations from H15Nε2 atom (3.4–8.1 Å, D25Oδ2) and χ 1‐angle distribution. H85 is immobile with small χ 1 fluctuations, and the coordinates for H89 belonging to disordered C‐terminal end 15 were absent in this structure. These structural variations are observed exclusively in the EF‐I loop but entirely quenched in the EF‐II loop, which adopts a single conformation in the crystal structure, consistent with our NMR data. These conformations may represent the internal dynamics that likely alter the His3Asp motif.
2.6. Nanosecond versus μs‐ms dynamics
To explore the molecular origins of motions observed with NMR and provide a mechanistic explanation for the dependence of dynamics on pH, classical MD simulations of dimeric calgranulin C were performed at pH 6.0 and 5.5. Our investigation focused primarily on the Ca(II)‐bound system (PDB: 1GQM, 17 Figure 9a). Root mean square fluctuation profiles of Ca(II)‐calgranulin are comparable across pHs (Figure 9b), although they differ markedly from that of the apo‐protein (Figure S2), which exists in a different conformational state (PDB 2WCF 16 ). Consistent with NMR, key changes in backbone dynamics upon calcium binding are attributed to the EF‐I/II loops and the hinge region; however, NMR and MD data show opposite trends in the motion of EF loops upon Ca(II) binding. During MD simulations, the apo‐protein exhibits large fluctuations in both Ca(II)‐binding loops, but these are markedly reduced in the presence of bound calcium ion. In contrast, the hinge domain of the apo‐protein shows limited mobility, but becomes more flexible in the Ca(II)‐bound state. Considering that NMR and MD access complementary timescale information, the consensus results indicate that while the hinge region becomes more flexible across the nanosecond and μs‐ms regimes upon Ca(II) binding, increased mobility of the EF loops results from enhanced μs‐ms motions despite damped nanosecond fluctuations.
FIGURE 9.
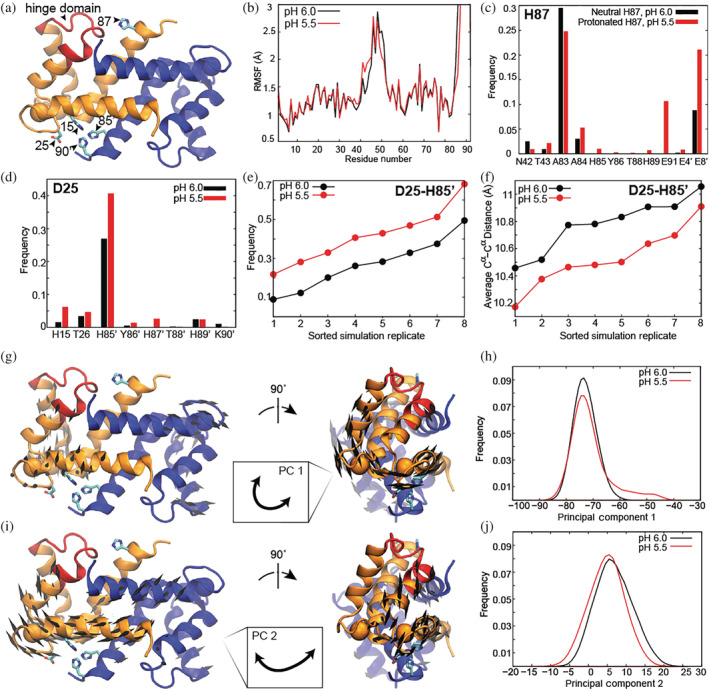
(a) Ca(II)‐calgranulin C; residues shown in red comprise the hinge region and residues in the blue monomer are referred to as X'. (b) Root mean square fluctuations. Frequency of hydrogen bond/salt bridge interactions for (c) H87, (d) D25. (e) Frequency of D25‐H85′ salt bridge and (f) average D25 Cα–H85' Cα distance for each simulation replicate. (g) Porcupine plot and (h) distribution of simulation conformers along PC1. (i) Porcupine plot and (j) distribution of simulation conformers along PC2. Porcupine plot arrows indicate the directions of fluctuations, and arrows <2 Å in length are omitted for visual clarity. In PC1, increasing values along the coordinate correlate with pressing of V68 and D69 of EF‐II toward the EF‐I loop. In PC2, increasing values along the coordinate correlate with pushing D25 away from H85′
2.7. Role of H87 in pH‐dependent dynamics
Importantly, the difference between the pH 6.0 and 5.5 simulation models is the presence of neutral versus protonated H87, respectively. H87 was the only histidine residue to show a significant change in the probability to be protonated (0.75 at pH 6.0 versus 1.0 at pH 5.5) based on local pKa predictions 35 using the 12 conformations extracted from the Ca(II)‐bound crystal structure. 17 Results from eight independent simulations of Ca(II)‐calgranulin at each pH, encompassing 4‐μs of cumulative sampling per system, reveal changes in the interactions of H87 depending on its protonation state. While H87 is observed to contact residues within the hinge region and its parent helix at both pHs, protonated H87 can form a salt bridge with E91 and interacts more frequently with E8 within helix I of the second monomer (Figure 9c). This H87‐E91 salt bridge is detrimental to Zn(II) binding, as it can remove H89 from the metal coordination sphere.
Remarkably, these local structural and dynamical changes are also propagated to the Zn(II)‐coordinating residues in the distal binding site, across the protein from H87. In particular, D25 and H85' exhibit a higher probability to form a salt bridge when H87 is protonated (Figures 9d). This trend was consistent when comparing all eight independent simulations of Ca(II)‐calgranulin at each pH (Figure 9e) and results, at least in part, from D25 and H85' tending to be in closer proximity at pH 5.5, as indicated by the average distance between their Cα atoms (Figure 9f). Because these Zn(II)‐coordinating residues, one from each monomer, are generally closer together at pH 5.5, with a higher propensity for D25‐H85′ to form an intra‐dimer salt bridge, D25 spends more time in a conformation pointing “inwards” toward the Zn(II) site (χ ~ −180° to −150°; Figure S3). Formation of this salt bridge will very likely attenuate Zn(II) binding by reducing the space available to accommodate Zn(II); we refer to this conformation as the “closed” state.
An in‐depth statistical analysis of Zn(II) coordination spheres in protein structures indicates a typical Zn(II)‐aspartate spacing of 2.10 ± 0.24 Å and Zn(II)‐histidine spacing of 2.09 ± 0.14 Å. 36 Modeling the tetrahedral relationship between D25, H85' and bound Zn(II) as an obtuse scalene triangle with an angle of 109.5° and sides of these lengths suggests the need for a distance of 3.42 Å between D25 and H85' for optimal coordination geometry. However, the D25‐H85' salt bridge observed during MD simulations was characterized as having an O‐HN distance within 3.0 Å. On the other hand, Zn(II) binding is expected to be promoted in the absence of a salt bridge when the D25 sidechain is solvent accessible (χ ~ 30° to 90° or χ ~ −90° to −30°; Figure S3). Collectively we refer to these conformations as the “open” state. It is noteworthy that none of the major residue contacts noted here were observed in equivalent simulations of apo‐protein (PDB 2WCF 16 ) at either pH. As the apo‐protein exists in a different conformation, the Zn(II) coordinating residues are not within proximity to form intra‐binding site salt bridges (Figure S4). The only notable contact made by H87 is to the backbone of A84, with a frequency of 0.5 regardless of pH suggesting that, in contrast to the Ca(II)‐bound protein, the fluctuations of the apo state are not modulated by pH.
2.8. Connecting NMR and MD observations
To identify collective atomic fluctuations sampled during MD simulations and filter global, functionally relevant motions from thermal noise, we applied principal component analysis (PCA). The PCA results reveal the lowest frequency, largest amplitude dynamics observed over the cumulative simulation timescale and provide structural insights into the measurements made with NMR for Ca(II)‐loaded calgranulin.
The slowest mode of collective motion detected by MD (principal component 1, PC1) involves a twisting of one monomer against the other (Figure 9g). Focusing on atoms whose modal movements have an amplitude larger than 2.0 Å, PC1's fluctuations particularly involve residues belonging to helix I/III, as well as the EF‐I/EF‐II loops. As illustrated in the porcupine plot in Figure 9g (which uses cones to denote the directions of fluctuations), residues V68 and D69 of EF‐II press into EF‐I, and vice versa, in remarkable agreement with NMR k ex values indicating that these residues undergo a synergistic dynamic process on the ms timescale when Ca(II) is bound. At pH 5.5, when H87 is protonated, calgranulin C is observed to adopt conformers not accessible at pH 6.0, in which the twisting motion is more pronounced and EF‐II residues press more dramatically against the EF‐I loop (Figure 9h, red series reaches further along PC1).
The second slowest mode of collective motion detected by MD (principal component 2, PC2) unveils the significance of H87 dynamics in mediating the accessibility of the distal Zn(II)‐binding site. Focusing on atoms whose modal movements have an amplitude larger than 2.0 Å, PC2's fluctuations particularly involve helix I and the EF‐I/EF‐II loops. As illustrated in the porcupine plot in Figure 9i, PC2 entails a concerted movement of helix I of both monomers, which causes EF‐I/EF‐II to fluctuate back and forth with respect to helix IV′, thus modulating the distance between D25 and H85' Zn(II)‐coordinating residues. Increased spatial distance between D25 and H85' may result in loss of the salt bridge sometimes formed between them and promote an “open” D25 configuration. At pH 5.5, when H87 is protonated, the distribution of conformers along PC2 shifts subtly, such that calgranulin C prefers a state in which these Zn(II)‐coordinating residues are closer together (Figure 9j, red series shifts left). A subtle shift is consistent with the MD observation that the average Cα–Cα distance between D25 and H85' is always lower at pH 5.5, but only by about 0.25 Å (Figure 9f). Closer proximity of D25 and H85' at pH 5.5 explains more frequent formation of the salt bridge (Figure 9d,e) and higher propensity for a “closed” D25 configuration. H87 dynamics couple into to the motion observed in PC2 through contact with E8′ on helix I′, which increases when H87 is protonated (Figure 9c). Thus, H87's pH‐dependent behavior is transmitted to the distal Zn(II) site. NMR R ex values obtained for C‐terminal residues (such as 83, 86, 88 89) at pH 5.5 correlate with our MD‐based observation that protonated H87 samples conformers with altered patterns of interaction with these residues (Figure 9c). To summarize, the PCs from MD simulations reveal the origin of internal motions. The two dynamic modes correctly predict the two major trends inferred from the experimental metal binding and NMR data: the coupled motions between the two Ca(II)‐binding loops and pH‐dependent changes within the Zn(II) binding pocket.
2.9. pH driven Zn(II) binding and the correspondence between dynamic sub‐populations in slow and fast timescales
The μs‐ms timescale motions along the EF loops captured by NMR in this study are best fit by two‐site exchange processes. At pH 6.0, the major species represents 94% of the population compared to 64% at pH 5.5. To gain insight into the conformations represented by the two populations, we turn to analysis of side‐chain contacts manifested during the MD simulations. The focus of the analysis will be on the time evolution of the electrostatic interactions involving the charged sidechains H87 and H15, H85', H89', D25 of the His3Asp motif (Figure 9, Figure S4).
In the MD simulations, the pH‐induced shift in the conformational equilibrium is partially captured by the frequency of the D25 rotamer jumps coupled to electrostatic interactions involving D25‐H85' and H87‐E8' charged side‐chains. As seen in the X‐ray structures, the MD simulations demonstrate a broad distribution in D25 χ 1 angles (Figure S3) which flips the side‐chain between the “open” and “closed” configurations. At both pHs, based on the simulations (Figure S3), D25 appears to favor the “open” state conformation (52% at pH 5.5 and 64% at pH 6.0). Typically localized rotamer jumps involving the solvent exposed sidechains have been reported to occur on the nanosecond (<100 ns) timescale 37 ; therefore such rapid motions are unlikely to be observed in the CPMG dispersion experiments unless restricted by steric factors.
In contrast, the coordinated displacement of the EF hand helices with the binding loops, observed in the PCA analysis, clearly represents a more complex energy landscape with potentially slower conformational exchange that is illuminated on the timescale of NMR dispersion experiments. CPMG experiments presumably probe the large amplitude movements of the EF‐I and ‐II loops in PC1. The pH‐dependence of conformational exchange observed by NMR may be correlated to the pH‐sensitivity of PC1 and PC2. At pH 6.0 the major and minor states can be distinguished by transient contacts between helix IV and helix I′ via H87‐E4′ and H87‐E8′ (9%, Figure 9c). This minor state introduces closer contact between D25 and H85′ along PC2 and may render the coordination site unamenable to Zn(II) binding. At pH 5.5, when H87 is fully protonated, this fraction of minor states increases, with more frequent contact of H87‐E8′ (22%). Additionally, the formation of a H87‐E91 salt bridge is observed in 11% of conformations, which can remove H89 from the coordination sphere. Together, these sub‐populations presumably contribute to a continuum of minor state conformations (33%) with weakened Zn(II) affinity. The experimental data for residues L7, H89, and H90 (Figure 3) validate the dynamic coupling between helix IV and helix I′. Interestingly, the simulations capture additional contacts between helix IV (H87) and the hinge region (N42‐T43) observed in the group fit of dispersion data for residues in region 2. Furthermore, the conformations with weakened Zn(II) binding predicted by MD (9% at pH 6.0; 33% at pH 5.5) are in remarkable agreement with the minor exchange conformations observed in NMR (6% at pH 6.0; 36% at pH 5.5), suggesting that the dispersion experiments may be probing a continuum of sub‐populations consistent with those sampled during simulations.
To summarize, the MD simulations suggest that the hub of interactions anchored by the charged C‐terminal end of helix IV plays an important role in mediating the pH‐dependent dynamic remodeling of the Zn(II) coordination site and tuning the metal‐binding affinity. Further support for this proposal also comes from our previous study that showed ca. 35% loss in Zn(II) binding to Ca(II)‐calgranulin C as the pH was reduced from 6.0 to 5.5. 20 Collectively, previous pH‐dependent metal binding studies and current results show that the exchange process triggered upon Ca(II) binding to EF‐I loop facilitate Zn(II) binding and point to the significance of internal dynamics in modulating the metal affinity. We propose that Ca(II)‐induced pH‐dependent exchange processes in the EF‐I loop monitored by NMR dispersion experiments modulate Zn(II)‐binding conformational ensemble in calgranulin C thereby regulating its Zn(II) sequestration mediated antimicrobial functions. Such pH‐dependent regulation of conformational subspace may represent a prevailing mechanism amongst other human calgranulins (such as calgranulin A/B) via which these proteins regulate metal sequestration.
3. CONCLUSIONS
The details of the conformational landscape mapped by the experimental NMR data and the internal dynamics predicted by the MD simulations offer a powerful approach to study the mechanism of the modulation of Zn(II) chelation by calcium and pH‐driven Zn(II) affinity. Along with other examples, 38 , 39 , 40 this study illustrates the two approaches are complementary and offers valuable insight into the functionally relevant minor conformations that cannot be observed directly by traditional structural biology tools. It is worth pointing out that the breadth of the energy landscape explored by spin relaxation measurements (ps‐ns, μs‐ms) exceeds the finite length of typical MD simulations (ns‐μs). Thus, the comparison of the Boltzmann distribution of populations probed by these two methodologies may be qualitative at best and lays the groundwork for future experiments to confirm the validity of the results presented in this study.
Non‐canonical EF‐I loops in antimicrobial S100 proteins such as calgranulin C are unique to this class of proteins. While Ca(II) binding is known to facilitate Zn(II) binding, the results reported herein demonstrate that this modulation may take place via Ca(II)‐induced synergistic motions in ns‐ms timescale and executed by the EF‐I loop and the hinge region at the His3Asp motif. Dynamic processes regulate the population of Zn(II) binding state, promoting a relatively higher concentration of viable Zn(II) binding conformation at pH 6.0 compared to pH 5.5. Taken together, these studies unravel the unique role of the EF‐I loop toward metal sequestration by calgranulin C and may indicate similar dynamic regulation in other related antimicrobial proteins.
4. MATERIALS AND METHODS
4.1. Sample preparation
15N or 13C, 15N uniformly labeled human calgranulin C was overexpressed in E. coli purified as described previously. 32 The samples for NMR measurements were concentrated to 0.9 mM in 20 mM HEPES and 20 mM MES 150 mM NaCl, 10% (v/v) D2O. For the calcium‐bound sample, 20 equivalent Ca(II) was added to the protein and the Ca(II)‐ loaded state was validated by the NMR 1H, 15N‐HSQC spectrum to ensure no resonances originating from the apo state were observed.
4.2. NMR spectroscopy
All NMR experiments were performed on Bruker 500 MHz Ultrashield and 800 MHz US2 spectrometers equipped with 5 mm TXI and 5 mm TCI CryoProbe respectively. CPMG relaxation dispersion NMR measurements 27 , 41 , 42 for 15NH and 13Cε1 nuclei were performed at 11.7 and 18.8 T. 15N relaxation dispersion experiments were conducted on apo calgranulin C at pH 6.0 (25°C), Ca(II)‐calgranulin C at pH 6.0 (15, 25 and 37°C) and Ca(II)‐calgranulin C at pH 5.5 (25°C). 13C spectra were collected at 25°C. Measurements were performed using a constant time, relaxation‐compensated pulse sequence, 43 which employed 1H continuous spin‐lock field during CPMG π‐pulse period, as developed by Kay and co‐workers. 44 CPMG frequency, υCPMG, was determined based on the spacing between the successive π‐pulses (2τCP) and the π‐pulse length (t180), applied during the CPMG pulse period (T relax) using the relationship: υ CPMG = 1/[2(2τ CP + t 180)]. Experimental parameters yielded υCPMG values of 80, 160, 240, 320, 400, 480, 560, 640, 720, 800, 960, 1,040 Hz and 100, 200, 300, 400, 500, 600, 800, 1,000, 1,200, 1,400, 1,600, 1,800, 2,000 Hz for 15N and 13C measurements, respectively. An equilibrium delay of 1 and 20 ms for 15N and 13C, respectively, was applied before and after water alignment sequence. Spectra for one υCPMG value were acquired in triplicates along with a control experiment with Trelax = 0. Transverse relaxation rate, R 2,eff, was calculated based on the following equation/formula.
where T relax = 25 and 20 ms for 15N and 13C, respectively; I(ν CPMG) denotes the peak intensity for the spectrum acquired at υ CPMG and I 0 is the peak intensity of reference sample with T relax = 0.
R ex = R 2,eff (ν CPMG = 0) − R 2,eff (ν CPMG = ∞ or 1,040 Hz).
4.3. NMR data processing and analysis
All NMR spectra were processed with NMRpipe. 45 Peak intensities were utilized to calculate R 2,eff values as described above. Uncertainties in R 2,eff values were estimated by calculating the standard deviation in the peak intensities from the spectra recorded in triplicates. If the estimated uncertainties were below 2%, a minimum value of 2% was assumed for simulations of the experimental data. Residue‐specific R 2,eff values were plotted against υCPMG to obtain decay trajectories, which were subsequently fitted to the Carver‐Richards two‐site exchange model or an approximated expression to this two site exchange in fast regime. 33 , 46 This model allows for the correlation between R 2,eff and exchange rates and/or relative populations of the two sites as described in detail several reviews in the literature. 47 , 48 , 49 , 50 Numerical simulations by simultaneously fitting the decay curves acquired at two magnetic fields were performed by recently released RING NMR Dynamics software for both slow and fast exchange regime expressions. 51 These calculations generated several parameters: the exchange rate (k ex, s−1), absolute value of differences of chemical shift between two states (|Δω|), proportion of major state (pA) and the R 2 value at both magnetic fields. The software performs individual fit as well as the global fit and reports AIC and χ 2 values. The goodness of the fits was determined based on visual inspection and acceptable χ 2 values (1–10) and AIC values.
4.4. Molecular modeling
All‐atom models of calgranulin C homodimers were prepared based on PDBs 1GQM 17 (calcium‐bound, chains G and H) and 2WCF 16 (calcium‐free, chains A and B). Unresolved C‐terminal residues were reconstructed using the Chimera 52 Model Loops interface to MODELLER 53 and selecting the candidate structure with the lowest DOPE 54 score. Protonation states of titratable residues were assigned using PDB 2PQR 35 to produce versions of both calcium‐bound and calcium‐free systems at pHs of 6.0 and 5.5. The protonation states assigned for all histidines are summarized in Table S3. The key difference in the calcium‐bound systems at pH 6.0 and 5.5 was a single hydrogen (3,003 versus 3,004 protein atoms), such that H87 is neutral in the former, yet protonated in the latter, in one monomer. The case of a neutral H87 was explored due to the statistics of pKa predictions 35 on the 12 monomer conformations captured in the 1GQM crystal structure, 17 which suggested a 0.25 chance for H87 to be deprotonated (three out of 12) at pH 6.0. Examining this difference in only one monomer allowed us to note its effect on both distal and proximal zinc binding sites. The predicted protonation of all other histidines based on the experimental structures was consistent for both pHs. As such, the calcium‐free systems were assigned the same histidine protonation pattern. The four systems were immersed in cubic boxes of explicit water with a buffer width of 15 Å, adding sodium and chloride counterions to achieve neutrality. Final systems encompassed 85,341 atoms and 84,290 atoms for calcium‐bound systems at pH 6.0 and 5.5, respectively, and 46,066 atoms for calcium‐free systems, in which the dimer exhibits a different, more compact conformation. The protein portion of the systems were parameterized with the AMBER ff14SB 55 force field, and water molecules were treated as TIP3P. 56 Bound calcium ions used a multisite model 57 to maintain protein coordination.
4.5. Molecular dynamics simulations
Molecular dynamics (MD) simulations were performed with pmemd.cuda 58 from AMBER18. 59 Following potential energy minimization, the systems were heated to 310 K over 5 ns. Eight independent simulations were spawned for each system using different random seeds for velocity initialization. Production simulations were carried out for 500 ns to achieve total cumulative sampling of 4 μs for each system. Simulations were performed with a timestep of 2.0 fs and sampled the isothermal‐isobaric ensemble, using the Langevin thermostat (collision frequency of 5 ps−1) for temperature regulation at 310 K and the Berendsen barostat (relaxation time of 5 ps) for pressure regulation at 1.0 bar. Electrostatic interactions were calculated with particle‐mesh Ewald beyond a nonbonded cutoff of 8.0 Å, and bonds to hydrogens were constrained with the SHAKE algorithm. Frames were saved every 1 ps, producing 500,000 conformers per independent simulation. Principal component analysis (PCA) was performed on a combined dataset encompassing the Cα trace of the calcium‐bound system at both pH 6.0 and 5.5, using an R implementation as described previously. 60 PCA modes were visualized with NMWiz 61 in VMD. 62 Hydrogen bonds and salt bridges were measured using cpptraj. 63 Root mean square fluctuations (RMSF), χ angle distributions, and average interatomic distances were calculated using VMD. Interaction frequencies were calculated out of 4 million total conformers, or 0.5 million conformers per independent simulation. Computational results refer to protein residues according to the standard calgranulin C numbering scheme, which is downshifted by one relative to the numbering in PDB 1GQM. 17
AUTHOR CONTRIBUTIONS
Qian Wang: Conceptualization (equal); data curation (equal); formal analysis (equal). Deniz Kuci: Data curation (supporting); formal analysis (supporting). Shibani bhattacharya: Conceptualization (supporting); data curation (supporting); formal analysis (equal); writing – original draft (lead); writing – review and editing (lead). Jodi A. Hadden‐Perilla: Conceptualization (equal); data curation (lead); formal analysis (lead); writing – original draft (lead); writing – review and editing (lead). Rupal Gupta: Conceptualization (lead); formal analysis (equal); funding acquisition (lead); investigation (lead); writing – original draft (equal); writing – review and editing (equal).
Supporting information
Appendix S1 Supporting Information
ACKNOWLEDGMENTS
This work was supported by the National Institutes of Health (GM131338) and CUNY Junior Faculty Research Award funded by the Alfred P. Sloan Foundation to Rupal Gupta. NMR data presented herein were collected at the New York Structural Biology Institute (NYSBC). This work was performed in collaboration with the Center on Macromolecular Dynamics by NMR Spectroscopy (CoMD/NMR) at the NYSBC and supported by the U.S. National Institutes of Health (P41 GM118302). Implementation and testing of multisite calcium ion parameters for MD simulations was supported by the National Institutes of Health (P20‐GM‐104316). The authors acknowledge technical contributions to the computational work from Rasanjali L. Ranawaka and assistance with NMR sample preparation from Tassadite Dahmane.
Wang Q, Kuci D, Bhattacharya S, Hadden‐Perilla JA, Gupta R. Dynamic regulation of Zn(II) sequestration by calgranulin C. Protein Science. 2022;31(9):e4403. 10.1002/pro.4403
Review editor: Carol Beth Post
Funding information Alfred P. Sloan Foundation; National Institute of General Medical Sciences, Grant/Award Numbers: GM131338, P20‐GM‐104316, P41 GM118302
Contributor Information
Shibani Bhattacharya, Email: sbhattacharya@nysbc.org.
Jodi A. Hadden‐Perilla, Email: jhadden@udel.edu.
Rupal Gupta, Email: rupal.gupta@csi.cuny.edu.
REFERENCES
- 1. Hood MI, Skaar EP. Nutritional immunity: Transition metals at the pathogen–host interface. Nat Rev Microbiol. 2012;10:525–537. [DOI] [PMC free article] [PubMed] [Google Scholar]
- 2. Kehl‐Fie TE, Skaar EP. Nutritional immunity beyond iron: A role for manganese and zinc. Curr Opin Chem Biol. 2010;14:218–224. [DOI] [PMC free article] [PubMed] [Google Scholar]
- 3. Weinberg ED. Nutritional immunity: Host's attempt to withhold iron from microbial invaders. JAMA. 1975;231:39–41. [DOI] [PubMed] [Google Scholar]
- 4. Damo SM, Kehl‐Fie TE, Sugitani N, et al. Molecular basis for manganese sequestration by calprotectin and roles in the innate immune response to invading bacterial pathogens. Proc Natl Acad Sci. 2013;110:3841–3846. [DOI] [PMC free article] [PubMed] [Google Scholar]
- 5. Zackular JP, Chazin WJ, Skaar EP. Nutritional immunity: S100 proteins at the host‐pathogen interface. J Biol Chem. 2015;290:18991–18998. [DOI] [PMC free article] [PubMed] [Google Scholar]
- 6. Zygiel EM, Nolan EM. Transition metal sequestration by the host‐defense protein calprotectin. Annu Rev Biochem. 2018;87:621–643. [DOI] [PMC free article] [PubMed] [Google Scholar]
- 7. Bozzi AT, Nolan EM. Avian MRP126 restricts microbial growth through Ca (II)‐dependent Zn (II) sequestration. Biochemistry. 2019;59:802–817. [DOI] [PMC free article] [PubMed] [Google Scholar]
- 8. Nakashige TG, Zygiel EM, Drennan CL, Nolan EM. Nickel sequestration by the host‐defense protein human calprotectin. J Am Chem Soc. 2017;139:8828–8836. [DOI] [PMC free article] [PubMed] [Google Scholar]
- 9. Gottsch JD, Eisinger SW, Liu SH, Scott AL. Calgranulin C has filariacidal and filariastatic activity. Infect Immun. 1999;67:6631–6636. [DOI] [PMC free article] [PubMed] [Google Scholar]
- 10. Moroz O, Antson A, Grist S, et al. Structure of the human S100A12–copper complex: Implications for host‐parasite defence. Acta Crystallogr Sect D Biol Crystallogr. 2003;59:859–867. [DOI] [PubMed] [Google Scholar]
- 11. Brophy MB, Hayden JA, Nolan EM. Calcium ion gradients modulate the zinc affinity and antibacterial activity of human calprotectin. J Am Chem Soc. 2012;134:18089–18100. [DOI] [PMC free article] [PubMed] [Google Scholar]
- 12. Cunden LS, Gaillard A, Nolan EM. Calcium ions tune the zinc‐sequestering properties and antimicrobial activity of human S100A12. Chem Sci. 2016;7:1338–1348. [DOI] [PMC free article] [PubMed] [Google Scholar]
- 13. Hayden JA, Brophy MB, Cunden LS, Nolan EM. High‐affinity manganese coordination by human calprotectin is calcium‐dependent and requires the histidine‐rich site formed at the dimer interface. J Am Chem Soc. 2013;135:775–787. [DOI] [PMC free article] [PubMed] [Google Scholar]
- 14. Moroz OV, Antson AA, Murshudov GN, et al. The three‐dimensional structure of human S100A12. Acta Crystallogr Sect D Biol Crystallogr. 2001;57:20–29. [DOI] [PubMed] [Google Scholar]
- 15. Hung K‐W, Hsu C‐C, Yu C. Solution structure of human Ca 2+‐bound S100A12. J Biomol NMR. 2013;57:313–318. [DOI] [PubMed] [Google Scholar]
- 16. Moroz OV, Blagova EV, Wilkinson AJ, Wilson KS, Bronstein IB. The crystal structures of human S100A12 in apo form and in complex with zinc: New insights into S100A12 oligomerisation. J Mol Biol. 2009;391:536–551. [DOI] [PubMed] [Google Scholar]
- 17. Moroz O, Antson A, Dodson E, et al. The structure of S100A12 in a hexameric form and its proposed role in receptor signalling. Acta Crystallogr Sect D: Biol Crystallogr. 2002;58:407–413. [DOI] [PubMed] [Google Scholar]
- 18. Zhou Y, Yang W, Kirberger M, Lee HW, Ayalasomayajula G, Yang JJ. Prediction of EF‐hand calcium‐binding proteins and analysis of bacterial EF‐hand proteins. Prot Struct Funct Bioinform. 2006;65:643–655. [DOI] [PubMed] [Google Scholar]
- 19. Pietzsch J, Hoppmann S. Human S100A12: A novel key player in inflammation? Amino Acids. 2009;36:381–389. [DOI] [PubMed] [Google Scholar]
- 20. Wang Q, Aleshintsev A, Jose AN, Aramini JM, Gupta R. Calcium regulates S100A12 zinc sequestration by limiting structural variations. Chembiochem. 2020;21:1372–1382. [DOI] [PMC free article] [PubMed] [Google Scholar]
- 21. Rosen T, Nolan EM. Metal sequestration and antimicrobial activity of human calprotectin are pH‐dependent. Biochemistry. 2020;59:2468–2478. [DOI] [PMC free article] [PubMed] [Google Scholar]
- 22. Trevani AS, Andonegui G, Giordano M, et al. Extracellular acidification induces human neutrophil activation. J Immunol. 1999;162:4849–4857. [PubMed] [Google Scholar]
- 23. Boehr DD, McElheny D, Dyson HJ, Wright PE. The dynamic energy landscape of dihydrofolate reductase catalysis. Science. 2006;313:1638–1642. [DOI] [PubMed] [Google Scholar]
- 24. Mittermaier A, Kay LE. New tools provide new insights in NMR studies of protein dynamics. Science. 2006;312:224–228. [DOI] [PubMed] [Google Scholar]
- 25. Akke M, Skelton NJ, Kordel J, Palmer AG III, Chazin WJ. Effects of ion binding on the backbone dynamics of calbindin D9k determined by nitrogen‐15 NMR relaxation. Biochemistry. 1993;32:9832–9844. [DOI] [PubMed] [Google Scholar]
- 26. Korzhnev DM, Kay LE. Probing invisible, low‐populated states of protein molecules by relaxation dispersion NMR spectroscopy: An application to protein folding. Acc Chem Res. 2008;41:442–451. [DOI] [PubMed] [Google Scholar]
- 27. Baldwin AJ, Kay LE. NMR spectroscopy brings invisible protein states into focus. Nat Chem Biol. 2009;5:808–814. [DOI] [PubMed] [Google Scholar]
- 28. Marlow MS, Dogan J, Frederick KK, Valentine KG, Wand AJ. The role of conformational entropy in molecular recognition by calmodulin. Nat Chem Biol. 2010;6:352–358. [DOI] [PMC free article] [PubMed] [Google Scholar]
- 29. Lee AL, Wand AJ. Microscopic origins of entropy, heat capacity and the glass transition in proteins. Nature. 2001;411:501–504. [DOI] [PubMed] [Google Scholar]
- 30. Yang D, Kay LE. Contributions to conformational entropy arising from bond vector fluctuations measured from NMR‐derived order parameters: Application to protein folding. J Mol Biol. 1996;263:369–382. [DOI] [PubMed] [Google Scholar]
- 31. Yang D, Mok Y‐K, Forman‐Kay JD, Farrow NA, Kay LE. Contributions to protein entropy and heat capacity from bond vector motions measured by NMR spin relaxation. J Mol Biol. 1997;272:790–804. [DOI] [PubMed] [Google Scholar]
- 32. Wang Q, Aleshintsev A, Bolton D, Zhuang J, Brenowitz M, Gupta R. Ca (II) and Zn (II) cooperate to modulate the structure and self‐assembly of S100A12. Biochemistry. 2019;58:2269–2281. [DOI] [PMC free article] [PubMed] [Google Scholar]
- 33. Carver J, Richards R. A general two‐site solution for the chemical exchange produced dependence of T2 upon the Carr‐Purcell pulse separation. J Magn Reson (1969). 1972;6:89–105. [Google Scholar]
- 34. Hass MA, Hansen DF, Christensen HE, Led JJ, Kay LE. Characterization of conformational exchange of a histidine side chain: Protonation, rotamerization, and tautomerization of His61 in plastocyanin from Anabaena variabilis. J Am Chem Soc. 2008;130:8460–8470. [DOI] [PubMed] [Google Scholar]
- 35. Dolinsky TJ, Czodrowski P, Li H, et al. PDB2PQR: Expanding and upgrading automated preparation of biomolecular structures for molecular simulations. Nucleic Acids Res. 2007;35:522–525. [DOI] [PMC free article] [PubMed] [Google Scholar]
- 36. Laitaoja M, Valjakka J, Jänis J. Zinc coordination spheres in protein structures. Inorg Chem. 2013;52:10983–10991. [DOI] [PubMed] [Google Scholar]
- 37. Scouras AD, Daggett V. The dynameomics rotamer library: Amino acid side chain conformations and dynamics from comprehensive molecular dynamics simulations in water. Protein Sci. 2011;20:341–352. [DOI] [PMC free article] [PubMed] [Google Scholar]
- 38. Martin JA, Robustelli P, Palmer AG. Quantifying the relationship between conformational dynamics and enzymatic activity in ribonuclease HI homologues. Biochemistry. 2020;59:3201–3205. [DOI] [PMC free article] [PubMed] [Google Scholar]
- 39. Vallurupalli P, Chakrabarti N, Pomès R, Kay LE. Atomistic picture of conformational exchange in a T4 lysozyme cavity mutant: An experiment‐guided molecular dynamics study. Chem Sci. 2016;7:3602–3613. [DOI] [PMC free article] [PubMed] [Google Scholar]
- 40. Trbovic N, Kim B, Friesner RA, Palmer AG III. Structural analysis of protein dynamics by MD simulations and NMR spin‐relaxation. Prot Struct Funct Bioinf. 2008;71:684–694. [DOI] [PMC free article] [PubMed] [Google Scholar]
- 41. Henzler‐Wildman K, Kern D. Dynamic personalities of proteins. Nature. 2007;450:964–972. [DOI] [PubMed] [Google Scholar]
- 42. Palmer AG III. NMR characterization of the dynamics of biomacromolecules. Chem Rev. 2004;104:3623–3640. [DOI] [PubMed] [Google Scholar]
- 43. Loria JP, Rance M, Palmer AG. A relaxation‐compensated Carr−Purcell−Meiboom−gill sequence for characterizing chemical exchange by NMR spectroscopy. J Am Chem Soc. 1999;121:2331–2332. [Google Scholar]
- 44. Hansen DF, Vallurupalli P, Kay LE. An improved 15N relaxation dispersion experiment for the measurement of millisecond time‐scale dynamics in proteins. J Magn Reson. 2008;112:5898–5904. [DOI] [PubMed] [Google Scholar]
- 45. Delaglio F, Grzesiek S, Vuister GW, Zhu G, Pfeifer J, Bax A. NMRPipe: A multidimensional spectral processing system based on UNIX pipes. J Biomol NMR. 1995;6:277–293. [DOI] [PubMed] [Google Scholar]
- 46. Ishima R, Torchia DA. Estimating the time scale of chemical exchange of proteins from measurements of transverse relaxation rates in solution. J Biomol NMR. 1999;14:369–372. [DOI] [PubMed] [Google Scholar]
- 47. Kempf JG, Loria JP. Protein dynamics from solution NMR. Cell Biochem Biophys. 2002;37:187–211. [DOI] [PubMed] [Google Scholar]
- 48. Wang C, Palmer AG III. Solution NMR methods for quantitative identification of chemical exchange in 15N‐labeled proteins. Magn Reson Chem. 2003;41:866–876. [Google Scholar]
- 49. Grutsch S, Brüschweiler S, Tollinger M. NMR methods to study dynamic allostery. PLoS Comp Biol. 2016;12:e1004620. [DOI] [PMC free article] [PubMed] [Google Scholar]
- 50. Kovermann M, Rogne P, Wolf‐Watz M. Protein dynamics and function from solution state NMR spectroscopy. Q Rev Biophys. 2016;49:e6. doi: 10.1017/S0033583516000019 [DOI] [PubMed] [Google Scholar]
- 51. Beckwith MA, Erazo‐Colon T, Johnson BA. RING NMR dynamics: Software for analysis of multiple NMR relaxation experiments. J Biomol NMR. 2021;75:9–23. [DOI] [PMC free article] [PubMed] [Google Scholar]
- 52. Pettersen EF, Goddard TD, Huang CC, et al. UCSF chimera? A visualization system for exploratory research and analysis. J Comput Chem. 2004;25:1605–1612. PMID: 15264254. [DOI] [PubMed] [Google Scholar]
- 53. Yang Z, Lasker K, Schneidman‐Duhovny D, et al. UCSF chimera, MODELLER, and IMP: An integrated modeling system. J Struct Biol. 2012;179:269–278. PMID: 21963794. [DOI] [PMC free article] [PubMed] [Google Scholar]
- 54. Shen MY, Sali A. Statistical potential for assessment and prediction of protein structures. Protein Sci. 2006;15:2507–2524. PMID: 17075131. [DOI] [PMC free article] [PubMed] [Google Scholar]
- 55. Maier JA, Martinez C, Kasavajhala K, Wickstrom L, Hauser KE, Simmerling C. ff14SB: Improving the accuracy of protein side chain and backbone parameters from ff99SB. J Chem Theory Comput. 2015;11:3696–3713. PMID: 26574453. [DOI] [PMC free article] [PubMed] [Google Scholar]
- 56. Jorgensen WL, Chandrasekhar J, Madura JD, Impey RW, Klein ML. Comparison of simple potential functions for simulating liquid water. J Chem Phys. 1983;79:926–935. [Google Scholar]
- 57. Saxena A, Sept D. Multisite ion models that improve coordination and free energy calculations in molecular dynamics simulations. J Chem Theory Comput. 2013;9:3538–3542. [DOI] [PubMed] [Google Scholar]
- 58. Salomon‐Ferrer R, Gotz AW, Poole D, Le Grand S, Walker RC. Routine microsecond molecular dynamics simulations with AMBER on GPUs. 2. Explicit solvent particle mesh Ewald. J Chem Theory Comput. 2013;9:3878–3888. [DOI] [PubMed] [Google Scholar]
- 59. Case D, Ben‐Shalom I, Brozell S, et al. AMBER 18. San Francisco: University of California, 2018. [Google Scholar]
- 60. Perilla JR, Schulten K. Physical properties of the HIV‐1 capsid from all‐atom molecular dynamics simulations. Nat Commun. 2017;8:15959 PMID: 28722007. [DOI] [PMC free article] [PubMed] [Google Scholar]
- 61. Bakan A, Meireles LM, Bahar I. ProDy: Protein dynamics inferred from theory and experiments. Bioinformatics. 2011;27:1575–1577. [DOI] [PMC free article] [PubMed] [Google Scholar]
- 62. Humphrey W, Dalke A, Schulten K. VMD: Visual molecular dynamics. J Mol Graph. 1996;14:33–38. [DOI] [PubMed] [Google Scholar]
- 63. Roe DR, Cheatham TE III. PTRAJ and CPPTRAJ: Software for processing and analysis of molecular dynamics trajectory data. J Chem Theory Comput. 2013;9:3084–3095. [DOI] [PubMed] [Google Scholar]
Associated Data
This section collects any data citations, data availability statements, or supplementary materials included in this article.
Supplementary Materials
Appendix S1 Supporting Information